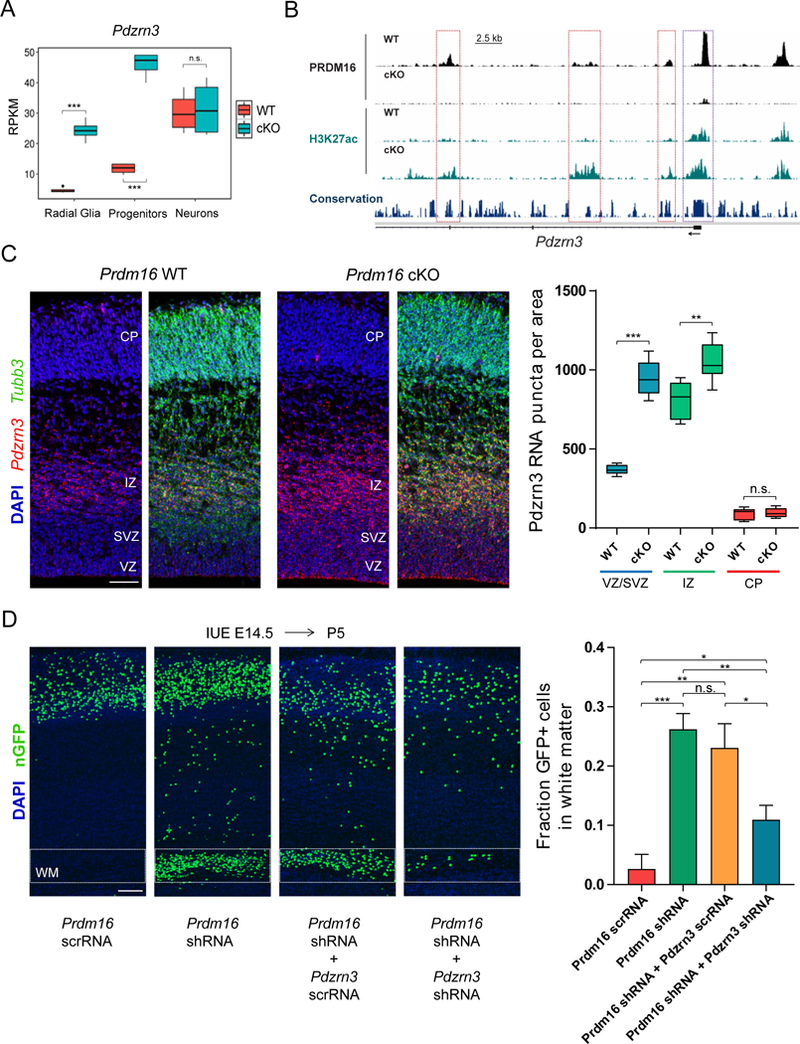
Figure 7. PRDM16 silencing of Pdzrn3 controls cortical neuron position.

(A) Pdzrn3 expression at three stages of differentiation in WT and Prdm16 cKO cells.
(B) Genome tracks showing regions with differential H3K27ac enrichment near the transcription start site of Pdzrn3. Significant changes in H3K27ac (FDR < 0.05) are indicated at enhancers (red boxes) and promoter (purple box).
(C) Pdzrn3 expression was analyzed by FISH in E15.5 WT and Prdm16 cKO cortex. The number of Pdzrn3 RNA puncta per area (104 μm2) was quantified in the ventricular/subventricular zone (VZ/SVZ), intermediate zone (IZ) and cortical plate (CP) (n=3).
(D) Analysis of cell migration after single knockdown (KD) of Prdm16 or double KD of Prdm16 and Pdzrn3. After E14.5 IUE the fraction of GFP+ cells in the white matter (WM) was quantified at P5 (n=3, Prdm16 scrRNA; n=4, Prdm16 shRNA; n=5, Prdm16 shRNA and Pdzrn3 scrRNA; n=7, Prdm16 shRNA and Pdzrn3 shRNA).
Data represents mean ± SE; statistical analysis is unpaired Student’s t test (*p < 0.05, **p < 0.01, *** p < 0.001; n.s., not significant). Scale bars: 50 μm (C), 100 μm (D).
