Figure 4. Def produced by immune tissues specifically targets tumour cells.
(A-A’’) DAPI (blue), anti-Dcp1 (green) and anti-HA antibody (red) staining of dlg40.2 mutant tumour from larvae overexpressing a def-HA construct in the fat body and the trachea (dlg40.2;lpp >UAS-def-HA). B-B’’, Enlargement of inset from A’’ (white outline) showing Dcp1 (B), Def-HA (B’) and merged channels (B’’). C-C’, DAPI (blue), anti-Dcp1 (green) and anti-HA antibody (red) staining of dlg40.2 heterozygous wing disc from larvae overexpressing def-HA (dlg40.2/FM7;lpp >UAS-def-HA). D-D’’, dlg40.2 mutant tumour stained with DAPI (blue), anti-Def (red) and anti-Dcp1 (green) antibodies. E-E’’, Enlargement of inset from D’’ (white outline) showing Dcp1 (E), Def (E’) and merged channels (E’’). F, Quantification of colocalization between Def and Dcp1 staining (n = 10). G-G’, wild type (w1118) wing imaginal disc stained with DAPI (blue), anti-Def (red) and anti-Dcp1 (green) antibodies. H-H’’, High-resolution imaging of a single dying tumour cell stained with DAPI (blue), anti-Def (red) and anti-Dcp1 (green) antibodies. A, C, D, G, Scale bars = 50 μm; B, E, Scale bars = 10 μm; H, Scale bar = 2.5 μm. Statistical analysis: F, Student t-test, **p=0.0093.

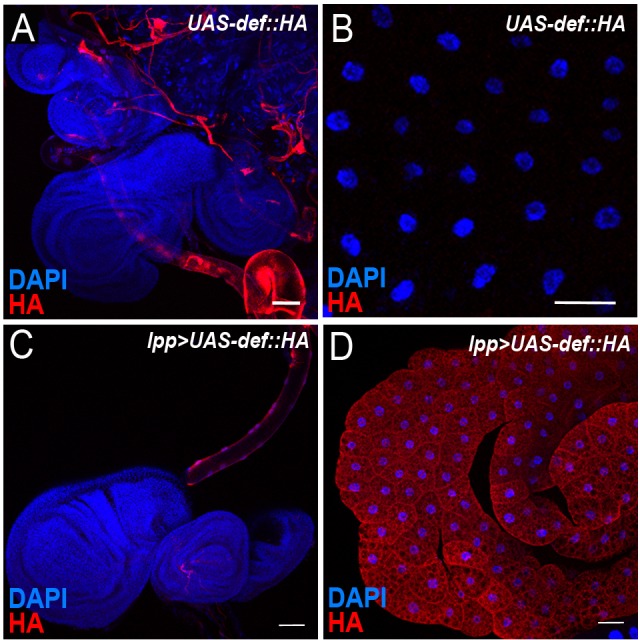
Figure 4—figure supplement 1. Characterisation of UAS-def-HA expression.