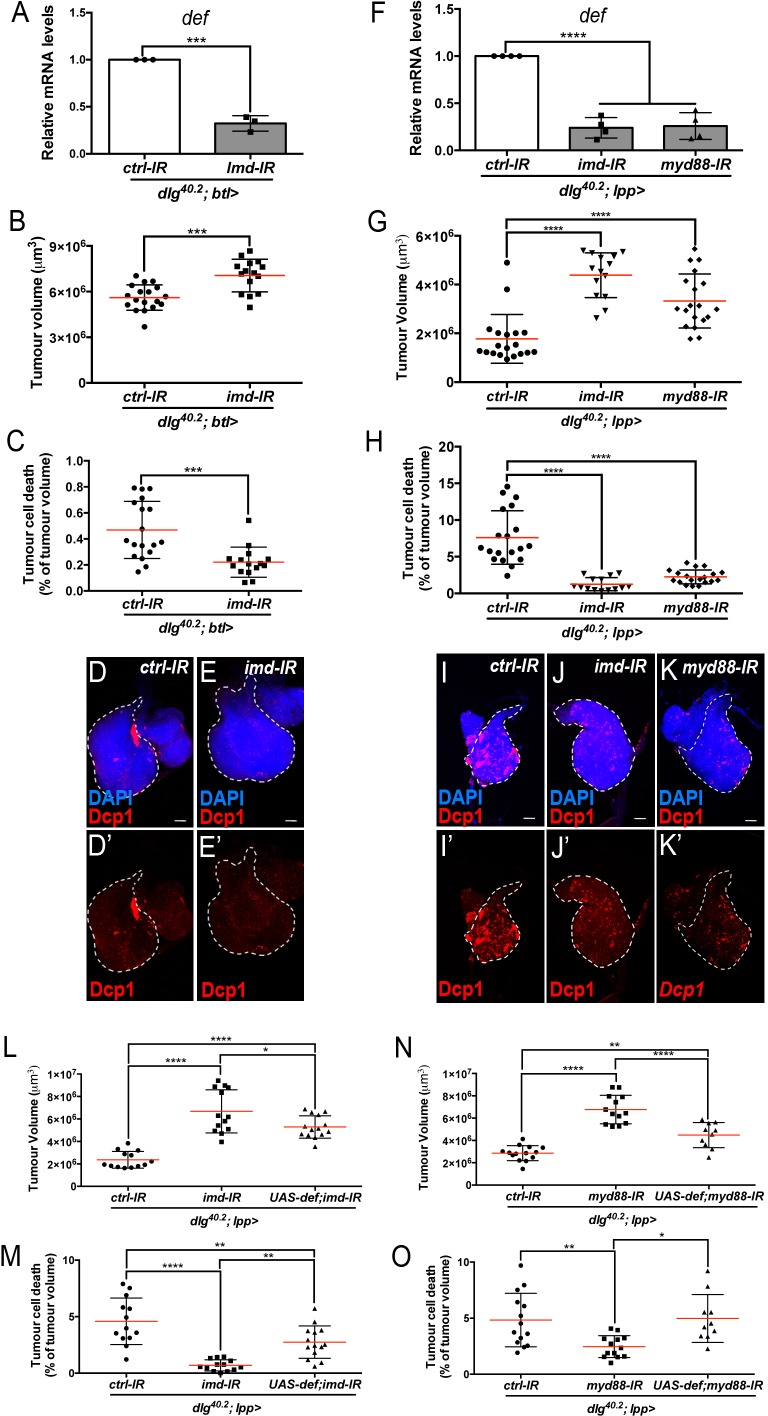
Figure 6. Imd and Toll pathway activation are required in the trachea and the fat body to promote Defensin-dependent tumour cell death.
(A) RT-qPCR analysis of def expression from dlg40.2 mutant larvae (dlg40.2;btl>) expressing a ctrl-IR or imd-IR in the trachea (n = 3). B-E’, Quantification of TV (B) and TCD (C) from dlg40.2 mutant larvae (dlg40.2;btl>) expressing a ctrl-IR (n = 18) or imd-IR (n = 15) in the trachea and representative immunofluorescence images of tissues quantified stained with DAPI (blue) and anti-Dcp1 antibody (red) (D–E’). F, RT-qPCR analysis of def expression from dlg40.2 mutant larvae (dlg40.2;lpp>) expressing a ctrl-IR, an imd-IR or a myd88-IR in the fat body. G-K’, Quantification of TV (G) and TCD (H) from dlg40.2 mutant larvae (dlg40.2;lpp>) expressing a ctrl-IR, an imd-IR or a myd88-IR in the fat body and representative immunofluorescence images of tissues quantified (I–K’). L-O, Quantification of TV (L, N) and TCD (M, O) from dlg40.2 mutant larvae (dlg40.2;lpp>) expressing a ctrl-IR, an imd-IR alone or in combination with a UAS-def in the fat body (L, M) and from dlg40.2 mutant larvae (dlg40.2;lpp>) expressing a ctrl-IR, a myd88-IR alone or in combination with a UAS-def in the fat body (N, O). Scale bars = 50 μm. Statistical analysis: A, Student t-test, A, ***p=0.0001; B, C, Mann-Whitney test, B, ***p=0.0003, C, ***p=0.0002; F, G, H, L-O, One way ANOVA, *p<0.05, **p<0.01, ****p<0.0001.

