. 2019 Jul 30;8:e45061. doi: 10.7554/eLife.45061

Figure 7. TNF is required for PS exposure and Defensin-driven tumour cell death.

(A-A’’) DAPI (blue), Annexin V (green) and anti-Def (red) staining of dlg40.2 mutant tumours. (B-B’’) Enlargement of inset from A’’ (white outline) showing Annexin V (B), Def (B’) and merged channels (B’’). (C) Quantification of colocalisation between Def and Annexin V staining (n = 18). (D) RT-qPCR analysis showing def expression in wild-type, dlg40.2 or dlg40.2;egr3 mutants. (E- G) Annexin V (green) and DAPI (blue) staining of wing imaginal discs from larvae of the indicated genotypes. (H, I) Annexin V (green) and DAPI (blue) staining of wing imaginal discs from dlg mutant larvae (dlg40.2,hml>) expressing a ctrl-IR (n = 5) or an egr-IR (n = 9) in the haemocytes. (J) Quantification of Annexin V signal on tumours from the corresponding genotypes. (K) Quantification of TCD upon PBS (ctrl) or Def injection in wild-type (w1118, ctrl: n = 10, Def: n = 14), dlg40.2 (ctrl/Def: n = 18) or dlg40.2;egr3 (ctrl: n = 20, Def: n = 13) mutant larvae. (L) A model for Def antitumoural activity. A, E-I, Scale bars = 50 μm; B, Scale bars = 20 μm. Statistical analysis: C, Student t-test, ****p<0.0001; D, One way ANOVA, *p<0.05; J, Mann-Whitney test, ***p=0.001; K, Two way ANOVA (only relevant significant statistics are indicated), *p<0.05.

Figure 7.

Figure 7—figure supplement 1. Def-HA does not associate to PS-negative egr-mutant tumours.

Figure 7—figure supplement 1.

(A-B) DAPI (blue) and anti-HA antibody (red) staining showing expression of Def-HA in trachea (A) and fat body (B) of dlg40.2;egr3;lpp-gal4 >UAS def-HA larvae. C-C’, DAPI (blue), anti-Dcp1 (green) and anti-HA antibody (red) staining showing absence of Def-HA on tumours of dlg40.2;egr3;lpp-gal4 >UAS def-HA larvae. Scale bars = 50 μm.
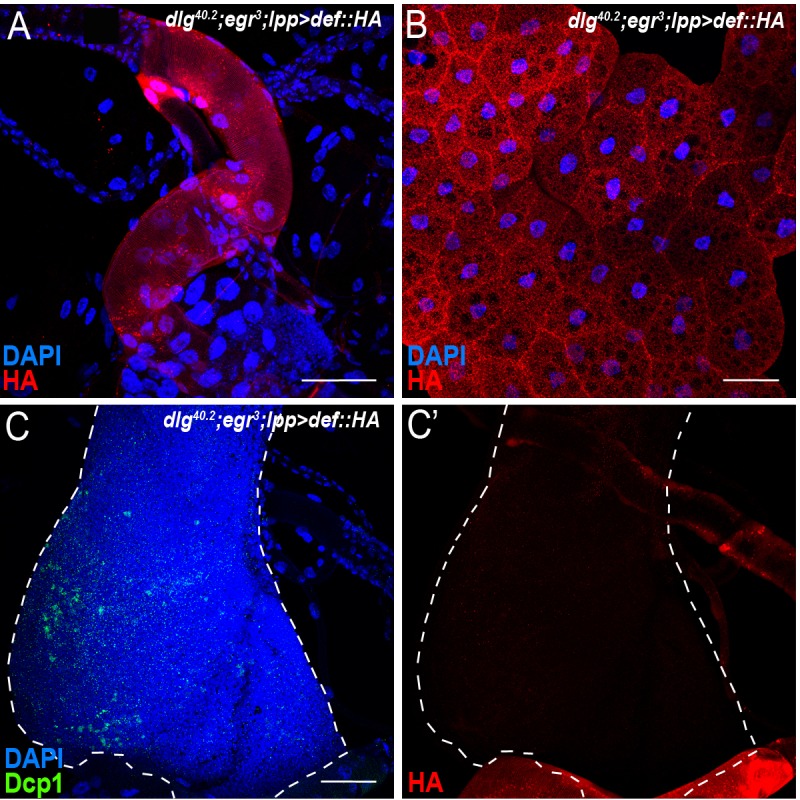
Figure 7—figure supplement 2. TNF signalling activation does not require functional def.

Figure 7—figure supplement 2.

(A-C’) DAPI (white), anti-Dcp1 (red) and anti-Matrix metalloproteinase 1 (Mmp1, a reporter of JNK pathway activation, green) antibody staining of wing disc from dlg40.2, dlg40.2;defsk3 and dlg40.2;defsk4 mutant larvae. D-F’, DAPI (white), Annexin V (green) and anti-Dcp1 (red) staining of tumours from dlg40.2, dlg40.2;defsk3 and dlg40.2,imd1 mutant larvae. Scale bars = 50 μm.
Figure 7—figure supplement 3. scrib mutant tumours expose PS in a TNF-dependent manner and are sensitive to Def action.

Figure 7—figure supplement 3.

(A-A’) DAPI (blue), anti-Dcp1 (red) and Annexin V (green) staining of scrib1 mutant tumours. (B-B’) DAPI (blue), anti-Dcp1 (red) and Annexin V (green) staining of egr3;scrib1 double mutant tumours. (C-C’’) scrib1 mutant tumour stained with DAPI (blue), anti-Dcp1 (green) and anti-Def (red) antibodies. D-D’’, Enlargement of inset from C’’ (white outline) showing anti-Dcp1 (D), anti-Def (D’) and merged (D’’) channels. E, F, Quantification of tumour volume (E) and tumour cell death (F) in wing imaginal discs from scrib1 (n = 19) and defsk3;scrib1 (n = 18) mutant larvae. G-H’, representative immunofluorescence images of tissues quantified in E, F. A, B, C, G, H, Scale bars = 50 μm; D, Scale bar = 10 μm. Statistical analysis: E, F, Mann-Whitney test, E, **p=0.0015, F, ***p<0.0001.