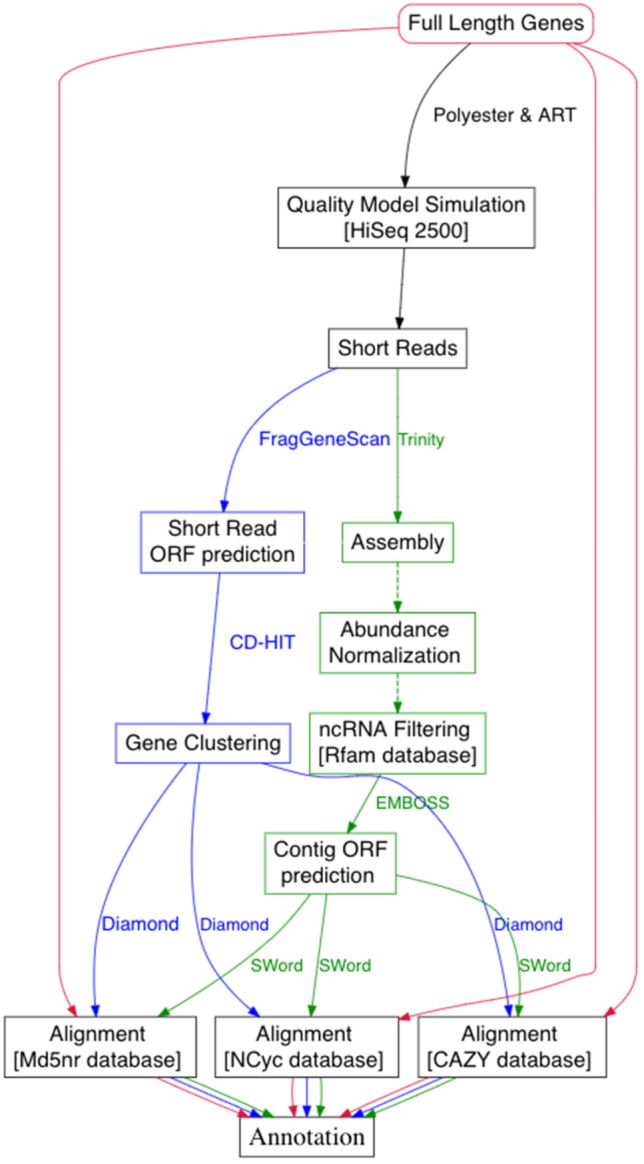
Figure 1:

Flow chart illustrating the evaluation and benchmarking scheme used for the comparison of alternative approaches. Red path indicates the full-length genes workflow, green indicates the steps in the assembly-based workflow CoMW, and blue indicates the steps in the assembly-free approach.
