Abstract
Giardia intestinalis was included in the World Health Organization’s Neglected Disease Initiative in 2004 as it may range from asymptomatic to chronic or severe diarrhoea and chronic disorders post-infection. The present study aimed to find out the rate of sole infection of G. intestinalis and co-infection of this with other protozoan parasites among the inhabitants of Barak Valley region of Southern Assam by conventional and molecular detection. A total of 1168 samples were collected from different groups of individuals, all the collected samples were subjected to microscopy after specific staining by Lugol’s iodine solution, Trichrome staining and modified ZN staining procedures. Microscopically positive samples were further confirmed by PCR using specific primer sets. Of the total no. of samples, 267 (22.85%) were positive by PCR for G. intestinalis with a little higher rate of infection in female (24.06%) (OR = 1.2192, CI = 0.9262 to 1.6049) than male (21.27%). The rate of infection is comparatively higher (25.93%) in the age group of 0-5 years (OR = 1.9149, CI = 1.2558 to 2.9200). In 196 samples G. intestinalis co-existence was observed and detected by PCR with some other protozoan parasites like Entamoeba spp., Cryptosporidium spp. and Blastocystis spp. The rate of infection was higher (31.96%) among the participants who collected water from river. Least of the participants showed diarrhoeal symptoms (18.18%) but majority (28.45%) complained for having abdominal cramps (OR = 1.3402, CI = 0.8815 to 1.7855). Among the human infective assemblages, assemblage specific molecular detection revealed the rate of infection of assemblage B was comparatively higher (60.30%) than assemblage A.
Keywords: Giardiasis, Gastrointestinal, Prevalence, Assemblages, Epidemiology
Introduction
Giardia intestinalis is one of the most common protozoan parasites that causes diarrhoea and other gastrointestinal problems in developing country as well as in the industrial country. The disease caused by G. intestinalis is considered as a zoonotic disease indicating transmission between human and animal. Six Giardia species have been distinguished based on both morphological and molecular traits. Among which G. intestinalis causes giardiasis to human and other mammals. Thus giardiasis is considered as zoonotic disease (Fang and Xiao 2011). By molecular analysis, till to date eight different assemblages are recognized within the G. intestinalis species complex which include assemblage A-H (Lasek‐nesselquist et al. 2009) where assemblage A and B infect a large array of mammals including humans (Monis 1998; Easow et al. 2005; Lebbad et al. 2008). There are two distinct stages in the life cycle of G. intestinalis. These stages are cyst and trophozoite. The cyst is the infective stage which can persist in the environment up to several months. The size of the cyst is 10 μm × 8 μm with four nuclei, four median bodies and four axonema (Ford 2005). Upon excystation, each cyst produces two trophozoite that is pear-shaped, bilaterally symmetrical and with four flagellum and two nucleus of 10–12 µm length and 5–7 µm width. The cyst enters in the human body with contaminated food, water or surface (Dutta 1965).
Intestinal parasitic infections have been an important public health problem in the tropical countries, particularly in the developing countries like India. The prevalence varies between 2% and 5% in industrialized countries and may exceed 30% in developing countries. In 1988, the World Health Organization (WHO) estimated that around 280 million people are annually infected with Giardia spp. in Asia, Africa and Latin America (Molina et al. 2007).
The prevalence of this parasite is increasing day by day due to lack of knowledge of the molecular mechanism of this disease (Sethi et al. 1999). The disease is usually self-limiting and asymptomatic infections are common (Flanagan 1992). The potential health risk to humans from gastrointestinal parasites remains a significant problem throughout the world (Schantz et al. 1994). Although in recent years molecular investigation on Giardia has increased, no data are available from North East India in this regard with the single exception of work of Rebecca Justin Traub, 2003 (Ph.D. work) from Phulbari and Addabari tea estate in Assam. Whereas, there are several cases that indicate to the infection of different GI parasites in the local hospital or in community level. This study is significant because there is no report indicating the prevalence of this parasite in this study area. The report should be of interest to readers in the areas of Barak Valley zone of Assam. Hence, hospital-based, community-based and referral center based thorough study is needed to determine the molecular prevalence and diagnostic yield of human fecal samples irrespective of all ages.
Despite being detected in a large proportion of patients through recent molecular-based studies, the possible sources of gastrointestinal pathogens still remain unclear in this region of North East India. However, this thorough study aiming at simultaneous detection of gastrointestinal protozoan parasites through PCR will help to overcome problems in specific detection of protozoan diarrhoeal diseases, so as to cater to the health problems with specific drugs in this region for the benefit of people and public health welfare. In this study investigation on the co-existence of Cryptosporidium spp., Giardia spp., Entamoeba spp., and Blastocystis spp., in samples obtained from clinical patients and community level participants will help to elucidate possible routes of transmission of these emerging pathogens to human as understanding the spread of diarrhoeal pathogens and its transmission from environmental sources to human is essential for disease control and prevention.
Materials and methods
Study design
Through a cross-sectional study, a total no. of 1168 samples were collected from the month of September, 2013 to December, 2016.
The sample size is 1168, calculated by using the formula for cross sectional study (Charan and Biswas 2013; Lwanga et al. 1991) which is as follows:
where q = 1 − p.
Since there are no previous available studies on this topic, 50% of prevalence has been considered i.e., p = 0.5 (this would provide the maximum sample size), d = absolute precision i.e. = 0.028 (< 3% error), which may be decided by the researcher, z = 1.96 at 95% CI, p = proportion of + ve individuals, Therefore, n = 1168.
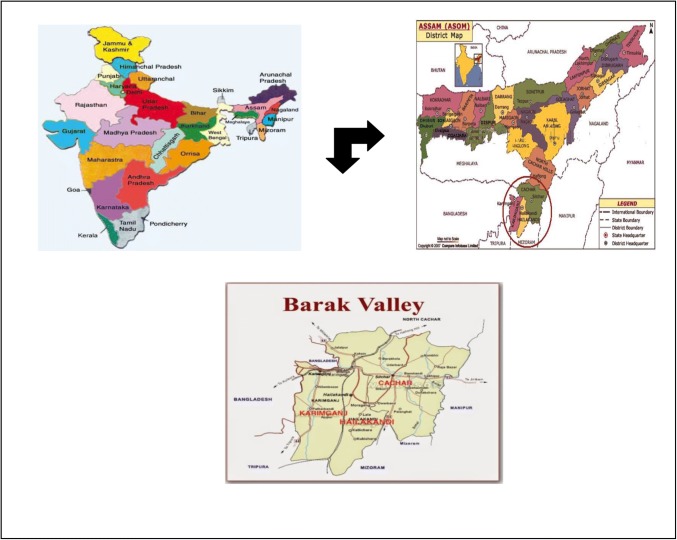
The study was carried out in the southern Assam, Barak Valley comprising of three districts (Cachar, Hailakandi and Karimganj). Samples were collected on the basis of sex, age group, drinking water sources and symptoms of diarrhoea. Our target population comprised children without and with diarrhoea of the age between 0 and 12 years and above, age 12–18 years and adults those who have been referred to Medicine Department and Paediatric Department of Silchar Medical College, Assam were also included. Samples were also collected from tea garden inhabitants of Cachar, Karimganj and Hailakandi districts covering entire Barak Valley, Southern Assam. Study was also carried out at community level including the rural and urban areas of the above-mentioned areas under study (Fig. 1).
Fig. 1.
Map of sample collection sites
Consent and ethical consideration
With the consent of each subject all the samples were collected on the basis of questionnaires. In case of minor or infant participants, consents were provided by the guardian/parents. Before commencement of the study, all the protocols were reviewed by Institutional Ethical Committee of Gurucharan College, Silchar, Assam and Silchar Medical College and Hospital, Silchar, Assam.
Collection of stool samples
All the samples were collected in a plastic disposable container. The samples were collected on the following day within 2–3 h of defecation and delivered to the laboratory and divided into two aliquots. One aliquot of each of the fecal samples was used immediately for direct microscopy and serological test for the qualitative identification of Giardia spp. (RIDASCREEN®Cryptosporidium/Giardia Combi) and the second aliquot was stored at − 20 °C for PCR assay. Samples from distant areas were collected in duplicate. One aliquot was preserved in 10% aqueous formalin for microscopy upon arrival in the laboratory and the rests were brought to the laboratory in unpreserved condition by maintaining temperature of approximately 4 °C.
Microscopy
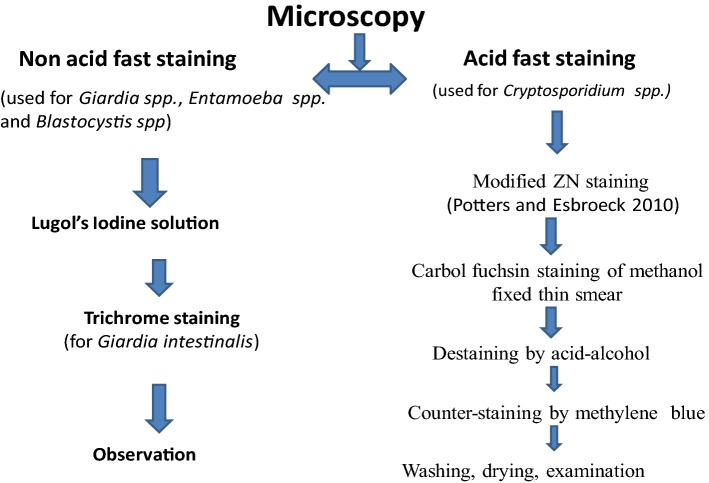
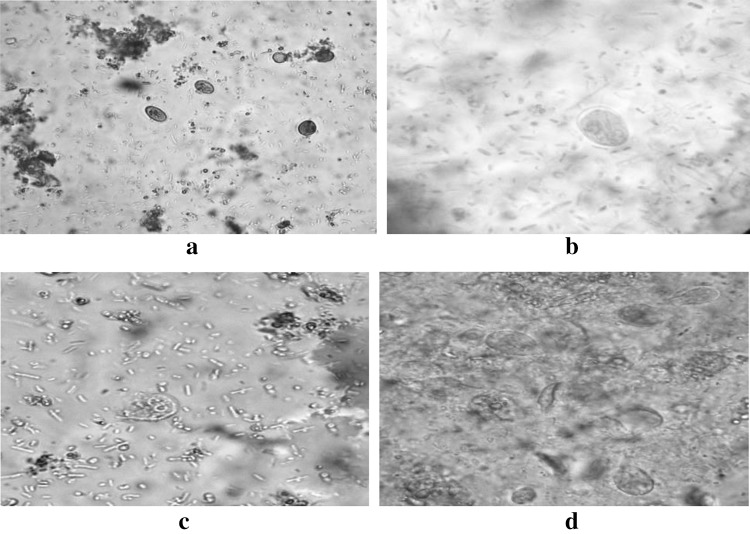
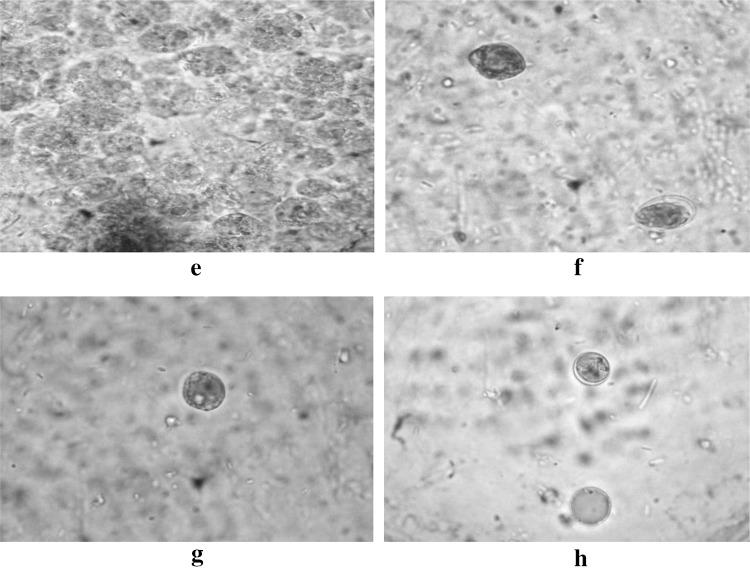
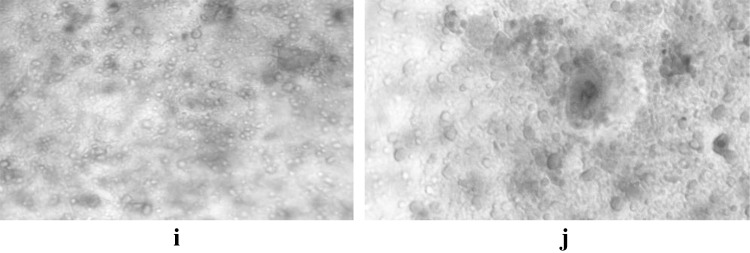
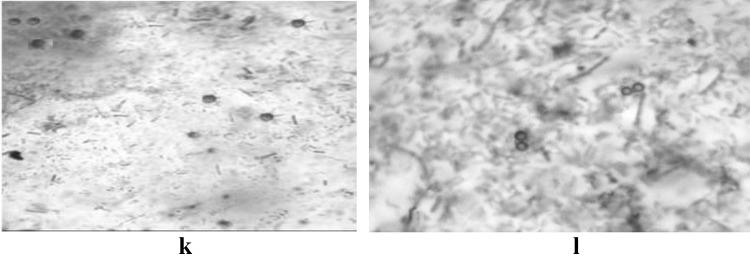
As shown in Fig. 2, for the detection of cyst and trophozoite of G. intestinalis, all the samples were concentrated by sedimentation technique and were examined in Lugol’s-stained wet mounts (Fig. 3). At the same time, all samples were screened in the same slides stained in Lugol’s iodine for the presence of Entamoeba, Blastocystis etc. (Fig. 4) and were observed at 40× and then confirmed in oil immersion at 100× magnification under a phase contrast microscope (CX31, Japan). For stained preparation, Trichrome stain was used for morphological identification (Fig. 5). For the detection of Cryptosporidium spp. modified ZN staining (Potters and Van Esbroeck 2010) was used (Fig. 6).
Fig. 2.
Flow chart of microscopic analysis
Fig. 3.
a, b Cysts of Giardia spp. in Lugol’s Iodine solution. Microscopy (40× and 100×) in oil immersion showing nucleus and cyst wall; c, d Trophozoite of Giardia spp. in Lugol’s Iodine solution showing flagellum and nucleus
Fig. 4.
e, fEntamoeba spp. in Lugol’s Iodine solution in oil immersion (100×),F also shows the co-existence of Entamoeba spp. and) Cysts of Giardia spp. in same field; g, hBlastocystis spp. in Lugol’s iodine solution. Both the microscopic image is in oil
Fig. 5.
i, j Cysts of Giardia spp. in Trichrome stain in oil immersion (100×)
Fig. 6.
k, l Oocysts of Cryptosporidium spp. in modified ZN stain
Serological test
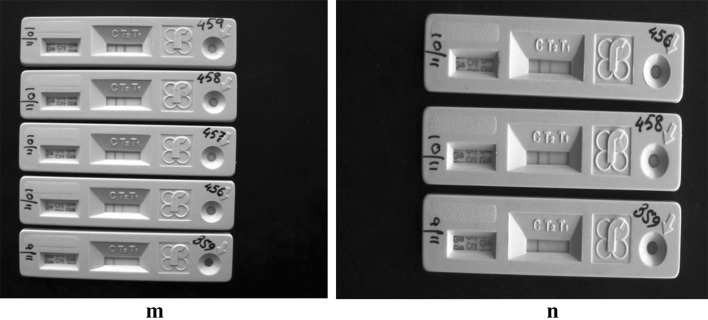
The G. intestinalis antigen in the sample was distinguished by microwell ELISA kit according to the manufacturer’s instruction (RIDASCREEN®Cryptosporidium/G. intestinalis Combi, Article No.: C1121) (Fig. 7).
Fig. 7.
m, n image of ELISA kit, detecting the Giardia intestinalis positive samples
Extraction of DNA
DNA was extracted from cysts using Nucleo-pore Stool DNA Mini Kit (Genetics Biotech Asia Pvt. Ltd) according to the manufacturer’s instruction. The eluted DNAs were quantified by spectrophotometer (BioPhotometer plus, Eppendorf) and stored at −20 °C for further use.
PCR assay for Giardia and co-infecting parasite detection
All the microscopically positive samples as well as positive by immune assay were further confirmed by single and nested PCR using specific primer as mentioned in Table 1. All the PCR amplifications were performed in a final volume of 20 μl with approximately 100 mg of template DNA, 1 μM of each primer, 1X PCR buffer with 2.5 mM MgCl2, 1X BSA, 0.2 mM dNTPs, and 1U of Taq DNA Polymerase (Thermo scientific, Wattham, USA) in the thermal cycler (Bio-Rad Laboratories, Hercules, CA). Further the amplicons from PCR were confirmed by their expected amplicon size (Table 1) through gel electrophoresis.
Table 1.
List of the primer used in this study
| Primer name and sequence | Amplicon size (bp) | Annealing temperature (°C) | References |
|---|---|---|---|
| Giardia intestinalis 18s rRNA | 350 | 67 | Rai et al. (2005) |
| F:AGCCGGACACCGCTGGCAACC | |||
| R: CGGCTGCTGGCACCAGACCTT | |||
| Giardia intestinalis tpi | 605 | 50 | Sulaiman et al. (2003) |
| External | |||
| F: AAATIATGCCTGCTCGTCG | |||
| R: CAAACCTTITCCGCAAACC | |||
| Giardia intestinalis tpi | 503 | 50 | Sulaiman et al. (2003) |
| Internal | |||
| F: CCCTTCATCGGIGGTAACTT | |||
| R: GTGGCCACCACICCCGTGCC | |||
| Giardia intestinalis gdh | 458 | 56 | Feng and Xiao (2011) |
| F:TCAACGTCAACCGCGGCTTCCGT | |||
| R: GTTGTCCTTGCACATCTCC | |||
| Giardia intestinalis Assemblage A specific | 326 | 58 | Vanni et al. (2012) |
| F: TGCTTCGGGGCGCATGCA | |||
| R: CAGGTAGCAGAGAATCCCTCG | |||
| Giardia intestinalis Assemblage B specific | 347 | 58 | Vanni et al. (2012) |
| F: ATGTGTCAGTGTGACAGTAACGT | |||
| R: GTGACTGTGCCGTTGAGGCAGT | |||
| Entamoeba histolytica | 439 | 55 | Parija and Khairnar (2007) |
| External:- | |||
| F: TAAGATGCACGAGAGCGAAA | |||
| R: GTACAAAGGGCAGGGACGTA | |||
| Internal:- | |||
| F: AAG CAT TGTTTCTAGATCTGAG | |||
| R: AAG AGG TCT AAC CGA AAT TAG | |||
| Cryptosporidium spp. | 825 | 55 | Xiao et al. (1999) |
| External:- | |||
| F:TTCTAGAGCTAATACATGCG- | |||
| R:CCCTAATCCTTCGAAACAGGA- | |||
| Internal:- | |||
| F:GAAGGGTTGTATTTATTAGATAAAG | |||
| R:AAGGAGTAAGGAACAACCTCCA | |||
| Blastocystis spp. | 462 | 55 | Yoshikawa et al. (2000) |
| F:TCTTGCTTCATCGGAGTC | |||
| R:CCTTCTCGCAGTTCTTTATC |
Purification of PCR product
The expected DNA band was purified using commercial purification kit for further downstream process. Purification helps to remove some inhibitors that may cause problem in PCR or in DNA sequencing. A single uniformly visualized band was purified using a QIAquick Gel Extraction kit (Qiagen, Germany) according to the manufacturer’s instructions.
DNA sequencing
The positive amplicons of Giardia were sequenced directly using their respective primers in ABI 3500 Genetic analyzer (Applied Biosystems Inc., CA, USA). For further validation, all the obtained sequences were subjected to search homology using nucleotide Blast (Blastn) available in National Centre For Biotechnological Information (http://www.ncbi.nlm.nih.gov). Sequences were submitted in GenBank.
Statistical analysis
All the collected data were statistically analyzed using statistical software SPSS version 16.0 (SPSS, Chicago, IL, USA). By univariate logistic regression analysis odds ratio (OD) and confidence interval (CI) were computed.
Phylogenetic analysis
The evolutionary history was inferred using the Neighbor-Joining method using kimura -2 parameter in the software MEGA-4. The gdh loci is used for phylogenetic analysis.
Result
Microscopy
Wet mounts preparation (Lugol’s iodine)
All samples were screened by wet mount using Lugol’s iodine solution in which 258 samples were found to be positive for G. intestinalis (Table 2). By this staining procedure, some other protozoan parasites like Entamoeba spp., Blastocystis spp. etc.were also initially screened out (Table 8). The cysts of G. intestinalis measured about 10–12 μm in length and 4–6 μm in width.
Table 2.
Result of comparison of positive samples of two different staining techniques
| Total no of specimen | Positive in Lugol’s iodine solution | Positive in Trichrome stain |
|---|---|---|
| 1168 | 258 | 258 |
Table 8.
Rate of mixed infection of Giardia intestinalis with other parasites
| Name of Parasite | Total no. of infection | Total % of infection | Total no. of mixed infection |
|---|---|---|---|
| Giardia intestinalis + Entamoeba spp. | 23 | 11.73 | 196 |
| Giardia intestinalis + Cryptosporidium spp. | 34 | 17.35 | |
| Giardia intestinalis + Blastocystis spp. | 21 | 10.71 |
Serological detection (ELISA)
The screening of total 1168 no of samples by ELISA were demonstrated about the total no of Giardia positive samples were 264 which were comparatively higher than that of the result of microscopic screening.
Molecular detection (PCR)
By the molecular detection based on PCR, using specific primer sets, total no of 267 samples were confirmed for the sole infection of G. intestinalis. The molecular screening of this organism was performed on the basis of particular molecular marker loci or genes. Three molecular markers or genes were selected for the genotypic characterization of G. intestinalis which are 18s rRNA, gdh and tpi.
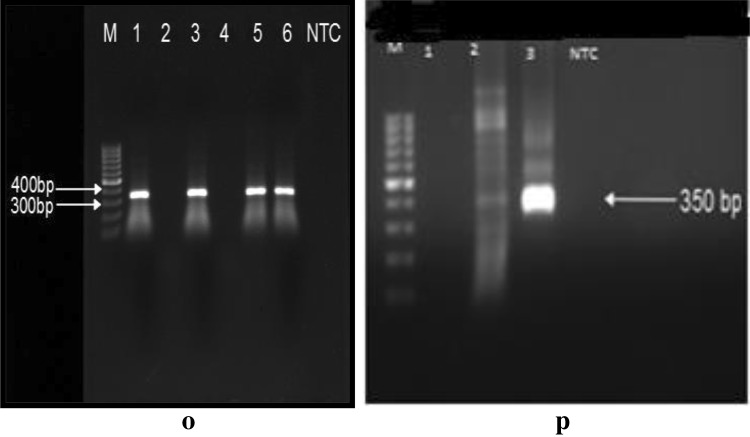
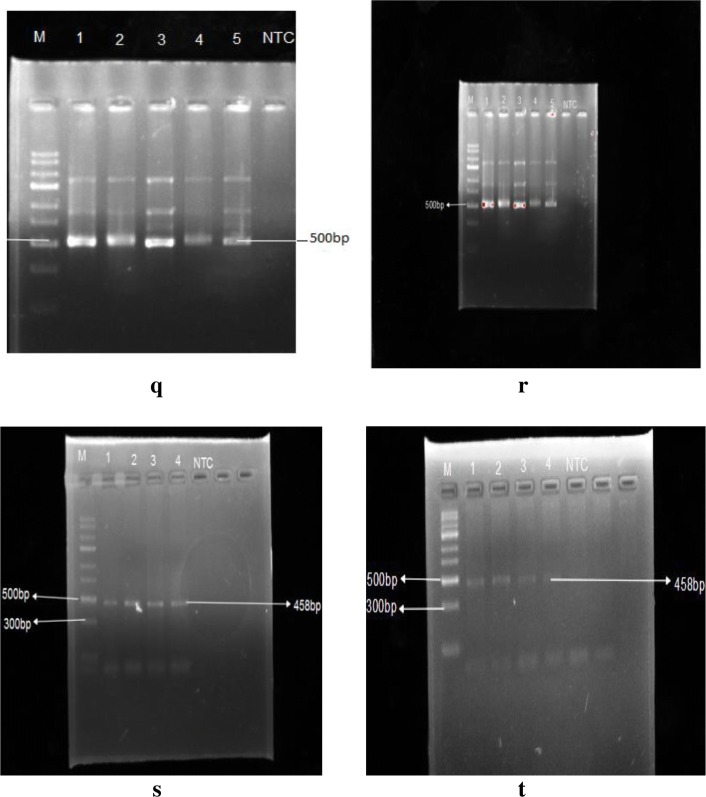
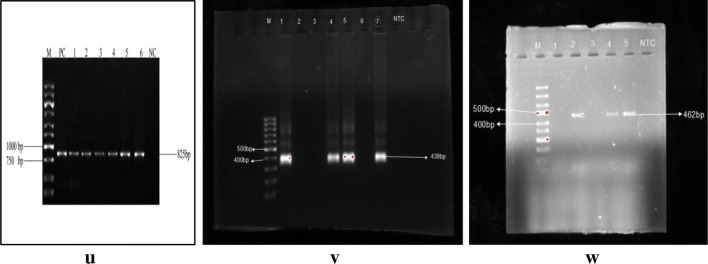
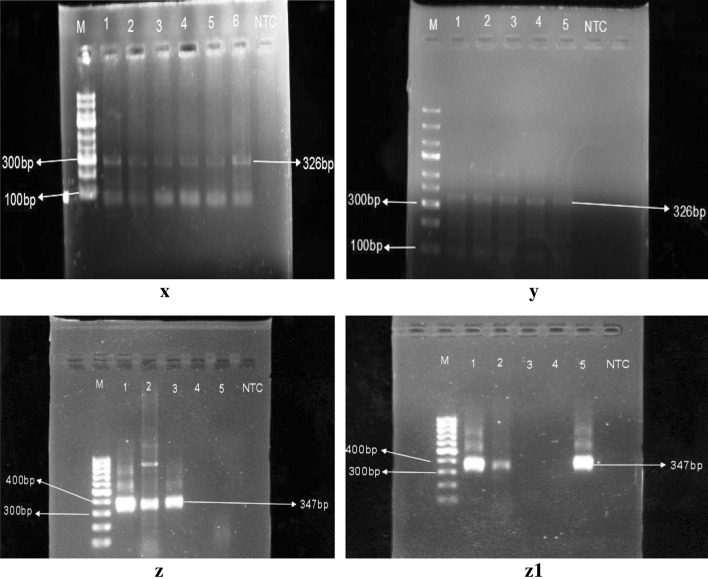
Amplification-based on 18s rRNA generated a product of 350 bp (Fig. 8). The product size were respectively 605 bp and 503 bp bassed on tpi external and internal primer (Fig. 9 q and r). Amplification based on gdh loci generated 458 bp product (Fig. 9 s and t, whereas amplification based on assemblage specific primers generated 326 bp and 347 bp sized products respectively for assemblage A and assemblage B (Fig. 11).
Fig. 8.
o, p Representative gel image of positive samples using18 s rRNA specific primer set. M stands for marker lane and NTC indicates the lane with negative control. Lane 1, 3, 5, 6 (o) and lane 3 (p) indicates positive samples
Fig. 9.
q, r Representative PCR amplification using Giardia intestinalis using tpi primer pairs. s, t Representative PCR amplification using Giardia intestinalis using gdh primer pairs
Fig. 11.
u, v, w Representative PCR assays of Cryptosporidium spp., Entamoeba spp. and Blastocystis spp. respectively
Sensitivity and specificity of the diagnostic tests
Microscopic study results slightly differed from the results of serological detection and molecular detection (Table 3). In serological detection technique, 264 samples were found to be positive among the total collected samples, whereas, molecular detection technique indicated 267 samples as positive for G. intestinalis (Table 4). Sensitivity and specificity analysis indicated with the 100.00% positive predictive value and 99.67% negative predictive value showing the sensitivity and specificity respectively 98.88% and 100.00%.
Table 3.
Result of microscopic, serological and PCR analysis
| Study group | Total no. of specimen | Serologically positive specimen | PCR positive specimen | Microscopic positive specimen | |
|---|---|---|---|---|---|
| Sex | Male | 503 | 106 | 107 | 102 |
| Female | 665 | 158 | 160 | 156 | |
| Age | 0–5 years | 318 | 97 | 98 | 94 |
| 5–12 years | 311 | 67 | 66 | 63 | |
| 12–18 years | 331 | 65 | 67 | 66 | |
| Adults | 208 | 35 | 36 | 35 | |
| Source of drinking water | Municipality supply water | 501 | 87 | 89 | 85 |
| Tube well | 207 | 33 | 31 | 29 | |
| River | 460 | 146 | 147 | 144 | |
| Symptoms | Diarrheal | 363 | 65 | 66 | 63 |
| Abdominal pain | 383 | 108 | 109 | 103 | |
| Asymptomatic | 422 | 93 | 92 | 92 | |
Table 4.
Sensitivity and specificity of Diagnostic techniques
| Microscopy | Total number | |||
|---|---|---|---|---|
| Positive | Negative | |||
| ELISA (reference method) | Positive | 258 (TP) | 06 (FN) | 264 TInfected |
| Negative | 00 (FP) | 904 (TN) | 904 TUninfected | |
| Total Number | 258 TTest Positive | 910 TTest Negative | 1168 Total Number | |
| Sensitivity (%) [95% CI] |
97.73% 95.12–99.16% |
|||
| Specificity (%) [95% CI] | 100.00% (99.59–100.00%) | |||
| Negative predictive value (%) [95% CI] | 99.34% 98.56–99.70% | |||
| Positive predictive value (%) [95% CI] | 100.00% | |||
TP positive in both microscopy and ELISA; FP positive in microscopy but not in ELISA; FN negative in microscopy but positive in ELISA; TN negative in both ELISA and microscopy
Socio-demographic analysis of the studied population
Of the total collected samples, 665 samples were collected from female individuals and 503 samples were collected from male individuals. Among the female participants, 160 samples were confirmed as positive for G. intestinalis infection by PCR (Figs. 8, 9) showing the prevalence rate of 24.06% (p = 0.1575) on the other hand 107 samples were found to be positive in males showing the prevalence of 21.27% with the odds ratio (OR) = 1.2192 at 95% CI (0.9262 to 1.6049).
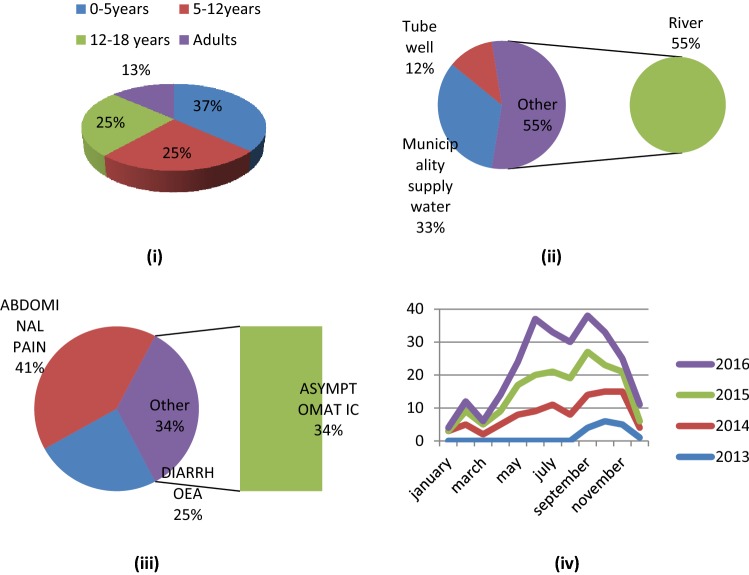
Samples were collected considering four age groups. A total no of 318 samples were collected from the children within the age groups of 0–5 years of which 98 samples were found positive showing the prevalence rate of 27.22% (OR = 1.9149, CI = 1.2558 to 2.9200). 311 samples were collected from the age groups of 5-12 years and 66 (21.22%) were found to be positive by PCR with the OR = 1.5915 (CI = 1.0175 to 2.4893). 331 samples were collected from the children within the age groups of 12–18 years and 67 (20.24%, OR = 1.4381, CI = 0.9222 to 2.2427) and the rest 240 samples were collected from adult individuals, i.e. within the age groups of > 18 where the rate of infection was about 17.80% (36). Among the subjects of different age groups, the age groups between 0 and 5 years, 5–12 years and 12–18 years had the comparatively higher rate of infection than the adults (Fig. 10i).
Fig. 10.
i Pie chart showing the rate of infection in different age group, 0-5 years = 98, 5-12 years = 66, 12-18 years = 67 and adult = 36. ii Pie chart showing rate of infection consuming different water source, consuming river water = 147, consuming municipality supply water = 89 and consuming tube well water = 31. iii Pie chart showing the symptoms of infection among the affected individuals, having abdomoinal pain = 109, diarrhoea = 66 and symptomless = 92. iv Line graph representing seasonal outbreak of Giardia intestinalis
Collected samples were also categorized separately on the basis of drinking water sources of the subjects. It was observed that the inhabitants of the particular study sites use three different sources to collect their drinking water which were—municipality supply water, tube well and river. 501 sample providers use municipality supplied water in which 17.76% (89) were found to be positive by PCR for Giardial infection (OR = 2.1741, CI = 1.6082 to 2.9391). Whereas, 207 subjects were dependent on tube well water having the infection rate of 14.97% (OR = 2.174 & CI = 1.7360 to 4.0954) (Fig. 10ii). 460 individuals collect their drinking water from the Barak river and showing the higher rate of infection than other two groups (31.96%) as shown in Table 5.
Table 5.
Logistic regression analysis of socio demographic factors associated with Giardia intestinalis among the inhabitants of Barak Valley inhabitants
| Study groups | Microscopy and PCR results | ODDS RATIO (OR) | Confidence interval (CI 95%) | P value | Total no. of specimen | |||||
|---|---|---|---|---|---|---|---|---|---|---|
| Only microscopic positive | Serological test positive | Only PCR positive | Rate of infection of PCR positive (%) | No. of negatives by PCR | ||||||
| Sex | Male | 102 | 106 | 107 | 21.27 | 446 | 1 | 0.9262–1.6049 | 0.1575 | 503 |
| Female | 156 | 158 | 160 | 24.06 | 547 | 1.2192 | 665 | |||
| Age | 0–5 years | 94 | 97 | 98 | 27.22 | 290 | 1.9149 | 1.2558–2.9200 | 0.0025 | 318 |
| 5–12 years | 63 | 67 | 66 | 21.22 | 235 | 1.5915 | 1.0175–2.4893 | 0.0417 | 311 | |
| 12–18 years | 66 | 65 | 67 | 20.24 | 264 | 1.4381 | 0.9222–2.2427 | 0.1090 | 331 | |
| Adults | 35 | 35 | 36 | 17.80 | 204 | 1 | 208 | |||
| Source of Drinking water | Municipality supply water | 85 | 87 | 89 | 17.76 | 412 | 2.1741 | 1.6082–2.9391 | < 0.0001 | 501 |
| Tube well | 29 | 33 | 31 | 14.97 | 176 | 2.6664 | 1.7360–4.0954 | < 0.0001 | 207 | |
| River | 144 | 146 | 147 | 31.96 | 313 | 1 | 460 | |||
| Symptoms | Diarrhoeal | 63 | 65 | 66 | 18.18 | 297 | 1 | 0.0932 | 363 | |
| Abdominal pain | 103 | 108 | 109 | 28.45 | 366 | 1.3402 | 0.9521–1.8864 | 383 | ||
| Asymptomatic | 92 | 93 | 92 | 21.80 | 330 | 1.2545 | 0.8815–1.7855 | 0.2079 | 422 | |
Considering the symptomology, 363 samples were collected from diarrhoeal patients of which in 66 cases (18.18%) were PCR positive for G. intestinalis. But the percentage of positive samples collected from the patients having abdominal cramps was about 28.45% and the rests were asymptomatic for any type of intestinal problem (Fig. 10iii).
The human intestinal parasite G. intestinalis though found to be prevalent throughout the year but during this course of study, it was little higher in pre-monsoon, monsoon and post-monsoon season especially from the month of May to October (Table 6). During the first year of study, the sampling began from the month of September, i.e. in the post monsoon season which little differed from the data obtained from the consecutive years. Whereas, in next course of study, the occurrences were almost nil in the winter season (Fig. 10iv).
Table 6.
Seasonal positive cases in four consecutive years of study
| Name of months | No. of positive cases in different month of the studied years | |||
|---|---|---|---|---|
| 2013 | 2014 | 2015 | 2016 | |
| January | – | 03 | 00 | 01 |
| February | – | 05 | 04 | 03 |
| March | – | 02 | 03 | 01 |
| April | – | 05 | 04 | 05 |
| May | – | 08 | 09 | 07 |
| June | – | 09 | 11 | 17 |
| July | – | 11 | 10 | 12 |
| August | – | 08 | 11 | 11 |
| September | 04 | 10 | 13 | 11 |
| October | 06 | 09 | 08 | 10 |
| November | 05 | 10 | 06 | 04 |
| December | 01 | 03 | 02 | 05 |
Molecular analysis revealed the distribution and prevalence of this protozoan parasite in three different districts under the Barak Valley region. The prevalence rate of Hailakandi district was relatively higher (24.28%) than the prevalence rate of Cachar (21.03%) and Karimganj district (23.91%) with the odd ratios 1.1368 and 1.1546 and p = 0.4235 and 0.3962 respectively (Table 7).
Table 7.
Prevalence of Giardia intestinalis in three Districts of Barak Valley zone
| Region | No. of screened samples | No. of positive samples | Prevalence | Odds ratio (OR) | Confidence interval (CI 95%) (%) | P value |
|---|---|---|---|---|---|---|
| Cachar | 466 | 98 | 21.03 | 1 | 0.8304–1.5563 | 0.4235 |
| Karimganj | 389 | 93 | 23.91 | 1.1368 | ||
| Hailakandi | 313 | 76 | 24.28 | 1.1546 | 0.8284–1.6093 | 0.3962 |
With the infection of G. intestinalis, there were several cases where co-existence of this parasite was also found with the other gastrointestinal protozoan parasites. A close association was observed with Entamoeba spp., Cryptosporidium spp., and Blastocystis spp.
The co-existing organisms were also confirmed by molecular analysis using amplification of genes which were genus-specific for the particular parasite Blastocystis spp. Of the total positive G. intestinalis, 196 samples were confirmed as having mixed infection of G. intestinalis with Entamoeba spp., Cryptosporidium spp., and Blastocystis spp. (Figs. 4, 6).
Of the total 196 mixed infected samples, 11.73% (23) cases indicated about the co-existence of G. intestinalis with Entamoeba spp. by molecular detection (Fig. 11). The highest cases of co-existence of G. intestinalis were found with Cryptosporidium spp. which was about 17.35% (34) of the total co-infected samples. Whereas, association rate was about 10.71% (21) of G. intestinalis and Blastocystis spp. (Table 8).
The result of molecular analysis also indicated, among the total positive samples, 92 samples were positive for assemblage A with the prevalence rate of 34.45%. Total 143 samples were found to be positive for assemblage B showing the prevalence rate of 53.56%. Whereas, in 32 samples both the assemblages. i.e. assemblage A and assemblage B were found to be present showing the rate of mixed infection as 11.98% (Table 9).
Table 9.
Overall prevalence of Giardia intestinalis and prevalence of different assemblages
| Total no. of collected samples | 1168 |
| Total no. of Giardia positive samples by PCR | 267 |
| Over all prevalence rate | 22.85% |
| Total no.of positive samples having assemblage A infection | 92 |
| Percentage of positive samples having assemblage A infection | 34.45% |
| Total no. of positive samples having assemblage B infection | 143 |
| Percentage of positive samples having assemblage B infection | 53.56% |
| Total no. of positive samples having mixed infection of assemblage A and assemblage B | 32 |
| Percentage of positive samples having mixed infection of assemblage A and assemblage B | 11.98% |
Of the G. intestinalis positive samples in different sexes, 27.10% (29) samples were positive for assemblage A in the males. Among the 160 positive samples of females, assemblage A was found to be present in 20.63% (33). Assemblage B was found to be present in 61.68% in male and the rest 11.21% were detected as mixed infection of assemblage A & B. In females assemblage B was found in 116 (72.50%) cases and mixed assemblages were detected in 6.86% (11) (Table 10).
Table 10.
Overall prevalence of Giardia intestinalis and prevalence of different assemblages among different sex
| Study group | Total no of sample | PCR positive samples | Assemblage a positive (% of prevalence) | Assemblage b positive (% of prevalence) | No. of mixed assemblages (% of prevalence) |
|---|---|---|---|---|---|
| Male | 503 | 107 | 29 (27.10%) | 66 (61.68%) | 12 (11.21%) |
| Female | 665 | 160 | 33 (20.63%) | 116 (72.50%) | 11 (6.86%) |
Among the three different districts, Cachar district, showed higher prevalence of assemblage B than the assemblage A. Assemblage A was detected in 26.53%, whereas, assemblage B was found to be present in 60.20% and in 13.26% cases, mixed assemblages were detected (Fig. 12). The prevalence rate was almost similar in Karimganj district where the prevalence were 33.33%, 55.91% and 10.75% respectively for assemblage A, B and mixed assemblages. But the result differed greatly in Hailakandi district. In Hailakandi, assemblage A was 23.68% prevalent, the prevalence rate was about 69.74% of assemblage B and mixed assemblage was found in 6.58% cases (Table 11) (Fig. 13).
Fig. 12.
x, y Representative PCR assay of Giardia intestinalis using Assemblage A Primer set; z, z1 Representative PCR assay of Giardia intestinalis using Assemblage B primer set. Expected amplicon sizes are indicated on the left side. M indicates the marker lane. The numbers in the upper lane indicated the lane number and NTC indicates negative control DNA
Table 11.
Overall prevalence of Giardia intestinalis and prevalence of different assemblages among different Districts
| Districts | Total no of sample | PCR positive samples | Assemblage a positive (% of prevalence) | Assemblage b positive (% of prevalence) | No. of mixed assemblages (% of prevalence) |
|---|---|---|---|---|---|
| Cachar | 466 | 98 | 26 (26.53%) | 59 (60.20%) | 13 (13.26%) |
| Karimganj | 389 | 93 | 31 (33.33%) | 52 (55.91%) | 10 (10.75%) |
| Hailakandi | 313 | 76 | 18 (23.68%) | 53 (69.74%) | 05 (6.58%) |
Fig. 13.
Phylogenetic relationship among Giardia intestinalis of the studied area
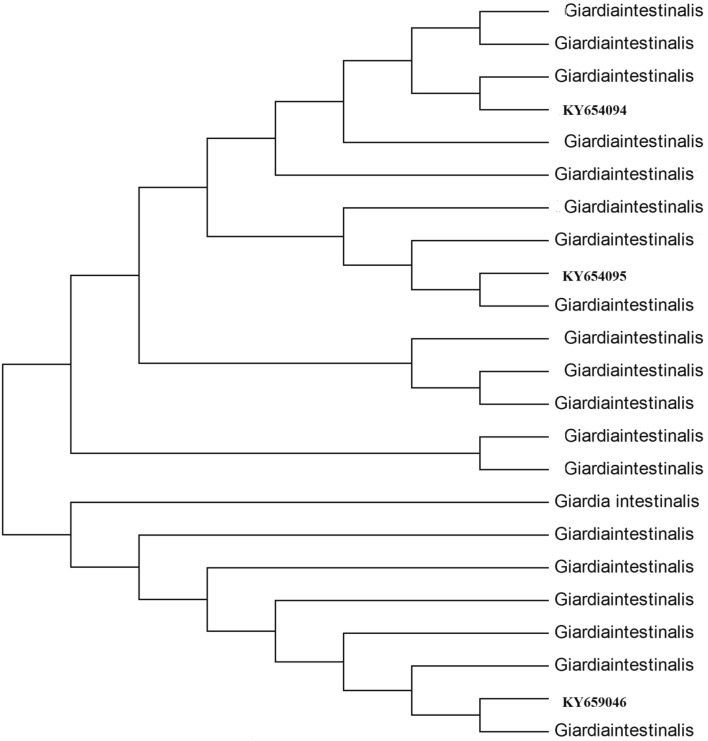
117 sequences obtained under this study represent the diversity of G. intestinalis under this area. All the obtained sequences were manually edited to obtain a high level of sequence homology with the help of Clustal W by adjusting the alignment at the 50 ends.
The sequence analysis process began by comparing the unknown sequences to a database of DNA sequence available on the public databases of NCBI using BLAST (Table 12).
Table 12.
Diversity of Giardia intestinalis and genotypes identified from Barak Valley, Assam, India
The Phylogenetic tree was constructed using 23 taxa. Of those 3 were the sample sequences. Those representative sequences were aligned with a set of similar sequences from GenBank and were subjected to analysis using the software MEGA4. The optimal tree with the sum of branch length = 0.24838034 is shown. The evolutionary distances were computed using the Kimura 2-parameter method and were in the units of the number of base substitutions per site. Condon positions included were 1st + 2nd + 3rd + Noncoding. All positions containing gaps and missing data were eliminated from the dataset (Complete deletion option). There were a total of 529 positions in the final dataset.
Discussion
This study revealed the existence as well as the prevalence of one of the most common gastrointestinal parasites across the world, G. intestinalis among the inhabitants of Barak Valley, Assam, NE India. It was detected as the most prevalent gastrointestinal parasitic organism in the particular study area but a majority of the infected individuals were unaware because of lacking knowledge and proper detection techniques or diagnosis.
Detection technique selection was another important aspect in this type of study as an error in detection may lead to misinterpretation. During this study, three diagnostic techniques were applied to overcome the chance of misdiagnosis. Microscopic analysis is the most primitive and cost-effective reliable method of diagnosis which depends on the morphological structure of an organism. But there is a chance of confusion or error. As sometimes if the severity remains very less in an individual, then the causative agent may not be detected in that particular slide kept under the microscope. In the second stage of detection, ELISA was used for further confirmation of the positive and negative samples. Lastly, molecular detection technique was employed as it has a high sensitivity and specificity amongst different techniques. As per literature available and by statistical analysis, PCR detection technique was considered as gold standard detection technique and in this present study, the result of PCR positive was considered as true positives.
In this present study, the prevalence rate was calculated as 22.85% which is the first report from the North-East region of India. This prevalence rate is similar to that found in other regions of India. The possible cause of infection in this study site is not yet so clear and requires further investigations.
Most of the studies suggested that the incidence and severity of Giardial infection depend on location and period of time. Some of the studies carried out in India indicate the severity of infection during the month of July, August and September that are considered as rainy season (Kaur et al. 2002). In our course of study, it was observed the rate of infection was relatively higher in the pre and post monsoon season. This seasonal outbreak is the result of the scarcity of water during pre-monsoon season which leads to unhygienic practices and promotes waterborne diseases. Besides this, during the rainy season, there is a regular occurrence of a flood that promotes contamination of drinking water or crop fields. The Economic condition of most of the individuals found to be positive was not that good and mostly depended on river water for their daily consumption. The majority of them did not even filter or purify water for drinking which provided a huge scope of infection. Improper washing of raw fruits and vegetables before consumption may also be a cause of transmission of gastrointestinal protozoan parasites which further causes chronic disease. In tropical developing countries children are found to be highly susceptible to protozoal infection due to environmental contamination and poor hygiene practices (Rai et al. 2005). The current study also supports this statement as among the infected individuals, the number of the children within the age range of 0–12 years is bit higher than other groups. Infants are more vulnerable due to lack of immune competency to fight against external pathogens. Besides this, children of this age range are mostly school going and having a tendency to play with soil and water which expose them to various contaminated diseases while playing and after handling pets such as cats or dogs.
Considering the sex, the higher prevalence of G. intestinalis in the females has been observed. This may be due to females are mostly busy with household activities like washing of utensils, clothes etc. thus getting exposed to contaminated water. Though males are also associated with household and agricultural activities but such a number of individuals participated in the present study is relatively less.
The role of G. intestinalis in causing diarrhoea is still controversial whereas, malnutrition, loss of weight are some of the common symptoms found in case of infection (Celliksoz et al. 2005). Most of the hosts, who shed infectious cysts and act as transmission vehicle may be found as asymptomatic but various cases also reported with chronic or severe diarrhoea (Ish-horowicz et al. 1989). In healthy adults, G. intestinalis infection is considered to be self-limiting and previously infected individuals are less likely to develop symptoms. It has been observed that some of the affected individuals do not have any symptoms of diarrhoea, however, most of them complained about having an abdominal cramp. Besides this, some participants also agree to have the problem with indigestion or acidity problems. Most of the children, positive for G. intestinalis were found to be suffering from malnutrition and retarded growth.
Sources of water used for drinking, washing clothes and utensils, taking bath etc. play an important role in such spread of disease. It has been observed that most of the families who reside nearby the river had a higher rate of infection. This may be due to using river water without proper filtration which may be contaminated with various parasites. A significant association has been found of G. intestinalis with other protozoan parasites like Entamoeba spp., Cryptosporidium spp. and Blastocystis spp. Among the protozoan parasites, co-infection rate of G. intestinalis with Cryptosporidium spp. is quite higher as described in other literature. Besides this, there are also cases of co-existence of G. intestinalis with Entamoeba spp. followed by Blastocystis spp. The co-existence of the parasites is whether coincidental or either have any close association, that is yet to be confirmed and requires further analysis.
Considering the human-specific assemblages, this study indicated about the higher rate of assemblage B in comparison assemblage A as reported earlier (Lebbad et al. 2008). A good percentage also indicates having mixed infection of both assemblage A and B.
Analysis of homology of the sequences showed that the sequences are within the assemblage A and B and there is no separate cluster for any of the isolates. It can also be said that the taxon position variation is an example of mixed assemblage as reported frequently in case of dogs. However, in detected mixed genotypes, the reason may be mixed infection or genetic recombination. The zoonotic relationship is not clear in this study as only the assemblages reported as human assemblages were found, thus does not provide the evidence of zoonotic transmission.
Acknowledgements
The authors want to acknowledge Department of Medicine and Department of Microbiology of Silchar Medical College for providing samples. Authors also greatly acknowledge The Molecular Parasitology Laboratory of Gurucharan College Silchar funded by DBT, DST and UGC for helping in molecular analysis under this study. We are grateful to Prof. Jaishree Paul, School of Life Sciences, JNU, New Delhi for providing all the positive controls used in this study as a kind gift to us. We would also like to convey our sincere gratitude to Prof. Sankar Kumar Ghosh, Vice Chancellor, Kalyani University, West Bengal for helping in the sequencing part in his previous laboratory of Dept. of Biotechnology, Assam University, Silchar. This research did not receive any specific grant from funding agencies in the public, commercial, or not-for-profit sectors.
Author’s contribution
The study design, aim and methodology were prepared by Dr. Baby Singha and Dr. Shubhadeep Roychoudhury. All the clinical samples along with patient details were provided by Dr. Debadatta Dhar. The experimentation, data analysis, statistical analysis were done by Dr. Madhumita Roy. The manuscript was prepared primarily by Dr. Madhumita Roy and further checked and modified by all the co-authors.
Funding
The research leading to these results has received funding from UGC, DBT and DST grants given to the Molecular Parasitology Laboratory, Department of Zoology, G. C. College, Silchar, Assam.
Compliance with ethical standards
Conflict of interest
All the authors declare that they have no conflict of interest.
Ethics approval
The protocol of the study was reviewed and approved by the Institutional Ethical Committee (Ref. No. GCC/9440) of Gurucharan College, Silchar, Assam, before the commencement of the Study and Silchar Medical College and Hospital, Silchar, Assam.
Informed consent
For the present study all stool samples were collected with the consent of each patient/subject, in the form of questionnaires. All study participants had given written consent before enrolment into the study. On behalf of all the infant participants consent had given by the parents/guardians.
Footnotes
Publisher's Note
Springer Nature remains neutral with regard to jurisdictional claims in published maps and institutional affiliations.
Contributor Information
Madhumita Roy, Email: madhumitaroy1133@gmail.com.
Baby Singha, Email: babysingha@gmail.com.
References
- Çelİksöz A, Aciöz M, DeĞerlİ S, Çinar Z, Elaldi N, Erandaç M. Effects of giardiasis on school success, weight and height indices of primary school children in Turkey. Pediatr Int. 2005;47:567–571. doi: 10.1111/j.1442-200x.2005.02110.x. [DOI] [PubMed] [Google Scholar]
- Charan J, Biswas T. How to calculate sample size for different study designs in medical research? Indian J Psychol Med. 2013;35(2):121. doi: 10.4103/0253-7176.116232. [DOI] [PMC free article] [PubMed] [Google Scholar]
- Dutta G. Cytochemistry and fluorescence microscopy of Giardia intestinalis. Proc Natl Acad Sci India. 1965;31:151–165. [Google Scholar]
- Easow JM, Mukhopadhyay C, Wilson G, Guha S, Jalan BY, Shivananda PG. Emerging opportunistic protozoa and intestinal pathogenic protozoal infestation profile in children of western Nepal. Nepal Med Coll J. 2005;7:134–137. [PubMed] [Google Scholar]
- Feng Y, Xiao L. Zoonotic potential and molecular epidemiology of Giardia species and giardiasis. Clin Microbiol Rev. 2011;24:110–140. doi: 10.1128/CMR.00033-10. [DOI] [PMC free article] [PubMed] [Google Scholar]
- Flanagan P. Giardia–diagnosis, clinical course and epidemiology. A review. Epidemiol Infect. 1992;109:1. [PMC free article] [PubMed] [Google Scholar]
- Ford BJ. The discovery of Giardia. Microsc Chicago. 2005;53:161–167. [Google Scholar]
- Ish-horowicz M, Korman SH, Shapiro M, Har-even U, Tamir I, Strauss N, Deckelbaum RJ. Asymptomatic giardiasis in children. Pediatr Infect Dis J. 1989;8:773–779. doi: 10.1097/00006454-198911000-00009. [DOI] [PubMed] [Google Scholar]
- Kaur R, Rawat D, Kakkar M, Uppal B, Sharma V. Intestinal parasites in children with diarrhea in Delhi, India. Southeast Asian J Trop Med Public Health. 2002;33:725. [PubMed] [Google Scholar]
- Lasek-Nesselquist E, Welch D, Thompson RCA, Steuart RF, Sogin ML. Genetic exchange within and between assemblages of Giardia duodenalis. J Eukaryot Microbiol. 2009;56:504–518. doi: 10.1111/j.1550-7408.2009.00443.x. [DOI] [PubMed] [Google Scholar]
- Lebbad M, Ankarklev J, Tellez A, Leiva B, Andersson JO, Svärd S. Dominance of Giardia assemblage B in Leon, Nicaragua. Acta Trop. 2008;106:44–53. doi: 10.1016/j.actatropica.2008.01.004. [DOI] [PubMed] [Google Scholar]
- Lwanga SK, Lemeshow S, World Health Organization . Sample size determination in health studies: a practical manual. Geneva: World Health Organization; 1991. [Google Scholar]
- Molina N, Polverino D, Minvielle M, Basualdo J. PCR amplification of triosephosphate isomerase gene of Giardia lamblia in formalin-fixed feces. Rev Latinoam Microbiol. 2007;49:6–11. [PubMed] [Google Scholar]
- Monis PT. Molecular epidemiology: assumptions and limitations of commonly applied methods. Int J Parasitol. 1998;28:981–987. doi: 10.1016/S0020-7519(98)00042-3. [DOI] [PubMed] [Google Scholar]
- Parija SC, Khairnar K. Detection of excretory Entamoeba histolytica DNA in the urine, and detection of E. histolytica DNA and lectin antigen in the liver abscess pus for the diagnosis of amoebic liver abscess. BMC Microbiol. 2007;7:41. doi: 10.1186/1471-2180-7-41. [DOI] [PMC free article] [PubMed] [Google Scholar]
- Potters I, Van Esbroeck M. Negative staining technique of Heine for the detection of Cryptosporidium spp.: a fast and simple screening technique. Open Parasitol J. 2010;4:1–4. doi: 10.2174/1874421401004010001. [DOI] [Google Scholar]
- Rai K, Sherchand JB, Bhatta DR, Bhattarai NR. Status of Giardia intestinalis infection among the children attending Kanti children hospital, Nepal. Sci. World. 2005;3:102–105. [Google Scholar]
- Schantz P, Sarti E, Plancarte A, Wilson M, Criales J, Roberts J, Flisser A. Community-based epidemiological investigations of cysticercosis due to Taenia solium: comparison of serological screening tests and clinical findings in two populations in Mexico. Clin Infect Dis. 1994;18:879–885. doi: 10.1093/clinids/18.6.879. [DOI] [PubMed] [Google Scholar]
- Sethi S, Sehgal R, Malla N, Mahajan R. Cryptosporidiosis in a tertiary care hospital. Natl Med J India. 1999;12:207–209. [PubMed] [Google Scholar]
- Sulaiman IM, Fayer R, Bern C, Gilman RH, Trout JM, Schantz PM, Das P, Lal AA, Xiao L. Triosephosphate isomerase gene characterization and potential zoonotic transmission of Giardia duodenalis. Emerg Infect Dis. 2003;9:1444. doi: 10.3201/eid0911.030084. [DOI] [PMC free article] [PubMed] [Google Scholar]
- Vanni I, Cacciò SM, van Lith L, Lebbad M, Svärd SG, Pozio E, Tosini F. Detection of Giardia duodenalis assemblages A and B in human feces by simple, assemblage-specific PCR assays. PLoS Neglect Trop Dis. 2012;6:e1776. doi: 10.1371/journal.pntd.0001776. [DOI] [PMC free article] [PubMed] [Google Scholar]
- Xiao L, Morgan UM, Limor J, Escalante A, Arrowood M, Shulaw W, Thompson R, Fayer R, Lal AA. Genetic diversity within Cryptosporidium parvum and related Cryptosporidium species. Appl Environ Microbiol. 1999;65:3386–3391. doi: 10.1128/aem.65.8.3386-3391.1999. [DOI] [PMC free article] [PubMed] [Google Scholar]
- Yoshikawa H, Abe N, Iwasawa M, Kitano S, Nagano I, Wu Z, Takahashi Y. Genomic analysis of Blastocystis hominisStrains isolated from two long-term health care facilities. J Clin Microbiol. 2000;38:1324–1330. doi: 10.1128/jcm.38.4.1324-1330.2000. [DOI] [PMC free article] [PubMed] [Google Scholar]


