

Abstract
Background
In a prior study, we found patient satisfaction was associated with mortality. However, that study included few deaths, yielding wide confidence intervals, was criticized for possible morbidity under-adjustment, and lacked power to explore sociodemographic moderation.
Objective
To revisit the satisfaction-mortality association in a larger national sample, allowing more precise risk estimates, sequential morbidity adjustment, and exploration of sociodemographic moderation.
Design
Prospective cohort study.
Participants
2000–2015 Adult Medical Expenditures Panel Surveys (MEPS) respondents (N = 92,952), each enrolled for 2 consecutive years.
Main Measures
We used five Consumer Assessment of Health Plans Survey (CAHPS) items to assess patients’ year 1 satisfaction with their clinicians. Death during the 2 years of MEPS participation was determined by proxy report. We modeled the satisfaction-mortality association in sequential regressions: model 1 included sociodemographics, model 2 added health status (approximating recommended CAHPS adjustment), and model 3 added smoking status, disease burden, and healthcare utilization.
Key Results
Satisfaction was not associated with mortality in model 1. In model 2, higher satisfaction was associated with higher mortality (hazard ratios [95% CIs] for 2nd, 3rd, and 4th (top) quartiles vs. 1st quartile: 1.28 (1.01, 1.62), P = 0.04; 1.43 (1.12, 1.82), P = 0.004; and 1.57 (1.25, 1.98), P < 0.001, respectively). The associations were not attenuated in model 3. There was a significant interaction between gender and satisfaction (F[3, 443] = 3.62, P = 0.01). The association between satisfaction and mortality was significant in women only, such that their mortality advantage over men was eliminated in the highest satisfaction quartile.
Conclusions
The association of higher patient satisfaction with clinicians with higher short-term mortality was evident only after CAHPS-recommended adjustment, was not attenuated by further morbidity adjustment, and was evident in women but not men. The findings suggest that characteristics among women who are more satisfied with their clinicians may be associated with increased mortality risk.
Electronic supplementary material
The online version of this article (10.1007/s11606-019-05058-8) contains supplementary material, which is available to authorized users.
KEY WORDS: gender, morbidity, mortality, patient satisfaction, population characteristics, United States
Patients’ subjective experience of healthcare, or patient satisfaction, is increasingly monitored in the United States (US).1 Patient satisfaction scores are employed to financially incentivize (or penalize) clinicians.2 This practice is predicated on several assumptions: that the scores largely reflect clinician interpersonal behaviors (e.g., patient-centeredness) and that incentives will encourage more optimal clinician interpersonal behaviors, in turn leading to higher patient satisfaction and improved patient care outcomes.3
Studies we and others have conducted question these assumptions. Most4–7 but not all8 studies of outpatient primary care visits directly comparing the contributions of clinician and patient characteristics to satisfaction scores suggest that patient characteristics contribute more than clinician characteristics. Further, while incentivizing clinicians based on satisfaction scores increases their focus on the scores, this does not necessarily translate into more optimal interpersonal behaviors. For example, clinicians may simply acquiesce to patient requests (ubiquitous in primary care), including for low value or potentially harmful (e.g., opioids) care, to maintain high satisfaction scores.9–11
Most concerning, in a study of nationally representative data from the 2000–2005 US Medical Expenditure Panel Surveys (MEPS), we found higher patient satisfaction was associated with increased mortality,12 later replicated by others.13 This association could reflect net harm resulting from low value or inappropriate care offered by clinicians to maintain high satisfaction. The finding was limited by few deaths during the study, and consequent wide confidence intervals (CI) around the mortality estimate (adjusted hazard ratio 1.26, 95% CI 1.05, 1.53).12 Sample size limitations also precluded exploring sociodemographic interactions in the satisfaction-mortality relationship. Further, some suggested the finding might reflect under-adjustment for morbidity, since “sicker” patients may have both higher satisfaction and higher mortality.12,14 Additionally, mortality was assessed at up to 6 years with over half of the deaths in the study occurring more than 2 years after the single satisfaction assessment. Time-varying experiences with care may have introduced biases, with unknown net impact.13 Finally, given the increasing emphasis on satisfaction scores, whether the relationship between satisfaction and mortality has changed since our prior study warrants investigation.
We revisited the association of patient satisfaction with mortality to address these questions. We again employed the nationally representative MEPS, but this time, over a longer period (2000–2015 vs. 2000–2005 in the prior study). This resulted in a much larger study sample (nearly 93,000 vs. just under 36,500 in the prior study), permitting a more precise estimate of the satisfaction-mortality association; exploration of the moderating roles of patient sociodemographic factors, self-rated health, and health conditions; and exploration of temporal trends. To assess the likelihood of confounding by unmeasured morbidity, we employed sequential models with progressively more extensive morbidity adjustment. Finally, we assessed mortality within the relatively short 2-year MEPS participation period to lessen potential bias due to changes in satisfaction over time.
METHODS
The MEPS is an annual national survey of healthcare use and costs in the civilian, non-institutionalized US population, employing an overlapping panel design.15 Data is collected repeatedly over a 2-year period from each participant. The study was exempted by the University of California Davis Institutional Review Board.
The MEPS Household Component (HC) includes information on respondent sociodemographics, geographical information, health insurance, and healthcare utilization and expenditures as well as questions regarding smoking, health conditions, health status, and vital status. The MEPS Medical Conditions File includes information regarding the presence of cancer diagnoses. We weighted the cluster-based sample data set to approximate a nationally representative sample of the US. Included in this study were all respondents aged > 18 from 2000 to 2015; full year response rates declined from 65.8 to 47.7% over this period.16
Measures
Patient Satisfaction
In year 1 of their MEPS participation, respondents answered questions from the Consumer Assessment of Health Plans Survey (CAHPS) evaluating satisfaction across five dimensions, ranging from physician communication to health plan customer service.17 Satisfaction with physician communication is strongly correlated with other CAHPS dimensions and with global satisfaction.18 Therefore, as in our prior satisfaction and mortality study,12 we used responses to four items pertaining to physician communication—specifically how often in the past 12 months patients’ physicians or other health care providers: listened carefully, explained things in a way that was easy to understand, showed respect for what they had to say, and spent enough time with them. We also used a fifth item in which patients rated their health care from all physicians and other health care providers on a scale of 0 to 10 (from the worst to the best health care possible). We created a scale by standardizing (to weight each question equally) and averaging responses to the five items (mean, 0; median, 0.25; interquartile range, − 0.47 to 0.72; Cronbach α = 0.88), in which higher numbers indicate greater satisfaction. We categorized patient responses into quartiles of the year 1 satisfaction scale.
Mortality
Death during the 2-year MEPS enrollment period was determined by report from a household member or other HC survey proxy respondent (e.g., neighbor).19
Other Variables
We included other variables that prior research indicated may influence the satisfaction-mortality relationship.4,12,20–26 Sociodemographic variables included age, sex (female or male), race/ethnicity (White, Black, Hispanic, or other), education level (less than high school, some high school, high school graduate, some college, college graduate), family income as a percentage of the federal poverty level (FPL) (< 100%, 100–< 125%, 125–< 200%, 200–< 400%, or ≥ 400%)27, US geographic region (Northeast, South, Midwest, or West), and health insurance status (any private coverage, only public coverage, or uninsured).
Several health- and healthcare utilization-related variables were also included. Health status was measured with the Short Form 12 Physical Component Summary (PCS-12) and Mental Component Summary (MCS-12) scores.28 Both scores range from 0 to 100 (higher scores = better functioning) and are designed to have means of 50 and standard deviations of 10 in a representative sample of the US population.28 We included a single-item measure of self-rated health—“In general, would you say your health is (excellent, very good, good, fair, or poor)?”—given its independent association with mortality.22,29 Current smoking status was assessed with a single yes/no item. Chronic disease burden was assessed through a count of up to 8 chronic conditions (score range 0–8)—hypertension, coronary heart disease, heart attack, stroke or TIA, emphysema, asthma, diabetes, and arthritis.12 Healthcare utilization variables included were total numbers of outpatient office visits, emergency department visits, and hospital discharges; total number of medication prescriptions; and total healthcare expenditures, in US dollars.
Analyses
Analyses were conducted using Stata (version 15.1, StataCorp, College Station, TX). We employed chi-square tests (for categorical variables) and t tests (for continuous variables) in unadjusted sample comparisons of characteristics between respondent groups with top quartile vs. lower satisfaction. These descriptive analyses were sample-based. All subsequent regression analyses adjusted for the complex MEPS sampling design and survey non-response, yielding estimates applicable to the non-institutionalized US population aged 18 years or older.30
We assessed the adjusted associations in the two respondent groups using logistic regression. We examined mortality during the 2-year MEPS participation period as a function of year 1 patient satisfaction quartile in three logistic regression models, progressively adding more extensive adjustment for morbidity and utilization. The base model included only sociodemographic factors: age, [mean age−age]2 (included to account for the curvilinear relationship of age with mortality)31, sex (analytic reference male), race/ethnicity (reference White), education level (reference less than high school), family income as a percentage of the FPL (reference < 100%), geographic region (reference Northeast), and health insurance status (reference private). The second model added to the base model adjustment for self-rated health (reference excellent) and for physical and mental health status (PCS-12 and MCS-12 scores, respectively). This model attained the CAHPS Consortium’s recommended standard adjustment of scores for patient age, education, and self-reported general health status. The Consortium asserts this adjustment makes it more likely that reported differences are due to real differences in clinician performance, rather than differences in the characteristics of the CAHPS respondents.32
The third model added the following variables to the second model: current smoking status, chronic condition count, outpatient office visit count, total medication prescriptions, total healthcare expenditures, number of emergency department visits, and number of inpatient hospital discharges. All models also included MEPS participation year, to account for any temporal trends in the association of satisfaction with mortality.
We conducted several supplemental analyses. Models included interaction terms between satisfaction and sociodemographic factors, self-rated health, and time-period (2000–2005 [as in prior study] vs. 2006–2015). A final model included individual health conditions instead of a count of conditions. That model also included a covariate for cancer diagnosis (present/absent), excluding non-melanoma skin cancer.
RESULTS
The sample included 92,952 respondents to the 2000 through 2015 MEPS. Their characteristics are summarized in Table 1, by satisfaction category (top quartile vs all others combined) and overall. Respondent characteristics associated with top quartile satisfaction were older age, female gender, Black race, less education and income, living outside the West, having insurance (especially public insurance), better self-rated health, being a smoker, having more prescriptions, higher expenditures, more hospitalizations, and fewer emergency room visits (Table 2). Adjusted relationships similar to those in Table 2 were observed when patients who died were excluded (online Appendix 1).
Table 1.
Characteristics of the Study Sample by Level of Satisfaction with Clinicians and Overall
| Characteristic | Satisfaction quartiles 1–3 N = 68,595 |
Top (4th) satisfaction quartile N = 24,357 |
P value | Total sample N = 92,952 |
|---|---|---|---|---|
| Age, mean (SD) | 47.3 (17.4) | 51.4 (17.9) | < 0.001 | 48.4 (17.6) |
| Female sex, no. (%) | 41,148 (60.0) | 15,037 (61.7) | < 0.001 | 56,185 (60.4) |
| Race/ethnicity, no. (%) | < 0.001 | |||
| White | 39,381 (57.4) | 14,757 (60.6) | 54,138 (58.2) | |
| Hispanic | 13,126 (19.1) | 4048 (16.6) | 17,174 (18.5) | |
| Black | 10,873 (15.9) | 4312 (17.7) | 15,185 (16.3) | |
| Other | 5215 (7.6) | 1240 (5.1) | 6455 (6.9) | |
| Education level, no. (%) | < 0.001 | |||
| Less than high school | 5791 (8.4) | 2184 (9.0) | 7975 (8.6) | |
| Some high school | 8351 (12.2) | 3038 (12.5) | 11,389 (12.3) | |
| High school | 20,338 (29.6) | 7603 (31.2) | 27,941 (30.1) | |
| Some college | 16,421 (23.9) | 5693 (23.4) | 22,114 (23.8) | |
| College graduate | 17,694 (25.8) | 5839 (24.0) | 23,533 (25.3) | |
| Household income as % of FPL, no. (%) | < 0.001 | |||
| < 100 | 10,721 (15.6) | 3496 (14.4) | 14,217 (15.3) | |
| 100–< 125 | 3634 (5.3) | 1263 (5.2) | 4897 (5.3) | |
| 125–< 200 | 10,131 (14.8) | 3542 (14.5) | 13,673 (14.7) | |
| 200–< 400 | 20,462 (29.8) | 7199 (29.6) | 27,661 (29.8) | |
| 400+ | 23,647 (34.5) | 8857 (36.4) | 32,504 (35.0) | |
| US geographic region, no. (%) | < 0.001 | |||
| Northeast | 11,206 (16.3) | 4107 (16.9) | 15,313 (16.5) | |
| Midwest | 14,545 (21.2) | 5461 (22.4) | 20,006 (21.5) | |
| South | 25,327 (36.9) | 9613 (39.5) | 34,940 (37.6) | |
| West | 17,517 (25.5) | 5176 (21.3) | 22,693 (24.4) | |
| Health insurance, no. (%) | < 0.001 | |||
| Any private | 45,616 (66.5) | 16,586 (68.1) | 62,202 (66.9) | |
| Only public | 15,106 (22.0) | 5895 (24.2) | 21,001 (22.6) | |
| Uninsured | 7873 (11.5) | 1876 (7.7) | 9749 (10.5) | |
|
Lower (1st through 3rd) satisfaction quartiles N = 68,595 |
Top (4th) satisfaction quartile N = 24,357 |
P value |
Total N = 92,952 |
|
| Self-rated health, no. (%) | < 0.001 | |||
| Excellent | 11,672 (17.0) | 6212 (25.5) | 17,884 (19.2) | |
| Very good | 21,644 (31.6) | 7766 (31.9) | 29,410 (31.6) | |
| Good | 21,457 (31.3) | 6504 (26.7) | 27,961 (30.1) | |
| Fair | 10,311 (15.0) | 2863 (11.8) | 13,174 (14.2) | |
| Poor | 3511 (5.1) | 1012 (4.2) | 4523 (4.9) | |
| Physical health status (PCS-12), mean (SD) | 46.9 (11.5) | 48.1 (11.5) | < 0.001 | 47.2 (11.5) |
| Mental health status (MCS-12), mean (SD) | 48.8 (10.5) | 52.5 (9.6) | < 0.001 | 49.7 (10.4) |
| Current smoker, no. (%) | 12,684 (18.5) | 4097 (16.8) | < 0.001 | 16,781 (18.1) |
| Number of chronic conditions, mean (SD)‡ | 1.0 (0.0, 2.0) | 1.0 (0.0, 2.0) | < 0.001 | 1.0 (0.0, 2.0) |
| Outpatient office visits, mean (SD)‡ | 3.0 (1.0, 6.0) | 3.0 (1.0, 6.0) | < 0.001 | 3.0 (1.0, 6.0) |
| Total prescriptions, no. (%) | 16.6 (24.9) | 18.7 (26.7) | < 0.001 | 17.1 (25.4) |
| Total healthcare expenditures, $, mean (SD) | 1801 (535, 5248) | 2006 (649, 5356) | < 0.001 | 1858 (563, 5281) |
| Emergency visits, no. (%) | 12,399 (18.1) | 3768 (15.5) | < 0.001 | 16,167 (17.4) |
| Inpatient discharges, no. (%) | 7772 (11.3) | 2854 (11.7) | 0.13 | 10,626 (11.4) |
| Died during survey period, no. (%) | 636 (0.9) | 271 (1.1) | 0.01 | 907 (1.0) |
Data in this table derive directly from the study sample (i.e., are not adjusted for MEPS sampling, non-response, or survey design). Satisfaction with all clinicians encountered in the preceding 12 months, measured using a standardized scale comprised of five Consumer Assessment of Health Plans Survey (CAHPS) items; see methods for details
FPL federal poverty level, MCS-12 Short Form-12 mental component summary score, PCS-12 Short Form-12 physical component summary score, SD standard deviation
‡Values appear similar among columns in this row due to rounding
Table 2.
Associations of Participant Characteristics with Top Quartile Satisfaction with Clinicians
| Characteristic | Association with top quartile satisfaction with clinicians† adjusted odds ratios (95% CIs) | P value |
|---|---|---|
| Age | 1.02 (1.01, 1.02) | < 0.001 |
| [Mean age−age]2 | 1.00 (1.00, 1.00) | 0.15 |
| Female sex | 1.13 (1.09, 1.16) | < 0.001 |
| Race/ethnicity (ref = White) | ||
| Hispanic | 0.99 (0.93, 1.06) | 0.83 |
| Black | 1.16 (1.09, 1.23) | < 0.001 |
| Other | 0.75 (0.68, 0.83) | < 0.001 |
| Education level (ref = <high school) | ||
| Some high school | 1.09 (1.00, 1.20) | 0.05 |
| High school graduate | 0.96 (0.88, 1.04) | 0.32 |
| Some college | 0.89 (0.82, 0.96) | 0.004 |
| College graduate | 0.75 (0.69, 0.82) | < 0.001 |
| Household income as % of FPL (ref = < 100%) | ||
| 100–< 125 | 0.96 (0.87, 1.05) | 0.35 |
| 125–< 200 | 0.98 (0.91, 1.05) | 0.49 |
| 200–< 400 | 0.91 (0.85, 0.97) | 0.005 |
| 400+ | 0.91 (0.85, 0.98) | 0.009 |
| US geographic region (ref = Northeast) | ||
| Midwest | 0.96 (0.87, 1.05) | 0.35 |
| South | 0.98 (0.91, 1.05) | 0.49 |
| West | 0.91 (0.85, 0.97) | 0.005 |
| Health insurance (ref = any private) | ||
| Only public | 1.16 (1.09, 1.23) | < 0.001 |
| Uninsured | 0.85 (0.78, 0.92) | < 0.001 |
| Self-rated health (ref = excellent) | ||
| Very good | 0.68 (0.64, 0.72) | < 0.001 |
| Good | 0.62 (0.59, 0.66) | < 0.001 |
| Fair | 0.70 (0.64, 0.75) | < 0.001 |
| Poor | 1.01 (0.89, 1.14) | 0.86 |
| Physical health status (PCS-12) | 1.03 (1.03, 1.03) | < 0.001 |
| Mental health status (MCS-12) | 1.04 (1.04, 1.05) | < 0.001 |
| Current smoker | 1.07 (1.02, 1.13) | 0.007 |
| Number of chronic conditions | 1.03 (1.01, 1.05) | 0.007 |
| Mean number of office visits | 1.00 (0.99, 1.00) | 0.33 |
| Total prescriptions | 1.00 (1.00, 1.01) | < 0.001 |
| Total healthcare expenditures | 1.01 (1.00, 1.02) | 0.02 |
| Total emergency visits | 0.93 (0.90, 0.96) | < 0.001 |
| Total inpatient discharges | 1.07 (1.02, 1.12) | 0.002 |
Satisfaction with all clinicians encountered in the preceding 12 months, measured using a standardized scale comprised of five Consumer Assessment of Health Plans Survey (CAHPS) items; see methods for details
FPL federal poverty level, MEPS Medical Expenditures Panel Survey, MCS-12 Short Form-12 mental component summary score, PCS-12 Short Form-12 physical component summary score, SD standard deviation, US United States
†Regression models adjusted for MEPS panel year, sampling, non-response, and survey design yielding estimates for the non-institutionalized US population aged > 18 years
Adjusted associations of satisfaction with mortality.
Table 3 shows the adjusted risk of mortality associated with satisfaction quartiles in three sequentially adjusted models. In model 1 (sociodemographic adjustment), satisfaction was not associated with mortality. In model 2 (adding CAHPS-recommended adjustment for self-rated health), there was a progressive increase in mortality across all satisfaction quartiles. In model 3 (adding all health-related and utilization variables), the associations of satisfaction with mortality observed in model 2 were not attenuated.
Table 3.
Mortality Risk Associated with Increasing Levels of Satisfaction with Clinicians, Sequentially Adjusted for Participant Characteristics
| Model 1: sociodemographics AOR (95% CI)† | P value | Model 2: model 1 + CAHPS-like adjustors AOR (95% CI) † | P value | Model 3: model 2 + smoking and utilization AOR (95% CI)† | P value | |
|---|---|---|---|---|---|---|
| Satisfaction with clinicians (ref = 1st quartile) | ||||||
| 2nd quartile | 0.97 (0.78, 1.21) | 0.79 | 1.28 (1.01, 1.62) | 0.04 | 1.29 (1.01, 1.65) | 0.04 |
| 3rd quartile | 0.91 (0.73, 1.14) | 0.43 | 1.43 (1.12, 1.82) | 0.004 | 1.46 (1.14, 1.86) | 0.002 |
| 4th (top) quartile | 0.91 (0.73, 1.14) | 0.42 | 1.57 (1.25, 1.98) | < 0.001 | 1.59 (1.26, 2.02) | < 0.001 |
| Age, mean | 1.06 (1.05, 1.07) | < 0.001 | 1.04 (1.03, 1.05) | < 0.001 | 1.04 (1.03, 1.06) | < 0.001 |
| [Mean age−age]2 | 1.00 (1.00, 1.00) | 0.001 | 1.00 (1.00, 1.00) | < 0.001 | 1.00 (1.00, 1.00) | < 0.001 |
| Female sex (ref = male) | 0.53 (0.46, 0.62) | < 0.001 | 0.53 (0.45, 0.61) | < 0.001 | 0.53 (0.46, 0.63) | < 0.001 |
| Race/ethnicity (ref = White) | ||||||
| Hispanic | 0.62 (0.47, 0.82) | 0.001 | 0.64 (0.48, 0.86) | 0.003 | 0.72 (0.54, 0.97) | 0.03 |
| Black | 1.25 (1.03, 1.52) | 0.02 | 1.32 (1.08, 1.60) | 0.006 | 1.38 (1.13, 1.68) | 0.001 |
| Other | 0.71 (0.48, 1.03) | 0.07 | 0.72 (0.49, 1.05) | 0.09 | 0.83 (0.56, 1.21) | 0.33 |
| Education level (ref <high school) | ||||||
| Some high school | 1.09 (0.84, 1.43) | < 0.001 | 1.22 (0.93, 1.61) | 0.16 | 1.25 (0.94, 1.66) | 0.12 |
| High school graduate | 0.74 (0.59, 0.93) | 0.01 | 1.01 (0.79, 1.29) | 0.95 | 1.03 (0.81, 1.32) | 0.80 |
| Some college | 0.64 (0.49, 0.84) | 0.001 | 0.90 (0.68, 1.20) | 0.48 | 0.92 (0.69, 1.23) | 0.57 |
| College graduate | 0.47 (0.35, 0.65) | < 0.001 | 0.80 (0.58, 1.11) | 0.181 | 0.84 (0.61, 1.17) | 0.3 |
| Household income as %of FPL (ref < 100) | ||||||
| 100–< 125 | 1.15 (0.86, 1.54) | 0.35 | 1.19 (0.87, 1.63) | 0.28 | 1.24 (0.91, 1.70) | 0.17 |
| 12–< 200 | 0.75 (0.59, 0.96) | 0.02 | 0.88 (0.69, 1.13) | 0.32 | 0.92 (0.72, 1.17) | 0.48 |
| 200–< 400 | 0.76 (0.61, 0.96) | 0.02 | 1.04 (0.82, 1.32) | 0.74 | 1.09 (0.86, 1.39) | 0.48 |
| 400+ | 0.58 (0.44, 0.76) | < 0.001 | 0.93 (0.69, 1.25) | 0.63 | 0.97 (0.72, 1.31) | 0.85 |
| US geographic region (ref = Northeast) | ||||||
| Midwest | 1.28 (1.00, 1.65) | 0.05 | 1.26 (0.97, 1.63) | 0.08 | 1.22 (0.95, 1.57) | 0.13 |
| South | 1.13 (0.90, 1.41) | 0.28 | 0.98 (0.78, 1.23) | 0.85 | 1.01 (0.80, 1.26) | 0.96 |
| West | 1.01 (0.77, 1.34) | 0.93 | 0.97 (0.74, 1.28) | 0.82 | 1.01 (0.77, 1.33) | 0.94 |
| Health insurance (ref = any private) | ||||||
| Public | 1.45 (1.20, 1.74) | < 0.001 | 1.13 (0.94, 1.37) | 0.19 | 1.12 (0.93, 1.35) | 0.24 |
| Uninsured | 1.01 (0.66, 1.56) | 0.96 | 0.90 (0.59, 1.40) | 0.65 | 1.03 (0.65, 1.64) | 0.90 |
| Self-rated health (ref = excellent) | ||||||
| Very good | – | – | 1.07 (0.71, 1.61) | 0.76 | 1.04 (0.69, 1.58) | 0.84 |
| Good | – | – | 0.98 (0.65, 1.47) | 0.93 | 0.92 (0.61, 1.38) | 0.67 |
| Fair | – | – | 1.69 (1.10, 2.59) | 0.02 | 1.51 (0.98, 2.32) | 0.06 |
| Poor | – | – | 4.28 (2.69, 6.79) | < 0.001 | 3.48 (2.17, 5.59) | < 0.001 |
| Physical health status (PCS-12) | – | – | 0.96 (0.95, 0.96) | < 0.001 | 0.96 (0.95, 0.97) | < 0.001 |
| Mental health status (MCS-12) | – | – | 0.98 (0.97, 0.99) | < 0.001 | 0.98 (0.98, 0.99) | < 0.001 |
| Current smoker (ref = non-smoker) | – | – | – | – | 1.79 (1.42, 2.25) | < 0.001 |
| Number of chronic conditions | – | – | – | – | 0.95 (0.89, 1.02) | 0.13 |
| Number of office visits | – | – | – | – | 1.00 (0.99, 1.01) | 0.55 |
| Number of prescriptions | – | – | – | – | 1.00 (1.00, 1.00) | 0.78 |
| Total expenditures | – | – | – | – | 1.11 (0.99, 1.24) | 0.08 |
| Total emergency department visits | – | – | – | – | 1.15 (1.07, 1.23) | < 0.001 |
| Total inpatient hospitalizations | – | – | – | – | 1.28 (1.17, 1.41) | < 0.001 |
Satisfaction with all clinicians encountered in the preceding 12 months, measured using a standardized scale comprised of five CAHPS items; see methods for details
AOR adjusted odds ratio, CAHPS Consumer Assessment of Health Plans, CI confidence interval, FPL federal poverty level, MEPS Medical Expenditures Panel Survey, MCS-12 Short Form-12 mental component summary score, PCS-12 Short Form-12 physical component summary score, US United States
†Regression models adjusted for MEPS panel year, sampling, non-response, and survey design yielding estimates for the non-institutionalized US population aged > 18 years
In supplemental analyses including interaction terms between satisfaction and sociodemographic, self-rated health and time period variables, only the interaction between gender and satisfaction was significant; online Appendix 2 shows adjusted Wald test findings for these analyses. The gender × satisfaction interaction term revealed that the mortality advantage for women compared with men was not apparent among women in the top satisfaction quartile (Figure 1) and the gradient in the relationship between satisfaction and mortality was evident only in women. The analyses using individual conditions did not substantively alter the satisfaction-mortality relationship (online Appendix 3).
Fig. 1.
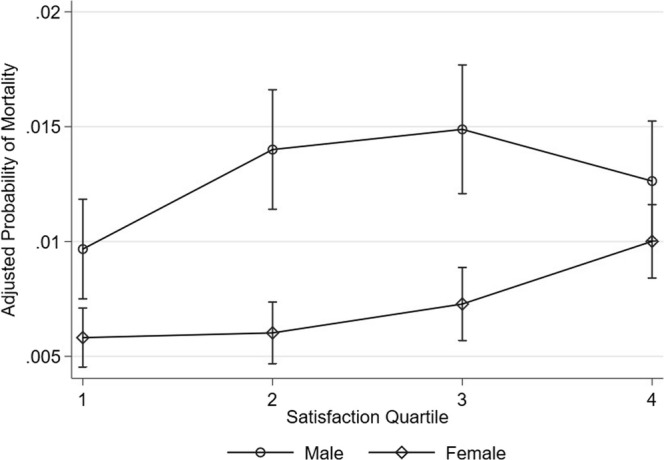
The mortality advantage for women compared with men.
DISCUSSION
In a model including CAHPS-recommended adjustment for respondent sociodemographics and health status, we found higher satisfaction across each quartile was associated with higher short-term mortality. Further, the relationship was not attenuated by additional adjustment for health- and healthcare-related factors. By contrast, there was no significant association between satisfaction and mortality in a model adjusted only for sociodemographics.
Our prior MEPS study of satisfaction and mortality involved fewer years (2000–2005) and a smaller sample, yielding a less precise estimate of mortality risk associated with top quartile satisfaction.12 In discussing the finding, we speculated it might reflect net harmful effects of low value or inappropriate care offered by clinicians to maintain high satisfaction scores. Our subsequent study of the association of request denial with lower satisfaction provided further support for this speculation.9 Some have suggested the finding in our earlier satisfaction and mortality study might reflect under-adjustment for morbidity.12,14 Our current study does not support this notion, since the increased risk of mortality associated with higher satisfaction did not emerge until we added adjustment for health status to a base model including only sociodemographics (Table 3, models 1 and 2). Additional adjustment for health- and health-related variables did not attenuate the relationship. Notably, the model including sociodemographics and health status used a level of adjustment comparable to CAHPS Consortium recommendations.32 Exploratory secondary analyses including interaction terms, revealed no evidence of moderation by age, race, education, income, self-rated health, or time period (online Appendix 2).
Among the interaction terms examined, only gender exhibited clinically significant moderation. As noted in prior research conducted by others,33 women had lower mortality risk than men; however, among women in the highest satisfaction quartile in our study, this advantage was eliminated (Figure 1). This finding must be interpreted with caution, since it did not stem from any a priori hypothesis. However, tentatively, it suggests that if higher satisfaction is an indicator of increasing exposure to low value or inappropriate care, for which harms may outweigh benefits, women may be affected disproportionately. Alternatively, there may be some characteristic in women, or in their relationship with physicians, that is associated both with satisfaction and an increased risk of mortality. While our study was not designed to explore the mechanisms of this finding, certain factors and tendencies more prevalent among women could contribute. Women are more likely than men to have a usual source of care; use more, and be more satisfied with care, the latter observed in our study (Table 2); and have higher levels of activation for participation in care.34–37 While some of these characteristics may be protective, they may differentially increase the risk of exposure to low value care; in turn, the net effects in women with high levels of satisfaction may offset the mortality advantage other women enjoy. Given the observational nature of our analyses, and the absence of an a priori hypothesis regarding moderation of the satisfaction-mortality relationship by gender, the findings remain speculative. Further study is needed.
Another proposed explanation for our previous findings was that clinicians pay more attention to patients’ needs as the patients near death, generating higher satisfaction, creating a reverse causal pathway.38 However, in the current study, patients in the highest satisfaction quartile reported better self-rated health at the time of survey completion (Table 2), and this relationship was unchanged in an analysis excluding those who died (online Appendix 1).
We believe our findings further question the current practice of incentivizing or penalizing clinicians and health systems based on satisfaction scores, a concern expressed by clinicians and clinician organizations.2,39–41 We do not propose disregarding patient satisfaction. However, there is a need for caution in interpreting and using satisfaction scores in practice. In daily time-pressured patient encounters, often with complex and emotionally laden agendas, clinicians must make on-the-fly judgments about how best to promote health. This sometimes entails declining requests for low value or inappropriate services,9 as well as addressing health-critical issues that patients may minimize (e.g., opioid use disorders). These physician behaviors risk compromising patient satisfaction.42 However, evidence suggests clinicians often acquiescence to low value or inappropriate care requests to maintain high patient satisfaction.9 Thus, reducing clinician and health system satisfaction incentives may be prudent. Such an approach might facilitate clinicians having difficult yet important conversations due to fears of low satisfaction ratings—something that can result even with skilled patient-centered communication.39 Our suggestion would not preclude using satisfaction scores in more defensible ways, for example, to identify and target remediation to outlier clinicians with consistently low satisfaction scores, possibly reflecting communication deficits or burnout.43,44
Strengths of our study included a large nationally representative sample, with rich data on respondent sociodemographics, health status, disease burden, and healthcare utilization. These features afforded precise estimates of mortality risk associated with satisfaction; examination of mortality risk in sequential models, including one meeting and one exceeding CAHPS-recommended adjustment (Table 3, models 2 and 3, respectively); and exploration of moderation of the satisfaction-mortality relationship by sociodemographics. The use of data from 15 successive 2-year MEPS cycles also allowed examination of temporal trends in the relationship of satisfaction with mortality.
Our study also had limitations, apart from the observational nature of the analyses noted previously. The satisfaction measure focused exclusively on satisfaction with clinicians, and more specifically satisfaction with the care received from all clinicians over 12 months. Whether similar findings would be observed for other dimensions of satisfaction (e.g., with the health system) or contexts (e.g., satisfaction with an individual clinician during a specific visit) is uncertain, though satisfaction scores are correlated across dimensions and contexts.18 We examined mortality during each respondent’s 2-year MEPS participation period. The short time horizon reduced the risks of measurement error (e.g., changes in satisfaction over longer time periods), but how the satisfaction-mortality relationship might evolve over longer follow-up is unclear. It is not known whether use of proxies introduced a bias in mortality assessment. Some might question our use of logistic regression to examine the association of satisfaction with mortality, based on the low proportion of participants who died during the study. However, there is no inherent problem with employing logistic regression when there is a low proportion of events of interest but rather when the absolute number of the events is low.45 In our sample, the outcome of interest was not particularly rare in absolute terms: there were 900 deaths, making logistic regression a reasonable choice. Finally, though we included extensive adjustment for sociodemographics, health status, chronic disease burden, and healthcare utilization, there is always the potential for unmeasured confounding in observational studies.
In conclusion, in a nationally representative study, the association of higher patient satisfaction with higher mortality risk was evident only after CAHPS-recommended adjustment and was not attenuated by further morbidity adjustment. Finally, the association of higher satisfaction with higher mortality was evident in women but not men, suggesting the presence of characteristics among women who are more satisfied with their clinicians that are associated with increased mortality risk.
Electronic Supplementary Material
(DOCX 26 kb)
Contributors
None apart from the authors.
Funders
This work was supported by the Department of Family and Community Medicine, University of California, Davis. Several authors are faculty members in the Department of Family and Community Medicine (Jerant, Fenton, Magnan, Agnoli, and Franks).
Compliance with Ethical Standards
Conflict of Interest
The authors declare that they do not have a conflict of interest.
Footnotes
Publisher’s Note
Springer Nature remains neutral with regard to jurisdictional claims in published maps and institutional affiliations.
References
- 1.Lehrman WG, Friedberg MW. CAHPS Surveys: Valid and valuable measures of patient experience. Hast Cent Rep. 2015;45:3–4. doi: 10.1002/hast.507. [DOI] [PubMed] [Google Scholar]
- 2.Japsen B. Ouch! Patient satisfaction hits physician pay. Forbes. Available at: https://www.forbes.com/sites/brucejapsen/2013/07/02/patient-satisfaction-hits-physician-pay/#2ef6984854e5. Accessed 24 Jan 2019.
- 3.Rickert J. Patient-centered care: what it means and how to get there. Health Affairs blog. Available at: http://healthaffairs.org/blog/2012/01/24/patient-centered-care-what-it-means-and-how-to-get-there/. Accessed 24 Jan 2019.
- 4.Fenton JJ, Jerant A, Kravitz RL, et al. Reliability of physician-level measures of patient experience in primary care. J Gen Intern Med. 2017;32:1323–9. doi: 10.1007/s11606-017-4175-y. [DOI] [PMC free article] [PubMed] [Google Scholar]
- 5.Selby JV, Schmittdiel JA, Lee J, et al. Meaningful variation in performance: what does variation in quality tell us about improving quality? Med Care. 2010;48:133–9. doi: 10.1097/MLR.0b013e3181c15a6e. [DOI] [PubMed] [Google Scholar]
- 6.Salisbury C, Wallace M, Montgomery AA. Patients’ experience and satisfaction in primary care: secondary analysis using multilevel modelling. BMJ (Clin Res Ed) 2010;341:c5004. doi: 10.1136/bmj.c5004. [DOI] [PMC free article] [PubMed] [Google Scholar]
- 7.Sixma HJ, Spreeuwenberg PM, van der Pasch MA. Patient satisfaction with the general practitioner: a two-level analysis. Med Care. 1998;36:212–29. doi: 10.1097/00005650-199802000-00010. [DOI] [PubMed] [Google Scholar]
- 8.Safran DG, Karp M, Coltin K, et al. Measuring patients’ experiences with individual primary care physicians. Results of a statewide demonstration project. J Gen Intern Med. 2006;21:13–21. doi: 10.1111/j.1525-1497.2005.00311.x. [DOI] [PMC free article] [PubMed] [Google Scholar]
- 9.Jerant A, Fenton JJ, Kravitz RL, et al. Association of clinician denial of patient requests with patient satisfaction. JAMA Int Med. 2018;178:85–91. doi: 10.1001/jamainternmed.2017.6611. [DOI] [PMC free article] [PubMed] [Google Scholar]
- 10.Zgierska A, Rabago D, Miller MM. Impact of patient satisfaction ratings on physicians and clinical care. Patient Prefer Adherence. 2014;8:437–46. doi: 10.2147/PPA.S59077. [DOI] [PMC free article] [PubMed] [Google Scholar]
- 11.Kravitz RL, Epstein RM, Feldman MD, et al. Influence of patients’ requests for direct-to-consumer advertised antidepressants: a randomized controlled trial. JAMA. 2005;293:1995–2002. doi: 10.1001/jama.293.16.1995. [DOI] [PMC free article] [PubMed] [Google Scholar]
- 12.Fenton JJ, Jerant AF, Bertakis KD, Franks P. The cost of satisfaction: a national study of patient satisfaction, health care utilization, expenditures, and mortality. Arch Intern Med. 2012;172:405–11. doi: 10.1001/archinternmed.2011.1662. [DOI] [PubMed] [Google Scholar]
- 13.Xu X, Buta E, Anhang Price R, Elliott MN, Hays RD, Cleary PD. Methodological considerations when studying the association between patient-reported care experiences and mortality. Health Serv Res. 2015;50:1146–61. doi: 10.1111/1475-6773.12264. [DOI] [PMC free article] [PubMed] [Google Scholar]
- 14.Sirovich BE. How to feed and grow your health care system: comment on “The cost of satisfaction”. Arch Intern Med. 2012;172:411–3. doi: 10.1001/archinternmed.2012.62. [DOI] [PubMed] [Google Scholar]
- 15.Agency for Healthcare Research and Quality. Medical Expenditure Panel Survey. Available at: https://www.ahrq.gov/cpi/about/otherwebsites/meps.ahrq.gov/index.html. Accessed 24 Jan 2019.
- 16.Agency for Healthcare Research and Quality. MEPS-HC Response Rates by Panel. Available at: https://meps.ahrq.gov/survey_comp/hc_response_rate.jsp. Accessed 24 Jan 2019.
- 17.Agency for Healthcare Research and Quality. CAHPS. Surveys and tools to advance patient-centered care. Available at: https://www.ahrq.gov/cahps/index.html. Accessed 24 Jan 2019.
- 18.Hargraves JL, Hays RD, Cleary PD. Psychometric properties of the Consumer Assessment of Health Plans Study (CAHPS) 2.0 adult core survey. Health Serv Res. 2003;38(6, pt 1):1509–27. doi: 10.1111/j.1475-6773.2003.00190.x. [DOI] [PMC free article] [PubMed] [Google Scholar]
- 19.Agency for Healthcare Research and Quality. MEPS HC-181 2015 full year consolidated data file. Available at: https://meps.ahrq.gov/data_stats/download_data/pufs/h181/h181doc.pdf. Accessed 24 Jan 2019.
- 20.Crow R, Gage H, Hampson S, et al. The measurement of satisfaction with healthcare: implications for practice from a systematic review of the literature. Health Technol Assess. 2002;6:1–244. doi: 10.3310/hta6320. [DOI] [PubMed] [Google Scholar]
- 21.Xiao H, Barber JP. The effect of perceived health status on patient satisfaction. Value Health. 2008;11:719–25. doi: 10.1111/j.1524-4733.2007.00294.x. [DOI] [PubMed] [Google Scholar]
- 22.DeSalvo KB, Fan VS, McDonell MB, Fihn SD. Predicting mortality and healthcare utilization with a single question. Health Serv Res. 2005;40:1234–46. doi: 10.1111/j.1475-6773.2005.00404.x. [DOI] [PMC free article] [PubMed] [Google Scholar]
- 23.Dorr DA, Jones SS, Burns L, Donnelly SM, Brunker CP, Wilcox A, et al. Use of health-related, quality-of-life metrics to predict mortality and hospitalizations in community-dwelling seniors. J Am Geriatr Soc. 2006;54:667–73. doi: 10.1111/j.1532-5415.2006.00681.x. [DOI] [PubMed] [Google Scholar]
- 24.Woolhandler S, Himmelstein DU. The relationship of health insurance and mortality: is lack of insurance deadly? Ann Intern Med. 2017;167:424–31. doi: 10.7326/M17-1403. [DOI] [PubMed] [Google Scholar]
- 25.Galea S, Tracy M, Hoggatt KJ, Dimaggio C, Karpati A. Estimated deaths attributable to social factors in the United States. Am J Public Health. 2011;101:1456–65. doi: 10.2105/AJPH.2010.300086. [DOI] [PMC free article] [PubMed] [Google Scholar]
- 26.Fenelon A. Geographic divergence in mortality in the United States. Popul Dev Rev. 2013;39:611–34. doi: 10.1111/j.1728-4457.2013.00630.x. [DOI] [PMC free article] [PubMed] [Google Scholar]
- 27.U.S. Department of Health and Human Services. U.S. federal poverty guidelines used to determine financial eligibilty for certain federal programs. Available at: https://aspe.hhs.gov/poverty-guidelines. Accessed 24 Jan 2019.
- 28.Ware J, Jr., Kosinski M, Keller SD. A 12-Item Short-Form Health Survey: construction of scales and preliminary tests of reliability and validity. Med Care 1996;34:220–33. [DOI] [PubMed]
- 29.Zhang Y, Rohrer J, Borders T, Farrell T. Patient satisfaction, self-rated health status, and health confidence: an assessment of the utility of single-item questions. Am J Med Qual. 2007;22:42–9. doi: 10.1177/1062860606296329. [DOI] [PubMed] [Google Scholar]
- 30.Machlin SR. Medical Expenditure Panel Survey Household Component statistical estimation issues. Available at: https://apha.confex.com/apha/135am/recordingredirect.cgi/id/18758. Accessed 24 Jan 2019.
- 31.Kirkwood TB. Deciphering death: a commentary on Gompertz (1825) ‘On the nature of the function expressive of the law of human mortality, and on a new mode of determining the value of life contingencies’. Philos Trans R Soc Lond Ser B Biol Sci 2015;370. [DOI] [PMC free article] [PubMed]
- 32.Agency for Healthcare Research and Quality. Instructions for analyzing data from CAHPS® Surveys: using the CAHPS Analysis Program Version 4.1. Available at: https://www.ahrq.gov/sites/default/files/wysiwyg/cahps/surveys-guidance/helpful-resources/analysis/2015-instructions-for-analyzing-data.pdf. Accessed 24 Jan 2019.
- 33.Alberts SC, Archie EA, Gesquiere LR, Altmann J, Vaupel JW, Christensen K. 15. The male-female health-survival paradox: a comparative perspective on sex differences in aging and mortality. In: Weinstein M, Lane MA, editors. Sociality, hierarchy, health: comparative biodemography: a collection of papers. Washington, D.C.: The National Academies Press; 2014. [PubMed] [Google Scholar]
- 34.Hibbard JH, Cunningham PJ. How engaged are consumers in their health and health care, and why does it matter? Center for Health System Change, Research Brief No. 8. Available at: http://www.hschange.org/CONTENT/1019/. Accessed 24 Jan 2019. [PubMed]
- 35.National Center for Healthcare Statistics. Ambulatory care use and physician office visits. Available at: https://www.cdc.gov/nchs/fastats/physician-visits.htm. Accessed 24 Jan 2019.
- 36.Viera AJ, Pathman DE, Garrett JM. Adults’ lack of a usual source of care: a matter of preference? Ann Fam Med. 2006;4:359–65. doi: 10.1370/afm.557. [DOI] [PMC free article] [PubMed] [Google Scholar]
- 37.Pinkhasov RM, Wong J, Kashanian J, et al. Are men shortchanged on health? Perspective on health care utilization and health risk behavior in men and women in the United States. Int J Clin Pract. 2010;64:475–87. doi: 10.1111/j.1742-1241.2009.02290.x. [DOI] [PubMed] [Google Scholar]
- 38.Anhang Price R, Elliott MN, Zaslavsky AM, et al. Examining the role of patient experience surveys in measuring health care quality. Med Care Res Rev. 2014;71:522–54. doi: 10.1177/1077558714541480. [DOI] [PMC free article] [PubMed] [Google Scholar]
- 39.Piper LE. Patients are not always rational: the leadership challenge to improve patient satisfaction scores. Health Care Manag. 2010;29:233–40. doi: 10.1097/HCM.0b013e3181e93291. [DOI] [PubMed] [Google Scholar]
- 40.Mehta SJ. Patient satisfaction reporting and its implications for patient care. AMA J Ethics. 2015;17:616–21. doi: 10.1001/journalofethics.2015.17.7.ecas3-1507. [DOI] [PubMed] [Google Scholar]
- 41.American Academy of Family Physicians. AAFP takes on patient experience survey issues. Available at: https://www.aafp.org/news/government-medicine/20160816patientsatisfaction.html. Accessed 24 Jan 2019.
- 42.Henry SG, Bell RA, Fenton JJ, Kravitz RL. Communication about chronic pain and opioids in primary care: impact on patient and physician visit experience. Pain. 2017. [DOI] [PMC free article] [PubMed]
- 43.Anagnostopoulos F, Liolios E, Persefonis G, Slater J, Kafetsios K, Niakas D. Physician burnout and patient satisfaction with consultation in primary health care settings: evidence of relationships from a one-with-many design. J Clin Psychol Med Settings. 2012;19:401–10. doi: 10.1007/s10880-011-9278-8. [DOI] [PubMed] [Google Scholar]
- 44.Ha JF, Longnecker N. Doctor-patient communication: a review. Ochsner J. 2010;10:38–43. [PMC free article] [PubMed] [Google Scholar]
- 45.Allison P. Logistic Regression for Rare Events. Available at: http://statisticalhorizons.com/logistic-regression-for-rare-events. Accessed 24 Jan 2019.
Associated Data
This section collects any data citations, data availability statements, or supplementary materials included in this article.
Supplementary Materials
(DOCX 26 kb)