

Abstract
Background
Individuals with limited English proficiency (LEP) have worse healthcare access and report lower quality of care compared to individuals who are proficient in English. Policy efforts to improve patient-provider communication for LEP individuals have been going on for decades but linguistic disparities persist.
Objective
To describe trends in patient-provider communication by limited English proficiency (LEP) from 2006 to 2015.
Design
We estimated interrupted time series models for three measures of patient-provider communication, testing for differences in both means (intercepts) and trends (slopes) before and after 2010 and differences in differences by English proficiency.
Participants
A nationally representative sample of the US non-institutionalized population with at least one office-based medical visit from the 2006–2015 Medical Expenditure Panel Survey (N = 27,001).
Main Measures
Patient-provider communication is measured with three variables indicating whether individuals reported that their providers always explained things in a way that was easy to understand, showed respect for what they had to say, and listened carefully.
Key Results
Although patient-provider communication improved for all groups over the study period, before 2010, it was getting worse among LEP individuals and disparities in patient-provider communication were widening. After 2010, patient-provider communication improved for LEP individuals and language disparities by English proficiency either narrowed or remained the same. For example, between 2006 and 2010, the percent of LEP individuals reporting that their provider explained things clearly declined by, on average, 1.4 percentage points per year (p value = 0.102); after 2010, it increased by 3.0 percentage points per year (p value = 0.003).
Conclusions
Our study sheds light on trends in patient-provider communication before and after 2010, a year that marked substantial efforts to reform the US healthcare system. Though patient-provider communication among LEP individuals has improved since 2010, linguistic disparities persist and constitute a formidable challenge to achieving healthcare equity, a long-standing US policy goal.
Electronic supplementary material
The online version of this article (10.1007/s11606-018-4757-3) contains supplementary material, which is available to authorized users.
KEY WORDS: limited English proficiency, disparities, healthcare policy, patient-provider communication
INTRODUCTION
In the USA, 25.1 million residents do not speak English well.1 Individuals with limited English proficiency (LEP) are less likely to have insurance, see a doctor, and obtain high-quality care compared to their English-proficient (EP) counterparts.2 Even among insured individuals, LEP individuals may find it more difficult to communicate effectively with their providers regarding their health conditions and to understand their health insurance coverage,3, 4 resulting in access problems and reduced quality of healthcare. In this study, we use data from the Medical Expenditure Panel Survey to examine disparities between LEP and English-proficient individuals in patient-provider communication between 2006 and 2015 with a focus on whether changes occurred after 2010, a year that marked substantial efforts to reform the US healthcare system.
Background
There is a well-established literature on healthcare disparities by English proficiency, focused mostly on access to and utilization of healthcare.5 Prior studies find LEP individuals have lower rates of insurance and healthcare utilization.6–8 One study of older adults in California found that LEP individuals had worse access to healthcare and worse physical and mental health compared to their EP (English-proficient) counterparts.9 Another study found that language barriers were associated with poor comprehension and less positive patient interactions, even when controlling for several provider variables.3 Although LEP individuals are disproportionately immigrant, non-white, and low-income and these characteristics may account for some of the differences in healthcare access and quality, LEP has a negative impact independent of these factors and is often a mediator of disparities.4, 5
Efforts to improve patient-provider communication have been ongoing for decades, as clinicians, researchers, and policymakers have made significant efforts to eliminate disparities.10–13 Federal policy attempts at reducing disparities for LEP individuals began with the Civil Rights Act of 1965, which made it illegal to discriminate on the basis of foreign-born status.14This legislation prohibits discrimination based on national origin, thus providing equal protection for immigrants.15 Under this law, healthcare providers receiving federal funds are required to provide equal access for LEP patients.16 In 2000, Executive Order 13166 provided additional guidelines for ensuring meaningful access to services for individuals with LEP.17 Additionally, the National Culturally and Linguistically Appropriate Service (CLAS) standards were developed with the aim of helping providers implement culturally and linguistically appropriate health services and, ultimately, reduce disparities. Most states have taken action to implement CLAS standards.18
Despite these attempts to reduce LEP disparities in healthcare, gaps persisted and were again addressed in the Patient Protection and Affordable Care Act (ACA).19 This legislation contained numerous interventions aimed at increasing access and use for historically marginalized groups, such as immigrants and low-income and LEP individuals. For example, one provision requires most insurers (including private insurers) serving counties with large LEP populations to provide translations of key health insurance documents, including summaries of benefits and coverage, claim instructions, and websites and mailed notices.20, 21 Another set of interventions provides funding for outreach and assistance for low-income programs and community health centers. Additionally, provisions aimed at addressing health disparities, nondiscrimination, and state grants to healthcare providers serving medically underserved communities were included. LEP individuals would benefit from these programs, as they are disproportionately likely to be poor and face access barriers. In addition, the 2010 health reforms revisited the National CLAS standards, developing a “blueprint” of 15 goals together with specific strategies for implementation aimed at helping providers and healthcare organizations provide higher quality care to LEP individuals.
The ACA also contained interventions aimed at increasing health literacy, and many of those provisions were targeted to improve patient-provider communication. These include funding for training and outreach, specifically including grant funding for training in cultural competence, improved patient-provider communication, and shared decision-making for all patients. Other provisions included community health grants and diversity training grants. Finally, workforce grants provided incentives and support for healthcare professionals serving minority, rural, and special populations and included many references to improving culturally and linguistically appropriate care. 20
While all of the ACA provisions outlined above could have had a positive effect on patient-provider communication among LEP individuals, it is important to note that the ACA’s overall impact cannot be attributed to any single provision or set of provisions at a single point in time. Rather, the ACA’s overall impact on patient-provider communication among LEP individuals reflects the direct and indirect effects of many separate provisions beginning in 2010 and continuing through 2014.
At the same time the policy initiatives outlined above were being designed and implemented, countervailing policies and social trends seemingly unrelated to healthcare may have exacerbated disparities by LEP status. Efforts to enforce immigration laws have been significantly increasing in the past decade. For example, during the years 2001 and 2008, the level of law enforcement raids and deportations increased substantially and remained at historic highs from 2008 to 2014.22 Individuals with LEP often live in communities with high exposure to racial, ethnic, and nationality-based tensions. Immigrant populations (and second-generation residents) are known to respond to major shifts in immigrant policing policies by avoiding healthcare institutions where they fear discrimination based on national origin.23, 24 Prior studies find that perceived discrimination is associated with lower quality patient-provider communication.25
Current Study Contribution
To date, there is little evidence on whether recent health reforms were associated with improvements in patient-provider communication or with a narrowing of linguistic disparities for individuals with LEP. To begin to fill this gap, we analyzed trends in several measures of patient-provider communication by LEP status both before and after 2010, using nationally representative data.
METHODS
Data
Our study used individual-level data from the Household Component of the Medical Expenditure Panel Survey (MEPS) 2006–2015. The MEPS is a nationally representative household survey of the US non-institutionalized population that collects information on healthcare access, use, expenditures, and experiences with medical providers.26, 27 All of our estimates were weighted and standard errors adjusted using the Taylor linearization complex survey design commands available in Stata 15.0.
Variables
Our main outcome variables measure patient-provider communication and were all reported on a self-administered paper questionnaire. Patient-provider communication measures were taken from the health plan version of the Consumer Assessment of Healthcare Providers and Systems (CAHPS) program, an AHRQ sponsored family of survey instruments designed to measure the quality of care from the consumer’s perspective.28 All of the CAHPS® variables refer to events experienced in the last 12 months. Individuals who reported at least one visit to a healthcare provider were asked how often a “doctor or other health provider” explained things in a way that was easy to understand, showed respect for what they had to say, and listened carefully. All responses were recorded using dichotomous variables that identified individuals who responded “always,” versus “never,” “sometimes,” or “usually.” We categorized individuals as having “limited English proficiency” if the interview was conducted in a language other than English. The MEPS interview was offered in Spanish or English; for other languages, interpreters were used.
Analytic Approach
To evaluate how disparities in patient-provider communication by LEP status changed following passage of health reform in 2010, we estimated an interrupted time series model for each patient-provider communication outcome. This approach enabled us to assess whether there was an immediate shift in the annual mean of an outcome variable (i.e., model intercept) in the year health reform was enacted (2010) and whether the time trend or “slope” in each outcome variable differed before and after 2010. By including both LEP individuals and English-proficient individuals in the same models, we further tested whether pre-post differences themselves differ by LEP status. All models were estimated both with and without the sociodemographic and health variables shown in Table 1 as control variables. Adjusted and unadjusted results differed little from one another.
Table 1.
Means (Standard Errors) for All Variables by English Proficiency, 2015
| EP | LEP | Difference | |||||
|---|---|---|---|---|---|---|---|
| % | SE | % | SE | % | SE | ||
| Patient-provider communication | |||||||
| Doctors always explained things clearly | 66.54% | 0.58% | 58.24% | 1.86% | 8.29% | 1.90% | * |
| Doctors always showed respect | 70.08% | 0.67% | 63.65% | 1.58% | 6.43% | 1.69% | * |
| Doctors always listened carefully | 66.39% | 0.72% | 56.83% | 1.79% | 9.56% | 1.91% | * |
| Sociodemographic and health characteristics | |||||||
| Mean age | 38.48 | 0.32 | 32.03 | 0.45 | 6.45 | 0.52 | * |
| Sex (male) | 48.69% | 0.28% | 51.28% | 0.60% | − 2.59% | 0.67% | * |
| Race and ethnicity | |||||||
| NH White | 66.19% | 1.08% | 2.01% | 0.42% | 64.18% | 1.11% | * |
| NH Black | 13.49% | 0.69% | 0.29% | 0.13% | 13.20% | 0.70% | * |
| Hispanic | 10.36% | 0.62% | 97.52% | 0.45% | − 87.17% | 0.83% | * |
| NH Asian | 5.75% | 0.55% | 0.14% | 0.09% | 5.61% | 0.56% | * |
| NH Other | 4.21% | 0.45% | 0.03% | 0.03% | 4.18% | 0.45% | |
| Income as a percent of poverty | |||||||
| < 100% | 12.09% | 0.50% | 27.50% | 1.88% | − 15.40% | 1.85% | * |
| 100–125% | 3.97% | 0.25% | 8.89% | 0.75% | − 4.92% | 0.76% | * |
| 125–200% | 12.86% | 0.41% | 23.73% | 1.11% | − 10.87% | 1.16% | * |
| 200–400% | 28.47% | 0.61% | 30.16% | 2.07% | − 1.69% | 2.07% | |
| > 400% | 42.60% | 0.83% | 9.72% | 1.01% | 32.89% | 1.21% | * |
| Self-reported health | |||||||
| Excellent | 34.58% | 0.57% | 33.03% | 1.20% | 1.55% | 1.25% | |
| Very good | 32.57% | 0.43% | 20.66% | 0.82% | 11.91% | 0.90% | * |
| Good | 22.40% | 0.45% | 30.45% | 1.05% | − 8.06% | 1.12% | * |
| Fair | 7.80% | 0.26% | 13.39% | 0.66% | − 5.59% | 0.68% | * |
| Poor | 2.65% | 0.13% | 2.46% | 0.24% | 0.19% | 0.29% | |
| Full-year insurance coverage | |||||||
| Any private | 70.23% | 0.75% | 31.30% | 1.56% | 38.93% | 1.60% | * |
| Public only | 23.28% | 0.70% | 42.94% | 1.23% | − 19.66% | 1.32% | * |
| Uninsured all year | 6.49% | 0.24% | 25.76% | 1.06% | − 19.28% | 1.05% | * |
| Resident of an MSA | 85.06% | 1.32% | 92.93% | 2.66% | − 7.87% | 3.22% | * |
| N | 23,029 | 3972 | |||||
*Difference between LEP and the non-LEP population is statistically significant at p < 0.05
Source: Medical Expenditure Panel Survey (2015)
We first provided a description of differences in the patient-provider communication measures by LEP status with the most recent year of MEPS available. We also reported differences in socioeconomic and health status measures by LEP status. Finally, we reported results from our time series analysis, showing graphical representations of the unadjusted trends in the patient-provider communication variables between 2006 and 2015. Graphical representations of the adjusted results were similar to those that were unadjusted so we elected to include those in an online Appendix.
RESULTS
We found that in 2015, individuals with LEP were less likely to report that doctors always listened carefully to them, showed respect for what they had to say, and explained things so that they could understand compared to their English-proficient counterparts (Table 1). Individuals with LEP also differed from their English-proficient counterparts on all demographic, socioeconomic, and health status variables. On average, individuals with LEP were younger, more likely to be minority, less likely to report excellent or very good health, and more often poor compared to their English-proficient counterparts.
Results from the interrupted time series analysis suggest that the enactment of the ACA was associated with small or no immediate change in the outcome measures; the shift in intercepts in 2010 was not significant for either the LEP or English-proficient group in any of the patient-provider variables, regardless of whether the sociodemographic and health variables were included in the models (Tables 2 and 3). However, all three of the outcome variables show a similar pattern with respect to pre- and post-2010 trends (or slopes); disparities by English proficiency were widening before 2010 but narrowing thereafter. For example, between 2006 and 2010, the percent of LEP individuals reporting that their provider explained things clearly declined by, on average, 1.4 percentage points per year (p value = 0.102); after 2010, it increased by 3.0 percentage points per year (p value = 0.003) (Table 2). This indicates that LEP individuals were not benefiting from pre-ACA efforts to improve patient-provider communication or access to care. This may be a reflection of increases in deportations and increased immigration enforcement, as well as deteriorating social and community conditions for LEP populations.
Table 2.
Results from Linear Interrupted Time Series Models Predicting Patient-Provider Communication Measures
| Limited English proficiency (LEP) | English-proficient (EP) | ||||||
|---|---|---|---|---|---|---|---|
| Pre | Post | Diff | Pre | Post | Diff | DD | |
| Predicted probability of answering “Always” | |||||||
| How often did health providers explain things in a way that was easy to understand? | 0.474 | 0.501 | 0.027 | 0.594 | 0.611 | 0.017 | 0.010 |
| p value | 0.000 | 0.000 | 0.344 | 0.000 | 0.000 | 0.023 | 0.738 |
| How often did health providers listen carefully to you? | 0.476 | 0.500 | 0.024 | 0.626 | 0.627 | 0.002 | 0.022 |
| p value | 0.000 | 0.000 | 0.394 | 0.000 | 0.000 | 0.840 | 0.450 |
| How often did health providers show respect for what you had to say? | 0.532 | 0.559 | 0.028 | 0.656 | 0.656 | −0.001 | 0.028 |
| p value | 0.000 | 0.000 | 0.324 | 0.000 | 0.000 | 0.940 | 0.337 |
| Annual change in the predicted probability of answering “Always” | |||||||
| How often did health providers explain things in a way that was easy to understand? | − 0.016 | 0.017 | 0.033 | − 0.004 | 0.012 | 0.016 | 0.017 |
| p value | 0.064 | 0.001 | 0.001 | 0.139 | 0.000 | 0.000 | 0.096 |
| How often did health providers listen carefully to you? | − 0.015 | 0.015 | 0.030 | 0.011 | 0.008 | − 0.003 | 0.033 |
| p value | 0.071 | 0.002 | 0.001 | 0.000 | 0.000 | 0.348 | 0.001 |
| How often did health providers show respect for what you had to say? | − 0.016 | 0.018 | 0.034 | 0.010 | 0.010 | 0.000 | 0.034 |
| p value | 0.049 | 0.000 | 0.000 | 0.000 | 0.000 | 0.908 | 0.000 |
Source: Medical Expenditure Panel Survey 2006–2015
Table 3.
Results from an Interrupted Time Series Model Predicting Patient-Provider Communication Measures, Adjusted
| Limited English proficiency (LEP) | English-proficient (EP) | ||||||
|---|---|---|---|---|---|---|---|
| Pre | Post | Difference | Pre | Post | Difference | DD | |
| Predicted probability of answering “Always” | |||||||
| How often did health providers explain things in a way that was easy to understand? | 0.596 | 0.621 | 0.025 | 0.668 | 0.686 | 0.018 | 0.007 |
| p value | 0.000 | 0.000 | 0.377 | 0.000 | 0.000 | 0.016 | 0.820 |
| How often did health providers listen carefully to you? | 0.578 | 0.598 | 0.020 | 0.682 | 0.684 | 0.003 | 0.017 |
| p value | 0.000 | 0.000 | 0.464 | 0.000 | 0.000 | 0.724 | 0.549 |
| How often did health providers show respect for what you had to say? | 0.644 | 0.669 | 0.025 | 0.720 | 0.720 | 0.000 | 0.024 |
| p value | 0.000 | 0.000 | 0.364 | 0.000 | 0.000 | 0.953 | 0.397 |
| Annual change in predicted probability | |||||||
| How often did health providers explain things in a way that was easy to understand? | − 0.014 | 0.016 | 0.030 | − 0.004 | 0.011 | 0.015 | 0.015 |
| p value | 0.102 | 0.002 | 0.003 | 0.115 | 0.000 | 0.000 | 0.162 |
| How often did health providers listen carefully to you? | − 0.013 | 0.014 | 0.027 | 0.010 | 0.007 | − 0.003 | 0.030 |
| p value | 0.119 | 0.005 | 0.005 | 0.000 | 0.000 | 0.291 | 0.003 |
| How often did health providers show respect for what you had to say? | − 0.014 | 0.017 | 0.031 | 0.010 | 0.009 | − 0.001 | 0.031 |
| p value | 0.081 | 0.000 | 0.001 | 0.000 | 0.000 | 0.800 | 0.001 |
Source: Medical Expenditure Panel Survey, 2006–2015. These estimates come from a model that includes socio-demographic and health characteristics in Table 1 on control variables
Figure 1 illustrates the results for whether doctors explained things clearly. In 2006, 62% of individuals proficient in English and 58% of those with LEP reported that doctors explained things in a way they could understand. By 2010, this percentage had dropped to 51% for those with LEP but increased to 63% for those proficient in English, resulting in a sizable and statistically significant difference of 12 percentage points between LEP and EP patients. After 2010, both groups experienced increases in the percent reporting that doctors explained things clearly, but the increase was steeper for LEP individuals, resulting in a narrowing of the language gap to four percentage points. The pre-post difference in the slopes was statistically significant among the LEP group, while it was not in the English-proficient group; the difference in difference in slopes is itself statistically significant.
Figure 1.
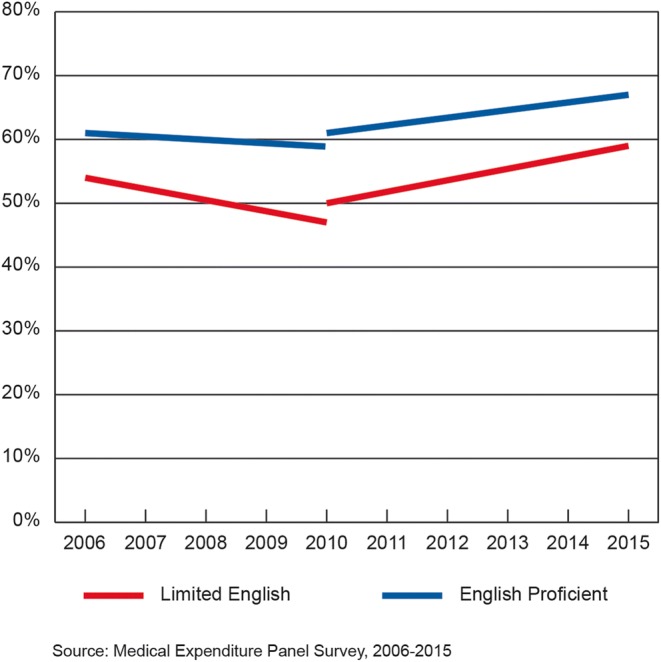
Predicted percentage of individuals reporting their medical provider always explains things in a way they can understand by English proficiency, 2006–2015. Source: Medical Expenditure Panel Survey, 2006–2015.
A similar pattern emerges for the percent of people who reported that doctors listened carefully to them (Fig. 2) and the percent who reported that doctors showed respect for what they had to say (Fig. 3). Between 2006 and 2010, the percent of LEP people who said that doctors always listened carefully and showed respect declined from 63 to 49% and from 66 to 54%, respectively. By 2015, the percentages had increased to 61% and 67%, respectively. Among the EP, there was no significant change in these variables over the study period. As with the percent of people reporting that doctors explained things clearly to them, the difference in differences was statistically significant for both these variables. Models adjusted for sociodemographic and health variables show a similar pattern of results (see online Appendix).
Figure 2.
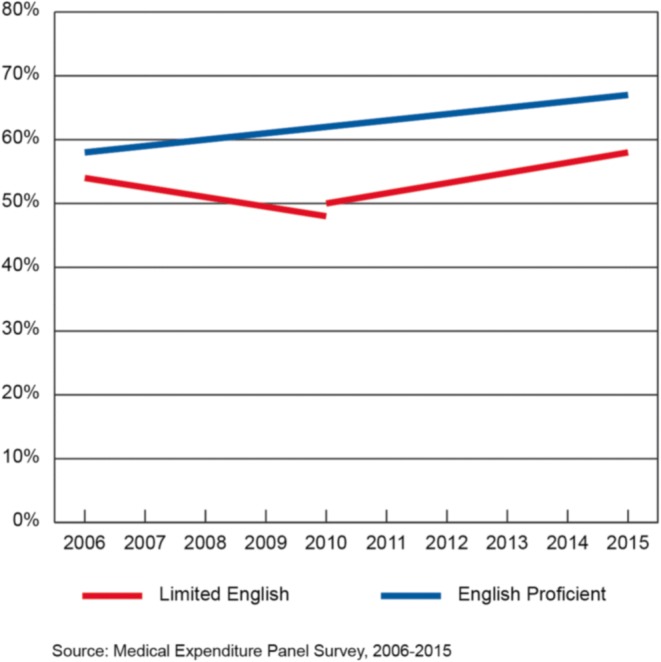
Predicted percentage of individuals reporting their provider always listened to them by English proficiency, 2006–2015. Source: Medical Expenditure Panel Survey, 2006–2015.
Figure 3.
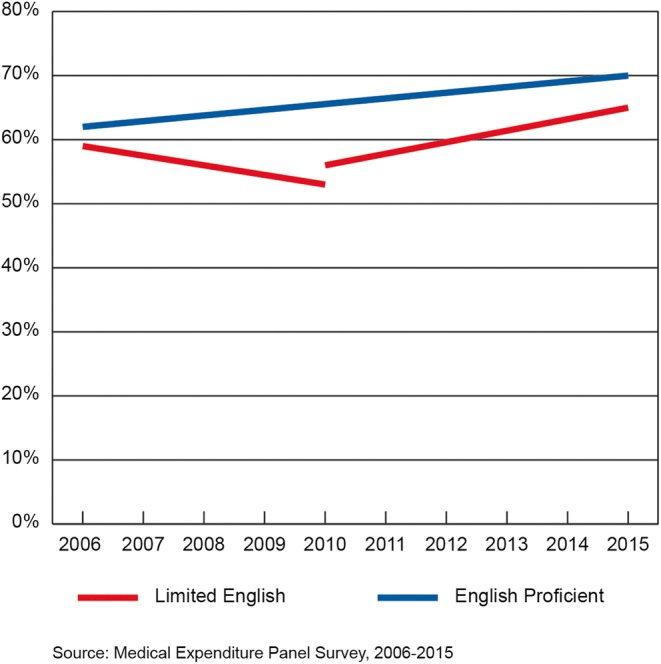
Predicted percentage of individuals reporting their medical provider always shows respect by English proficiency, 2006–2015. Source: Medical Expenditure Panel Survey, 2006–2015.
DISCUSSION
Despite decades of efforts to improve access to and quality of healthcare for those with limited English proficiency, patient-provider communication among those with LEP remains a concern for federal and state healthcare policy.13, 16 Little is known about how patient-provider communication changed or did not change following the historic healthcare reforms in 2010. Our results show that non-LEP individuals were steadily improving on three patient-provider communication measures. However, improvements were uneven over the study period for LEP individuals; disparities in patient-provider communication by English proficiency were widening prior to 2010 but narrowing thereafter. Although we cannot infer causation, this could reflect several provisions of the health reforms beginning in 2010 that were aimed at closing disparities by English language proficiency. It is important to note that, despite the narrowing of language disparities after 2010, LEP individuals were still at a significant disadvantage compared to their English-proficient counterparts in 2015 on the measures examined in this study.
Limitations
One limitation is that proficiency in English cannot be determined unambiguously. We used the language of interview, which is likely a conservative measure of language limitations. The MEPS instrument does have items that ask respondents to report their “ability” or “comfort level” with English, but these questions changed substantially over the study period, which is problematic for a time series analysis.
Another limitation of this study is that results cannot be considered estimates of the impact of a specific policy intervention but, rather, represent the total effect of all changes during the study period. Unlike other interventions such as the Insurance Marketplace Exchanges and the Medicaid expansion, LEP interventions were multifaceted and had varying implementation dates. Consequently, we view our findings as evidence of significant improvement in patient-provider communication among LEP individuals after 2010; however, we cannot say with certainty which aspect drove the change. Our findings can, nonetheless, inform and motivate future research on how patient-provider communication among LEP individuals has changed and it might be further improved. Patient-provider interaction is a difficult but very important phenomenon to study, and the findings presented in this study provide a broad, national view of trends.
Conclusion
Improving communication between patients and their healthcare providers remains an important and complex problem. By using nationally representative trend data from MEPS, we showed that patient-provider communication improved for all groups over the entire study period, but that the trajectory of improvement for LEP individuals was not uninformed, beginning only after 2010. Our findings highlight the importance of provider training in the areas of culturally and linguistically relevant care standards (CLAS standards), as they remain relevant for providers in areas that serve LEP populations.18 CLAS training should not focus exclusively on providers who serve poor or uninsured populations as we found that neither income nor insurance coverage could account for the LEP disadvantage. Because of language difficulties and legal status, many LEP individuals remain vulnerable despite policy efforts as they are less likely to be aware of their rights under equal protection laws and other policies designed to improve patient-provider communication compared to EP individuals.16–18
The population of LEP patients is large and growing1, 22 making it important that research continue to monitor disparities in patient-provider communication by English language proficiency. It is unclear whether the improvements in patient-provider communication among LEP individuals documented in this study permanent, or whether they stall as funding for community health centers, expanded insurance coverage, and other ACA, components expire or are modified. As healthcare reforms are designed and considered, determining which policies were effective at closing disparities by English proficiency is critical. Our findings provide an important baseline for future studies on patient-provider communication among LEP individuals.
Electronic Supplementary Material
(DOCX 24 kb)
Compliance with Ethical Standards
Conflict of Interest
The authors declare that they do not have a conflict of interest.
Disclaimer
The findings and conclusions in this paper are solely those of the authors and do not necessarily represent the views of the Department of Health and Human Services or the Agency for Healthcare Research and Quality.
Contributor Information
Terceira A. Berdahl, Phone: 301-427-1687, Email: Terceira.berdahl@ahrq.hhs.gov.
James B. Kirby, Email: James.Kirby@ahrq.hhs.gov.
References
- 1.Zong J, Batalova J. The Limited English proficient population in the United States. Washington DC: Migration policy institute; 2015. [Google Scholar]
- 2.Borders T, Brannon-Goedeke A, Arif A, Xu K. Parents’ reports of children’s medical care access: are there Mexican-American versus non-Hispanic white disparities? Med Care. 2004;42:884–92. doi: 10.1097/01.mlr.0000135818.47100.8c. [DOI] [PubMed] [Google Scholar]
- 3.Wilson E, Chen AH, Grumbach K, Wang F, Fernandez A. Effects of limited English proficiency and physician language on health care comprehension. J Gen Intern Med. 2005;20:800–806. doi: 10.1111/j.1525-1497.2005.0174.x. [DOI] [PMC free article] [PubMed] [Google Scholar]
- 4.Woloshin S, Schwartz LM, Katz SJ et al. Is language a barrier to the use of preventive care services? J Gen Intern Med. 1997; 12:472–477. [DOI] [PMC free article] [PubMed]
- 5.Fiscella K, Franks P, Doescher MP, et al. Disparities in health care by race, ethnicity, and language among the insured: findings from a national sample. Med Care. 2002;40:52–59. [DOI] [PubMed]
- 6.Gonzales G. State estimates of limited English proficiency (LEP) by health insurance status. State Health Access Data Assistance Center Brief 40; 2014. May 2014.
- 7.Brach C, Chevarley FM. Demographics and health care access and utilization of limited-English-proficient and English-proficient Hispanics. Research Findings No. 28. Rockville: Agency for Healthcare Research and Quality; 2008. [Google Scholar]
- 8.Gonzales-Barrera A, Krogstad JM. U.S. immigrant deportations declined in 2014, but remain near record high. Pew Research Center, Washington DC. 2016.
- 9.Ponce NA, Hays RD, Cunningham WE. Linguistic disparities in health care access and health status among older adults. J Gen Intern Med. 2006;21(7):786–791. doi: 10.1111/j.1525-1497.2006.00491.x. [DOI] [PMC free article] [PubMed] [Google Scholar]
- 10.Nutbeam Health literacy as a public health goal: a challenge for contemporary health education and communication strategies into the 21st century. Health Promot Int. 2000;15(3):259–267. doi: 10.1093/heapro/15.3.259. [DOI] [Google Scholar]
- 11.Brach C, Fraser I, Paez K. Crossing the language chasm. Health Affairs. 2005;24(2):424–434. doi: 10.1377/hlthaff.24.2.424. [DOI] [PMC free article] [PubMed] [Google Scholar]
- 12.Nielsen-Bohlman L, Panzer AM, Kindig DA, editors. Health literacy: a prescription to end confusion. Washington (DC): National Academies Press (US); 2004. p. 3. [PubMed] [Google Scholar]
- 13.Moy E, Freeman W. Federal investments to eliminate racial/ethnic health-care disparities. Public Health Rep. 2014;129(Suppl 2):62–70. doi: 10.1177/00333549141291S212. [DOI] [PMC free article] [PubMed] [Google Scholar]
- 14.Youdelman M. The medical tongue: U.S. laws and policies on language access. Health Aff March/April; 2008. [DOI] [PubMed]
- 15.Civil Rights Act 65 Fed. Reg. 50,121, August 16, 2000.
- 16.The President Executive Order 13166. Improving access to services for persons with limited english proficiency. Fed Reg 2000:65, No. 159 Wednesday, August 16, 2000 Title 3.
- 17.US Department of Health and Human Services. Section 1557 of the patient protection and affordable care act Washington, DC: HHS. 2010, 2016. Available at: https://www.hhs.gov/civil-rights/for-individuals/section-1557/index.html. Accessed 10 Sept 2018.
- 18.U.S. Department of Health and Human Services, Office of Minority Health . National standards for culturally and linguistically appropriate services in health and health care: compendium of state-sponsored national CLAS standards implementation activities. Washington, DC: U.S. Department of Health and Human Services; 2016. [Google Scholar]
- 19.US Department of Health and Human Services Office of the Secretary 45 CFR Part 92 Nondiscrimination in health programs and activities: final rule. Final rule. Fed Reg. 2016;81(96):31375–473. [PubMed]
- 20.Somers A, Mahadevan R. Health literacy implications of the affordable care act. Center for Health Care Strategies, Inc. 2010.
- 21.Technical guidance: guidance and population data for exchanges, qualified health plan issuers, and web-brokers to ensure meaningful access by limited-English proficient speakers under 45 CFR §155.205(c) and §156.250. Center for Medicare & Medicaid Services. March, 2016. https://www.cms.gov/CCIIO/Resources/Regulations-and-Guidance/Downloads/Language-access-guidance.pdf. Accessed 10 Sept 2018.
- 22.Hardy LJ, et al. A call for further research on the impact of state-level immigration policies on public health. Am J Public Health. 2012;102:1250–1253. doi: 10.2105/AJPH.2011.300541. [DOI] [PMC free article] [PubMed] [Google Scholar]
- 23.Sabo S, Lee AE. The spillover of US immigration policy on citizens and permanent residents of Mexican descent: how internalizing ‘illegality’ impacts public health in the borderlands. Front Public Health. 2015;155. [DOI] [PMC free article] [PubMed]
- 24.Hausmann L, Hannon M, Kresevic D, Hanusa B, Kwoh C, Ibrahim S. Impact of perceived discrimination in health care on patient provider communication. Med Care. 2011;49(7):626–633. doi: 10.1097/MLR.0b013e318215d93c. [DOI] [PMC free article] [PubMed] [Google Scholar]
- 25.Benjamins MR, Whitman S. Relationships between discrimination in health care and health care outcomes among four race/ethnic groups. J Behav Med. 2014;37:402. doi: 10.1007/s10865-013-9496-7. [DOI] [PubMed] [Google Scholar]
- 26.Additional information on the sample design for MEPS is available at https://meps.ahrq.gov/mepsweb. Accessed 10 Sept 2018.
- 27.Pew Research Center. Report: the rise of Asian Americans. 2013.
- 28.Agency for Healthcare Research and Quality, Rockville, MD. CAHPS measures of patient experience. Content last reviewed May 2017. http://www.ahrq.gov/cahps/consumer-reporting/measures/index.html. Accessed 10 Sept 2018.
Associated Data
This section collects any data citations, data availability statements, or supplementary materials included in this article.
Supplementary Materials
(DOCX 24 kb)