

Abstract
Objective
Although most patients recover from acute Q fever, around 20% develop Q fever fatigue syndrome (QFS), a debilitating fatigue syndrome that lasts at least 6 months. This study investigated transcriptional profiles of circulating monocytes and circulating cytokines as a subsequent mirror of myeloid cell function, 1 and 6 months after an acute Q fever infection.
Methods
Total RNA of circulating monocytes was collected from 11 acute Q fever patients and 15 healthy controls, matched for age (±5 years) and sex. Samples were collected at a median of 27 days (baseline, interquartile range, 15–35 days) after the infection and again 6 months thereafter. Transcriptome analysis was performed using RNA sequencing. Additionally, concentrations of circulating interleukin (IL)-10, IL-1β, IL-1Ra, and IL-6 were measured in serum.
Results
At baseline, acute Q fever patients clearly show a differential transcriptional program compared with healthy controls. This is still the case at follow-up, albeit to a lesser extent. At baseline, a significant difference in levels of circulating IL-10 (P = .0019), IL-1β (P = .0067), IL-1Ra (P = .0008), and IL-6 (P = .0003) was seen. At follow-up, this difference had decreased for IL-10 (P = .0136) and IL-1Ra (P = .0017) and had become nonsignificant for IL-1β (P = .1139) and IL-6 (P = .2792).
Conclusions
We show that an acute Q fever infection has a long-term effect on the transcriptional program of circulating monocytes and, therefore, likely their myeloid progenitor cells, as well as concentrations of circulating IL-10, IL-1β, IL-1Ra, and IL-6.
Keywords: cytokine, monocytes, Q fever, Q fever fatigue syndrome, transcriptome
This study shows that an acute Q fever infection has a long-lasting effect on the transcriptional program of circulating monocytes and, therefore, likely their myeloid progenitor cells as well as concentrations of circulating interleukin (IL)-10, IL-1β, IL-1Ra, and IL-6.
INTRODUCTION
Q fever is a zoonosis caused by the obligate intracellular Gram-negative bacterium Coxiella burnetii [1]. The bacterium mainly resides in animal reservoirs, such as cattle, goats, and sheep. The bacterium is shed in high numbers via birth products, urine, feces, and milk. Human infection usually occurs in outbreaks or endemic areas through inhalation of infected aerosols spread by the wind, or during at-risk veterinary or farming procedures [2]. Upon inhalation, it is thought that around 40% of patients develop a symptomatic infection (ie, acute Q fever), often presenting as a flu-like illness with fever and sometimes pneumonia or hepatitis [1]. Acute Q fever has an incubation period of 2 to 3 weeks and is usually treated with doxycycline 200 mg BID for 14 days despite it being an often self-limiting disease [1, 3]. During the infection, C. burnetii survives and replicates inside the phagolysosome of monocytes and macrophages it infects [1]. It has a pronounced effect on these cells as it is able to alter cellular processes (eg, vesicular trafficking, apoptosis, autophagy, and reactive oxygen species [ROS] and reactive nitrogen species [RNS] production) by implementing a Dot/Icm type IV secretion system once inside the modified phagolysosome [4, 5].
Despite clearing the initial infection, approximately 20% of acute Q fever patients develop Q fever fatigue syndrome (QFS), a debilitating post-infective fatigue syndrome that lasts for at least 6 months and often years after initial infection [6]. QFS should be differentiated from chronic Q fever, or C. burnetii persistent focalized infection, a deadly disease characterized by the persistence of C. burnetii in the human host, usually manifesting as endocarditis or infection of pre-existing aneurysms or vascular prostheses [7]. Q fever fatigue syndrome often coincides with concomitant musculoskeletal complaints, neurocognitive problems, sleeping problems, headaches, (night) sweats, frequently recurring upper respiratory tract infections, and mood disorders [6]. Like other post-infective fatigue syndromes, the exact etiology of QFS remains unclear. However, complaints, such as night sweats, musculoskeletal pain, and frequently recurring upper respiratory tract infections, suggest an active role for the immune system. Furthermore, previous studies have shown signs of altered cell-mediated immunity through the interferon (IFN)γ and interleukin (IL)-6 axis in these patients, even years after their initial infection [8–10]. Recently, it was found that monocytes and likely also myeloid progenitor cells are able to protract long-lasting immunologic memory (also termed “trained immunity”) following certain challenges, such as infectious agents and vaccines [11–13].
In order to increase our understanding of the long-term changes in the transcriptional and functional programming of myeloid cells during and after an acute Q fever infection, we investigated the transcriptomes of circulating monocytes in 11 acute Q fever patients at the time of infection and after 6 months. Complaints suggestive of QFS were monitored and circulating cytokine profiles were also determined. The results were compared with 15 age- and sex-matched healthy controls.
METHODS
Study Population
The study population consisted of 11 acute Q fever patients and 15 healthy controls that were matched for age (±5 years) and gender. At baseline, acute Q fever patients were diagnosed at the Australian Rickettsial Reference Laboratory based on their in-house serology (Immunofluorescence assay [IFA]). Serum samples of cases suspected for having an acute Q fever infection were sent in by physicians in Victoria (VIC) and New South Wales (NSW). If a sample showed positive immunoglobulin (Ig)M antibody titers in the absence or with low IgG antibody titers, the treating physician of that patient was contacted, informed of the study, and asked for the patient’s contact information. The patient was then contacted by telephone by the primary investigator (R.R.), informed of the study, and asked to participate. If the patient gave oral informed consent, the primary investigator visited the patient, acquired written informed consent, collected blood, and asked the patient to fill out the Checklist Individual Strength (CIS) questionnaire, subscale on fatigue severity, and Sickness Impact Profile-8 (SIP-8) questionnaire. Finally, a follow-up visit 6 months afterwards was planned at which the above described procedure was repeated and patients were determined to have acquired QFS or not according to the Dutch guideline on QFS, minus an extensive clinical evaluation of underlying somatic or psychiatric comorbidity [14].
Healthy controls (ie, colleagues who lived in the Geelong (VIC) or Launceston (Tasmania) area) were asked to participate by the primary investigator (R.R.) during the same time as the patients if they tested negative on Q fever serology and had a score < 35 on the subscale fatigue severity of the CIS questionnaire and a score < 450 on the SIP-8 questionnaire both at baseline and at follow-up. All participants provided written informed consent and the study was approved by the Barwon Health Human Research Ethics Committee (#16/156).
Monocyte Isolation
A total of 40 ml EDTA blood was collected from each patient for peripheral blood mononuclear cell (PBMC) isolation, which was performed by dilution of blood in phosphate-buffered saline (PBS) (1:1), and fractions were separated by density centrifugation over Ficoll-Paque (Ficoll-Paque Plus; GE Healthcare, Zeist, the Netherlands). Cells were washed 3 times with cold PBS and resuspended in Roswell Park Memorial Institute (RPMI) 1640 Dutch modification culture medium (Life Technologies/Invitrogen, Breda, the Netherlands) supplemented with 50 μg/mL gentamicin, 2 mM Glutamax, and 1 mM pyruvate (Life Technologies). Mean PBMC count following Ficoll-Paque isolation was 32.6 × 10⁶ (standard error of the mean [SEM] ±5.6) and 22.4 × 10⁶ (SEM ± 1.7) at baseline, and 30.4 × 10⁶ (SEM ± 3.7) and 22.3 × 10⁶ (SEM ± 3.2) at follow-up, for patients and controls, respectively. Percoll isolation of monocytes was performed as previously described [15]. Briefly, around 20–30 × 106 PBMCs were layered on top of a hyperosmotic Percoll solution (48.5% Percoll, 41,5% sterile H2O, 0.16 M filter sterilized NaCl), adjusted for PBMC count, and centrifuged for 15 minutes at 580 g. The interphase layer was isolated and cells were washed once with cold PBS. Cells were resuspended in culture medium as described above.
RNA Isolation and Quantification
RNA was isolated from the monocyte-enriched suspension using the mirVana™ miRNA Isolation Kit (Ambion, Austin, TX) according to the manufacturer’s instructions. The purity and quantity of RNA were assessed using NanoDrop software (Thermo Fisher Scientific, Waltham, MA), after which samples immediately were stored at −80°C for future use.
RNA Sequencing Alignment and Expression Analysis
RNA sequencing was performed on 11 acute Q fever patients and 15 healthy controls. RNA sequencing library data initially were subjected to a quality control step, where, based on read distribution over the annotated genome, libraries that are outliers were identified and discarded from further analysis. For expression analyses, reads were aligned to the Ensembl v68 human transcriptome using Bowtie (John Hopkins University, Baltimore, MD). Quantification of gene expression was performed using MMSEQ (GitHub, San Francisco, CA).
Differential Expression
Analysis was performed using DESeq2, using as input the MMSEQ counts (Unique_hits) (Bioconductor, Fred Hutchinson Cancer Research Center, Seattle, Washington, DC). Only genes with average counts (all samples) above 1 were fed into the DESeq2 software. DESeq2 internally performs another round of independent filtering (usually, the filter threshold of average number of reads would be ~5). To check for the main source of variation, principal-component analysis (PCA) was performed on the top 500 varying genes.
Differential Expression of MT-RNR1 and MT-RNR2
Based on recent findings by our group [16] identifying a significantly decreased expression of mitochondrial-derived peptide (MDP)-coding genes MT-RNR1 and MT-RNR2 in QFS patients compared with healthy controls, we investigated the expression of these genes in acute Q fever patients compared with healthy controls, both at the time of infection and follow-up.
Pathway Enrichment Analysis
For the analysis of over- and underrepresented biological pathways, comparing the various groups (n = 10), ClueGo version 2.1.7 was used in the integrative bioinformatic software environment of Cytoscape version 3.2 (Institute of Systems Biology, Seattle, Washington, DC). Pathways were significantly overly expressed if they showed a P value ≤ .05, and only differentially expressed genes with a P value < .01 were selected for pathway analysis. Various analysis pathways, like Kyoto Encyclopedia of Genes and Genomes pathway, Reactome pathway, and Wikipathway, were used on the differentially expressed gene lists, followed by Benjamini-Hochberg adjustment for terms and groups. Enriched pathways are depicted as gene ontology terms.
Cytokine Assays
The Ella microfluidic analyzer (ProteinSimple, San Jose, CA) was used to assess circulating concentrations of interleukin (IL)-1β, TNFα, IL-6, IL-10, and IL-1Ra in serum. Due to sample loss, cytokines could be determined only in 9 out of 11 acute Q fever patients at baseline and 10 out of 11 acute Q fever patients at follow-up.
Determination of Altered Cytokine Responses of Naïve Monocytes Following Stimulation With C. burnetii
By determining production of IL-6 and TNFα in monocytes of healthy Q fever seronegative controls, isolated from buffy coats obtained from healthy volunteers (Sanquin Bloodbank, Nijmegen, the Netherlands), that either previously had been stimulated with Q fever antigen or a negative control, we investigated whether C. burnetii is able to inflict long-lasting changes in monocyte cytokine responses. For this experiment, we employed the model of trained immunity [13].
Statistical Analysis
Data were analyzed using Graphpad Prism (version 5.03, Graphpad Software, Inc., San Diego, CA) and SPSS (version 22.0, SPSS, Inc., IBM Business Analytics, Armonk, NY). The Mann-Whitney test was used as nonparametric t test to determine differences between groups. Statistical significance was attained if P < .05.
RESULTS
Patients and Controls
Blood of acute Q fever patients was drawn at a median of 27 days (interquartile range , 15–35 days) after their last sick day (hereafter referred to as “baseline”), and again 6 months thereafter (hereafter referred to as “follow-up”). Healthy controls were matched for age (P = .95) and gender (Table 1). All acute Q fever patients showed signs of an acute or recent infection, reflected by phase 2 IgM antibodies in the absence of phase 1 IgG antibodies. All healthy controls had negative IgM phase I and II and IgG phase I and II titres, both at baseline and follow-up, showing no signs of a past or active Q fever infection. At follow-up, QFS was diagnosed in 2 patients from the acute Q fever group, according to the Dutch guideline on QFS [14] (Table 1). No patients showed signs of chronic Q fever reflected by IgG phase I antibody titres ≥ 1:800.
Table 1.
Characteristics of Acute Q Fever Patients and Healthy Controls at Baseline and Follow-up
| Baseline | Follow-up | |||
|---|---|---|---|---|
| Characteristics | Acute Q Fever (n = 11) | Healthy Controls (n = 15) | Acute Q Fever (n = 11) | Healthy Controls (n = 15) |
| Male sex, n (%) | 9 (82) | 13 (87) | — | — |
| Age, y (median [IQR]) | 46 (31–55) | 47 (23–60) | — | — |
| Last sick day, daysa (median [IQR]) | 27 (15–35) | — | — | — |
| CIS subscale fatigue severity score, mean ± SD | 41 ± 14 | 22 ± 8 | 20 ± 13 | 17 ± 6 |
| SIP-8 total score, mean ± SD | 721 ± 856 | 170 ± 214 | 277 ± 418 | 58 ± 134 |
| QFS [RIVM guideline], number (%) | — | — | 2 (18%) | — |
Abbreviations: CIS, Checklist Individual Strength questionnaire; IQR, interquartile range; QFS, Q fever fatigue syndrome; RIVM, the Netherlands’ National Institute for Public Health and the Environment; SD, standard deviation; SIP-8, Sickness Impact Profile-8 questionnaire.
a Last sick day indicates the day before time last sick.
Circulating Cytokines
Circulating concentrations of IL-10, IL-1β, IL-1Ra, and IL-6 were measured at baseline and follow-up. Compared with the healthy controls, acute Q fever patients had significantly higher concentrations of circulating IL-10 (median 5.81 pg/ml versus 2.77 pg/ml, P = .0019), IL-1β (median 13.05 pg/ml versus 0.69 pg/ml, P = .0067), IL-1Ra (median 2132 pg/ml versus 512.4 pg/ml, P = .0008), and IL-6 (median 14.17 pg/ml versus 1.81 pg/ml, P = .0003) at baseline (Figure 1A). At follow-up, this difference had decreased for IL-10 (median 3.37 pg/ml versus 2.55 pg/ml, P = .0136) and IL-1Ra (median 1121 pg/ml versus 413 pg/ml, P = .0017), and it had become nonsignificant for IL-1β (median 2.15 pg/ml versus 0.65 pg/ml, P = .1139) and IL-6 (median 2.57 pg/ml versus 2.42 pg/ml, P = .2792) (Figure 1B).
Figure 1.
Circulating IL-10, IL-1β, IL-1Ra, and IL-6 of Acute Q Fever Patients and Healthy Controls at Baseline and Follow-up
Levels of circulating IL-10, IL-1β, IL-1Ra, and IL-16 in acute Q fever patients and healthy controls at baseline (A) and 6-month follow-up (B).
A, Baseline, a significant difference in levels of circulating IL-10 (P = .0019), IL-1β (P = .0067), IL-1Ra (P = .0008), and IL-6 (P = .0003) can be seen. B, Six-month follow-up, this difference has decreased for IL-10 (P = .0.136) and IL-1Ra (P = .0017) and has become nonsignificant for IL-1β (P = .1139) and IL-6 (P = .2792). Data are depicted as median ± interquartile range.
Abbreviation: ns, nonsignificant.

Principal-Component Analysis
A PCA analysis was performed on the top 500 varying genes at baseline and follow-up. At baseline, the PCA plot clearly identifies the acute Q fever patients from the healthy controls, suggesting that monocytes of acute Q fever patients retain a strongly different transcriptional program for several weeks after the infection (Figure 2A). In contrast, the differences between patients and healthy volunteers were less strong at follow-up, although differences remained in an important percentage of patients (Figure 2B).
Figure 2.
Principal Component Analysis of Top 500 Varying Genes
Principal component analysis of RNA sequencing data obtained from the top 500 varying genes in unstimulated, circulating monocytes of acute Q fever patients and healthy controls at baseline (A) and 6-month follow-up (B).
Abbreviations: controls, healthy controls; patients, acute Q fever patients; PC, principal component.

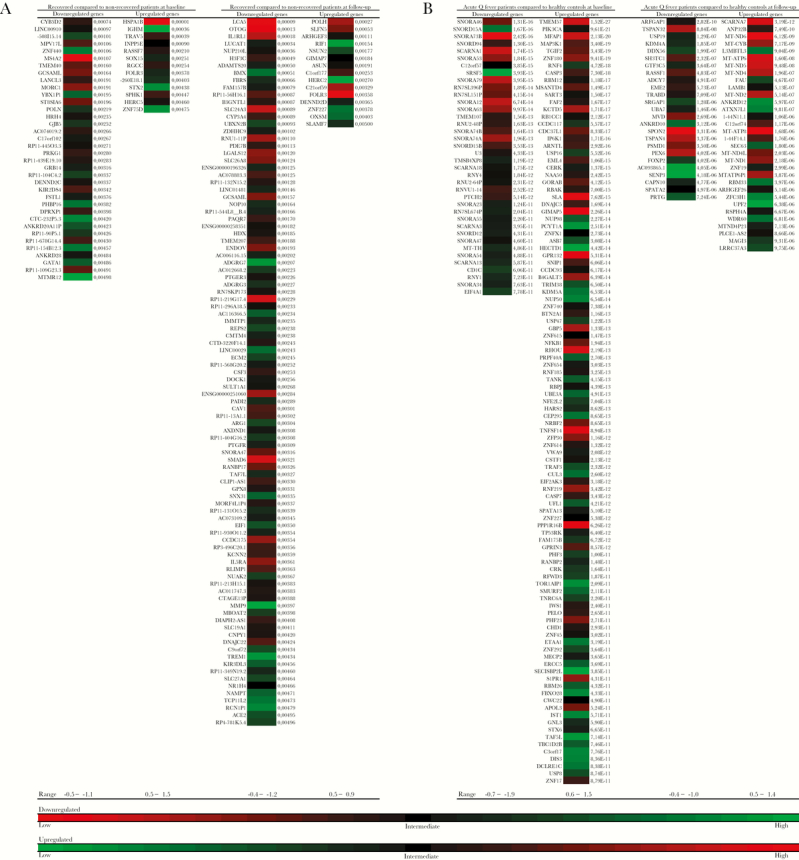
Heatmaps of Differentially Expressed Genes and Pathway Enrichment Analysis
A heatmap was made of genes that are differentially expressed in acute Q fever patients compared with healthy controls at baseline, using a cut-off P value ≤ 10 × 10-10, and follow-up, using a cut-off P value ≤ 10 × 10–5 (Figure 3A), and in acute Q fever patients who recovered from their complaints (n = 9), compared with acute Q fever patients who developed QFS (n = 2), at baseline and follow-up, using a cut-off P value < .005 (Figure 3B). Subsequent pathway enrichment analysis on differentially expressed genes in acute Q fever patients at baseline, using a cut-off P value < .001, and follow-up, using a cut-off P value < .05, primarily exposed a down-regulation of pathways involved in energy metabolism and general epigenetic and transcriptional processes, together with an up-regulation of pathways involved in apoptosis and necrosis at baseline (Supplementary Table 1A). At follow-up, these differences were less pronounced and mainly consisted of an up-regulation of pathways involved in energy metabolism (Supplementary Table 1B). A table containing less prominently enriched pathways (P > .05 ≤ .001) at baseline is added as supplementary data (Supplementary Table 2).
Figure 3.
Differential Gene Expression in Acute Q Fever Patients and Healthy Controls at Baseline and Follow-up
Heatmaps showing differential expression of down- and up-regulated genes in circulating monocytes from acute Q fever patients compared with healthy controls at baseline and follow-up. A, Down- and up-regulated genes in 9 acute Q fever patients who recovered from their complaints, compared with 2 who developed Q fever fatigue syndrome, using a cut-off P value < .005. B, Down- and up-regulated genes in 11 acute Q fever patients compared with 15 healthy controls at baseline, using a cut-off P value ≤ 10 × 10-10, and follow-up, using a cut-off P value ≤ 10 × 10–5. Heatmaps are based on level of differential expression, measured with log 2-fold change.
Altered Cytokine Responses of Naïve Monocytes Following Stimulation With C. burnetii
Monocytes that were initially stimulated with C. burnetii showed significant increase in the production of IL-6 and TNFα upon stimulation with LPS after 6 days compared to RPMI (P = .02 and P = .03, respectively, Figure 4).
Figure 4.
C. burnetii Primes Production of Pro-inflammatory Cytokines by Monocytes
Employing the model of trained immunity [13], we stimulated naïve monocytes of healthy controls with C. burnetii or RPMI culture medium as a negative control for 24 hours, washed away the stimulus, and let the cells rest for 6 days. After 6 days, cells were again stimulated for 24 hours, this time with either RPMI culture medium as a negative control or LPS as a nonspecific stimulus, ultimately investigating whether C. burnetii is able indeed to inflict long-lasting changes in monocyte cytokine responses.
A, Monocytes previously exposed to C. burnetii (1x10⁷/mL) produced significantly more IL-6 (P = .02) upon restimulation with LPS than naïve monocytes. B, Monocytes previously exposed to C. burnetii (1x10⁷/mL) produced significantly more TNFα (P = .03) upon restimulation with LPS than naïve monocytes. Results are depicted as mean ± SEM. Experimental setup is based on the in vitro model of trained immunity [13] and included monocytes of 3 healthy controls in 2 independent experiments.
Abbreviations: C.b., Coxiella burnetii; IL, interleukin; LPS, lipopolysaccharide; RPMI, Roswell Park Memorial Institute culture medium; SEM, standard error of the mean; TNF, tumor necrosis factor.

Differential Expression of MT-RNR1 and MT-RNR2
At baseline, both MT-RNR1 and Mt-RNR2 were less expressed in acute Q fever patients, compared with healthy controls (-0.7 log 2-fold change; P = .0111, and -0.9 log 2-fold change; P = .0002, respectively) (Figure 5). At follow-up, this difference was no longer observed. Furthermore, a decreased expression that was nonsignificant at baseline and follow-up of MT-RNR1 (-0.1 log 2-fold change; P = .2868 and -0.1 log 2-fold change; P = .5143, respectively) and MT-RNR2 (-0.3 log 2-fold change; P = .6707 and -0.1 log 2-fold change; P = .5209, respectively) was observed in the 2 acute Q fever patients who developed QFS compared with the 9 who recovered from their complaints.
Figure 5.
Boxplots Showing Differential Expression of MT-RNR1 (A) and MT-RNR2 (B) in Acute Q Fever Patients Compared With Healthy Controls at Baseline
Boxplots showing normalized counts of MT-RNR1 (A) and MT-RNR2 (B) in circulating monocytes in acute Q fever patients and healthy controls. Results are depicted as median ± interquartile range.

DISCUSSION
This study investigated transcriptional profiles of circulating monocytes and cytokines as a mirror of myeloid cell function, a median of 27 days and 6 months after an acute Q fever infection. Previous studies have documented long-term reprogramming of myeloid cells by vaccinations, but no studies to date have demonstrated that similar effects may happen after human infections. It is hypothesized that due to long-term complications of acute Q fever, such as QFS, in which monocyte and macrophage products, such as pro-inflammatory cytokines, may play an important role, infection with C. burnetii may induce a long-term functional reprogramming of myeloid cells. Indeed, we have observed important long-term effects of the Q fever infection on the monocyte transcriptome, an effect resembling trained immunity reprogramming reported after vaccination with live vaccines [17]. The concept of changed myeloid cell function is further reinforced by the higher concentrations of circulating IL-10, IL-1β, IL-1Ra, and IL-6 in patients 1 month after the infection, with residual effects on IL-10 and IL-1Ra 6 months thereafter.
At a median of 27 days after the infection, an apparent down-regulation of pathways involved in energy metabolism and general epigenetic and transcriptional processes, together with an up-regulation of pathways involved in apoptosis and necrosis, was seen in acute Q fever patients compared with healthy controls. At follow-up, these differences had diminished and mainly consisted of an up-regulation of energy metabolism. These results indicate that circulating monocytes can retain long-term alterations in their transcriptional program following an acute Q fever infection. It is likely that this transcriptional reprogramming occurs at the level of progenitor cells in the bone marrow [18]. Similar findings in myeloid cells were made following exposure to live vaccines [19]. The live-attenuated Bacillus Calmette-Guérin vaccine for instance is able to induce epigenetic reprogramming together with a metabolic shift that alters myeloid cell functionality and responsiveness to subsequent nonspecific infectious insults [11, 17, 19]. Marmion et al., hypothesized that QFS patients undergo chronic immune stimulation through persisting nonviable C. burnetii antigens following the acute Q fever infection [20–22]. Such a process could very well explain long-term reprogramming of myeloid progenitor cells following an acute Q fever infection, especially if such antigens persist in the bone marrow [23]. It is of great interest to see that an infectious insult such as acute Q fever infection also is able to induce long-lasting reprogramming of myeloid cells. Together with the observations that in vitro production of IL-6 and TNFα is increased in monocytes that were primed with C. burnetii and later stimulated with a nonspecific stimulus, these results suggest that an acute Q fever infection is able to induce long-lasting functional reprogramming of myeloid cells.
Looking at circulating cytokines in acute Q fever patients compared with healthy controls, we found concentrations of IL-10, IL-1β, IL-1Ra, and IL-6 to be increased at baseline and to a lesser extent still at follow-up. This is an interesting finding as one would expect the concentrations of these cytokines to have normalized within a few weeks after the infection. It could be argued that the altered transcriptional programming of myeloid cells contributes to these long-lasting differences in circulating cytokine concentrations. The down-regulation in energy metabolism, epigenetic, and transcriptional processes, and the more specific repressive H3K9me2 on the promoter regions of both IL-6 and IL-8 at baseline, together with the down-regulation of interleukin signalling and up-regulation of energy metabolism at follow-up, are likely to contribute to these findings. A general but less prominent activation of Toll-like Receptor and cytokine signalling pathways at baseline, but no longer at follow-up, possibly also play a role (Supplementary Table 2).
It has long been thought that an inflammatory component contributes to the pathophysiology of QFS [8–10]. Previous studies found signs of altered immunity through the IFNγ and IL-6 axis in these patients. Furthermore, a recent study found that PBMCs of QFS patients produce higher amounts of TNFα, IL-1β, and IL-6 when stimulated with Q fever antigen. It also was shown that QFS patients had higher levels of circulating IL-6 compared with healthy controls and higher levels of IFNγ compared with asymptomatic Q fever seropositive controls [24]. Looking at less prominently enriched pathways in our study (Supplementary Table 2), both TNFα and IFNγ signalling pathways are enriched at baseline, but no longer at follow-up. Given our findings on long-lasting changes in monocyte transcriptomes and circulating cytokine concentrations in acute Q fever patients, it could be argued that the pro-inflammatory responses necessary for clearing the acute Q fever infection can linger, become detrimental, and take part in the pathophysiology of QFS [10]. Possible alterations in these processes likely are regulated through epigenetic remodelling of promoter regions of these cytokines genes in myeloid progenitor cells, tissue macrophages, and, to a lesser extent, circulating monocytes [11, 13]. It would be interesting to further investigate monocyte transcriptomes and specific epigenetic markers at the promoter regions of these cytokines during the development of QFS, starting at the acute Q fever infection. Moreover, reprogramming of resident tissue macrophages, like microglia, is of particular interest when investigating QFS and chronic fatigue syndrome (CFS) pathophysiology as this can drive low-grade neuroinflammation [25, 26]. It is plausible that an acute Q fever infection translates to similar reprogramming of microglia in the brain, either through mirroring of peripheral inflammation during the infection or long-lasting transcriptional changes in myeloid progenitor cells [27, 28]. As recovery in acute Q fever patients was associated with a long-lasting anti-inflammatory cytokine profile (ie, IL-10 and IL-1Ra) and decreasing pro-inflammatory cytokine profile (ie, IL-6 and IL-1β), it would be of interest to investigate the dynamics of these and other cytokine profiles in the development of QFS.
At follow-up, 9 out of 11 patients had fully recovered while 2 had developed QFS. At this time, both the transcriptional reprogramming and difference in concentrations of circulating cytokines had diminished, indicating normalization of myeloid programming and functioning. This most likely reflects the normal recovery of most (ie, 9 out of 11) acute Q fever patients in this study. Although it should be noted that these numbers are insufficient for conducting reliable analyses, some differences in differentially expressed genes were found between these groups, both around the time of infection and 6 months thereafter. As was previously described, no apparent difference in PCA is observed when comparing QFS patients with healthy controls [16]. A previous study, investigating longitudinal peripheral blood gene expression in postinfective fatigue syndrome following Epstein-Barr virus, Ross River virus, and acute Q fever infections, concluded that no genes were consistently correlated with the illness itself [29]. In this study, several genes were selected that were associated with CFS in the past. No comparable results were found when looking at differential expression in patients who developed QFS compared with patients who adequately recovered from their infection, likely due to insufficiently small numbers.
Finally, another interesting observation was the significantly decreased expression of MDP-coding genes MT-RNR1 (MOTS-c) and MT-RNR2 (humanin) 1 month after infection, but no longer after 6 months. Both MT-RNR1 and MT-RNR2 were previously found to be significantly less expressed in circulating monocytes of QFS patients compared with healthy controls [16]. Interestingly, when comparing those who developed QFS with those who recovered from their acute Q fever infection, a general decreased expression, albeit not significant, of both MT-RNR1 and MT-RNR2 was observed both at baseline and follow-up. It could, therefore, be postulated that incentives such as an acute Q fever infection are able to negatively influence the expression of these MDP-coding genes in monocytes. Given the functions of MOTS-c and humanin [30–34], it is definitely worthwhile to further investigate the role of these MDP-coding genes in the pathophysiology of QFS and CFS.
Although this study makes an interesting observation that an acute Q fever infection can induce long-lasting reprogramming of circulating monocytes, it should be noted that small numbers were used and, due to logistical challenges, monocyte purity was not checked prior to transcriptome analysis. Further studies in larger groups are warranted in order to validate these interesting results. Using larger groups would additionally enable a better longitudinal comparison of acute Q fever patients who develop QFS with acute Q fever patients who recover from their complaints.
This study shows that an acute Q fever infection has a long-lasting effect on the transcriptional program of circulating monocytes and concentrations of circulating IL-10, IL-1β, IL-1Ra, and IL-6. It is postulated that the long-lasting effects on the transcriptional program of monocytes, their myeloid progenitor cells, and concentrations of circulating cytokines become detrimental and play a part in the pathophysiology of QFS. Additionally, it was shown that an acute Q fever infection can result in a decreased expression of MDP-coding genes MT-RNR1 (MOTS-c) and MT-RNR2 (humanin), previously linked with QFS and CFS.
Supplementary Data
Supplementary materials are available at Open Forum Infectious Diseases online. Consisting of data provided by the authors to benefit the reader, the posted materials are not copyedited and are the sole responsibility of the authors, so questions or comments should be addressed to the corresponding author.
Acknowledgments
We would like to thank Dr. Jenny Robson for her help in recruiting participants and Dr. Erika Cox for her contributions to our work, both in recruiting participants and revising the manuscript. We also would like to thank Drs. Jason Hodge and Andrew Harrison for helping us out tremendously by letting us use their equipment. Finally, we want to thank the kind people of Launceston (in Tasmania) and Geelong (in Victoria) for volunteering as controls, and Debra Mansfield for practical organizational assistance.
Financial support. This study was funded by the Q-support Foundation (UMCN-160708-00). The was no role for the funding body in the design of the study, collection of data, analysis, interpretation of data, or writing of the manuscript.
Potential conflicts of interest. All authors: No reported conflicts of interest. All authors have submitted the ICMJE Form for Disclosure of Potential Conflicts of Interest. Conflicts that the editors consider relevant to the content of the manuscript have been disclosed.
References
- 1. Parker NR, Barralet JH, Bell AM. Q fever. Lancet 2006; 367:679–88. [DOI] [PubMed] [Google Scholar]
- 2. Tissot-Dupont H, Amadei MA, Nezri M, Raoult D. Wind in November, Q fever in December. Emerg Infect Dis 2004; 10:1264–9. [DOI] [PMC free article] [PubMed] [Google Scholar]
- 3. Eldin C, Mélenotte C, Mediannikov O, et al. From Q fever to Coxiella burnetii infection: a paradigm change. Clin Microbiol Rev 2017; 30:115–90. [DOI] [PMC free article] [PubMed] [Google Scholar]
- 4. Beare PA, Gilk SD, Larson CL, et al. Dot/Icm type IVB secretion system requirements for Coxiella burnetii growth in human macrophages. MBio 2011; 2:e00175–11. [DOI] [PMC free article] [PubMed] [Google Scholar]
- 5. Carey KL, Newton HJ, Lührmann A, Roy CR. The Coxiella burnetii Dot/Icm system delivers a unique repertoire of type IV effectors into host cells and is required for intracellular replication. PLOS Pathog 2011; 7:e1002056. [DOI] [PMC free article] [PubMed] [Google Scholar]
- 6. Morroy G, Keijmel SP, Delsing CE, et al. Fatigue following acute Q-fever: a systematic literature review. PLOS ONE 2016; 11:e0155884. [DOI] [PMC free article] [PubMed] [Google Scholar]
- 7. Kampschreur LM, Delsing CE, Groenwold RH, et al. Chronic Q fever in the Netherlands 5 years after the start of the Q fever epidemic: results from the Dutch Chronic Q Fever Database. J Clin Microbiol 2014; 52:1637–43. [DOI] [PMC free article] [PubMed] [Google Scholar]
- 8. Keijmel SP, Raijmakers RP, Bleeker-Rovers CP, et al. Altered interferon-γ response in patients with Q-fever fatigue syndrome. J Infect 2016; 72:478–85. [DOI] [PubMed] [Google Scholar]
- 9. Raijmakers RPH, Jansen AFM, Keijmel SP, et al. Interferon-γ and CXCL10 responses related to complaints in patients with Q fever fatigue syndrome. Eur J Clin Microbiol Infect Dis 2018; 37:1385–91. [DOI] [PMC free article] [PubMed] [Google Scholar]
- 10. Penttila IA, Harris RJ, Storm P, et al. Cytokine dysregulation in the post-Q-fever fatigue syndrome. QJM 1998; 91:549–60. [DOI] [PubMed] [Google Scholar]
- 11. Arts RJW, Carvalho A, La Rocca C, et al. Immunometabolic pathways in BCG-induced trained immunity. Cell Rep 2016; 17:2562–71. [DOI] [PMC free article] [PubMed] [Google Scholar]
- 12. Netea MG, Quintin J, van der Meer JW. Trained immunity: a memory for innate host defense. Cell Host Microbe 2011; 9:355–61. [DOI] [PubMed] [Google Scholar]
- 13. Quintin J, Saeed S, Martens JHA, et al. Candida albicans infection affords protection against reinfection via functional reprogramming of monocytes. Cell Host Microbe 2012; 12:223–32. [DOI] [PMC free article] [PubMed] [Google Scholar]
- 14. Timen A, Beaujean D, Bleijenberg G, et al. Multidisciplinaire LCI-richtlijn Q-koorts-vermoeidheidssyndroom (QVS). https://lci.rivm.nl/sites/default/files/2017-05/Multidisciplinaire%20richtlijn%20QVS.pdf. Published 2011. Accessed June 27, 2019.
- 15. Repnik U, Knezevic M, Jeras M. Simple and cost-effective isolation of monocytes from buffy coats. J Immunol Methods 2003; 278:283–92. [DOI] [PubMed] [Google Scholar]
- 16. Raijmakers RPH, Jansen AFM, Keijmel SP, et al. A possible role for mitochondrial-derived peptides humanin and MOTS-c in patients with Q fever fatigue syndrome and chronic fatigue syndrome. J Transl Med 2019; 17:157. [DOI] [PMC free article] [PubMed] [Google Scholar]
- 17. Benn CS, Netea MG, Selin LK, Aaby P. A small jab - a big effect: nonspecific immunomodulation by vaccines. Trends Immunol 2013; 34:431–9. [DOI] [PubMed] [Google Scholar]
- 18. Whitelaw DM. The intravascular lifespan of monocytes. Blood 1966; 28:455–64. [PubMed] [Google Scholar]
- 19. de Bree LCJ, Koeken VACM, Joosten LAB, et al. Non-specific effects of vaccines: current evidence and potential implications. Semin Immunol 2018; 39:35–43. [DOI] [PubMed] [Google Scholar]
- 20. Marmion BP, Storm PA, Ayres JG, et al. Long-term persistence of Coxiella burnetii after acute primary Q fever. QJM 2005; 98:7–20. [DOI] [PubMed] [Google Scholar]
- 21. Marmion BP, Sukocheva O, Storm PA, et al. Q fever: persistence of antigenic non-viable cell residues of Coxiella burnetii in the host–implications for post Q fever infection fatigue syndrome and other chronic sequelae. QJM 2009; 102:673–84. [DOI] [PubMed] [Google Scholar]
- 22. Sukocheva OA, Marmion BP, Storm PA, et al. Long-term persistence after acute Q fever of non-infective Coxiella burnetii cell components, including antigens. QJM 2010; 103:847–63. [DOI] [PubMed] [Google Scholar]
- 23. Sukocheva OA, Manavis J, Kok TW, et al. Coxiella burnetii dormancy in a fatal ten-year multisystem dysfunctional illness: case report. BMC Infect Dis 2016; 16:165. [DOI] [PMC free article] [PubMed] [Google Scholar]
- 24. Raijmakers RPH, Koeken VACM, Jansen AFM, et al. Cytokine profiles in patients with Q fever fatigue syndrome. J Infect 2019; 78:349–57. [DOI] [PubMed] [Google Scholar]
- 25. Nakatomi Y, Mizuno K, Ishii A, et al. Neuroinflammation in patients with chronic fatigue syndrome/myalgic encephalomyelitis: an ¹¹C-(R)-PK11195 PET study. J Nucl Med 2014; 55:945–50. [DOI] [PubMed] [Google Scholar]
- 26. Saeed S, Quintin J, Kerstens HH, et al. Epigenetic programming of monocyte-to-macrophage differentiation and trained innate immunity. Science 2014; 345:1251086. [DOI] [PMC free article] [PubMed] [Google Scholar]
- 27. Haley MJ, Brough D, Quintin J, Allan SM. Microglial priming as trained immunity in the brain. Neuroscience 2019; 405:47–54. [DOI] [PubMed] [Google Scholar]
- 28. VanElzakker MB, Brumfield SA, Lara Mejia PS. Neuroinflammation and cytokines in myalgic encephalomyelitis/chronic fatigue syndrome (ME/CFS): a critical review of research methods. Front Neurol 2018; 9:1033. [DOI] [PMC free article] [PubMed] [Google Scholar]
- 29. Galbraith S, Cameron B, Li H, et al. Peripheral blood gene expression in postinfective fatigue syndrome following from three different triggering infections. J Infect Dis 2011; 204:1632–40. [DOI] [PubMed] [Google Scholar]
- 30. Cobb LJ, Lee C, Xiao J, et al. Naturally occurring mitochondrial-derived peptides are age-dependent regulators of apoptosis, insulin sensitivity, and inflammatory markers. Aging (Albany NY) 2016; 8:796–809. [DOI] [PMC free article] [PubMed] [Google Scholar]
- 31. Fuku N, Pareja-Galeano H, Zempo H, et al. The mitochondrial-derived peptide MOTS-c: a player in exceptional longevity? Aging Cell 2015; 14:921–3. [DOI] [PMC free article] [PubMed] [Google Scholar]
- 32. Kim SJ, Xiao J, Wan J, et al. Mitochondrially derived peptides as novel regulators of metabolism. J Physiol 2017; 595:6613–21. [DOI] [PMC free article] [PubMed] [Google Scholar]
- 33. Lee C, Yen K, Cohen P. Humanin: a harbinger of mitochondrial-derived peptides? Trends Endocrinol Metab 2013; 24:222–8. [DOI] [PMC free article] [PubMed] [Google Scholar]
- 34. Lee C, Zeng J, Drew BG, et al. The mitochondrial-derived peptide MOTS-c promotes metabolic homeostasis and reduces obesity and insulin resistance. Cell Metab 2015; 21:443–54. [DOI] [PMC free article] [PubMed] [Google Scholar]
Associated Data
This section collects any data citations, data availability statements, or supplementary materials included in this article.