

Abstract
Single chain variable fragment‐IgGs (scFv‐IgG) are a class of bispecific antibodies consisting of two single chain variable fragments (scFv) that are fused to an intact IgG molecule. A common trend observed for expression of scFv‐IgGs in mammalian cell culture is a higher level of aggregates (10%–30%) compared to mAbs, which results in lower purification yields in order to meet product quality targets. Furthermore, the high aggregate levels also pose robustness risks to a conventional mAb three column platform purification process which uses only the polishing steps (e.g., cation exchange chromatography [CEX]) for aggregate removal. Protein A chromatography with pH gradient elution, high performance tangential flow filtration (HP‐TFF) and calcium phosphate precipitation were evaluated at the bench scale as means of introducing orthogonal aggregate removal capabilities into other aspects of the purification process. The two most promising process variants, namely Protein A pH gradient elution followed by calcium phosphate precipitation were evaluated at pilot scale, demonstrating comparable performance. Implementing Protein A chromatography with gradient elution and/or calcium phosphate precipitation removed a sufficient portion of the aggregate burden prior to the CEX polishing step, enabling CEX to be operated robustly under conditions favoring higher monomer yield. From starting aggregate levels ranging from 15% to 23% in the condition media, levels were reduced to between 2% and 3% at the end of the CEX step. The overall yield for the optimal process was 71%. Results of this work suggest an improved three‐column mAb platform‐like purification process for purification of high aggregate scFv‐IgG bispecific antibodies is feasible. © 2018 The Authors. Biotechnology Progress published by Wiley Periodicals, Inc. on behalf of American Institute of Chemical Engineers. Biotechnol. Prog., 35: e2720, 2019
Keywords: bispecific, antibodies, aggregate removal, purification process
Introduction
The success of monoclonal antibody (mAb) therapeutics has driven exploration into designer biotherapeutics capable of combinatorial, more targeted approaches. A prominent example of these strategies are bispecific antibodies (BisAbs), which possess binding specificities for two different epitopes.1, 2, 3 Due to the dual binding affinities, BisAbs can target multiple biological pathways simultaneously, while retaining the affinity and potency of the parental mAbs.4
To date, bispecific antibodies have been evaluated in a variety of therapeutic areas including oncology, inflammation and autoimmune diseases.5, 6, 7 While there are multiple formats of BisAbs, they can be divided into two categories: (i) the molecule possesses an Fc region (e.g., scFv‐IgG, Cross‐Mab, Triomab) which enables the use of Protein A affinity chromatography as a capture step, (ii) the molecule does not possess an Fc region (e.g., BITE, DART, bi‐Nanobody) and therefore are likely to require non‐affinity capture modalities.8
Single chain variable fragment‐IgGs (scFv‐IgG) possess two single chain variable fragments (scFv) that are expressed with an intact IgG molecule, allowing for tetravalent epitope binding.9 The scFv can be expressed at different locations on the IgG: N‐terminus of the heavy chain (Bis2Ab), C‐terminus of the heavy chain (Bis3Ab), between the CH1 and CH2 domain (Bis4Ab), depending on the mechanism of action for the molecule (Figure 1). While Protein A chromatography can be used to capture scFv‐IgGs, they pose challenges when a mAb platform purification process is employed due to the significantly higher aggregate levels (~10%–30%) often encountered with scFv‐IgG cell culture processes compared to mAb cell culture processes. The platform mAb purification process is typically comprised of three column chromatography steps: a primary affinity capture column, and two subsequent polishing chromatography steps.10, 11 Cation exchange (CEX) and anion exchange (AEX) chromatography are often used as the polishing chromatography columns to reduce impurities (e.g., aggregate, DNA, host cell protein [HCP], and virus) to acceptable levels prior to formulation. As the AEX step is operated in flow‐through mode and dedicated for the removal of DNA and virus, the CEX step is usually operated in bind‐and‐elute mode to resolve monomer from aggregate in addition to other impurities.12 Due to similarities in the biochemical properties of monomer and aggregates, low selectivity is often seen on typical aggregate removal polishing steps, requiring a compromise in operating conditions where lower yields are accepted to robustly achieve adequate aggregate clearance. While this approach may be feasible with mAb processes, the high aggregate levels often encountered in expression of scFv‐IgGs present process robustness concerns, particularly when relying on a single column for the majority of aggregate clearance. Cell‐line engineering and cell culture condition optimization to reduce aggregate levels can be considered as potential solutions.13, 14 However, the impact of the changes on titer and other impurity levels needs to be considered. Further, cell‐line engineering approaches are often time‐consuming and may not be feasible under tight drug development timelines. Hence, optimization of the purification process for improved aggregate removal is often the only practicable process development path for this class of molecules.
Figure 1.
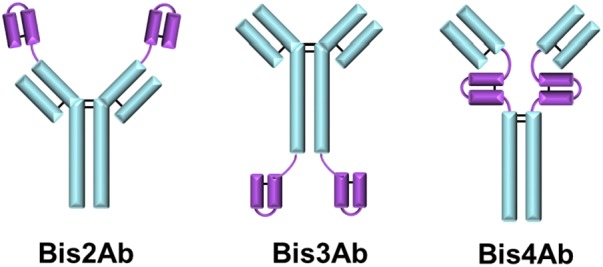
Structure of single chain variable fragment immunoglobulin (scFv‐IgG) bispecific antibody (BisAb) formats. Blue: Intact IgG; Purple: single chain variable fragment. Bis2Ab: scFv expressed on N‐terminus of the IgG. Bis3Ab: scFv expressed on C‐terminus of the IgG. Bis4Ab: scFv expressed on between CH1 and CH2 domains above the hinge disulfide bonds.
Ceramic hydroxyapatite (CHT), mixed mode (MM) and hydrophobic interaction chromatography (HIC) can be used in place of CEX, but present a series of technical challenges both at bench and manufacturing scales (e.g., longer column packing times, shorter resin column lifetimes, higher regeneration buffer volumes, resin lot‐to‐lot variability, disposal of high concentration kosmotropic salt solutions).15, 16, 17, 18 As noted above, relying on a single polishing step to ensure adequate aggregate removal presents a risk to the overall purification process due to a lack of redundancy and orthogonality. Alternatively, aggregate clearance can be distributed across two polishing chromatography steps, such as a combination of HIC and CHT. Such an approach can provide improved process robustness, but will compound the manufacturing challenges noted above. Moreover, this process configuration may also present process throughout and facility fit challenges, particularly for manufacturing facilities optimized around three column mAb platform process. To address this challenge, a logical approach is to “piggyback” aggregate clearance steps on other requisite unit operations of a conventional mAb platform process (e.g., Protein A capture or low pH virus inactivation). This approach would enable orthogonal aggregate removal steps to be introduced into the purification train improving process robustness, and potentially allow the scFv‐IgG purification process to adopt a more mAb platform‐like three‐column process with higher process yields and fewer facility fit constraints.
In this work, the authors examine strategies for removal of high aggregate levels from recombinant scFv‐IgG feed streams. In particular, the authors consider approaches with potential to integrate into a conventional mAb platform purification process in a minimally disruptive manner. Three nonconventional aggregate removal steps are investigated in detail, Protein A capture with pH gradient elution, calcium phosphate precipitation, and high performance tangential flow filtration (HPTFF). The optimized aggregate removal steps are then integrated with a conventional mAb platform purification process and demonstrated at bench scale. One of the bench scale processes incorporating Protein A capture with pH gradient elution and calcium phosphate precipitation is then piloted to demonstrate scalability.
Materials and Methods
Materials
Chemicals used for buffer preparation were obtained from Sigma (St. Louis, MO) and JT Baker (Phillipsburg, NJ).
Cell culture methods
CHO cell culture was performed using standard techniques in 7 L scale fed‐batch process glass bioreactors (Applikon, Delft, Netherlands) using proprietary media and nutrient feeds with an initial working volume of 5 L Culture conditions (pH, DO, agitation and temperature) were continuously controlled and monitored. Off‐line measurements of pH, dissolved gases (pO2, pCO2), sodium, and metabolite concentrations (glucose, lactate, and ammonia) were obtained with a NOVA Bioprofile Analyzer (Waltham, MA) and Siemens RAPIDPoint 500 BGA (Malvern, PA). Cell viability and viable cell density was monitored with a Beckman Coulter Vi‐CELL (Indianapolis, IN). The cells were harvested using a Beckman Coulter Avanti J‐HC high capacity bucket centrifuge (Brea, CA). The centrate was then filtered using a Sartorius Stedim Sartopure 2 XLG 0.8/0.2 um PES filter. To generate adequate conditioned media for pilot scale purification runs, multiple 7 L bioreactors were cultured, harvested, and pooled.
Process chromatography methods
Omnifit (Kinesis, Vernon Hills, Ill), Vantage (Millipore, Billerica, MA) and BPG 100/500 (GE Healthcare, Uppsala, Sweden) chromatography columns were used in this study. GE Healthcare ÄKTA Explorer 100 and ÄKTA Pilot 600 chromatography systems were used to perform the chromatography experiments. Chromatography resins include MabSelectSuRe for Protein A capture (GE Healthcare, Uppsala, Sweden) and POROS 50XS resin (Thermo Fisher Scientific, Bedford, MA) for cation exchange chromatography.
In all studies, the Protein A capture column was equilibrated with tris buffer prior to loading of conditioned cell culture media. The column was then re‐equilibrated with tris buffer followed by an acetate wash step at pH 5.5 and finally elution with either acetate buffer, pH 3.5 (step‐wise elution) or acetate/glycine buffers at pH 4.0 and 3.0 (gradient elution). All gradient elution experiments were carried out using a 10 column volume (CV) linear gradient from 20% to 80% buffer B (containing the low pH buffer). The column was then regenerated and sanitized using acetic acid and sodium hydroxide, respectively.
For the cation exchange chromatography step, equilibration and re‐equilibration was performed using 50 mM acetate at pH 5.0 with load material that was conductivity and pH adjusted prior to loading. Elution was carried out using 50 mM acetate at pH 5.0 with sodium chloride. Tris buffer with sodium chloride at pH 7.4 and 1.0 N sodium hydroxide were used in the regeneration and sanitization steps, respectively.
Low pH treatment and calcium phosphate precipitation
Low pH treatment was performed on Protein A capture product by titration with acetic acid until the pH reached 3.5. The material was then held and subsequently neutralized to pH 8.0 using tris base. For experiments where calcium phosphate precipitation was performed, the low pH treated and neutralized product was diluted to the target concentration using 100 mM tris buffer, pH 8.0. Phosphate was spiked to the target concentration through a bolus addition of 100 mM tris with 500 mM sodium phosphate, pH 8.0 buffer. The solution was then mixed thoroughly before spiking 100 mM Tris with 500 mM calcium chloride, pH 8.0 buffer. Small (1 mL) scale experiments were performed in Eppendorf tubes and mixed using a tube rotator. At the end of the reaction, the aliquots were spun down using a bench‐top centrifuge and filtered using 0.2 μm pore size centrifugal filters (VWR, 82031–356). 1 L and 2.5 L working volume precipitation experiments were carried out in 2 L (VWR, 89000–746) and 4Lglass beakers (VWR, 89001–072). 2.5 in. A310 hydrofoil impellers (Lightnin, 808955PSP) mounted on a rotating shaft were used to provide mixing. Calcium chloride was dispensed into the beaker using a syringe attached to a syringe pump (Cole Parmer 200 78‐0200C) at rates ranging from 5 to 10 mL/min. Precipitate were removed at the end of the reaction using depth filtration followed by 0.2 μm pore size membrane filtration. Depth filter capacity evaluation with precipitate was performed on Millistak+ C0HC and D0HC depth filters using a SciLog FilterTec NFF System with a feed flowrate of 150 LMH.
High‐performance tangential flow filtration (HP‐TFF)
High performance tangential flow filtration (HPTFF) separation was performed with a single stage system using a 50 cm2 C‐screen regenerated cellulose Pellicon XL cassette (Millipore, PXC300C50) with a 300 kDa molecular weight cut‐off (MWCO). Flowrates and pressure were monitored and controlled on both the retentate and permeate sides using two Scilog FilterTec NFF Systems (Cleveland, OH). Retentate and permeate pressures were controlled manually. The starting load concentration was 1.1 g/L. Retentate and permeate flowrates were set at 25 mL/min and 15 mL/min respectively. The transmembrane pressure across the channel was maintained at 1PSI.
Protein concentration analysis
Antibody titer was quantified by Protein A affinity chromatography, using a Protein A ImmunoDetection sensor cartridge (Thermo Fisher Scientific, Ashville, NC) with an Agilent 1200 series HPLC (Agilent Technologies, Santa Clara, CA). Peak areas relative to a reference standard calibration curve were used to calculate titers. Protein concentration of in‐process samples were measured using a NanoDrop 2000 from ThermoScientific.
Size exclusion chromatography
Protein purity and aggregate percentage was determined using a high performance size exclusion chromatography (HP‐SEC) method. An Agilent 1200 HPLC system was used with a 7.8 mm x 300 mm TSKgel G3000SW XL column (Tosoh Bioscience, King of Prussia, PA) at 1 mL/min flow rate using a mobile phase buffer of 0.1 M sodium phosphate, 0.1 M sodium sulfate, pH 6.8. The absorbance at 280 nm was used to quantify the results.
Particle size analysis
Particle size was measured by light scattering with a Partica particle size distribution analyzer (LA‐950 V2) from Horiba Instruments (West Chicago, IL). Equilibration and priming of the system was done with 100 mM Tris at pH 8. Precipitate containing samples were added to the detection chamber and measured at room temperature. Horiba software reported the volume mean diameter, the standard deviation of the particle size distribution, and the distribution histogram. Samples were measured in duplicate and averaged to determine the mean particle size.
Results and Discussion
For the scFv‐IgG model proteins used in this work, regardless of the scFv location, high aggregate levels (6–40%) are observed after the Protein A capture step. This aggregate burden must be removed during downstream processing. To meet purity targets, significant yield losses are often incurred at the polishing steps, leading to a lower overall process yield and hence throughput for a given scale. This is illustrated in Supporting Information Table S1 for purification processes with conventional chromatography polishing unit operations. While the overall yield across a mAb platform purification processes frequently approaches 75%, the scFv‐IgG purification processes shown in Supporting Information Table S1 have overall yields ranging from 32% to 46%. As the aggregate content in scFv‐IgGs can contribute significantly to the overall protein mass present at the end of cell culture, a more accurate measure of the purification process would be overall monomer yield, which is defined as the percentage of monomer mass present at the end of purification relative to the monomer mass present at the end of the cell culture process or protein A capture. By this measure, overall monomer yield for the standard purification processes ranges from 40% to 53%, which is substantially lower than the typical mAb platform 3‐column process. The low process yield (and facility fit considerations noted above) for scFv‐IgG processes poses a challenge not easily remedied using conventional chromatography techniques and modalities. In the subsequent sections, we examine novel process options that have potential to improve yield while simultaneously providing a better fit in a manufacturing facility optimized for a mAb platform process.
Linear gradient elution on Protein A capture step
Protein A chromatography is used primarily as a capture step to remove process related impurities (e.g., HCP and DNA) and concentrate the protein for further purification. A typical Protein A process involves loading conditioned media onto the column at neutral pH where the Fc‐portion of the antibody binds to the Protein A ligand. This is followed by a wash step to remove HCP followed by a re‐equilibration step. The product is then eluted with a low pH buffer ranging from pH 3.0–4.0. Elution is typically carried out in a stepwise manner, which is not selective for monomer. Gradient elution allows for a more gradual pH transition, allowing for better resolution of monomer from aggregate. This has recently been demonstrated with mAbs on a variety of Protein A resins.19 In mAb purification processes, pH gradient elution has historically been unnecessary as starting aggregate levels tend to be low and adequate aggregate clearance can be achieved during polishing steps. However, given the high levels of aggregate in BisAb processes, Protein A pH gradient elution may represent an attractive option that can both provide incremental aggregate removal capability and integrate with a conventional mAb platform process in a minimally disruptive manner.
As pH is the determining factor for Protein A elution, good pH gradient control is required for process robustness. This is achieved through (i) chromatography equipment capability for gradient formation through adequate mixing and pump control and (ii) proper selection of gradient generation buffer pairs to maintain pH linearity and buffering during elution. The choice of buffers for gradient formation is critical as each buffer species has an optimal buffering pH range that is dependent on its pKa. To better understand potential for use in pH gradient formation, buffering capacity for common elution buffers including as glycine, acetate, and citrate was modeled using the following equation developed by Van Slyke.20
Conceptually, β represents the moles of a strong acid or base required to change the pH of 1 L of solution by 1 pH unit.
While many buffers can be considered for use in forming a pH gradient for Protein A elution, relatively few are good candidates for use in a large‐scale biopharmaceutical manufacturing scenario for reasons including cost, suitable suppliers, facility fit, and worker safety. With these considerations in mind, the authors narrowed the list of potential candidate buffers to form a pH 4.0–3.0 gradient to glycine, acetate, and citrate. Figure 2a shows buffering capacity with buffer concentration held constant at 50 mM. Glycine is an amino acid frequently used for Protein A elution with a carboxylate group pKa of 2.3 and an amine group pKa of 9.6. In the acidic pH range, it effectively functions as a monoprotic acid with the amine group fully protonated. During the transition from pH 4.0 to 3.0, β for glycine increases from 0.002 to 0.02 mol/L, indicating that there will be minimal buffering at the start of the gradient followed by a gradual improvement in buffering capacity as pH drops to 3.0. Acetate is a monoprotic buffer frequently used for Protein A elution with a pKa of 4.8. Compared to glycine, it has a higher buffering capacity at pH 4.0 which is better suited for the start of the gradient. As is shown on Figure 2a, as the pH transitions from 4.0 to 3.0 at a fixed acetate buffer concentration of 50 mM, β decreases from 0.015 to 0.004 mol/L, resulting in reduced buffering toward the end of the gradient. However, examining Figure 2a it is clear that neither glycine nor acetate individually is ideal candidates for pH gradient formation.
Figure 2.
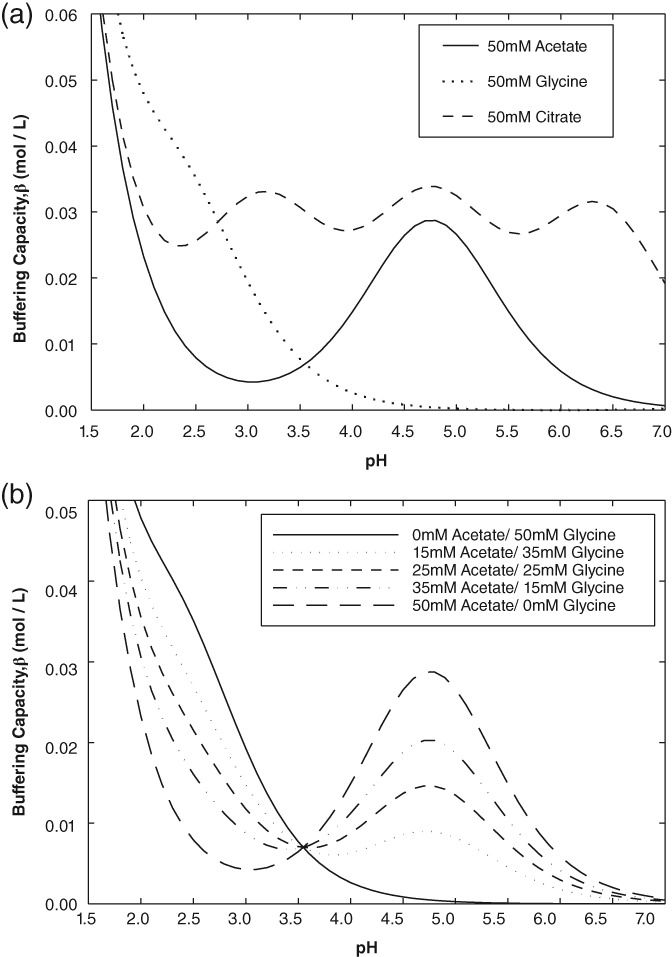
Buffer capacity (β) plots of (a) acetate, glycine and citrate buffers with pH, with a buffer concentration of 50 mM; (b) acetate/ glycine buffer combinations with pH, using a total buffer concentration of 50 mM.
Compared to monoprotic buffers, polyprotic buffers can buffer across a wider pH range due to the multiple charge states of the buffering species. The equation used in the calculation of buffering capacity for polyprotic buffers is as follows20:
Citrate has pKas of 3.13, 4.76, and 6.40, allowing for a 50 mM solution to have a higher buffering capacity than either citrate or acetate for any pH between 7.0 and 3.0 and would therefore be an ideal buffer for pH gradient formation. However, as the Protein A capture product is usually subjected to low pH treatment (pH ~3.5) followed by a neutralization step to pH 5.0–7.0, the high buffering capacity of citrate and titration through multiple pKas results in a significant increase in product volume during neutralization. While this may not pose a problem at the bench scale, facility fit concerns around product hold tank limitations may arise at the manufacturing scale. Moreover, the large amount of base required to neutralize citrate will result in higher ion concentration at the end of titration, which may interfere with subsequent downstream unit operations such as ion exchange chromatography. As a result, citrate was excluded from further consideration for pH gradient formation.
Alternatively, a combination of acetate and glycine may be considered to obtain better buffering over the pH range of interest. The overall buffer capacity can be calculated using the following equation20:
As is illustrated in Figure 2b an acetate/glycine combination provides more consistent buffering between pH 4.0 and 3.0 compared to the individual component solutions. The buffering capacity of the acetate/glycine mixture decreases rapidly above pH 5.0. For bioprocessing this is attractive as it results in a smaller product volume increase during the neutralization step after low pH treatment. The concentration of acetate and glycine in the mixture can also be adjusted to maximize the buffering capacity at different regions of the pH range between 4.0 and 3.0. A 50 mM acetate/glycine buffer consisting of 15 mM acetate and 35 mM glycine offers better buffering at pH 4.0 as compared to a 35 mM acetate and 15 mM glycine buffer. An equimolar (25 mM acetate and 25 mM glycine) mixture appears to strike an optimal balance between pH 4.0 and 3.0. The lowest β observed (at pH 3.6) is 0.007 mol/L as compared 0.004 mol/L and 0.003 mol/L for 50 mM acetate and 50 mM glycine, respectively. Hence, equimolar acetate/glycine buffers were used at pH 4.0 and 3.0 for all subsequent pH gradient elution studies on the Protein A capture step.
Several buffers were considered for re‐equilibration of the column immediately prior to the start of gradient elution. Tris at neutral pH is frequently used for this purpose as it maintains high binding capacity. However, it was deemed unsuitable as variability and poor control was observed during the sharp pH transition from tris buffer to the start of the pH gradient in acetate at pH 4.0 (data not shown). Therefore, 50 mM acetate at pH 5.5 was used to re‐equilibrate the column immediately prior to start of the pH gradient. Although the acetate re‐equilibration buffer allows for a faster and more consistent sharp pH transition to pH 4.0, binding capacity may be impacted at the lower pH, so protein loading must be adjusted appropriately to prevent product leakage during re‐equilibration.
Figure 3a shows a chromatogram for pH gradient elution of Molecule 1 that was loaded to 25 g/L on a 0.66 cm (internal diameter) × 20 cm (bed height) MabSelectSuRe column. The elution peak was collected in 0.5CV fractions across a 10‐column volume (CV) linear gradient from 20% to 80% B buffer. The buffers used to form the gradient were 25 mM acetate pH 4.0 (A buffer) and 25 mM glycine pH 3.0 (B buffer). Protein concentration measurements by A280 and HP‐SEC were performed on the elution fractions to calculate monomer yield and purity. Monomer yield is defined as the percentage of monomer mass present in the product pool relative to the initial load. The UV trace showed two partially resolved peaks with the main product peak beginning to elute during the sharp transition from pH 5.5 to 4.0, followed by a second peak that elutes during the linear gradient from 4.0 to 3.0 (Figure 3a). Partial elution of the monomer most likely begins during the sharp transition from pH 5.5 to 4.0 as this experiment was performed under nonlinear overloaded conditions. Under linear conditions where a Gaussian peak shape is obtained, MAbSelectSuRe can be expected to elute at or below pH 4.0.21 Based on HP‐SEC analysis, while baseline resolution was not observed, the early eluting main peak was enriched in monomer and the late eluting minor peak was enriched in aggregate. A similar elution peak profile was observed when the same separation was performed on a 10 cm (internal diameter) × 20 cm (bed height) MabSelectSuRe column (Figure 3b), indicating that the gradient elution process is scalable.
Figure 3.
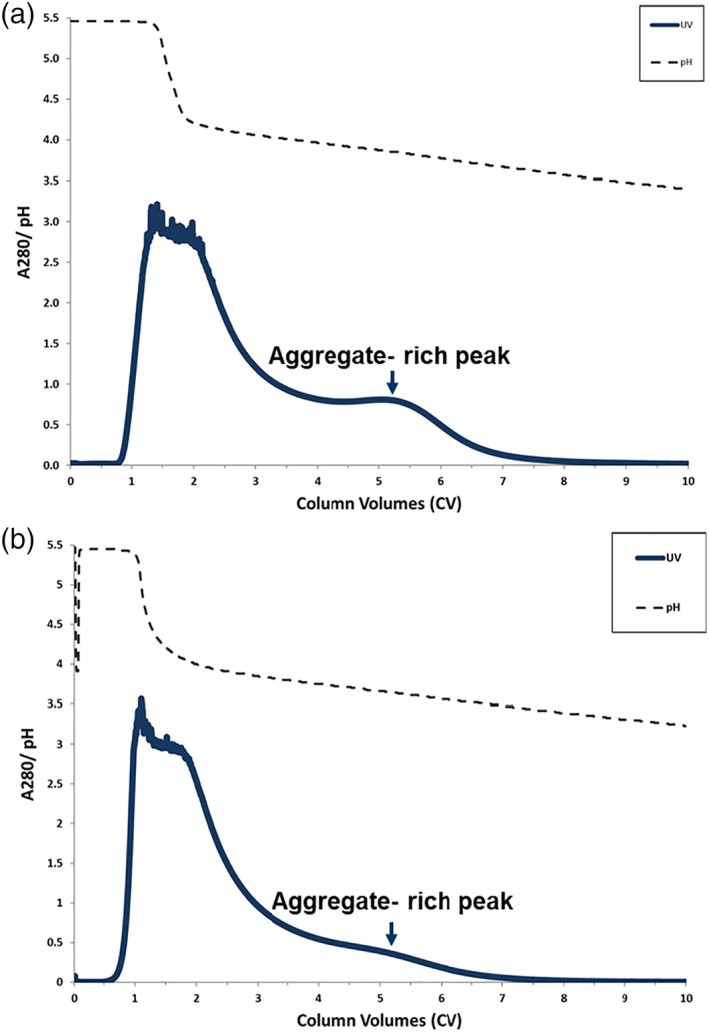
Elution peak profile of Molecule 1 eluted from (a) 0.66 cm; and (b) 10.0 cm internal diameter MabSelectSuRe chromatography columns using 10 column volume linear pH gradient from from 20% to 80% Buffer B. Elution buffer A: 25 mM acetate/25 mM glycine pH 4.0; Elution buffer B: 25mM acetate / 25 mM glycine pH 3.0.
One difference noted between the two scales was the size of the late eluting aggregate enriched peak. Different conditioned cell culture media was used for the two experiments, which contained different levels of aggregate. For the bench scale run, the monomer and aggregate levels in the conditioned media column load material were 77% and 23%, respectively. On the other hand, the load material for the pilot scale experiment was 85% monomer and 15% aggregate. Thus, as the bench scale experiment utilized less pure starting material, the second UV peak is more pronounced compared to the pilot scale experiment.
Another difference observed between the two scales was the sharpness of the pH transition from pH 5.5 to 4.0. The bench scale experiment was performed on an AKTA explorer system which generated a sharp pH transition between the pH 5.5 re‐equilibration buffer and the start of gradient elution at pH 4.0. In contrast, the pilot scale experiment was performed on an AKTA pilot system that is operated with an in‐line bubble trap to avoid introduction of air onto the column. Mixing within the bubble trap is dependent operating conditions (e.g., flowrate, buffer density differences, bubble trap volume) and it is likely that these extra‐column contributions led to the more gradual pH transition from 5.5 to 4.0 observed compared to the bench scale run.
As baseline resolution of the two peaks on the UV trace is not observed at either scale, a robust, and reproducible product peak collection strategy is challenging. In general, as is typically seen, aggregate is later eluting but poorly resolved. While a fixed UV set point can be utilized to trigger the start of product collection, the same approach cannot be applied as an end‐collection criterion due the limited selectivity which will lead to varying product volume and quality. One potential solution would be to set a conservative product volume collection criterion that ensures product quality at the expense of a minor sacrifice in yield. Table 1 shows the change in aggregate clearance and monomer yield as product volume for different fixed collection criteria. Process performance and product quality were bracketed across a wide protein loading range of 10–25 g/L protein loading on both bench scale and pilot scale columns with product collection starting at 0.5 OD. Under all conditions tested, product pool aggregate content and monomer yield increased with larger volume collection criteria. At 10 g/L resin protein load, a product collection volume limit of 3.0 column volumes (CV) resulted in a relative aggregate clearance of 52%–54% with a monomer yield of 85%–88%. At 25 g/L resin protein load, the same 3.0 CV collection criteria showed the relative aggregate clearance decreased modestly to 41%–43% with a similar monomer yield of 83%–85%. As a result of the lower aggregate clearance with increasing protein load, the aggregate level in the product pool increased from 10.5%–11% to 13.2%–13.6%.
Table 1.
Aggregate clearance and monomer yield as a function of elution pool volume for MabSelectSuRe gradient elution experiments with Molecule 1
| Column dimensions (i.d. × height) | Protein Load (g/L resin) | Load Aggregate content (% agg) | Product Volume (CV) | Product Pool Aggregate content (% agg) | Absolute Aggregate Clearance* (%) | Relative Aggregate Clearance** (%) | Monomer Yield (%) |
|---|---|---|---|---|---|---|---|
| 2.5 | 10.1 | 12.9 | 56 | 78 | |||
| 0.66 × 20 cm | 10 | 23 | 3.0 | 10.5 | 12.5 | 54 | 88 |
| 3.5 | 11.8 | 11.2 | 49 | 96 | |||
| 2.5 | 10.5 | 12.5 | 54 | 76 | |||
| 0.66 × 20 cm | 10 | 23 | 3.0 | 11.0 | 12 | 52 | 85 |
| 3.5 | 13.0 | 10 | 43 | 93 | |||
| 2.5 | 13.6 | 9.4 | 41 | 82 | |||
| 0.66 × 20 cm | 25 | 23 | 3.0 | 13.6 | 9.4 | 41 | 85 |
| 3.5 | 14.2 | 8.8 | 38 | 90 | |||
| 2.5 | 13.2 | 9.8 | 43 | 78 | |||
| 0.66 × 20 cm | 25 | 23 | 3.0 | 13.2 | 9.8 | 43 | 83 |
| 3.5 | 14.6 | 8.4 | 37 | 87 | |||
| 2.5 | 9 | 6 | 40 | 82 | |||
| 10 × 20 cm | 25 | 15 | 3.0 | 9.4 | 5.6 | 37 | 85 |
| 3.5 | 10.2 | 4.8 | 32 | 88 |
Absolute aggregate reduction = % Agg in load — % Agg in product.
.
For the pilot scale 10 cm diameter column with a 25 g/L resin protein load, a relative aggregate clearance of 37% compared to the material loaded on the column was obtained with a monomer yield of 85% using the 3.0CV collection criteria. Reducing the product collection volume to 2.5 CV increased relative aggregate clearance to 40% with 82% monomer yield. The modest differences in process performance observed at different scales are to be expected given the difference in starting material. Hence, performance verification runs should be performed at scale to allow for re‐optimization of product collection criteria if necessary. Alternatively, a conservative product volume collection criterion can be applied at bench scale to allow for potential variation due to scale and product quality. While the partially resolved UV peaks require the use of a conservative fixed product collection volume which impacts monomer yield, it limits the potential of Protein A for aggregate removal. Advances in the field of Process Analytical Technology (PAT) for peak collection such as the use of in‐line UV spectroscopy measurement in combination with partial least square regression (PLS) techniques22 to deconvolute the contributions of monomer and aggregate species to UV peak intensity during product elution have the potential to improve both yield and robustness. Nonetheless, the simple volume based collection approach shown in Table 1 offers a means to achieve robust incremental aggregate clearance while integrating in a minimally disruptive manner with a preexisting unit operation in the process.
High performance tangential flow filtration
High performance tangential flow filtration (HP‐TFF) is a technique developed by which exploits differences in sieving rates across the membrane to separate product from impurities.23 Unlike the typical TFF configuration where a pump is used to feed load material on the retentate side of the membrane, a separate pump is used to generate a co‐current filtrate flow on the permeate side of the membrane to minimize the formation of a transmembrane pressure gradient along the length of the membrane and improve selectivity. Depending on the properties of the components in the mixture, the product can either be retained while the impurities are removed by membrane sieving or vice versa.24 The latter scenario with product membrane sieving is usually followed a concentration step which may be performed concurrent with the upstream membrane separation step. HP‐TFF has demonstrated the ability to selectivity separate BSA monomer/oligomer mixtures using conventional TFF membranes.24 Charged membranes have also been used to affect selectivity by altering sieving of the different components by manipulating pH and ionic strength.25, 26, 27
HP‐TFF was evaluated in our laboratory using starting material containing Molecule 1 monomer from a monomer (200 kDa) and aggregate (400 kDa and higher) with a 300 kDa molecular weight cut off (MWCO) Pellicon XL regenerated cellulose membrane. Shown in Supporting Information Figure S1 is a diagram of the HP‐TFF apparatus. The membrane was first pre‐equilibrated by recirculating histidine diafiltration buffer (pH 6.0) on the retentate side of the membrane with permeate outlets clamped off, followed by the same procedure on the permeate side. A fixed volume of Molecule 1 monomer/aggregate mixture at 1 g/L was then added to the retentate vessel and recirculated before an equal volume of diafiltration buffer was added to the permeate vessel. The HP‐TFF process was run for 15 DV, with aliquots being collected from the retentate and permeate vessel every 2.5 DVs for HP‐SEC and protein concentration measurements. Figure 4 shows the monomer yield and permeate purity as a function of diafiltration volume. Monomer yield increased with time and reached 81.5% after 15 DV. After 2 DV, the permeate pool purity was 92% monomer with 8% aggregate. After 15 DV, the permeate pool purity increased to 95.5% monomer with 4.5% aggregate, indicating that monomer was selectively sieving through the membrane at a higher rate than aggregate. It should be noted that as the run progressed, the permeate pool was getting more dilute due to the increasing product volume with time. Similarly, on the retentate side of the membrane, the protein concentration was decreasing due to the sieving of product into the permeate. This made it challenging to obtain accurate readings on the protein mass on both sides of the membrane to close the mass balance in the system. Nonetheless, the overall trend in the monomer and aggregate mass transfer across the membrane still proves informative in determining the feasibility of using HP‐TFF for aggregate removal. Further, overlays of the SEC chromatograms of the initial load and the filtrate after 15 DVs (Supporting Information Figure S2) show lower aggregate content in the filtrate compared to the load, demonstrating that monomer is sieving across the membrane faster than aggregate.
Figure 4.
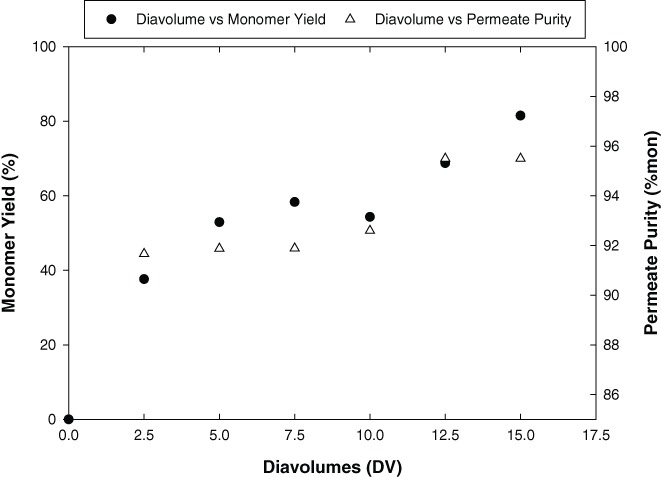
Change in Molecule 1 monomer yield and permeate purity (% mon) with diafiltration volume across a 300 kDa regenerated cellulose membrane using a HP‐TFF Operation.
The HP‐TFF data in Figure 4 appears to show a discontinuity in purity at approximately 7.5 DV. The root cause of this behavior is unknown. It may be due to a sampling error or process upset. Alternatively, given the relatively narrow range of the purity scale on the right axis, it may reflect analytical method variability. Regardless of the actual cause, based on comparison with previously published work we would expect a smoother increase in purity calling into doubt reproducibility of this feature.
While this study highlights the potential of HP‐TFF to provide orthogonal aggregate removal in bispecific antibody purification, there are challenges that must be considered before implementation. As the product is collected on the permeate side of the membrane, final product volume and diafiltration buffer requirements will pose facility fit constraints. The two‐stage closed loop cascade approach developed by Van Reis and Zydney can address these issues through the use of a second UF/DF membrane to concentrate permetate from the first UF/DF membrane and recycle diafiltration buffer back into the retentate vessel to minimize diafiltration buffer consumption.24 However, this configuration requires the use of three separate pumps that must be carefully controlled to achieve steady state operation, increasing both complexity and risk at manufacturing scale.
Another consideration for HP‐TFF is the long processing time required for this unit operation. In our study, 15 DV were required to achieve over 80% yield as the product must be sieved through the membrane. Sieving efficiency is a function of both the physical (i.e., MWCO) and chemical properties of the membrane. The 300 kDa membrane used in this work was selected as it was commercially available and had a MWCO between the monomer and the aggregate species, giving it the best chance of success. Using the next larger pore size commercially available membrane with a higher MWCO (500 kDa) will lead to faster sieving of monomer which will reduce processing time, but sieving of aggregate will also increase leading to a loss in selectivity. Conversely, employing the next available smaller pore size commercially available membrane with a smaller MWCO (100 kDa) will limit sieving of both monomer and aggregate leading to impractically long processing times. The membrane surface can also be chemically modified such as the introduction of charge to alter selectivity.26 However, as monomer and aggregate possess similar protein surface properties, any membrane surface modifications will likely affect both species to similar extents, unlike the separation of product from HCP or DNA.
Lastly, our results suggest large product volumes and hence membrane areas will be required to employ HP‐TFF for scFv‐IgG monomer sieving. This technique relies on operation in the pressure dependent region of the flux‐TMP curve to minimize concentration polarization and maximizes selectivity. Our studies were performed at 1–2 g/L initial concentration, even if this could be improved by a factor of 10, the amount of retentate volume and corresponding membrane area would be prohibitively large. Hence, the use of HP‐TFF was not explored further in this study as a feasible means to achieve incremental aggregate separation. However, the underlying concept remains attractive in this setting, and future advances to membrane technology that improve selectivity and throughput may render this approach viable.
Non‐chromatographic clarification technologies (calcium phosphate precipitation)
Flocculation and precipitation has been used extensively in industry as a means of removing solids and impurities (HCP, DNA and viruses) from a feed stream prior to downstream processing.28, 29 There are limited reports of aggregate clearance by precipitation. Giese and coworkers have demonstrated the feasibility of using polyethylene glycol (PEG) treatment after protein A capture to remove aggregates for a variety of mAb molecules and enable a two‐chromatography column process.30 However, a bind and elute chromatography step is required downstream of the PEG precipitation process to remove remaining soluble PEG from product. Kang and coworkers have used a benzyl poly(allylamine) polymer to remove aggregates from a bispecific antibody mixture via hydrophobic interactions with the polymer which rendered insoluble in the presence of a stimulus.31 The insoluble polymer is then removed using depth filtration resulting in a low aggregate feed stream. Satzer and coworkers has recently shown that addition of calcium chloride to mAb conditioned medium containing phosphate will result in the formation of insoluble calcium phosphate that can effectively precipitate DNA.32 HCP and aggregate levels were also reported to be lower after treatment. As calcium chloride and phosphate buffers present no regulatory or safety hurdles, calcium phosphate precipitation was evaluated as an aggregate removal technique for scFv‐IgG bispecific antibodies.
Precipitation condition screening
As calcium phosphate solubility decreases with pH, studies were carried out at pH 8.0 to maximize formation of insoluble calcium phosphate precipitate. Protein A capture product was neutralized to pH 8.0 after low pH treatment and diluted with 100 mM Tris to a target protein concentration before tris buffer, sodium phosphate and calcium chloride were added sequentially. A range of calcium phosphate and protein load concentrations were screened using 1 mL aliquots. After incubation and gentle agitation for 4 h, the precipitates were spun down and the supernatants were analyzed to determine product purity and monomer yield. Shown in Figure 5a is a contour plot of monomer yield and supernatant aggregate levels for Molecule 1 after addition of different concentrations of calcium chloride and sodium phosphate at a protein load concentration of 3.5 g/L. As calcium chloride and sodium phosphate concentrations increased from 0 to 50 mM, monomer yield decreased from greater than 90% (white region) to less than 50% (dark red region). Aggregate levels in the supernatant concomitantly decreased from 13% in the starting material to less than 1%. It is likely that the insoluble calcium phosphate that is formed acts as a matrix for the binding of both monomer and aggregate species. Based on knowledge of hydroxyapatite chromatography,33 which functions similarly to calcium phosphate precipitation, monomer has a weaker binding affinity compared to aggregate and is displaced in the presence of excess aggregate.
Figure 5.

Effect of calcium chloride and sodium chloride concentrations on monomer yield and aggregate level in the supernatant product during calcium phosphate precipitation condition screening (with 1 mL aliquots) of various BisAb post‐low pH treated products. Molecule 1 at protein load concentration: (a) 3.5 g/L, (b) 3.0 g/L and (c) 4.0 g/L. Dashed outline denotes an operating range of ±2.5 mM in sodium phosphate and calcium chloride concentrations. Load purity: 87% monomer, 13% aggregate. (d) Molecule 2 at protein load concentration 1.5 g/L, Load purity: 75% monomer, 25% aggregate, (e) Molecule 3 at protein load concentration 1.5 g/L, Load purity: 83% monomer, 17% aggregate, (f) Molecule 4 at protein load concentration 1.25 g/L, Load purity, 88% monomer, 12% aggregate.
The amount of monomer or aggregate bound to the precipitate is impacted by the amount of calcium phosphate formed relative to the amount of protein in the system. As calcium chloride and sodium phosphate concentrations are increased, more calcium phosphate is formed resulting in excessing binding capacity and monomer loss. As the protein concentration is increased from 3.0 g/L to 4.0 g/L, the increased aggregate mass results in lower monomer loss and thus higher monomer yields (depicted by the lower area occupied by the dark red regions on the contour plots from Figure 5b,c).
A robust operating range was identified for a 3.5 g/L protein load concentration centered at 15 mM calcium chloride and 20 mM sodium phosphate. Outlined in the blue dotted box (± 2.5 mM) is a range of ±16.7% calcium chloride concentration and ± 12.5% sodium phosphate concentration. Within this operating range > 90% monomer yield and < 7% aggregate in the final supernatant can obtained. For the same operating range at 3.0 g/L (Figure 5b), the lowest monomer yield ranged between 80% and 90%, while at 4.0 g/L (Figure 5c), the highest supernatant aggregate level was 7%. Therefore, using a target condition of 15 mM calcium chloride and 20 mM sodium phosphate, > 80% monomer yield with aggregate reduction to <7% can be achieved within the precipitate and protein concentration operating ranges described above. The removal of aggregate with calcium phosphate precipitation was also evaluated for Molecules 2, 3, and 4 after low pH treatment (Figure 5d,f). Due to differences in the product concentration post low pH treatment, the load concentration ranged from 1.25 to 1.5 g/L. The optimal condition for monomer yield and product purity also varied between molecules. Under a similar range of ±16.7% calcium chloride concentration and ± 12.5% sodium phosphate concentration, monomer yield of >80% and aggregate reduction to <7% was achieved for Molecule 3 and 4. However, for Molecule 2, lower monomer yield (70%–90%) was observed while the final product purity obtained ranged from 7% to 11%. A likely explanation for lower removal of aggregate with molecule 2 is the higher level of aggregate in the starting load material (25% aggregate) compared to molecules 3 and 4 (17% and 12% aggregate, respectively), making the clearance of aggregate more challenging. Hence, calcium phosphate precipitation appears promising as the basis for a bispecific mAB‐like platform process. However, the data presented in this article suggests that precipitation condition optimization is required for each molecule.
Effect of reaction time
It has been reported by Termine and coworkers that calcium phosphate precipitation involves an initial mineral phase separation followed by transition to an amorphous precipitate and finally crystallization into apatitic calcium phosphate.34, 35, 36 As the amount of calcium phosphate present affects yield and purity, the time required for the precipitation reaction to reach an end point was examined. Aliquots containing 50 mL with different concentrations of calcium chloride and sodium phosphate in 100 mM tris buffer, pH 8.0 were prepared and mixed on a rotating device. At specified time intervals, the aliquots were sampled and analyzed for particle size distribution and turbidity. Shown in Table 2 are the average particle diameters and turbidity for equimolar concentrations of calcium chloride, sodium phosphate at 12.5 mM, 25 mM, and 50 mM for a 180‐min reaction. At 12.5 mM, average particle diameter increased with time before remaining constant at 18–19 μm after mixing for 60 min. A similar trend was observed at 25 mM, where the particle size also plateaued at a constant particle diameter of 18–19 μm after mixing for 30 min. However, at 50 mM, the average particle diameter was initially larger at 26.5 μm and only decreased to 18.4 μm after 180 min. Increased turbidity was observed with increasing concentrations of calcium chloride and sodium phosphate due to increased precipitate formation. However, turbidity did not remain constant and started decreasing with time. At 12.5 mM, turbidity was initially 712 NTU and decreased to ~300 NTU after 60 min where it plateaued for the remaining 120 min. A similar trend was observed at 25 mM with turbidity starting at >1000 NTU before stabilizing at ~600 NTU after 30 min. At 50 mM, turbidity remained above 1000 NTU for the duration of the study.
Table 2.
Change in average particle size as measured by laser light scattering and turbidity during incubation of calcium phosphate precipitates for up to 180 min
| Time (min) | Calcium Chloride Concentration (mM); Sodium Phosphate Concentration (mM) | |||||
|---|---|---|---|---|---|---|
| 12.5; 12.5 | 25.0; 25.0 | 50.0; 50.0 | ||||
| Avg. particle size | Turbidity | Avg. particle size | Turbidity | Avg. particle size | Turbidity | |
| (um) | (NTU) | (um) | (NTU) | (um) | (NTU) | |
| 15 | 9.4 | 712 | 12.4 | >1000 | 26.5 | >1000 |
| 30 | 12.4 | 684 | 18.6 | 635 | 26.4 | >1000 |
| 60 | 18.6 | 312 | 18.8 | 641 | 26.5 | >1000 |
| 120 | 18.8 | 315 | 18.8 | 607 | 26.5 | >1000 |
| 180 | 18.8 | 308 | 18.4 | 614 | 18.4 | >1000 |
Based on the outcome of the screening study with 1 mL aliquots, the calcium chloride and sodium phosphate concentration required for optimal monomer yield and product purity were identified to be 15 mM and 20 mM, respectively. This optimal condition is intermittent of 12.5 mM and 25 mM experiments shown in Table 2. As particle diameter and turbidity remained unchanged for 12.5 mM and 25 mM conditions after 60 min and 30 min, respectively, a conservative reaction time of 120 min was set as the target operating condition for all subsequent precipitation experiments. While constant particle diameter and turbidity do not a guarantee that the reaction has reached the apatitic calcium phosphate end point, these simple measurements are practical from a process monitoring and control standpoint.
Precipitation process scale‐up
Batch precipitation performed following low pH treatment for Molecule 1 and scaled to 1 L and 2.5 L reaction vessels using a calcium chloride and sodium phosphate target concentrations of 15 mM and 20 mM, respectively. Shown in Supporting Information Figure S3 is a diagram of the apparatus for the precipitation scale‐up experiments. At each scale, the appropriate amount of protein required to achieve an initial concentration of 3.5 g/L was added to a glass beaker. 100 mM tris buffer, pH 8.0 was then added followed by a bolus spike of 0.5 M sodium phosphate, pH 8.0 to achieve a final sodium phosphate concentration of 20 mM. The solution was then mixed using an A310 hydrofoil axial flow impeller mounted on a shaft that was off center at 10° to the vertical to enhance mixing.37 Sodium phosphate at 0.5 M, pH 8.0 was then dispensed into the vessel through a tube connected to a syringe pump with a preprogrammed dispensing volume to reach a final calcium chloride concentration of 15 mM after a dispensing duration of 6 min. When the addition of calcium chloride was completed, the mixture was left stirring for 120 min prior to depth filtration. Scaling up from the 1 L to 2.5 L scale process was performed by maintaining a constant power/volume (P/V) ratio where V is the total volume of the solution and P is defined by the equation
P0 is the power number of the impeller (0.30 for an A310 impeller), ρ is the density of the precipitate mixture which was assumed to be the same across scales if the same starting material and the same reaction conditions are used. N is the agitation rate of the impeller in rpm. Di is the impeller diameter. For the 1 L reaction, an agitation rate of 150 rpm was used whereas for the 2.5 L reaction, the agitation rate was increased to 200 rpm based on a constant P/V.
Shown in Table 3 is a comparison of the process performance at the 1.0 mL, 1.0 L, and 2.5 L scales using 15 mM/20 mM calcium chloride/sodium phosphate with two different Molecule 1 protein load materials. For load i which had an initial aggregate concentration of 12%, precipitation at the 1 mL scale resulted in a monomer yield of 89% and a final supernatant aggregate concentration of 4%. At the 1 L scale, the monomer yield across two runs averaged 83% with a supernatant aggregate concentration of 3.4%. For load ii which had lower initial aggregate concentration (8.6% aggregate), the 1 mL scale experiments achieved monomer yields of 87% with aggregate levels of 2.9%–3.3%, while at the 2.5 L scale, monomer yield averaged 87% with aggregate levels ranging between 3.4%–3.9% aggregate. Both sets of conditions show similar process performance and product quality, indicating that the precipitation process conditions at the 1 mL scale can be successfully scaled to 1.0–2.5 L.
Table 3.
Process performance and product quality comparison of calcium phosphate precipitation process upon scale‐up from 1 mL to 1000 mL using Molecule 1 load i and from 1 mL to 2500 mL using Molecule 1 load ii calcium phosphate precipitation condition: 15 mM calcium chloride, 20 mM sodium phosphate
| Load | Working Volume (mL) | Load Purity (% Mon, % agg) | Monomer Yield (%) | Product Purity (% Mon, % agg) |
|---|---|---|---|---|
| i | 1 | 88.0, 12.0 | 89 | 96.0; 4.0 |
| 1 | 89 | 96.5; 3.5 | ||
| 1000 | 81 | 96.7; 3.3 | ||
| 1000 | 85 | 96.6; 3.4 | ||
| ii | 1 | 91.4, 8.6 | 88 | 96.7; 3.3 |
| 1 | 87 | 97.1; 2.9 | ||
| 2500 | 86 | 96.6; 3.4 | ||
| 2500 | 88 | 96.1; 3.9 |
Depth filter evaluation for precipitate removal
The precipitation process results in the formation of a highly turbid mixture that must be clarified to remove the precipitates before further processing. Depth filtration studies were performed to evaluate precipitate removal efficiency. Table 4 shows filter capacities of various grades of depth filters using for different calcium phosphate conditions. Lower filter capacities were obtained with increasing calcium phosphate concentrations. C0HC depth filtration resulted in filtrates with lower pool turbidity and lower filter capacity compared to D0HC filters under similar load conditions. The presence of Molecule 1 in the calcium phosphate mixture resulted in higher starting load turbidity, indicating that the protein was likely contributing to turbidity during precipitation. Nonetheless, the depth filter successfully removed all precipitates, resulting in filtrate pool turbidities that were comparable to levels observed with the filtrate pools from calcium phosphate experiments performed without protein.
Table 4.
Capacity evaluation of Millipore C0HC and D0HC depth filters for Molecule 1 calcium phosphate precipitation postlow pH viral inactivation
| Filter Type | Load Condition | Process Scale (L) | Load Turbidty (NTU) | Filter Capacity @10PSI (L/m2) | Filter Capacity @20PSI (L/m2) | Filtrate Pool Turbidity (NTU) |
|---|---|---|---|---|---|---|
| 12.5 mM calcium chloride, 12.5 mM sodium phosphate | 381 | 289 | >289 * | 2 | ||
| C0HC | 25.0 mM calcium chloride, 25.0 mM sodium phosphate | 1.0 | 734 | 122 | 183 | 5 |
| 50.0 mM calcium chloride, 50.0 mM sodium phosphate | >1000 | 72 | 103 | 13 | ||
| 12.5 mM calcium chloride, 12.5 mM sodium phosphate | 381 | 323 | >323 * | 31 | ||
| D0HC | 25.0 mM calcium chloride, 25.0 mM sodium phosphate | 1.0 | 734 | 130 | 190 | 37 |
| 50.0 mM calcium chloride, 50.0 mM sodium phosphate | >1000 | 73 | 104 | 43 | ||
| 1.0 | >1000 | 183 | >183 * | 8 | ||
| C0HC | 15 mM calcium chloride, 20 mM sodium phosphate in 3.5 g/L of molecule 1 | 2.5 | >1000 | 193 | 270 | 6 |
| 2.5 | >1000 | 204 | 274 | 7 |
Transmembrane differential pressure did not reach 20PSI at the end of loading in the study. A value of > filter capacity determined at 10PSI is used in its place.
As depth filtration is performed to remove precipitates after calcium phosphate treatment, the precipitation step can also be implemented prior to loading onto the Protein A capture column. Although aggregate removal using calcium phosphate precipitation with conditioned medium is feasible (Supporting Information Figure S4), the levels of phosphate used during the cell culture process must be monitored and controlled to ensure consistent precipitation performance. Similarly, dilution effects arising from buffer line flushing during the harvest operation also needs to be taken into account to minimize variation in phosphate levels in the conditioned media.
Process integration
Protein A chromatography with gradient elution and/or calcium phosphate precipitation after low pH treatment were integrated into a standard mAb platform purification process to determine the impact of linking unit operations on orthogonal aggregate removal and process performance. A typical three‐column mAb platform purification process consists of Protein A chromatography, low pH treatment, anion (AEX) and cation (CEX) exchange chromatography, nanofiltration, and ultrafiltration/diafiltration (UF/DF). For comparison purposes, the implementation of the aggregate removal techniques was assessed over Protein A chromatography, low pH treatment and CEX (in bind and elute mode with step elution using sodium chloride). A product quality target of >95% monomer purity after CEX was utilized and the CEX elution salt concentration was adjusted depending on the aggregate level on the protein loaded on the column.
Different process configurations were evaluated at bench scale using 0.66 cm diameter columns for the chromatography steps (Figure 6 and Table 5). Calcium phosphate precipitation was performed in 50 mL tubes with optimal calcium phosphate concentrations that identified based on 1 mL aliquot screening studies. For process 1, the Protein A chromatography step was loaded to 25 g/L, rinsed with a pH 5.5 acetate wash buffer and eluted step‐wise using a pH 3.5 acetate buffer. Low pH treatment was performed by titrating the Protein A product to pH 3.5 with acetic acid, holding for 75 min before neutralization to pH 7.5 using tris base. The CEX step was loaded to 25 g/L at pH 5.0 and eluted stepwise at pH 5.0 with sodium chloride. The overall monomer yield across the three steps was 54% and aggregate was reduced from 23% in the conditioned media to 2% in the CEX product. As noted in Table 5, while it was possible to execute this process at bench and achieve low aggregates after CEX at the expense of yield, the level of aggregate removal required of the CEX step is unrealistic in a large‐scale manufacturing scenario, presenting major robustness concerns that would prevent its implementation. To illustrate this point, Supporting Information Figure S5 shows a CEX robustness DOE study with Molecule 2. While there are individual points within the operating space where acceptable yield and purity may be achieved, over the pH, elution salt concentration, and protein loading ranges typically required for large‐scale bioprocessing, the step fails to meet both yield and purity requirements.
Figure 6.
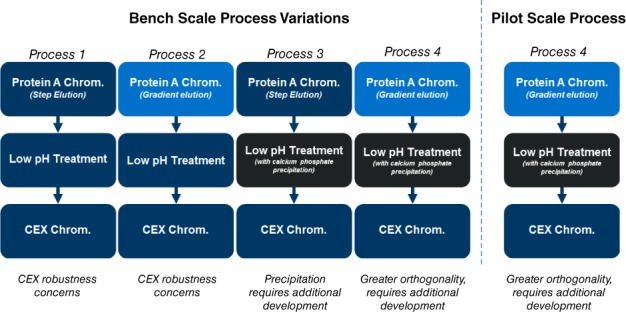
Flow diagram of process variations evaluated with Molecule 1 comparing the baseline process (Process 1) to Protein A chromatography gradient elution and/or calcium phosphate precipitation at both bench and pilot scales (Process 2, 3, and 4).
Table 5.
Process performance of bench scale process variations and pilot scale process evaluation with Molecule 1
| Unit operation | Process 1 (Bench Scale) | Process 2* (Bench Scale) | Process 3*(Bench Scale) | Process 4** (Bench Scale) | TV 4*** Process 4 (Pilot Scale) | |||||
|---|---|---|---|---|---|---|---|---|---|---|
| Monomer Yield (%) | Product Purity (% Mon; % agg) | Monomer Yield (%) | Product Purity (% Mon; % agg) | Monomer Yield (%) | Product Purity (% Mon; % agg) | Monomer Yield (%) | Product Purity (% Mon; % agg) | Monomer Yield (%) | Product Purity (% Mon; % agg) | |
| Conditioned Media | n.a. | 77; 23 | n.a. | 77; 23 | n.a. | 77; 23 | n.a. | 77; 23 | n.a. | 85; 15 |
| Protein A chromatography | 92 | 79; 21 | 83 | 87; 13 | 92 | 79; 21 | 83 | 87; 13 | 80 | 91; 9 |
| Low pH treatment | 94 | 79; 21 | 94 | 87; 13 | 77 | 95; 5 | 88 | 98; 2 | 87 | 97; 3 |
| CEX Chromatography | 61 | 98; 2 | 82 | 97; 3 | 94 | 98; 2 | 98 | 98; 2 | 96 | 97; 3 |
| Overall monomer yield | 54 | n.a. | 64 | n.a. | 67 | n.a. | 71 | n.a. | 68 | n.a. |
Protein A chromatography with gradient elution.
Calcium phosphate precipitation after low pH treatment.
Protein A chromatography with gradient elution and calcium phosphate precipitation after low pH treatment.
When the Protein A step elution was replaced with gradient elution that was generated using an acetate/glycine buffer, aggregate levels in the Protein A product were reduced to 13%. While this is an incremental improvement compared to the baseline process, in our experience the level of aggregates remaining after Protein A (>10%) still present robustness concerns for removal by CEX alone that would preclude implementation of this process in a manufacturing setting.
To further reduce aggregate levels to a range suitable for robust removal by CEX, which typically ranges from 5% to 10%, calcium phosphate precipitation was implemented after low pH treatment. The precipitation step reduced aggregate levels from 21% to 5%, allowing a higher elution salt concentration to be employed during CEX improving the step monomer yield (94%) and overall monomer yield (67%). When both gradient elution on Protein A chromatography and calcium phosphate precipitation was used in the process, the product prior to CEX was below 5% and essentially remained unchanged in the CEX product pool (98% monomer, 2% aggregate).
The process variation incorporating both Protein A gradient elution and calcium phosphate precipitation was also evaluated at the pilot scale using a 10 cm diameter protein A column. Calcium phosphate precipitation was performed at 2.5 L scale out using the apparatus shown in Supporting Information Figure S3. With a starting purity of 85% monomer and 15% aggregate in the cell culture conditioned media, the purity of the product pool after calcium phosphate precipitation was 97% monomer and 3% aggregate, remaining unchanged after the CEX step. Process performance and product quality were comparable at the bench and pilot scales, demonstrating scalability of the process.
Conclusions
Due to high aggregate levels often encountered during recombinant expression of scFv‐IgG bispecific antibodies, current bioprocess development strategies sacrifice both yield and facility fit to achieve the requisite product quality. In a typical mAb three column platform purification process, one polishing step is dedicated forcontrol of aggregate. While this approach may be feasible for mAb cell culture processes which generally express lower aggregate levels, it is unattractive for scFv‐IgG processes due to robustness risks and lack of orthogonality.
Various modalities to introduce orthogonal aggregate removal into the purification process were evaluated. By utilizing gradient elution on the Protein A capture step, an incremental portion of the total aggregate can be removed prior to polishing. Elution buffer pairs should be carefully selected to ensure sufficient pH buffering capacity over the gradient pH range. A combination of glycine and acetate was shown to be optimal for gradient formation from pH 4.0 to 3.0. As baseline resolution between monomer and aggregate was not observed, a fixed product volume collection criteria was successfully implemented and demonstrated to be robust over wide volume collection and protein loading ranges.
By using a membrane with an appropriately sized MWCO, scFv‐IgG aggregate removal was demonstrated by membrane sieving according to principles of HP‐TFF. However, this approach to orthogonal aggregate removal was deemed impractical due to the large volume and membrane area requirements.
Calcium phosphate precipitation was evaluated after low pH treatment and prior to intermediate polishing as a non‐chromatographic means of introducing aggregate removal. Due to the higher binding affinity of aggregates for the insoluble calcium phosphate matrix relative to the monomer, the precipitates were selectively enriched with aggregate and can be removed from the product pool through filtration, leaving an enriched monomeric product in solution. Small‐scale screening experiments were utilized during process development to identify optimal precipitation conditions and robust operating ranges. As calcium phosphate solids undergo phase transitions during the precipitation process, adequate incubation time must be provided to allow the precipitates to achieve a stable form ensuring consistent process performance. As the reaction leads to the generation of a highly turbid feed stream, depth filtration was evaluated for solids removal and clarification. Under optimal conditions ranging from 15 to 25 mM calcium and phosphate, a reduction of 8%–16% aggregate can be achieved.
Integration of Protein A gradient elution and calcium phosphate precipitation with a mAb platform purification process was systematically evaluated. Substantially higher overall monomer yields were obtained compared to process variants that rely solely on the polishing step (CEX) to remove aggregate. In addition to lower yield, limited robustness associated with clearance of very high aggregate levels using a single chromatography polishing steps pose robustness concerns for large‐scale manufacturing. The process variant incorporating both Protein A gradient elution and calcium phosphate precipitation was successfully scaled to the pilot plant, demonstrating comparable process performance and product quality to the bench scale experiment. From starting aggregate levels ranging from 15% to 23% in the condition media, levels were reduced to between 2% and 3% at the end of the CEX step.
Supporting information
Supplemental Table 1: Purification Process Performance of scFv‐IgG bispecific antibody formats using conventional chromatography polishing unit operations. Overall process yield: Percentage of product mass recovered at the end of purification relative to the initial mass in the conditioned media. Overall monomer yield: Percentage of monomer mass recovered at the end of purification relative to the initial monomer mass in the conditioned media. Aggregate levels in the conditioned media is based on the aggregate level in the post‐capture step product determined by HP‐SEC
Supplemental Figure 1. Diagram of High Performance Tangential Flow Filtration (HP‐TFF) apparatus.
Supplemental Figure 2. HP‐SEC traces of the initial load and filtrate after 15 diavolumes (DV)
Supplemental Figure 3. Diagram of calcium phosphate precipitation batch reaction apparatus.
Supplemental Figure 4. Effect of calcium chloride and sodium chloride concentration on monomer yield and aggregate level in the supernatant product during calcium phosphate precipitation condition screening of a) Molecule 1 conditioned media and b) Molecule 3 conditioned media
Supplemental Figure 5. Contour plots depicting monomer yield and product purity (% mon) for Molecule 2 eluted under different pH and salt conditions from a cation exchange CEX column at protein loads of 12.5, 19 and 25 g/L. Dotted square outlines an operating range of ±0.1 pH units and ± 3.5% salt concentration from the target elution pH of 5.2 and elution salt concentration of 140 mM NaCl.
Acknowledgments
The authors would like to thank Ronald Schoner and Richard Turner for their contributions and William Wang for critical review of the manuscript. Cassia Andrade was supported by a Conselho Nacional de Desenvolvimento Científico e Tecnológico scholarship (CNPq/Brazil, Grant: 203023/2014‐5).
[The copyright line for this article was changed on 26‐July‐2019 after original online publication]
Literature Cited
- 1. Staerz U, Kanagawa O, Bevan M. Hybrid antibodies can target sites for attack by T‐cells. Nature. 1985;314:628–631. [DOI] [PubMed] [Google Scholar]
- 2. Kufer P, Lutterbuse R, Baeuerle PA. A revival of bispecific antibodies. Trends Biotechnol. 2004;22(5):238–244. [DOI] [PubMed] [Google Scholar]
- 3. Baeuerle P, Reinhardt C. Bispecific T‐cell engaging antibodies for cancer therapy. Cancer Res. 2009;69(12):4941–4944. [DOI] [PubMed] [Google Scholar]
- 4. Correia I, Sung J, Burton R, Jakob CG, Carragher B, Ghayur T, Radziejewski C. The structure of dual‐variable‐domain immunoglobulin molecules alone and bound to antigen. MAbs. 2013;5(3):364–372. [DOI] [PMC free article] [PubMed] [Google Scholar]
- 5. Spiess C, Zhai Q, Carter PJ. Alternative molecular formats and therapeutic applications for bispecific antibodies. Mol Immunol. 2015;67(2):95–106. [DOI] [PubMed] [Google Scholar]
- 6. Fan G, Wang Z, Hao M, Li J. Bispecific antibodies and their applications. J Hematol Oncol. 2015;8:130. [DOI] [PMC free article] [PubMed] [Google Scholar]
- 7. Kontermann R. Dual targeting strategies with bispecific antibodies. MAbs. 2012;4:182–197. [DOI] [PMC free article] [PubMed] [Google Scholar]
- 8. Kontermann R, Brinkmann U. Bispecific antibodies. Drug Discov Today. 2015;20(7):838–847. [DOI] [PubMed] [Google Scholar]
- 9. Coloma M, Morrison SL. Design and production of novel tetravalent bispecific antibodies. Nat Biotechnol. 1997;15:159–163. [DOI] [PubMed] [Google Scholar]
- 10. Gottschalk U. Process Scale Purification of Antibodies. Hoboken, NJ: John Wiley and Sons Inc; 2009. [Google Scholar]
- 11. Shukla A, Thommes J. Recent advances in large‐scale production of monoclonal antibodies and related proteins. Trends Biotechnol. 2010;28(5):253–261. [DOI] [PubMed] [Google Scholar]
- 12. Stein A, Kiesewetter A. Cation exchange chromatography in antibody purification: pH screening for optimised binding and HCP removal. J Chromatogr B. 2007;848(1):151–158. [DOI] [PubMed] [Google Scholar]
- 13. Ho S, Bardor M, Feng H, Mariati, Tong Y, Song Z, Yap M, Yang Y. IRES‐mediated tricistronic vectors for enhancing generation of high monoclonal antibody expressing CHO cell lines. J Biotechnol. 2010;157:130–139. [DOI] [PubMed] [Google Scholar]
- 14. Qian Y, Jing Y, Li ZJ. Glucocorticoid receptor‐mediated reduction of IgG‐fusion protein aggregation in Chinese hamster ovary cells. Biotechnol Prog. 2010;26(5):1417–1423. [DOI] [PubMed] [Google Scholar]
- 15. Gagnon P. Technology trends in antibody purification. J Chromatogr A. 2012;1221:57–70. [DOI] [PubMed] [Google Scholar]
- 16. Manzke O, Tesch H, Diehl V, Bohlen H. Single‐step purification of bispecific monoclonal antibodies for immunotherapeutic use by hydrophobic interaction chromatography. J Immunol Methods. 1997;208(1):65–73. [DOI] [PubMed] [Google Scholar]
- 17. Liu H, Ma J, Winter C, Bayer R. Recovery and purification process development for monoclonal antibody production. MAbs. 2010;2(5):480–499. [DOI] [PMC free article] [PubMed] [Google Scholar]
- 18. Ghose S, Tao Y, Conley L, Cecchini D. Purification of monoclonal antibodies by hydrophobic interaction chromatography under no‐salt conditions. MAbs. 2013;5(5):795–800. [DOI] [PMC free article] [PubMed] [Google Scholar]
- 19. Yada T, Nonaka K, Yabuta M, Yoshimoto N, Yamamoto S. Choosing the right protein A affinity chromatography media can remove aggregate efficiently. Biotechnol J. 2017;12(1):1600427. [DOI] [PubMed] [Google Scholar]
- 20. Van Slyke DD. On the measurement of buffer values and on the relationship of buffer value to the dissociation constant of the buffer and the concentration and reaction of the buffer solution. J Biol Chem. 1922;52(2):525–570. [Google Scholar]
- 21. Pabst T, Palmgren R, Forss A, Vasic J, Fonseca M, Thompson C, Wang WK, Wang X, Hunter AK. Engineering of novel staphylococcal protein a ligands to enable milder elution pH and high dynamic binding capacity. J Chromatogr A. 2014;1362:180–185. [DOI] [PubMed] [Google Scholar]
- 22. Brestrich N, Sanden A, Kraft A, McCann K, Bertolini J, Hubbuch J. Advances in inline quantification of co‐elutingproteins in chromatography: process‐data‐based model calibration and application towards real‐life separation issues. Biotechnol Bioeng. 2015;112(7):1406–1416. [DOI] [PubMed] [Google Scholar]
- 23. van Reis R, Saksena S. Optimization diagram for membrane separations. J Membr Sci. 1997;129(1):19–29. [Google Scholar]
- 24. van Reis R, Gadam S, Frautschy LN, Orlando S, Goodrich EM, Saksena S, Kuriyel R, Simpson C, Pearl S, Zydney AL. High performance tangential flow filtration. Biotechnol Bioeng. 1997;56(1):71–82. [DOI] [PubMed] [Google Scholar]
- 25. van Reis R, Brake J, Charkoudian J, Burns D, Zydney A. High‐performance tangential flow filtration using charged membranes. J Membr Sci. 1999;159:133–142. [Google Scholar]
- 26. Lebreton B, Brown A, Van Reis R. Application of high‐performance tangential flow filtration (HPTFF) to the purification of a human pharmaceutical antibody fragment expressed in Escherichia coli . Biotechnol Bioeng. 2008;100(5):964–974. [DOI] [PubMed] [Google Scholar]
- 27. Ruanjaikaen K, Zydney AL. Purification of singly PEGylated alpha‐lactalbumin using charged ultrafiltration membranes. Biotechnol Bioeng. 2001;108(4):822–829. [DOI] [PubMed] [Google Scholar]
- 28. Singh N, Arunkumar A, Chollangi S, Tan ZG, Borys M, Li ZJ. Clarification technologies for monoclonal antibody manufacturing processes: current state and future perspectives. Biotechnol Bioeng. 2016;113(4):698–716. [DOI] [PubMed] [Google Scholar]
- 29. Westoby M, Chrostowski J, Vilmorin P d, Smelko JP, Romero JK. Effects of solution environment on mammalian cell fermentation broth properties: enhanced impurity removal and clarification performance. Biotechnol Bioeng. 2011;108(1):5–58. [DOI] [PubMed] [Google Scholar]
- 30. Giese G, Myrold A, Gorrell J, Persson J. Purification of antibodies by precipitating impurities using polyethylene glycol to enable a two chromatography step process. J Chromatogr B. 2013;938:14–21. [DOI] [PubMed] [Google Scholar]
- 31. Kang Y, Hamzik J, Felo M, Qi B, Lee J, Ng S, Shanehsaz B, Singh N, Persaud K, Ludwig DL, Balderes P. Development of a novel and efficient cell culture flocculation process using a stimulus responsive polymer to streamline antibody purifcation processes. Biotechnol Bioeng. 2013;110(11):2928–2937. [DOI] [PMC free article] [PubMed] [Google Scholar]
- 32. Satzer P, Tscheliessnigg A, Sommer R, Jungbauer A. Separation of recombinant antibodies from DNA using divalent cations. Eng Life Sci. 2014;14:477–484. [Google Scholar]
- 33. Schroder E, Jonsson T, Poole L. Hydroxyapatite chromatography: altering the phosphate‐dependent elution profile of protein as a function of pH. Anal Biochem. 2003;313:176–178. [DOI] [PubMed] [Google Scholar]
- 34. Termine JD, Posner AS. Calcium phosphate formation in vitro I. Factors affecting initial phase separation. Arch Biochem Biophys. 1970;140:307–317. [DOI] [PubMed] [Google Scholar]
- 35. Termine J, Peckauskas R, Posner A. Calcium phosphate formation in vitro II. Effects of environment on amorphous‐crystalline transformation. Arch Biochem Biophys. 1970;140:318–325. [DOI] [PubMed] [Google Scholar]
- 36. Boskey AL, Posner AS. Conversion of amorphous calcium phosphate to microcrystalline hydroxyapatite; a pH‐dependent, solution‐mediated, solid‐solid conversion. J Phys Chem. 1973;77(19):2313–2317. [Google Scholar]
- 37. Ram K, Vickroy TB, Lamb KA, Slater NK, Dennis JS, Duffy LE. Mixing in process vessels used in biopharmaceutical manufacturing. Biotechnol Prog. 2000;16(2):244–247. [DOI] [PubMed] [Google Scholar]
Associated Data
This section collects any data citations, data availability statements, or supplementary materials included in this article.
Supplementary Materials
Supplemental Table 1: Purification Process Performance of scFv‐IgG bispecific antibody formats using conventional chromatography polishing unit operations. Overall process yield: Percentage of product mass recovered at the end of purification relative to the initial mass in the conditioned media. Overall monomer yield: Percentage of monomer mass recovered at the end of purification relative to the initial monomer mass in the conditioned media. Aggregate levels in the conditioned media is based on the aggregate level in the post‐capture step product determined by HP‐SEC
Supplemental Figure 1. Diagram of High Performance Tangential Flow Filtration (HP‐TFF) apparatus.
Supplemental Figure 2. HP‐SEC traces of the initial load and filtrate after 15 diavolumes (DV)
Supplemental Figure 3. Diagram of calcium phosphate precipitation batch reaction apparatus.
Supplemental Figure 4. Effect of calcium chloride and sodium chloride concentration on monomer yield and aggregate level in the supernatant product during calcium phosphate precipitation condition screening of a) Molecule 1 conditioned media and b) Molecule 3 conditioned media
Supplemental Figure 5. Contour plots depicting monomer yield and product purity (% mon) for Molecule 2 eluted under different pH and salt conditions from a cation exchange CEX column at protein loads of 12.5, 19 and 25 g/L. Dotted square outlines an operating range of ±0.1 pH units and ± 3.5% salt concentration from the target elution pH of 5.2 and elution salt concentration of 140 mM NaCl.