If you have ever seen the glow of a hand-stamp in an amusement park, you witnessed fluorescence. The physical principles of fluorescence dictate that energy inherent to the exciting light bumps an electron in an atom from a lower energy state to a higher energy state, after which the electron releases energy in the form of light when it returns to the ground state. The light emitted by the substance has less energy than the energy absorbed and thus also is of longer wavelength. A spectacular illustration of fluorescence is when the source light is in the ultraviolet region of the spectrum that is invisible to us (black light) while the emitted light is in the visible range (> 400 nm) (red through violet). Teeth and fingernails contain fluorescent molecules and thus glow under black light. Similarly, some chromophores in fabrics, laundry detergents, and paints are fluorescent.
Fluorescence and the colors we otherwise perceive are not the same. White light is composed of all of the colors in the visible spectrum. For example, an object is observed as red because the substance reflects only the red portion of the spectrum while selectively absorbing the other wavelengths. White objects reflect all wavelengths, whereas black objects absorb all wavelengths. On the other hand, fluorescence is emitted, not reflected, light.
Fluorescence is a property of coral and jellyfish. The ink in highlighters fluoresces due to the presence of specific water-soluble fluorescent dyes. Fluorescent molecules are incorporated into banknotes, credit cards, and Canadian passports as a measure to resist counterfeiting or forgery. In the laboratory setting, fluorescent molecules can be used to locate structures in cells or tissues.
The retina also exhibits a natural autofluorescence (fundus autofluorescence) that is excited by external light and imaged by confocal scanning laser ophthalmoscopy. Confocal scanning laser ophthalmoscopy produces excitation at a specific laser-generated wavelength that is targeted onto a defined tissue plane. It then detects the fluorescent emission solely from that plane, which is accomplished by the insertion of pinholes into the system. Fundus autofluorescence can be generated by excitation with both short-wavelength (SW-AF) “blue” and near-infrared (NIR-AF) excitation. Both of these emissions originate primarily in retinal pigment epithelial (RPE) cells.
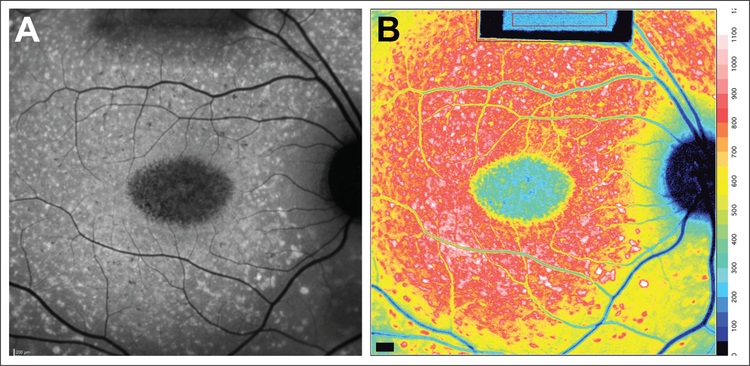
The clinical diagnosis and monitoring of hereditary retinal disease having onset in childhood can be aided by observing changes in the patterns and intensities of fundus autofluorescence. The fluorophores that serve as the origin of blue autofluorescence consist of a family of vitamin A aldehyde-adducts that form non-enzymatically in photoreceptor cells and accumulate in RPE cells as lipofuscin. These fluorophores are amassed by all healthy eyes but are particularly abundant in recessive Stargardt disease (STGD1) due to mutations in the ABCA4 (ATP-binding cassette, transporter 4) gene. The quantification of blue fundus autofluorescence (qAF) (Figure 1) using established protocols can be used to define genotype–phenotype correlations and guide clinical diagnosis and genetic testing in ABCA4-related disease. ABCA4-associated diseases can also be distinguished from non-ABCA4-associated diseases that share a similar phenotype (eg, bull’s eye maculopathy) by qAF.
Figure 1.
Quantitative fundus autofluorescence (qAF) in recessive Stargardt disease in a 12-year-old patient. (A) Short-wavelength (488 excitation) and (B) color-coded qAF image. Lower qAF levels are indicated in blue and higher qAF levels in red. To calculate qAF, gray levels in Figure 1A were normalized to gray levels in the internal reference (rectangle at top of image).
Although it had been assumed that RPE lipofuscin contributed to disease processes outside the vitelliform lesion in Best vitelliform macular dystrophy, qAF was not elevated in non-lesion retina. On the other hand, the finding that qAF was elevated in the presence of retinal disease due to mutations in PRPH2/RDS leaves open the question as to whether increased lipofuscin is a primary or secondary effect of that disease.
SW-AF can be used as a diagnostic and prognostic tool in retinitis pigmentosa. A hallmark is the presence of rings or arcs of elevated autofluorescence in SW-AF and NIR-AF images. These rings are not genotype specific and are considered to reflect a transition between healthy retina inside the ring and unhealthy retina beyond the outer border of the ring. By demonstrating that the autofluorescence of these rings is not just apparent (due to decreased SW-AF intensity in adjacent areas of retina) but is actually elevated relative to corresponding areas in healthy eyes, it was revealed that the natural history of many forms of retinitis pigmentosa can include increased production of phototoxic bisretinoids.
SW-AF imaging has become a part of standard care in many retinal settings, whereas NIR-AF imaging is used less commonly. NIR-AF (787 nm excitation) recorded at the fundus originates primarily from RPE melanin with a lesser contribution from choroidal melanin. The NIR-AF signal serves as an excellent indicator of RPE integrity and in STGD1 a decline in NIR-AF can be predictive of ellipsoid zone loss in spectral-domain optical coherence tomography. Because the NIR light is invisible, acquisition of NIR-AF images can be more comfortable for children.
Acknowledgments
Supported by the Jonas Children’s Vision Care Program.
Footnotes
The author has no financial or proprietary interest in the materials presented herein.


