

Abstract
The larger intracranial conduit vessels contribute to the total cerebral vascular resistance, and understanding their vasoreactivity to physiological stimuli is required when attempting to understand regional brain perfusion. Reactivity of the larger cerebral conduit arteries remains understudied due to a need for improved imaging methods to simultaneously assess these vessels in a single stimulus. We characterized reactivity of basal intracranial conduit arteries (basilar, right and left posterior, middle and anterior cerebral arteries) and the right and left internal carotid arteries, to manipulations in end-tidal CO2 (PetCO2). Cross-sectional area changes (%CSA) were evaluated from high-resolution (0.5 mm isotropic) images collected at 7 T using a T1-weighted 3D SPACE pulse sequence, providing high contrast between vessel lumen and surrounding tissue. Cerebrovascular reactivity was calculated as %CSA/ΔPetCO2 in eight healthy individuals (18–23 years) during normocapnia (41 ± 4 mmHg), hypercapnia (48 ± 4 mmHg; breathing 5% CO2, balance oxygen), and hypocapnia (31 ± 8 mmHg; via hyperventilation). Reactivity to hypercapnia ranged from 0.8%/mmHg in the right internal carotid artery to 2.7%/mmHg in the left anterior cerebral artery. During hypocapnia, vasoconstriction ranged from 0.9%/mmHg in the basilar artery to 2.6%/mmHg in the right posterior cerebral artery. Heterogeneous cerebrovascular reactivity to hypercapnia and hypocapnia was characterized across basal intracranial conduit and internal carotid arteries.
Keywords: Cerebral blood flow, hemodynamics, imaging, magnetic resonance imaging, ultrasound
Introduction
Reactivity of cerebral blood flow to carbon dioxide (CO2) represents a key measurement of cerebrovascular health. Commonly, cerebrovascular reactivity (CVR) data are acquired by insonating one of the major intracranial conduit vessels, such as the middle cerebral artery (MCA), using transcranial Doppler (TCD), and calculating absolute and relative changes in hemodynamic responses (i.e. velocity as a surrogate of changes in flow) to a given stimulus (e.g. changes in partial pressure of CO2). This approach, focusing on flow velocity alone, provides information regarding the integrated downstream vascular response beyond the source of flow information and relies on an assumption that the conduit vessel diameter remains constant across a wide range of end-tidal CO2 partial pressures (PetCO2).1 Yet, the ability of these vessels to modify this resistance through local vasoactive responses remains poorly understood in humans. The importance of this question lies in the idea that any change in cross-sectional area (CSA) of these vessels will exert considerable influence on total flow, leading to underestimations of CVR if based solely on changes in flow velocity and not via changes in blood flow.2
A major limitation in understanding cerebral conduit artery reactivity to carbon dioxide has been the ability to visualize the actual artery. The introduction of higher field magnetic resonance imaging systems has enabled direct visualization of these vessels that lie at the base of the brain. However, MRI field strength matters in terms of resolving vascular wall-luminal boundaries and CSA of these vessels. For example, using 1.5 Tesla MRI, no changes in diameter of the MCA were observed during moderate hypercapnia or hypocapnia.3 These data are in contrast to those collected at 3 Tesla field strength, where MCA reactivity to manipulations in PetCO2 was observed,2 a response also shown by Verbree et al.4 using 7 Tesla field strength. These data support the idea that larger intracranial vessels contribute to overall cerebrovascular resistance.5 The proposal that large conduit arteries provide resistance to cerebral blood flow is supported by evidence from several species,5 and indirectly by recent evidence in humans. Specifically, Warnert et al.6 used 3 Tesla arterial spin labelling to infer cerebrovascular resistance changes from changes in cerebral arterial compliance following a hypercapnia stimulus. In contrast, limited dilation was observed in the circle of Willis arteries when studied using phase contrast imaging.7 Explanations for these discrepancies may include differences in the hypercapnia stimulus used, or in limitations regarding the arterial spin labelling and phase contrast imaging to study vessel CSA. To date, direct measures of cerebral conduit artery CSA by anatomical imaging are limited to the MCA at 3 T MRI, outlined above.
The intracranial basal cerebral conduit vessels are arranged in a collateral vascular network, comprising the anterior, middle and posterior cerebral arteries, which are interconnected with communicating arteries to form the circle of Willis. These vessels receive flow from the extracranial internal carotid and vertebral arteries, the latter linking to the basilar artery as it enters the cranium. Using TCD ultrasound measures of mean flow velocity, several groups have illustrated that, through manipulations in PetCO2, CVR is not homogenous across all intracranial cerebral arteries. Namely, the MCA circulation expressed greater CVR to PetCO2 stimulus than the posterior circulation (i.e. posterior cerebral arteries; PCA), as illustrated during the hyperoxic rebreathing approach8,9 and a breath-hold paradigm.10 Similarly, using TCD methods, flow velocity reactivity within intracranial arteries (i.e. MCA and PCA) differed from extracranial arteries (i.e. internal carotid and vertebral arteries).11 These data suggest heterogenous vasoactive patterns are expected across intracranial conduit arteries and the perfusing extracranial vessels. However, this assumption relies significantly on the reactivity of the conduit vessels themselves.
Despite information that basal cerebral arteries may contribute to changes in CVR, technical limitations have prevented direct measurements of these vessels made simultaneously during a single steady-state dose of PetCO2. To address this, Kellawan et al.7 used 4-dimensional Phase Contrast Vastly undersampled Isotropic Projection Reconstruction (PC VIPR) in a 3 Tesla MRI to measure luminal blood flow velocity profiles, the outer boundaries of which provided an index of changes in vessel cross-sectional in response to hypercapnia. This study provided hemodynamic and anatomical data on the cerebral conduit vessels and the two vertebral arteries with observations that only two of the larger intracranial vessels dilated. Whether this limited response was due to the small dose of carbon dioxide (+4 mmHg above normocapnia), or the indirect measurement approach, is not known.
These limitations in vascular wall dimensions may be overcome with structural (e.g. T1 or T2) MRI sequences, with additional enhancements from higher-field MRI. In this study, imaging resolution was enhanced through use of a 3D T1-weighted structural image sequence on an ultra-high field 7 Tesla MRI. This approach provided improved tissue contrast and spatial resolution between the arterial lumen and the surrounding anatomical neural tissue providing, for the first time, simultaneous and direct capture of structural changes across the intracranial cerebral conduit vessels and the internal carotid and basilar arteries at any arbitrary orientation. Subsequently, the present study characterized simultaneous dilatory and constrictor-based reactivity of each of these vessels. As a first objective, we interrogated the basilar, left and right middle, posterior, and anterior cerebral, and internal carotid arteries, to manipulations (i.e. hypocapnia to hypercapnia) of PetCO2 in young healthy adults. Our second objective was to measure cerebral blood flow and conductance changes in the MCA (using combined TCD and MRI methods) to replicate earlier studies highlighting MCA reactivity obtained at 3T MRI2 and at 7 T MRI.4
Materials and methods
All testing was conducted in accordance with the Declaration of Helsinki and study ethics approval was obtained from the Research Ethics Board at the University of Western Ontario. Informed consent was acquired. A health history screening and study eligibility were determined prior to experimentation.
Subjects
Eight healthy adults (age range 18–23 years; five males, three females) with a normal BMI of 19–28 kg/m2, and without diabetes or any known cardiovascular or psychological complications, participated in this study. All participants were non-smokers and unmedicated. All participants refrained from exercise, alcohol, and caffeine 12 h prior to all testing. Supine mean arterial pressure (MAP), heart rate (HR), and PetCO2 are shown in Table 1.
Table 1.
Hemodynamic parameters and cross-sectional area changes during the three breathing conditions.
| Hypocapnia | Normocapnia | Hypercapnia | |
|---|---|---|---|
| PetCO2 (mmHg) | 31 ± 8a | 41 ± 4 | 48 ± 4a,b |
| MAP (mmHg) | 85 ± 11 | 86 ± 12 | 93 ± 15a,b |
| HR (bpm) | 67 ± 7 | 65 ± 7 | 65 ± 9 |
| BA (mm2) | 7.2 ± 1.6 ( − 7 ± 18%) | 7.9 ± 1.9 | 9.4 ± 1.8a,b (21 ± 21%) |
| LPCA (mm2) | 2.5 ± 0.5a (−21 ± 22%) | 3.2 ± 0.7 | 3.5 ± 0.8a,b (8 ± 5%) |
| RPCA (mm2) | 2.6 ± 0.4a (−24 ± 12%) | 3.6 ± 0.9 | 4.2 ± 1.1b (18 ± 20%) |
| LMCA (mm2) | 5.2 ± 1.7a (−21 ± 21%) | 6.8 ± 1.7 | 7.7 ± 1.9a,b (15 ± 10%) |
| RMCA (mm2) | 5.7 ± 1.5a ( − 15 ± 7%) | 6.7 ± 1.8 | 7.4 ± 1.8a,b (11 ± 10%) |
| LICA (mm2) | 14.6 ± 4.6a (−10 ± 5%) | 16.2 ± 4.7 | 17.9 ± 5.5a,b (10 ± 7%) |
| RICA (mm2) | 16.6 ± 6.9a (−15 ± 14%) | 18.9 ± 6.7 | 19.7 ± 6.8b (5 ± 9%) |
| LACA (mm2) | 2.9 ± 0.9a (−17 ± 11%) | 3.5 ± 0.8 | 4.3 ± 1.1a,b (22 ± 16%) |
| RACA (mm2) | 2.9 ± 0.5a (21 ± 16%) | 3.8 ± 0.5 | 4.5 ± 1.0b (18 ± 19%) |
| MCA (cm/s) | 47 ± 10a | 63 ± 19 | 85 ± 24a,b |
| (ml/min) | 160 ± 53a | 249 ± 93 | 373 ± 125a,b |
| (ml/min/mmHg) | 1.9 ± 0.5a | 2.9 ± 0.9 | 3.9 ± 0.9a,b |
| (%Flow/mmHg) | − 6.5 ± 4.3 | – | 10.4 ± 9.6b |
Note: Mean arterial pressure (MAP), heart rate (HR), end tidal CO2 (PetCO2) values from the laboratory testing session, and cross-sectional area (averaged measurements between two observers) for the basilar artery (BA), left and right posterior cerebral artery (LPCA and RPCA), left and right middle cerebral artery (LMCA and RMCA), left and right internal carotid artery (LICA and RICA), and left and right anterior cerebral artery (LACA and RACA) from MRI images are shown. Percent change in CSA from Normocapnia is indicated in parentheses after the CSA values. Average RMCA velocity (), calculated flow (), conductance (), and MCA Flow reactivity are also provided. Data presented as mean ± S.D. for n = 8 participants.
Indicates different from normocapnia.
Indicates different from hypocapnia (P < 0.05).
Laboratory equipment setup and experimental protocol
This study includes two study phases. The first phase provided familiarization to the study procedures and TCD-based MCA flow velocity data within a laboratory setting. The second phase provided the MRI data. In the laboratory phase, supine participants were connected to a three-lead electrocardiogram for continuous HR monitoring (Colin Pilot, Colin Medical Instruments, San Antonio, TX, USA). Continuous beat-to-beat arterial blood pressure was monitored using a Finapres® Finometer system, where a finger cuff was placed on the middle phalange of the third finger, and the finger blood pressure was calibrated with an upper arm cuff (Finapres® Medical Systems, Amsterdam, Netherlands). Stroke volume and cardiac output were calculated by the Finapres® Model Flow algorithm. End-tidal CO2 was monitored continuously via a modified oxygen mask (Trudell Medical Marketing Limited, London, ON, Canada) with a built-in sampling port, and a sampling line connected to a gas analyzer (ADInstruments, Dunedin, Otago, New Zealand). The MCA was insonated with a 2 MHz ultrasound probe placed at the temporal window and peak velocity envelope was collected using the Neurovision TCD System (Multigon Industries Inc., NY, USA). All devices were connected to a PowerLab data acquisition system (ADInstruments, Dunedin, Otago, New Zealand) and saved for offline analysis using LabChart software (LabChart Pro v.8, ADInstruments, Dunedin, Otago, New Zealand).
The experimental protocol consisted of three breathing conditions (i.e. normocapnia, hypercapnia, and hypocapnia), each lasting 10 min. The order of breathing conditions was randomized for each participant. To assist with maintenance of breathing rate, the participants were asked to follow a digital metronome projected on a computer monitor that was set to three different values, each corresponding to a breathing condition (i.e. breathing rate was set to 16 breaths/min for normocapnia, 13 breaths/min for hypercapnia, and 25 breaths/min for hypocapnia). Both normocapnia and hypocapnia consisted of breathing room air; however, in addition to breathing at 13 breaths/min for the hypercapnia condition, participants breathed a gas mixture with elevated CO2 levels (5% CO2, 95% O2) using a 5L Douglas bag and a ventilation tube attached to the face mask. Hemodynamic parameters (i.e. MCA velocity, arterial blood pressure, HR, cardiac output, and stroke volume) and PetCO2 levels were monitored continuously throughout the duration of the experimental protocol.
Magnetic resonance imaging experimental protocol
Prior to each imaging session, participants were screened, by a certified MRI technologist, for contraindications within an MRI environment to ensure safety. Subjects were then placed on the MRI bed, in the supine position, with their head placed within the RF coil. The RF coil was able to accommodate a low-profile face mask (same used in the laboratory testing session) which was worn with a sampling line inserted for continuous PetCO2 measures and for delivery of elevated CO2 gas during the hypercapnia breathing protocol. Each participant followed the same order of breathing conditions as in the laboratory session. To assist with breathing instructions, the metronome from the laboratory session was also projected onto a screen that was visible to the participant during scanning.
All measurements were performed on a 7 T neuro-optimized MRI scanner (Siemens MAGNETOM, Erlangen, Germany) using an in-house built 8-channel transmit, 32-channel conformal receive head coil. Vessel CSA measurements were evaluated from images collected using a T1-weighted 3D SPACE pulse sequence,12 which was adapted and optimized for use at 7 T. The 3D-SPACE pulse sequence maintains signal intensity over long echo trains and importantly reduces power deposition using non-selective, variable low flip angle evolution schemes, tailored for the contrast of interest (i.e. T1w). T1w SPACE also does not require magnetization preparation, or saturation of through-plane flow for inter-luminal blood signal suppression,13,14 and, as such, data can be collected in any orientation and imaging slab thickness to produce black-blood. Nulling of signal from the blood creates high signal contrast between vessel lumen and surrounding tissue. All data were acquired in a sagittal orientation, at high-resolution (0.5 mm isotropic, whole brain), with the following imaging parameters (TE = 8.2 ms, TR = 700 ms, FOV =224 mm, matrix = 448 × 448 × 256, Turbo Factor = 96, BW = 587 Hz/px, iPat = 2, TA = 5:38 min). A radial trajectory was utilized to minimize the echo time and because it is inherently robust to motion and the distribution of artifacts which will have less of an impact on the vessel measurements.15 All MRI images were saved as DICOM files for offline analysis.
Data analyses
All analyses, with the exception of MRI data, were completed offline using LabChart software (for laboratory testing). OsiriX software (Pixmeo©, Geneva, Switzerland) was used for CSA measurements of the larger intracranial vessels from the MRI images. MAP (in mmHg) was taken as the average of beat-by-beat arterial blood pressure, which was acquired continuously throughout the duration of the protocol using the Finometer system. MAP, HR (in bpm), PetCO2 (mmHg) and MCA velocity (cm/s) were averaged over 30 s under steady-state conditions (i.e. in the final minute of hypercapnia and hypocapnia).
For CSA measures of the cerebral arteries, the isotropic black blood, T1-weighted images were reformatted using multi-planar reconstruction (MPR) providing arbitrary alignment of the images to the orientation of the arteries and ensuring measurements were made in cross sections perpendicular to the artery. Specifically, in the axial plane of the 3D MPR, a plane was selected along the center axis, parallel to the vessel length, which resulted in a transverse view of the artery in the sagittal view where a cross-sectional measure was then obtained. This method was applied for measurement of the middle and PCAs. For the anterior and basilar cerebral arteries, as well as the internal carotids, the cursor was placed parallel to the artery in the sagittal plane and the cross-sectional measure was obtained in the axial plane. Using the perpendicular cross-section, a region-of-interest (ROI) was manually drawn by two observers (BA and LS), blinded to breathing condition, using the high contrast boundary to the surrounding tissue as a guideline. The ROI was subsequently used to calculate the area of the enclosed polygon. The coronal plane was not used in the analysis. The normocapnic scan was analyzed first for all participants, and a digital screenshot was acquired for each analyzed artery. These screenshots were then used to assist in matching anatomical fiducials of the normocapnic condition to the hyper and hypocapnic conditions that were analyzed without knowledge of the normocapnic CSA. This model provided consistent anatomical placement during measurement across all conditions and between the two observers (BA and LS), while minimizing the risk of bias from the normocapnic measurement.
Similar to the laboratory session, MRI PetCO2 values were averaged over 30 s under steady-state conditions (i.e. in the final minute of hypercapnia and hypocapnia). Percent change of cross-sectional area () from normocapnia was calculated for both the hypercapnia or hypocapnia condition using the following
| (1) |
where refers to CSA of artery under steady-state normocapnic conditions, and refers to CSA of artery under either steady-state hypercapnia or hypocapnia conditions. From equation (1), cross-sectional reactivity () was then calculated as
| (2) |
where refers to end-tidal CO2 levels under steady-state normocapnic conditions, and refers to end-tidal CO2 levels under either steady-state hypercapnia or hypocapnia conditions during the MRI scan.
To calculate blood flow in the MCA, the mean velocity acquired from the laboratory session was multiplied by the CSA obtained from the MRI scan, for each of the three conditions
| (3) |
and as previously described, (MCA velocity; in cm/s) was calculated as a 30 s average of the MCA velocity during steady-state conditions. was then converted to units of ml/min. Using equation (3), MCA vascular conductance (; in ml/min/mmHg) was calculated using MAP measures from the laboratory session that were time-aligned with the 30 s average used during MCA velocity data acquisition
| (4) |
Finally, MCA flow reactivity to hypercapnia and hypocapnia was calculated as
| (5) |
where refers to either MCA flow during hypercapnia or hypocapnia (calculated using equation (3)) and refers to MCA Flow during normocapnia.
Finally, to address the role of MAP on CSA changes across vessels, a linear regression was conducted on each vessel across all subjects (Table 1).
Statistical analyses
The effect of condition on measured variables was assessed using a repeated measures one-way analysis of variance (ANOVA; GraphPad Prism, GraphPad Software Inc., La Jolla, CA, USA). In the event of significance, specific comparisons were made using Tukey’s post hoc analysis. An α-level of 0.05 was selected for significance. Where applicable, the effect size was calculated using Cohen’s d. Bland–Altman analysis was conducted to compare CSA measurements between the two observers across all nine arteries. Linear regression analyses assessed the relationship between concurrent changes in mean blood pressure and changes in vessel CSA. All data are presented as mean ± S.D. except where otherwise stated.
Results
PetCO2 levels, MAP, HR, CSA for the larger intracranial arteries, ICAs and basilar artery, as well as steady-state hemodynamic parameters during the three breathing conditions are summarized in Table 1. The Bland–Altman analysis of inter-rater variability of CSA measurements showed a bias of 0.02, a standard deviation of bias of 1.24, and a 95% limits of agreement ranging from −2.41 to 2.45.
By design, PetCO2 values increased from hypocapnia, normocapnia and hypercapnia (Laboratory measures: Table 1; P < 0.05). All MRI PetCO2 values were similar to the PetCO2 values from the laboratory session where hypocapnic (30 ± 8 mmHg) and hypercapnic (52 ± 5 mmHg) conditions were different than the normocapnic condition (40 ± 4 mmHg) and hypercapnia was different from hypocapnia (P < 0.05). MAP values were similar between the hypocapnic and normocapnic conditions, but were higher during hypercapnia compared to normocapnia (Table 1; P < 0.05). HR was similar across all conditions.
The optimized T1-weighted 7 Tesla MRI scan provided high resolution (0.5 mm isotropic voxel resolution) images of the larger intracranial vessels with high contrast between the luminal space and the surrounding anatomical neural tissue, thereby improving the visual contrast of vessel lumens (Figure 1).
Figure 1.
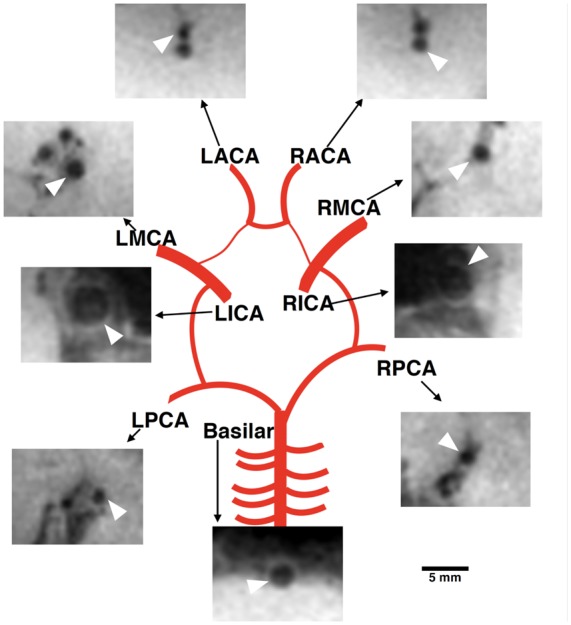
Representative schematic of the cross-sectional area for the nine arteries during normocapnia. Images were acquired using the T1-weighted sequence and were cropped for this schematic. White arrow points to indicated artery, and scale only applies to cropped MRI images.
The LPCA, RPCA, RMCA, LICA, and LACA, and RACA values of CSA differed in all three conditions (i.e. constriction during hypocapnia, dilation during hypercapnia, and dilation when comparing hypocapnia to hypercapnia).
Simultaneous CSA CVR (%CSA/mmHg) across the nine arteries was calculated using equation (2) during hypocapnia and hypercapnia (Figure 2). At each of the nine vessels, CVR was different for the hypercapnic versus the hypocapnic condition (paired t-test at each vessel between the two conditions; P < 0.05; Cohen’s d for basilar: 1.3; LPCA: 2.1; RPCA: 2.4; LMCA: 2.4; RMCA: 1.9; LICA: 2.4; RICA: 1.8; LACA: 2.8; RACA: 2.0). In the hypercapnic state, the basilar and left anterior cerebral arteries had the greatest CVR at 2.6 ± 0.9 and 2.7 ± 0.7 %CSA/mmHg, respectively, and the right internal carotid artery had the lowest CVR at 0.8 ± 0.5 %CSA/mmHg. In the hypocapnic state, the right posterior cerebral artery had the greatest CVR at −2.6 ± 0.7 %CSA/mmHg and the basilar artery had the lowest CVR at −0.9 ± 0.9 %CSA/mmHg. Between the two hemispheres, left and right arteries (eight vessels, four pairs) exhibited similar CVR in both the hypercapnic and the hypocapnic conditions.
Figure 2.

Cerebrovascular cross-sectional area reactivity (%CSA/mmHg of PetCO2) to hypocapnia and hypercapnia across nine arteries. LPCA and RPCA: left and right posterior cerebral artery; LMCA and RMCA: left and right middle cerebral artery; LICA and RICA: left and right internal carotid artery; LACA and RACA: left and right anterior cerebral artery (n = 8 participants). Data presented as mean ± S.E.M. There was a difference between hypercapnia CVR and hypocapnia CVR at each vessel; paired t-test (P < 0.05).
Linear regression analysis between ΔMAP and ΔCSA (from baseline) during hypercapnia was conducted on the nine vessels of interest (basilar: R2 =0.15; LMCA: R2 = 0.02; RMCA: R2 = 0.34; LPCA: R2 = 0.001; RPCA: R2 = 0.002; LICA: R2 = 0.58, P < 0.05; RICA: R2 = 0.63, P < 0.05; LACA: R2 = 0.48; RACA: R2 = 0.62, P < 0.05). Thus, changes in MAP did correlate with RICA and LICA CSA changes, but did not correlate with the cerebral arteries except for in the RACA.
Calculated blood flow and conductance changes in MCA
The MCA TCD insonation depth ranged from 4.8 to 5.6 cm. There was a 35% increase in MCA velocity during hypercapnia (85 ± 24 cm/s), a 25% decrease in velocity during hypocapnia (47 ± 10 cm/s) from normocapnia (63 ± 19 cm/s), and an 81% increase from hypocapnia to hypercapnia (Table 1; P < 0.05).
All participants responded with greater MCA velocities, CSA, calculated flow, and conductance in response to hypercapnia as well as a decrease in velocities, CSA, calculated flow and conductance during hypocapnia (Figure 3 for schematic on MCA CSA and velocity measures), as indicated by a positive slope describing the relationship between these variables and PetCO2 for each participant (Figure 4, Panel A–D). Compared to normocapnia, MCA CSA increased 11% during hypercapnia, and decreased 15% during hypocapnia. Compared to normocapnia, MCA flow (calculated using equation (3)) increased by 49% during hypercapnia, and decreased by 35% during hypocapnia. Compared to normocapnia, MCA conductance (calculated using equation (4)) increased by 39% during hypercapnia, and decreased by 35% during hypocapnia.
Figure 3.

Schematic of measurements taken from the laboratory and MRI sessions. Representative MRI image highlighting a transverse cross-section in the sagittal plane of the right middle cerebral artery during hypocapnia, normocapnia and hypercapnia breathing conditions, and the corresponding condition’s PetCO2 levels and right MCA velocity measures during the laboratory session.
Figure 4.

Right middle cerebral artery (MCA) velocity, cross-sectional area (CSA), calculated flow, and conductance during hypocapnia, normocapnia and hypercapnia for each participant. Each participant’s data set is indicated by an individual line (n = 8). Panel A: MCA velocity increased from the hypocapnic to the hypercapnic states, as highlighted by positive slopes with increasing PetCO2 levels. Panel B: MCA CSAs increased from the hypocapnic to the hypercapnic states, as highlighted by positive slopes with increasing PetCO2 levels. Panel C: MCA flow (ml/min) increased from the hypocapnic to the hypercapnic states, as highlighted by positive slopes with increasing PetCO2 levels. Panel D: MCA conductance increased from the hypocapnic to the hypercapnic states, as highlighted by positive slopes with increasing PetCO2 levels.
MCA Flow reactivity from normocapnia (calculated using equation (5)) was greater during hypercapnia compared to hypocapnia (10 ± 10 vs. − 6.5 ± 4.3 %MCA Flow/mmHg, respectively; paired t-test across participants, P < 0.05).
Comparing CVR calculations using calculated MCA flow versus MCA velocity
To assess whether the inclusion of diameter measurements in CVR calculations during hypercapnia and/or hypocapnia (i.e. equations (3) and (5)) produced different results than the traditional CVR calculations that rely on MCA velocity changes (i.e. %MCA Velocity/ΔPetCO2), we calculated CVR using MCA velocity only for hypercapnia and hypocapnia (6.9 ± 5.2 and − 2.0 ± 0.8 %MCA Velocity/mmHg, respectively). Hypercapnic CVR was 10 ± 10 %Flow/mmHg for MCA Flow vs. 6.9 ± 5.2 %Velocity/mmHg for MCA flow Velocity; paired t-test, P = 0.06. During hypocapnia, CVR was nearly 70% lower when using MCA Velocity compared to MCA Flow (−2.0 ± 0.8 %Velocity/mmHg vs. −6.5 ± 4.3 %Flow/mmHg; paired t-test, P < 0.05).
Discussion
The most salient point of this study was that simultaneous CVR (%CSA/mmHg) measurements in the larger basal intracranial arteries, and internal carotid arteries were acquired using hypercapnic and hypocapnic stimuli. While all nine arteries demonstrated reactivity to both hypercapnic and hypocapnic stimuli, heterogeneous reactivity was observed with overall greater CVR in the hypercapnic compared to the hypocapnic condition, and greater, yet similar, reactivity in the anterior and posterior circulations.
The importance of larger intracranial vasoreactivity lies in the role played by these vessels, and corresponding pial distributions, in total brain vascular resistance.5 In this context, the observation that all larger intracranial cerebral vessels dilated with hypercapnia and constricted with hypocapnia suggests that these vessels exert important control over the volume and distribution of cerebral blood flow. This observation contrasts with the previous report by Kellawan et al.7 who reported hypercapnia-induced dilation of the basilar and vertebral vessels alone with little measurable change within the cerebral arteries.7 Evidence of dose-response sensitivity of the MCA across mild to moderate levels of hypocapnia and hypercapnia4 suggests that the differences between the current observations and that of Kellawan et al. potentially include the smaller hypercapnic stimulus in the previous study (e.g. Δ4 mmHg PetCO2).
Previous studies investigating MCA CVR to various stimuli relied on changes in MCA velocity (via TCD) to express CVR changes, which may be confounded by changes in diameter of the conduit artery being interrogated. To illustrate the importance of including diameter changes, we calculated hypercapnic and hypocapnic CVR using MCA velocity and MCA Flow (calculated from equations (3) and (5)). The CVR calculated using MCA velocity was significantly less in the hypocapnic state, and was underestimated (although statistically similar) in the hypercapnic state. These data highlight the importance of incorporating diameter changes in CVR analyses, as previously discussed.2,4
Also, in contrast to structural measures using a modified T1 sequence here, the previous work7 made CSA measured from the outer edge of the luminal flow velocity profile, as provided by phase contrast imaging. Potential limitations of phase contrast imaging for these purposes should be considered due to the subjective nature of establishing the velocity encoding parameter. The current study used a T1w 3D SPACE imaging sequence, which nulls blood signal, providing high contrast between the vessel lumen and surrounding tissue. This allows accurate measurements of the tissue structure with a shorter scanning period and somewhat improved spatial resolution of 0.5 mm isotropic. The disadvantage of this specific T1w approach, of course, is the inability to detect simultaneous flow velocity such that separate measures by TCD were performed to calculate cerebral blood flow and conductance. Further, a limitation of all imaging methods includes movement artefact induced by breathing that may blur the lumen-wall boundary.
Whether or not the different vascular beds in the brain express heterogeneous vasoactive properties has been addressed in recent studies. For example, ultrasound-based approaches led to reports that MCA and PCA vascular beds expressed different CVR responses to hypercapnia elicited either via rebreathing9 or breath-hold10 manoeuvres. The present data assessed changes in CSA of all conduit vessels at the base of the brain with outcomes that challenge the earlier reports. Thus, CVR measurements are provided for the posterior (PCA, basilar), middle (MCA) and frontal/superior-parietal portions of the anterior brain (ACA). Specifically, the basilar and left ACA demonstrated the greatest hypercapnic vascular CVR (a posterior-anterior pattern) in the current sample of young participants, with little change in the right ICA.
In the hypocapnic state, the right PCA had the greatest constrictor response, whereas the basilar expressed the lowest constrictor response (posterior only pattern). In this regard, it appears that the ACA and PCA demonstrate the greatest reactivity to changes in partial pressures of carbon dioxide but with varying magnitudes of response depending on the hypercapnia versus hypocapnic stimulus. This conclusion must be considered carefully, however, because these vessels are also smaller than the basilar, ICA or MCA arteries, leading to potential non-physiological variations in proportional changes from the normocapnic diameter. Nonetheless, these data illustrate the idea that all cerebral arteries contribute importantly to changes in cerebral blood flow and cerebrovascular vascular resistance that occur in the face of changing partial pressures of carbon dioxide. The variations in the pattern of heterogeneity between this study and earlier studies may be related to inter-individual differences (outlined below). Also, emphasis on downstream vasoreactivity with TCD ultrasound in the earlier studies may provide different information than emphasis on the conduit vessel CSA reactivity in the present study. How these conclusions relate to hypoxic or exercise-based interventions are not known, although Willie et al.11 indicate that the posterior (vertebral arteries) circulatory region provides the largest hypoxia reactivity.
While the current imaging approach detected CSA changes in all larger intracranial arteries, which are assumed to have received the same within-individual carbon dioxide dose, marked inter-individual heterogeneities were observed. Such between-subject differences may be related to inter-individual differences in levels of PetCO2 achieved, despite inhaling the same dose.16 If so, such inter-individual differences in vessel reactivity may be minimized with the use of an end-tidal gas clamping approach which was not available for the current study.
The second aim of this study was to re-assess and potentially replicate previous observations regarding MCA dilation and constriction measured with 3T MRI and a T2 sequence applied in a single plane.2 The reported voxel volume in the study by Coverdale et al. was 0.32 mm3, whereas the current study collected MRI images using 0.125 mm3 voxel volume, providing improved resolving potential. In the earlier study, images were acquired using anisotropic voxels, which is not ideal for simultaneous CVR measurements of larger intracranial arteries as additional individual images of the other arteries would have lengthened scanning time. Partial volume effects from the large slice thickness may also blur the vessel wall boundaries. Additionally, single plane image acquisition does not ensure that the vessel CSA measurement is from an ideal transverse cross-section. The image acquisition method used in the current study takes advantage of the isotropic voxels such that data can be reformatted into any arbitrary anatomical plane ensuring CSA measurements are acquired from the transverse axis of the vessel. Notably, the MCA CSA outcomes and calculated responses to hypercapnia are in support of our previous findings that also combined TCD with corresponding MCA CSA changes using 3T MRI.2 The direction of changes in right MCA CSA in that study, during both hypocapnia (−8 ± 6%) and hypercapnia (16 ± 7%), corresponds to measurements in the current study ( − 15 ± 7% and 11 ± 10%, respectively)2. Differences in participants being studied may account for the variations in magnitude of response between the two studies.
Limitations
One limitation of this study was the use of voluntary breathing of a gas to acquire changes in PetCO2, rather than use of clamped PetCO2 systems. In contrast to the methods used herein, computerized systems clamping PetCO2 provide the benefit of reaching target PetCO2 levels within a few breaths, maintaining levels for an extended duration, and minimize inter-subject variability.17 As mentioned, this technology was not available for the current study. Nonetheless, the imaging procedure requires that data are averaged for >30 s which provides a steady-state measurement dictating a need for corresponding average values of PetCO2 that were reflective of large condition-specific differences in vasoactive stimuli sustained over several minutes.
A second limitation was that the MCA blood flow was calculated using data from two modalities obtained in different sessions. Laboratory testing and MRI session were within 1–3 h of one another, thereby potentially decreasing the day-to-day variability in TCD measures,18 which may also translate to limited day-to-day variability in CVR measurement. Nonetheless, similar PetCO2 and HR levels were observed during both the MRI and laboratory sessions, supporting the probability of similar cerebrovascular outcomes during both sessions. The lack of time-aligned velocity and CSA measurements are only a concern during MCA blood flow calculation. The vessel CVR data, however, are based on steady-state CSA changes after a manipulation of PetCO2 that was experienced by all nine vessels simultaneously. As well, based on earlier work by Brothers et al.,19 the order of breathing conditions may have affected the vasoreactivity to hypercapnia. However, in a sub-analysis, no relationship was observed between CVR and the order of breathing conditions.
Another limitation in this study was the presence of a ∼7 mmHg increase in MAP during hypercapnia, which may affect interpretations of CVR.20–22 For example, systemic changes in MAP with hypercapnia could cause a mechanical distension of the major arteries confounding the interpretation that CVR refers specifically to active vasodilation.23 On the other hand, changes in MAP are expected to elicit an autoregulatory (i.e. myogenic) reflex, resulting in vasoconstriction that could counteract an active dilatory response. Further, the impact of changes in MAP as a mechanical distension force within the pressurized cranial remains speculative. To address this possibility, the regression between changes in CSA and MAP for each vessel of interest was calculated. Only the extracranial ICAs and right ACA correlate with the change in MAP, accounting for 58–63% of the CSA variations. No other vessel correlated with MAP changes. Finally, large changes in CSA occurred between normocapnic and hypocapnic states even in the absence of changes in MAP. Therefore, these data suggest that the impact of MAP on CSA changes was localized mostly to the extracranial arteries and had minimal effect on the estimates of conductance in the MCA.
Summary
The T1-weighted structural imaging sequence with novel parameters and the described CSA measurement methodologies were used to assess simultaneous vascular responses in the larger intracranial arteries. Using this sequence at 7T MRI, significant but heterogenous dilation and constriction patterns were observed across the nine arteries in response to hypercapnia and hypocapnia, respectively. As expected, MCA calculated flow and conductance increased and decreased with hypercapnia and hypocapnia, respectively. These data emphasize the general concept that the larger intracranial conduit vessels express significant vasoreactivity to arterial PaCO2, and the need to consider specific vessel reactivity when describing intracranial CVR.
Funding
The author(s) disclosed receipt of the following financial support for the research, authorship, and/or publication of this article: This study was supported by the Canadian Institute of Health Research (grant ID: 201503MOP-342412-MOV-CEEA). Dr. Shoemaker is a Tier 1 Canada Research Chair in the Integrative Physiology of Exercise and Health.
Declaration of conflicting interests
The author(s) declared no potential conflicts of interest with respect to the research, authorship, and/or publication of this article.
Authors’ contributions
BKA contributed to study design, data collection, analysis and dissemination, as well as writing of the manuscript. LNS contributed to study design, data collection, analysis and dissemination, as well as editing of the manuscript. JSG and TS developed the MRI sequence and contributed to MRI data collection, and JSG contributed to writing of the manuscript. JKS contributed to study design, data interpretation, and editing of the manuscript.
References
- 1.Huber P, Handa J. Effect of contrast material, hypercapnia, hyperventilation, hypertonic glucose and papaverine on the diameter of the cerebral arteries. Angiographic determination in man. Invest Radiol 1967; 2: 17–32. [DOI] [PubMed] [Google Scholar]
- 2.Coverdale NS, Gati JS, Opalevych O, et al. Cerebral blood flow velocity underestimates cerebral blood flow during modest hypercapnia and hypocapnia. J Appl Physiol 2014; 117: 1090–1096. [DOI] [PubMed] [Google Scholar]
- 3.Serrador JM, Picot PA, Rutt BK, et al. MRI measures of middle cerebral artery diameter in conscious humans during simulated orthostasis. Stroke 2000; 31: 1672–1678. [DOI] [PubMed] [Google Scholar]
- 4.Verbree J, Bronzwaer AS, Ghariq E, et al. Assessment of middle cerebral artery diameter during hypocapnia and hypercapnia in humans using ultra-high-field MRI. J Appl Physiol 2014; 117: 1084–1089. [DOI] [PubMed] [Google Scholar]
- 5.Faraci FM, Heistad DD. Regulation of large cerebral arteries and cerebral microvascular pressure. Circ Res 1990; 66: 8–17. [DOI] [PubMed] [Google Scholar]
- 6.Warnert EA, Hart EC, Hall JE, et al. The major cerebral arteries proximal to the Circle of Willis contribute to cerebrovascular resistance in humans. J Cereb Blood Flow Metab 2016; 36: 1384–1395. [DOI] [PMC free article] [PubMed] [Google Scholar]
- 7.Kellawan JM, Harrell JW, Schrauben EM, et al. Quantitative cerebrovascular 4D flow MRI at rest and during hypercapnia challenge. Magn Reson Imaging 2016; 34: 422–428. [DOI] [PubMed] [Google Scholar]
- 8.Duffin J. Measuring the respiratory chemoreflexes in humans. Respir Physiol Neurobiol 2011; 177: 71–79. [DOI] [PubMed] [Google Scholar]
- 9.Skow RJ, MacKay CM, Tymko MM, et al. Differential cerebrovascular CO(2) reactivity in anterior and posterior cerebral circulations. Respir Physiol Neurobiol 2013; 189: 76–86. [DOI] [PubMed] [Google Scholar]
- 10.Bruce CD, Steinback CD, Chauhan UV, et al. Quantifying cerebrovascular reactivity in anterior and posterior cerebral circulations during voluntary breath holding. Exp Physiol 2016; 101: 1517–1527. [DOI] [PubMed] [Google Scholar]
- 11.Willie CK, Macleod DB, Shaw AD, et al. Regional brain blood flow in man during acute changes in arterial blood gases. J Physiol 2012; 590: 3261–3275. [DOI] [PMC free article] [PubMed] [Google Scholar]
- 12.Park J, Mugler JP, 3rd, Horger W, et al. Optimized T1-weighted contrast for single-slab 3D turbo spin-echo imaging with long echo trains: application to whole-brain imaging. Magn Reson Med 2007; 58: 982–992. [DOI] [PubMed] [Google Scholar]
- 13.Mihai G, Chung YC, Kariisa M, et al. Initial feasibility of a multi-station high resolution three-dimensional dark blood angiography protocol for the assessment of peripheral arterial disease. J Magn Reson Imaging 2009; 30: 785–793. [DOI] [PubMed] [Google Scholar]
- 14.Mihai G, Chung YC, Merchant A, et al. T1-weighted-SPACE dark blood whole body magnetic resonance angiography (DB-WBMRA): initial experience. J Magn Reson Imaging 2010; 31: 502–509. [DOI] [PubMed] [Google Scholar]
- 15.Glover GH, Pauly JM. Projection reconstruction techniques for reduction of motion effects in MRI. Magn Reson Med 1992; 28: 275–289. [DOI] [PubMed] [Google Scholar]
- 16.Ainslie PN, Duffin J. Integration of cerebrovascular CO2 reactivity and chemoreflex control of breathing: mechanisms of regulation, measurement, and interpretation. Am J Physiol Regul Integr Comp Physiol 2009; 296: R1473–R1495. [DOI] [PubMed] [Google Scholar]
- 17.Fisher JA. The CO2 stimulus for cerebrovascular reactivity: fixing inspired concentrations vs. targeting end-tidal partial pressures. J Cereb Blood Flow Metab 2016; 36: 1004–1011. [DOI] [PMC free article] [PubMed] [Google Scholar]
- 18.Demolis P, Chalon S, Giudicelli JF. Repeatability of transcranial Doppler measurements of arterial blood flow velocities in healthy subjects. Clin Sci 1993; 84: 599–604. [DOI] [PubMed] [Google Scholar]
- 19.Brothers RM, Lucas RA, Zhu YS, et al. Cerebral vasomotor reactivity: steady-state versus transient changes in carbon dioxide tension. Exp Physiol 2014; 99: 1499–1510. [DOI] [PMC free article] [PubMed] [Google Scholar]
- 20.Battisti-Charbonney A, Fisher J, Duffin J. The cerebrovascular response to carbon dioxide in humans. J Physiol 2011; 589: 3039–3048. [DOI] [PMC free article] [PubMed] [Google Scholar]
- 21.Hetzel A, Braune S, Guschlbauer B, et al. CO2 reactivity testing without blood pressure monitoring? Stroke 1999; 30: 398–401. [DOI] [PubMed] [Google Scholar]
- 22.Claassen JA, Zhang R, Fu Q, et al. Transcranial Doppler estimation of cerebral blood flow and cerebrovascular conductance during modified rebreathing. J Appl Physiol 2007; 102: 870–877. [DOI] [PubMed] [Google Scholar]
- 23.Regan RE, Fisher JA, Duffin J. Factors affecting the determination of cerebrovascular reactivity. Brain Behav 2014; 4: 775–788. [DOI] [PMC free article] [PubMed] [Google Scholar]