Abstract
Glycosylation of immune receptors and ligands, such as T cell receptor and coinhibitory molecules, regulates immune signaling activation and immune surveillance. However, how oncogenic signaling initiates glycosylation of coinhibitory molecules to induce immunosuppression remains unclear. Here we show that IL-6–activated JAK1 phosphorylates programmed death-ligand 1 (PD-L1) Tyr112, which recruits the endoplasmic reticulum–associated N-glycosyltransferase STT3A to catalyze PD-L1 glycosylation and maintain PD-L1 stability. Targeting of IL-6 by IL-6 antibody induced synergistic T cell killing effects when combined with anti–T cell immunoglobulin mucin-3 (anti–Tim-3) therapy in animal models. A positive correlation between IL-6 and PD-L1 expression was also observed in hepatocellular carcinoma patient tumor tissues. These results identify a mechanism regulating PD-L1 glycosylation initiation and suggest the combination of anti–IL-6 and anti–Tim-3 as an effective marker-guided therapeutic strategy.
Keywords: Cell Biology, Oncology
Keywords: Cancer immunotherapy, Liver cancer
Introduction
Programmed death-ligand 1 (PD-L1; also known as B7 homolog 1 and CD274) is an immune checkpoint protein, and its engagement with programmed cell death protein-1 (PD-1) receptor on T cells activates coinhibitory signaling to suppress the function of cytotoxic T lymphocytes (CTLs), allowing cancer cells to evade immune surveillance (1, 2). PD-L1 or PD-1 blockade has demonstrated encouraging clinical outcomes in cancer treatment, which led to the approval of several therapeutic antibodies by the US Food and Drug Administration (FDA) (2–4).
Recently studies on glycoprotein biosynthesis in cancer cells suggested the potential of targeting this process as an effective marker-guided combination therapy to improve current immunotherapy response rate in cancer patients (5–8). PD-L1 is highly glycosylated (7, 8), and N-linked glycosylation (N-glycosylation) of PD-L1 critically maintains its protein stability and is required for its interaction with PD-1 (6–8). Specifically, N-glycosylation of PD-L1 prevents its serine (Ser)/threonine (Thr) phosphorylation by glycogen synthase kinase 3β (GSK3β) for subsequent recruitment of β-TrCP–induced protein degradation, which stabilizes PD-L1 and suppresses the activity of CTLs (7). In addition, the p65/CSN5 and CDK4/6 signaling have also been reported to maintain PD-L1 stabilization by modulating its ubiquitination (9, 10). We recently further demonstrated that the endoplasmic reticulum–associated (ER-associated) N-glycosyltransferase isoforms STT3A and STT3B, which are the catalytic subunits of the oligosaccharyltransferase complex, are critical for N-glycosylation and stabilization of PD-L1 (8). However, it remains unclear how the oncogenic pathways directly orchestrate PD-L1 glycosylation initiation and enhance its functions in cancer cells.
Hepatocellular carcinoma (HCC) has long been a difficult disease to treat. Although the FDA has approved multikinase inhibitors, sorafenib (first-line use) and regorafenib (second-line use), for the treatment of HCC, they have been shown to extend overall survival by fewer than 3 months with low overall response rates (2% and 10% for partial response, respectively; refs. 11, 12). Recently, the PD-1 antibody nivolumab, which was approved for advanced HCC refractory to sorafenib, demonstrated a 20% objective response rate in advanced HCC (13). While this is an encouraging step in HCC therapy, it also provides great opportunity to improve therapeutic efficacy. Because mechanism-driven marker-guided combinational therapy is generally considered an effective strategy to improve therapeutic efficacy (14, 15), uncovering the mechanisms underlying PD-L1 glycosylation initiation may lead to the development of mechanism-driven immunotherapies that improve HCC patient survival and response rates.
HCC often occurs in the context of chronic inflammation related to viral infections, heavy alcohol consumption, obesity, or nonalcoholic fatty liver disease (11, 16). High levels of the inflammatory cytokine interleukin-6 (IL-6) in tumor region or plasma are correlated with poor prognosis in advanced HCC (17, 18). Mechanistically, IL-6 has been shown to promote cell proliferation and enhance tumor metastasis and is required for tumor-initiating cell maintenance via the autocrine IL-6/LIN28 pathway (16, 17, 19). Although it also has been reported that IL-6 signaling suppresses the antitumor immune response in the tumor microenvironment, the mechanism is not fully understood (20). Therefore, understanding whether and how IL-6 regulates the expression and glycosylation of PD-L1 may improve current therapeutic strategy of HCC.
Results
The IL-6/JAK1 pathway positively regulates PD-L1 protein stability.
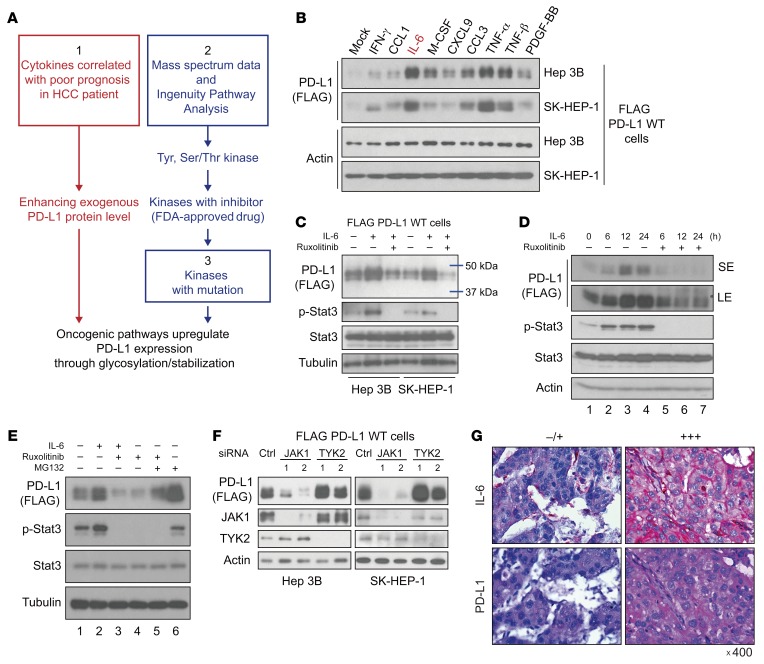
To identify the signaling pathways that potentially affect the glycosylation and stabilization of PD-L1 in HCC, we selected pathways based on the following 3 criteria: (a) cytokine levels are increased in HCC patients with poor prognosis and are able to upregulate PD-L1 protein expression because PD-L1 glycosylation affects PD-L1 protein stability; (b) downstream tyrosine (Tyr) and Ser/Thr kinases interact directly with PD-L1, particularly those for which therapeutic inhibitors are approved and whose activities are blocked by these inhibitors; and (c) activated mutations are reported in HCC (Figure 1A). We intended to screen for HCC-related cytokines that may upregulate PD-L1 protein expression. To that end, we developed Hep 3B and SK-HEP-1 cancer stable cells that express exogenous PD-L1 independently of the transcriptional regulation of endogenous PD-L1 by first knocking down endogenous PD-L1 and then re-expressing FLAG-tagged PD-L1 using a cDNA construct driven by an exogenous CMV promoter (Supplemental Figure 1A; supplemental material available online with this article; https://doi.org/10.1172/JCI126022DS1). PD-L1 expression in those cell lines, FLAG–PD-L1 WT–Hep 3B and FLAG–PD-L1 WT–SK-HEP-1 cells, was no longer regulated by the endogenous PD-L1 promoter and/or splicing events. If PD-L1 protein expression is upregulated by any cytokines in those cells, it likely occurs via posttranslational modifications.
Figure 1. The IL-6/JAK1 pathway positively regulates PD-L1 protein stability, and IL-6 and PD-L1 expression is positively correlated in tumor tissues from HCC patients.
(A) Schematic of the strategy using the indicated criteria (1, 2, and 3) to identify pathways that potentially upregulate PD-L1 expression via posttranslational modifications. (B) Western blot (WB) analysis of exogenous PD-L1 expression in FLAG–PD-L1 WT–Hep 3B and WT–SK-HEP-1 cells stimulated with different cytokines for 18 hours. (C) WB analysis of exogenous PD-L1 expression in FLAG–PD-L1 WT–Hep 3B and WT–SK-HEP-1 cells under IL-6 stimulation (20 ng/mL) or cotreatment with the JAK1/2 inhibitor ruxolitinib (10 μmol/L) for 18 hours. (D) WB analysis of exogenous PD-L1 expression in FLAG–PD-L1 WT–Hep 3B cells with IL-6 stimulation (20 ng/mL) or cotreatment with ruxolitinib (10 μmol/L) for the indicated times. SE, short exposure; LE, long exposure. (E) WB analysis of exogenous PD-L1 expression in the presence or absence of IL-6 stimulation (20 ng/mL, 18 hours), ruxolitinib (10 μmol/L, 18 hours), or the proteasome inhibitor MG132 (10 μmol/L, 6 hours). (F) WB analysis of exogenous PD-L1 expression in FLAG–PD-L1 WT–SK-HEP-1 and WT–Hep 3B cells with knockdown of the indicated genes by siRNA. (G) Representative images of IL-6 and PD-L1 expression levels in tumor regions in HCC patients. Original magnification, ×400.
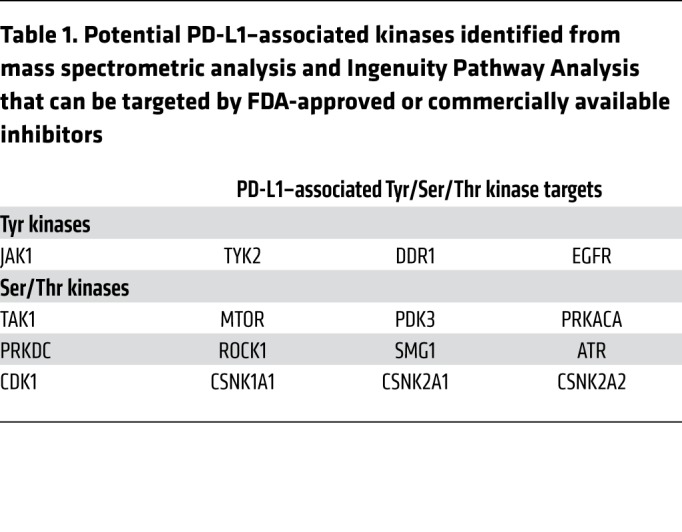
Multiple cytokines, including IFN-γ, C-C motif chemokine ligand 1 (CCL1), IL-6, macrophage colony-stimulating factor (M-CSF), chemokine (C-X-C motif) ligand 9 (CXCL9), CCL3, TNF-α, TNF-β, and platelet-derived growth factor-BB (PDGF-BB), are elevated in HCC patients with severe hepatitis and correlated with poor prognosis (21). Among them, IL-6 and TNF-α/β markedly enhanced the levels of exogenous PD-L1 protein expression in FLAG–PD-L1 WT–Hep 3B and WT–SK-HEP-1 cells (Figure 1B). The TNF/p65/CSN5 pathway has been shown to enhance PD-L1 expression by upregulating deubiquitination (9). In addition to the TNF family, our present findings suggested that IL-6 also upregulates PD-L1 protein expression with an unknown mechanism. Next, we examined PD-L1–binding partners of Tyr/Ser/Thr kinases by mass spectrometry and Ingenuity Pathway Analysis (Supplemental Figure 1B) and identified 2 kinases, Janus kinase 1 (JAK1) and tyrosine kinase 2 (TYK2), which are directly downstream of IL-6 signaling (Table 1).
Table 1. Potential PD-L1–associated kinases identified from mass spectrometric analysis and Ingenuity Pathway Analysis that can be targeted by FDA-approved or commercially available inhibitors.
A high percentage of genetic alternations in the JAK/signal transducer and activator of transcription (STAT) pathway (45.5%) has been reported in HCC (22, 23). Moreover, high levels of IL-6 in tumor regions are correlated with poor prognosis in advanced HCC (17). HCC patients with high plasma IL-6 levels exhibited significantly poorer overall survival (median, 8.0 vs. 13.9 months) compared with those with low IL-6 levels (18). This prompted us to further investigate whether PD-L1 expression is upregulated by the IL-6/JAK1 pathway, as HCC harbors a relatively high percentage (~7%) of gain-of-function JAK1 mutations (22). In addition, multiple IL-6/JAK1 pathway–blocking antibodies and inhibitors, e.g., the IL-6 antibody siltuximab, the IL-6 receptor antibody tocilizumab, and the JAK1/2 kinase inhibitor ruxolitinib, have been approved by the FDA (20, 24), which makes it easier to translate into the clinical setting. Indeed, PD-L1 protein expression was increased after IL-6 stimulation and decreased after treatment with ruxolitinib in FLAG–PD-L1 WT–Hep 3B and WT–SK-HEP-1 cells (Figure 1C). We observed similar results in parental human Hep 3B and SK-HEP-1 and mouse melanoma cells, suggesting that the endogenous PD-L1 is also under the same regulation (Supplemental Figure 2). In a time course experiment, IL-6–induced PD-L1 protein expression peaked at 12 hours after ligand stimulation (Figure 1D), which was similar to the previously reported protein half-life of PD-L1 (7). Treatment with ruxolitinib, a JAK1/2 kinase inhibitor, blocked IL-6–induced PD-L1 protein expression (Figure 1D, lanes 5–7 vs. 2–4), whereas the addition of the proteasome inhibitor MG132 restored PD-L1 expression (Figure 1E, lane 4 vs. 5). Moreover, knocking down JAK1 but not TYK2 reduced PD-L1 protein expression (Figure 1F). Taken together, these data suggested that the IL-6/JAK1 pathway upregulates PD-L1 expression and maintains PD-L1 protein stability in HCC cells likely through the proteasome pathway.
IL-6 and PD-L1 expression is positively correlated in tumor tissues from HCC patients, and high IL-6 plasma level is associated with poor prognosis.
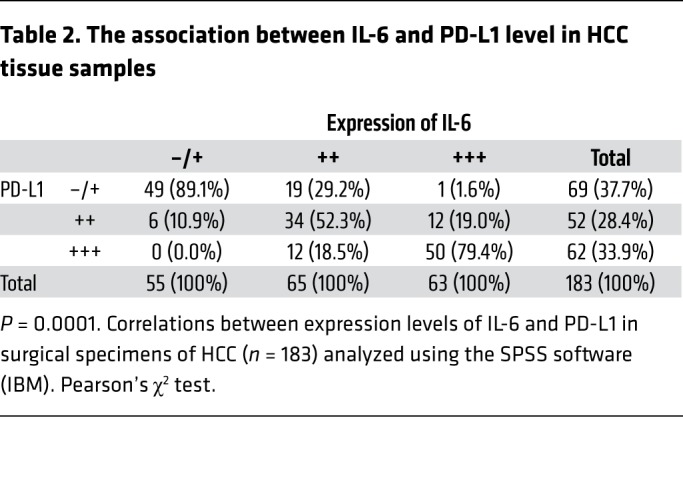
To further validate the IL-6 and PD-L1 relationship in human HCC tumors, we analyzed the correlation between IL-6 and PD-L1 expression in 183 HCC patient tumor tissues. As expected, patients with high IL-6 expression also had elevated PD-L1 expression in tumors (Figure 1G). Specifically, about 79% of tumor samples with high IL-6 expression exhibited strong PD-L1 staining, and 89% of those with low IL-6 expression exhibited weak or no PD-L1 staining (Table 2). These results suggested that IL-6 is physiologically significant and clinically relevant to PD-L1 expression in HCC.
Table 2. The association between IL-6 and PD-L1 level in HCC tissue samples.
Previously, Shao et al. reported that high IL-6 level is associated with poorer prognosis of HCC patients (18). To further determine the clinical relevance of IL-6 level to the prognosis of HCC patients, we analyzed the plasma level of IL-6, clinicopathological features, and survival in 103 HCC patients from a different cohort (Supplemental Table 1). On the basis of this clinical cohort, we used the median value of IL-6 plasma level from control group (6 pg/mL) as a cutoff value to determine those with normal or low value versus those with high value in HCC patient cases. These results were the similar to those of previous studies (18, 25) in which advanced HCC staging and shorter median survival months (6.4 vs. 19.7 months) were observed in the cohort of HCC patients with high IL-6 plasma level. Together with results from prior studies, the current findings indicated that high IL-6 level in plasma/serum is correlated with poor prognosis of HCC patients, and that IL-6 expression is positively correlated with PD-L1 expression at tumor region in HCC patients.
Blocking IL-6/JAK1–mediated PD-L1 protein stability enhances the efficacy of anti–Tim-3 immunotherapy.
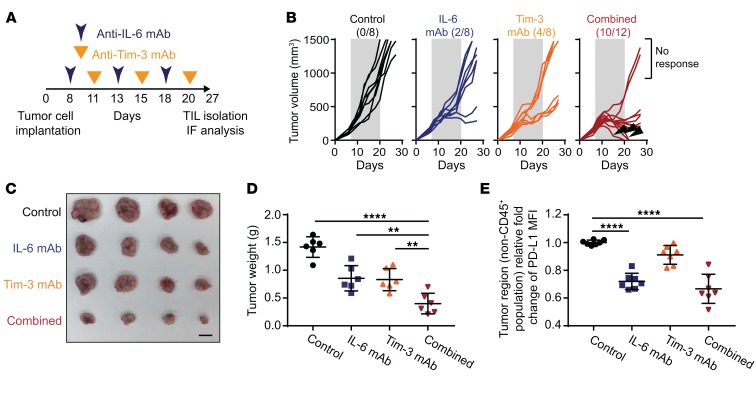
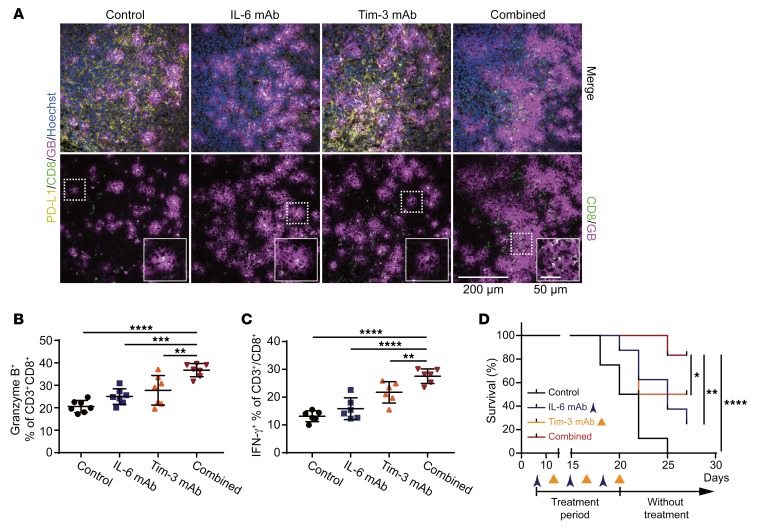
Because blocking IL-6/JAK1 pathway abolished PD-L1 stability in vitro and IL-6 expression is positively correlated with PD-L1 expression in human HCC tumor tissues and poorer prognosis of HCC patients, we next asked whether neutralization of IL-6, which blocks IL-6/JAK1 pathway, downregulates PD-L1 expression and functionally mimics anti–PD-1/PD-L1 effects to reduce HCC tumorigenesis in vivo. In addition, previous studies have also shown that combined blockade of immune checkpoints was more effective in reversing T cell exhaustion and restoring antitumor immunity than single-agent treatment (2–4, 8). Coexpression of T cell immunoglobulin mucin-3 (Tim-3) and PD-1 on tumor-infiltrating lymphocytes is reported to be an indicator of T cell exhaustion, including that of CD8+ T cells, in the tumor microenvironment of HCC as well as other cancer types (26, 27). We further asked whether combining IL-6 antibody with other immune checkpoint therapies can enhance the therapeutic efficacy. We examined the effects of anti–IL-6 and anti–Tim-3 combination therapy in a Hepa 1-6 liver cancer immunocompetent mouse model (Figure 2A), which has been used in multiple cancer immunotherapy studies (28). Notably, combining IL-6 and Tim-3 antibodies reduced tumor growth and increased response rates much more significantly than did each treatment alone in immunocompetent mice bearing Hepa 1-6 tumors (Figure 2, B–D) without causing significant changes in kidney or liver function or body weights (Supplemental Figure 3). As expected, treatment with the IL-6 antibody decreased PD-L1 expression levels in the tumor regions (Figure 2E and Figure 3A). Notably, the regression of tumor growth was detected in the combination treatment group, and tumors were eradicated in 30% of mice (3/10) in that group in 3 treatment cycles (indicated by arrowheads in Figure 2B, combined group). Notably, no tumor recurrence was observed in these mice with complete response over 8 months (data not shown). The combination of anti–IL-6 and anti–Tim-3 not only downregulated PD-L1 but also markedly increased the population of granzyme B– and IFN-γ–positive CD8+ T cells in the tumor region (Figure 3, A–C). Importantly, we observed significantly improved overall survival rate compared with either antibody alone with only 3 treatment cycles (Figure 3D). Similar results were observed in a more aggressive B16F10 melanoma model (Supplemental Figure 4). These results indicated that blocking the IL-6 pathway downregulates PD-L1 expression and enhances efficacy of anti–Tim-3 immunotherapy.
Figure 2. Blocking IL-6/JAK1–mediated PD-L1 protein stability enhances the efficacy of anti–Tim-3 immunotherapy.
(A) Schematic of the treatment schedule for the IL-6 and Tim-3 monoclonal antibody (mAb) combination therapy. (B) Growth of Hepa 1-6 tumors in mice treated with IL-6 mAb, Tim-3 mAb, or the combination. The number of mice that experienced tumor progression in each group is shown in parentheses. The gray box in each panel indicates the duration of treatment. (C) Representative images showing tumors harvested from mice bearing Hepa 1-6 tumors given IL-6 mAb, Tim-3 mAb, or the combination. Scale bar: 1 cm. (D) Weight of Hepa 1-6 tumors in mice given an IL-6 mAb, Tim-3 mAb, or both (n = 6). (E) Flow cytometric analysis of cell surface PD-L1 expression in Hepa 1-6 tumor region (non-CD45+ population) treated with the indicated regimens (n = 7). Relative fold change in the mean fluorescence intensity (MFI) of PD-L1 is shown. Error bars represent ± SD. **P < 0.01, ****P < 0.0001, 1-way ANOVA (D and E).
Figure 3. Anti–IL-6 and anti–Tim-3 combination therapy enhances the activity of cytotoxic CD8+ T cells in the tumor microenvironment and prolongs the survival rate of tumor-bearing mice.
(A) Representative images of immunofluorescence staining for PD-L1, CD8, and granzyme B (GB) expressions in tumor regions in mice given the indicated treatment. Scale bar: 200 μm. Magnified images showing colocalization of CD8 and granzyme B signals. Scale bar: 50 μm. (B) The percentage of granzyme B–positive CD3+CD8+ T cells in Hepa 1-6 tumors with the indicated treatments according to flow cytometry analysis (n = 7). (C) Percentage of IFN-γ–positive CD3+CD8+ T cells in tumor samples obtained from Hepa 1-6 tumor–bearing mice given the indicated treatments (n = 6). (D) Survival curves for the data shown in Figure 2B. Error bars represent ± SD. *P < 0.05, **P < 0.01, ***P < 0.001, ****P < 0.0001, 1-way ANOVA (B and C) and log-rank (Mantel-Cox) test (D).
IL-6/JAK1 pathway upregulates PD-L1 expression by enhancing its association with N-glycosyltransferase STT3A.
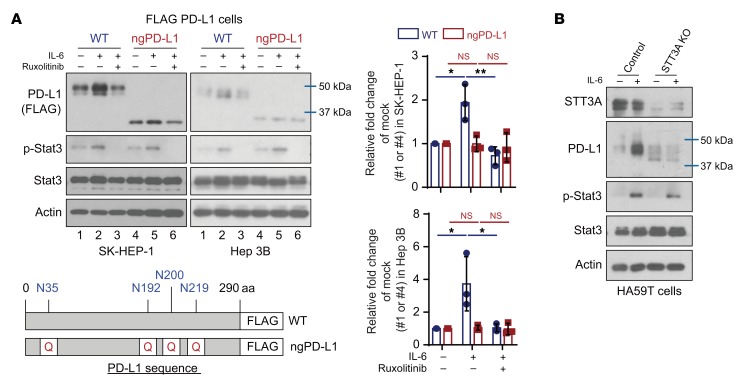
Encouraged by the downregulation of PD-L1 expression via neutralization of IL-6 and the impressive therapeutic efficacy from the combination of anti–IL-6 and anti–Tim-3 therapy in vivo, we sought to investigate the detailed molecular mechanisms. To this end, we first asked whether glycosylation is involved in IL-6/JAK1–mediated PD-L1 stabilization, since N-glycosylation maintains protein stability of PD-L1 (6, 7). We used a mutant PD-L1 in which 4 glycosylation sites (N35, N192, N200, and N219) on its extracellular domain are mutated to mimic the nonglycosylated form (ngPD-L1) (refs. 6, 7, and Figure 4A). Under IL-6 stimulation, PD-L1 WT protein expression was increased, but the increase was attenuated by the addition of ruxolitinib in FLAG–PD-L1 WT–Hep 3B and WT–SK-HEP-1 cells (Figure 4A, lanes 1–3). As expected, ngPD-L1 expression was not affected by IL-6 or ruxolitinib (Figure 4A, lanes 4–6). Similar results were observed in FLAG–PD-L1 WT–PD-L1 and ngPD-L1 melanoma cells with the same treatment (Supplemental Figure 5A). These results suggested that glycosylation is required for the IL-6/JAK1 pathway–enhanced PD-L1 protein stability in cancer cells.
Figure 4. IL-6/JAK1 pathway upregulates PD-L1 expression via N-glycosyltransferase STT3A.
(A) WB analysis of exogenous PD-L1 expression in FLAG–PD-L1 WT or nonglycosylated PD-L1 (ngPD-L1) Hep 3B or SK-HEP-1 cells with or without exposure to IL-6 (20 ng/mL) and/or ruxolitinib (10 μmol/L) for 18 hours. Schematic diagram of ngPD-L1 mutants used in this study. The numbers indicate amino acid positions on PD-L1. Data show the relative fold change of PD-L1 protein normalized to the mock group (1 or 4) for each cell line (n = 3). Error bars represent mean ± SD. *P < 0.05, **P < 0.01, 1-way ANOVA. (B) WB analysis of PD-L1 expression in HA59T control or STT3A-knockout (KO) cells with or without IL-6 stimulation (20 ng/mL, 18 hours).
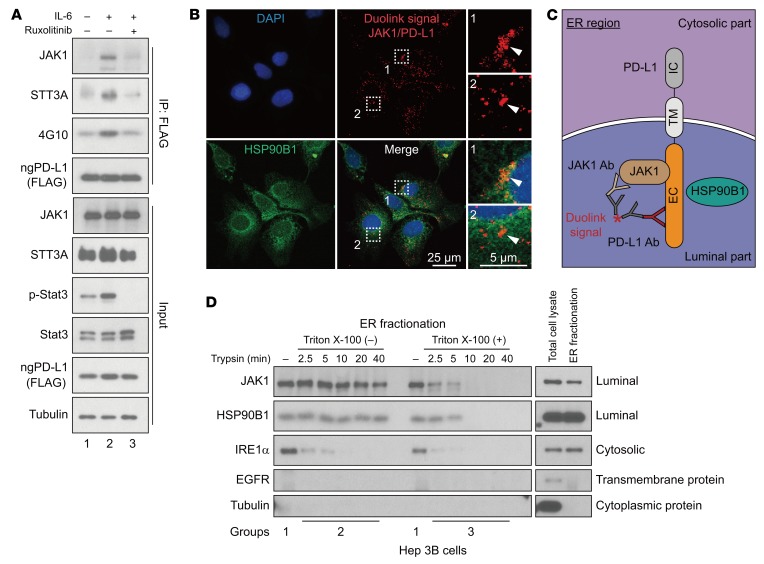
To further explore the mechanism underlying IL-6/JAK1 pathway–mediated upregulation of PD-L1 expression via glycosylation, we searched for N-glycosyltransferases that may interact with PD-L1. Among the 15 N-glycosyltransferases identified as PD-L1–associated proteins (6), 7 are components of the oligosaccharyltransferase complex and are located in the ER (Supplemental Table 2). STT3 isoforms, the catalytic subunits of the oligosaccharyltransferase complex, are essential for PD-L1 glycosylation and protein stabilization (8). Therefore, we compared the ability of PD-L1 to form complexes with each of the STT3 isoforms. We found that STT3A associated with ngPD-L1 much more strongly than did WT PD-L1 by coimmunoprecipitation (co-IP; Supplemental Figure 5B). Knocking STT3A out or down also blocked IL-6/JAK1–induced PD-L1 expression in HCC and melanoma cells (Figure 4B and Supplemental Figure 5, C and D). Notably, IL-6 enhanced the complex-forming ability of JAK1 and STT3A with ngPD-L1 and increased ngPD-L1 Tyr phosphorylation (4G10), which were attenuated by ruxolitinib treatment (Figure 5A, lane 2 vs. 1 and 3; Supplemental Figure 6A, lane 2 vs. 1 and 3). Activated JAK1 directly phosphorylated ngPD-L1 (see below in Supplemental Figure 8A). These results suggested that IL-6 modulates PD-L1 glycosylation initiation by enhancing JAK1/ngPD-L1 association, JAK1-driven Tyr phosphorylation, and STT3A recruitment.
Figure 5. IL-6 pathway enhances JAK1/ngPD-L1 and STT3A/ngPD-L1 complex formation.
(A) IP followed by WB analysis of JAK1, STT3A, and ngPD-L1 tyrosine phosphorylation (4G10) in FLAG–ngPD-L1–SK-HEP-1 cells with or without exposure to IL-6 (20 ng/mL) and ruxolitinib (10 μmol/L) for 30 minutes. (B) JAK1 interacts with ngPD-L1 in ER lumen. Representative images of individual immunofluorescence staining of JAK1 and PD-L1 interaction in ER region in Hep 3B cells by Duolink assay. The red dots (JAK1/PD-L1 interaction) indicate their interaction. Green fluorescence (HSP90B1) was used as ER marker, and DAPI as a nuclear marker. (C) Schematic showing JAK1/PD-L1 interaction in the ER. IC, intracellular domain; TM, transmembrane domain; EC, extracellular domain. (D) Trypsin digestion of ER fractions with (group 3) or without (group 2) permeabilization in Hep 3B cells.
Because glycosylation initiation mainly occurs in the ER and JAK1 interacts with ngPD-L1, we further examined the localization of their interaction. Using commercially available JAK1 (Supplemental Figure 6B) and PD-L1 (ab205921; specifically recognizes the extracellular domain of PD-L1) antibodies, we detected colocalization of the PD-L1/JAK1 interaction (red dots) in the ER using an ER marker, HSP90B1 (green dots), by Duolink assay (Figure 5B and Supplemental Figure 6C). During protein glycosylation in the ER, the glycosylated region of PD-L1 (extracellular domain of PD-L1) is exposed to the ER lumen (Figure 5C and ref. 29). To further confirm whether JAK1 resides in the ER lumen, we explored an approach recently developed to validate the localization of a kinase in the ER (30). In brief, we used trypsin to digest the ER fractions with or without pre-permeabilization and then measured the protein levels of JAK1, the ER transmembrane protein IRE1α (cytosolic part), and the ER lumen protein HSP90B1, using the indicated antibodies (Supplemental Figure 7A; ref. 30). In the nonpermeable fraction (group 2), signals for the cytosolic domain of IRE1α were rapidly reduced after trypsinization, but the protein levels of JAK1 and HSP90B1 were maintained in 2 different cancer cell lines [Figure 5D, Triton X-100 (–), and Supplemental Figure 7B]. However, in the permeable fraction (group 3), no signals of cytosolic and luminal proteins were detected after trypsinization [Figure 5D, Triton X-100 (+), and Supplemental Figure 7B]. These results strongly suggested localization of JAK1 inside the ER lumen. Together, these findings suggested that the JAK1/PD-L1 interaction occurs inside the ER lumen and supported the notion that JAK1 is involved in PD-L1 glycosylation in the ER.
JAK1 phosphorylates PD-L1 at Y112 to enhance STT3A association with PD-L1 and induces glycosylation of PD-L1 to maintain its protein stability.
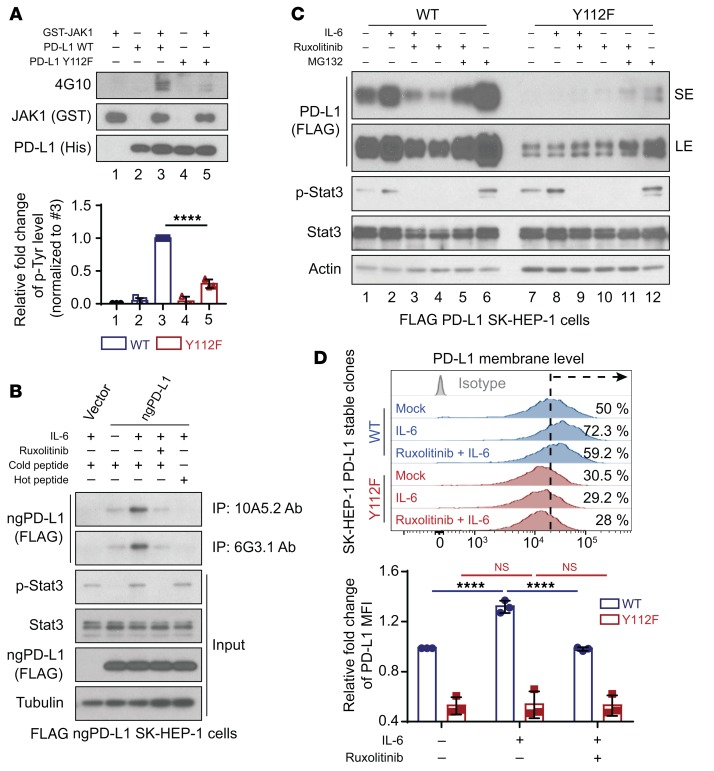
After validating that JAK1 interacts with ngPD-L1, we further tested our hypothesis that JAK1 directly phosphorylates ngPD-L1. We performed an in vitro kinase assay and detected Tyr phosphorylation sites on immunoprecipitated exogenous PD-L1 from cells via mass spectrometric analysis. Results from in vitro kinase assay suggested that recombinant ngPD-L1 was strongly phosphorylated by JAK1 (Supplemental Figure 8A). Mass spectrometric analysis also identified only one Tyr phosphorylation site (Y112) on PD-L1, which is a highly conserved residue across different species (Supplemental Figure 8B). Mutation of PD-L1 Y112 to phenylalanine (F) abrogated phosphorylation as shown by an in vitro kinase assay (Figure 6A, lane 3 vs. 5). To recapitulate IL-6/JAK1–mediated phosphorylation of PD-L1 Y112 (p-Y112) in vivo, we generated 2 monoclonal antibodies against PD-L1 p-Y112, 10A5.2 and 6G3.1 (Supplemental Figure 8C). Higher levels of phosphorylated ngPD-L1 were pulled down from cells using both PD-L1 p-Y112 antibodies under IL-6 stimulation. In contrast, treatment with ruxolitinib or phosphorylated Y112 PD-L1 blocking peptide (hot peptide) abrogated the increase in IL-6–mediated phosphorylation of ngPD-L1 Y112 (Figure 6B and Supplemental Figure 9A). Interestingly, in ER fractionation after IL-6 stimulation, the 6G3.1 antibody pulled down higher levels of phosphorylated ngPD-L1, and this was accompanied by increased JAK1 protein levels (Supplemental Figure 9, B and C). These results indicated that IL-6 may induce JAK1 translocation to the ER region and that IL-6–activated JAK1 phosphorylates ngPD-L1 at Y112.
Figure 6. JAK1 phosphorylates PD-L1 at Y112 and upregulates PD-L1 expression.
(A) In vitro kinase assay and WB analysis of tyrosine phosphorylation (4G10) of recombinant PD-L1 WT and PD-L1 Y112F protein. Data show relative fold change of tyrosine phosphorylation on PD-L1 protein normalized to PD-L1 WT protein with JAK1 kinase (#3). (B) Cell lysates were subjected to IP followed by WB analysis to determine PD-L1 protein levels in SK-HEP-1 ngPD-L1 cells treated with or without IL-6 (20 ng/mL, 30 minutes) and ruxolitinib (10 μmol/L, 30 minutes) using the indicated antibodies, which were preincubated with cold or hot PD-L1 peptides (p-Y112). (C) WB analysis of exogenous PD-L1 expression in FLAG–PD-L1 WT–SK-HEP-1 or Y112F–SK-HEP-1 cells with or without exposure to IL-6 (20 ng/mL, 18 hours), ruxolitinib (10 μmol/L, 18 hours), and/or MG132 (10 μmol/L, 6 hours). SE, short exposure; LE, long exposure. (D) Flow cytometric analysis of cell surface PD-L1 level in FLAG–PD-L1 WT–SK-HEP-1 or Y112F–SK-HEP-1 cells with or without exposure to IL-6 and/or ruxolitinib (n = 3). Data show relative fold change in the MFI of PD-L1. Error bars represent mean ± SD. ****P < 0.0001, 1-way ANOVA (A and D).
To determine whether PD-L1 p-Y112 is required for IL-6/JAK1–induced PD-L1 stability through glycosylation, we generated FLAG–PD-L1 Y112F–expressing HCC cells by the above-described dual expression method (Supplemental Figure 1A). Notably, exogenous PD-L1 protein expression was significantly reduced in the Y112F cells (Figure 6C and Supplemental Figure 10, A and B). Moreover, the Y112F mutation did not affect the protein expression in ngPD-L1 (Supplemental Figure 10A). These results further supported that Y112 is required to maintain protein stability in glycosylation steps. Consistent with our results described above, PD-L1 mRNA level was not affected by the Y112F mutation (Supplemental Figure 10C). As expected, IL-6 stimulation and/or treatment with ruxolitinib had no effect on the levels of total PD-L1 Y112F protein (Figure 6C and Supplemental Figure 10B, lanes 7–10) or membrane-bound PD-L1 Y112F (Figure 6D) compared with their effects on PD-L1 WT expression (Figure 6, C and D, and Supplemental Figure 10B, lanes 1–6). However, treatment with MG132 increased PD-L1 Y112F protein expression (Figure 6C and Supplemental Figure 10B, lane 12 vs. 7). Taken together, these results suggested that the IL-6/JAK1 pathway requires Y112 phosphorylation to maintain PD-L1 stability via glycosylation.
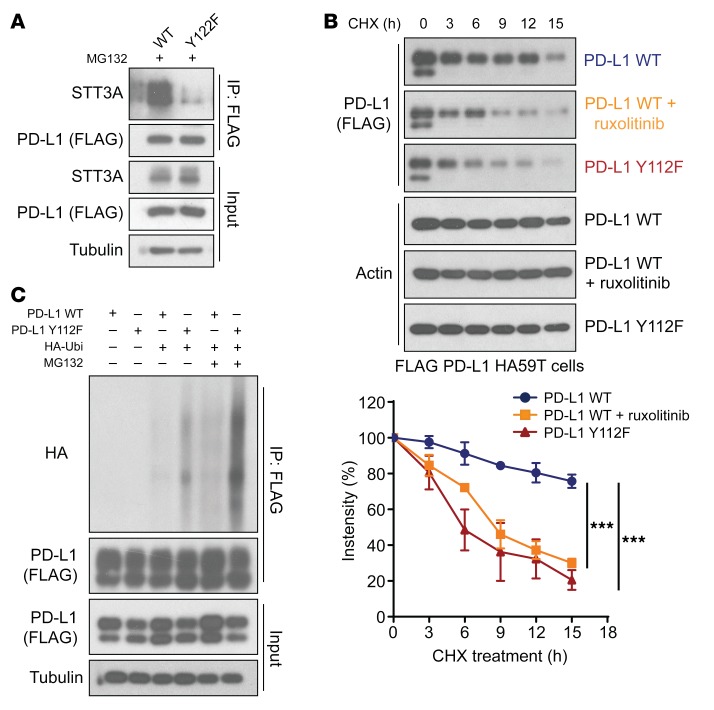
The results above indicated that STT3A enhances PD-L1 protein expression via the IL-6/JAK1 pathway and associates with phosphorylated ngPD-L1 (Figure 4B and Figure 5A). Compared with PD-L1 WT, binding of STT3A to the PD-L1 Y112F mutant was substantially reduced, supporting the notion that IL-6/JAK1–phosphorylated PD-L1 at Y112 recruits STT3A for glycosylation (Figure 7A). Given that glycosylation is required to maintain PD-L1 stability by preventing its ubiquitination (7), we also examined the turnover rates of PD-L1 treated with or without ruxolitinib and PD-L1 Y112F mutant in both HA59T and Hep 3B HCC cells. The results indicated that Y112F mutation or ruxolitinib treatment induced faster turnover of PD-L1 compared with control (Figure 7B and Supplemental Figure 10D). Consistently, we detected more ubiquitination of PD-L1 Y112F than PD-L1 WT in the presence of MG132 (Figure 7C). These results suggested that PD-L1 Y112 phosphorylation plays an important role in PD-L1’s interaction with STT3A and in its glycosylation initiation process and subsequent protein stabilization.
Figure 7. Phosphorylation of PD-L1 Y112 enhances STT3A association with PD-L1 and maintains PD-L1 stability.
(A) FLAG–PD-L1 WT or Y112F–transfected 293T cells with exposure to MG132 (10 μmol/L, 6 hours) were subjected to IP followed by WB analysis to determine the STT3A levels with the indicated antibodies. (B) Top, cycloheximide (CHX; 50 μmol/L) chase assays of PD-L1 protein turnover rates in FLAG–PD-L1 WT–HA59T cells treated with or without ruxolitinib (10 μmol/L) and FLAG–PD-L1 Y112F–HA59T cells without ruxolitinib by WB analysis (n = 3). Error bars represent mean ± SD. ***P < 0.001, repeated-measures ANOVA with Tukey’s post hoc honestly significant difference test. (C) WB analysis of PD-L1 WT and Y112F protein ubiquitination level in 293T cells treated with or without MG132 (10 μmol/L, 6 hours) with the indicated antibodies. HA-Ubi, antibody against HA ubiquitination.
PD-L1 Y112 phosphorylation is required for liver cancer tumorigenesis in immunocompetent mice.
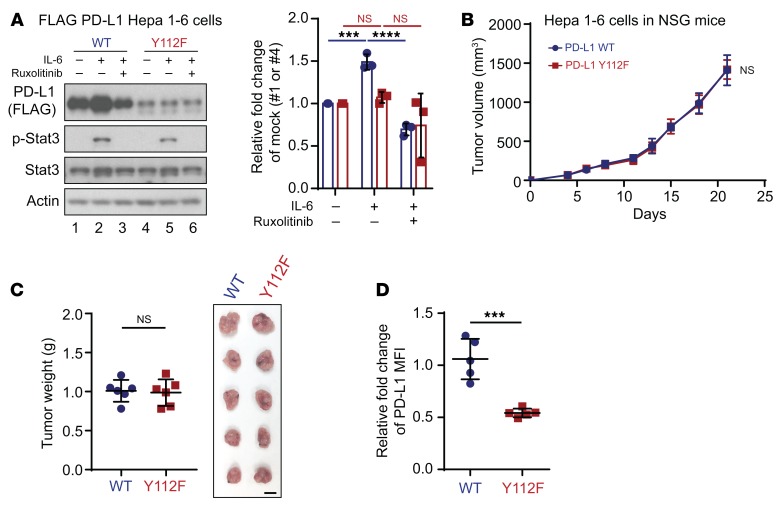
Next, we asked whether PD-L1 Y112 phosphorylation governs PD-L1–driven cancer immune evasion in vivo and whether blocking the IL-6/JAK1/PD-L1 Y112 phosphorylation/STT3A signaling axis reduces PD-L1 expression level and enhances immune surveillance. To this end, we first generated Hepa 1-6 mouse hepatoma cells stably expressing PD-L1 WT or Y112F using the dual expression method. IL-6 stimulation increased and treatment with ruxolitinib decreased the total PD-L1 protein only in WT (Figure 8A, lanes 1–3) but not mutant Y112F (Figure 8A, lanes 4–6), supporting the notion that phosphorylation of Y112 in WT PD-L1 contributes to stabilization of PD-L1 in Hepa 1-6 cells.
Figure 8. PD-L1 Y112F mutation reduces PD-L1 expression in Hepa 1-6 without affecting tumorigenesis in immunodeficient mice.
(A) WB analysis of exogenous PD-L1 expression in FLAG–PD-L1 WT or Y112F–Hepa 1-6 cells with or without exposure to IL-6 (20 ng/mL) and/or ruxolitinib (10 μmol/L) for 18 hours. Data show relative fold change of PD-L1 protein normalized to the mock group (1 or 4) in each cell line (n = 3). (B) Tumor growth of PD-L1 WT–Hepa 1-6 or Y112F–Hepa 1-6 cells in immunodeficient (NSG) mice (n = 6). (C) Tumor weight (left) and images of tumors (right) harvested from NSG mice inoculated with PD-L1 WT–Hepa 1-6 or Y112F–Hepa 1-6 cells. Scale bar: 1 cm. (D) Flow cytometric analysis of cell surface PD-L1 expression on PD-L1 WT–Hepa 1-6 or Y112F–Hepa 1-6 tumors (n = 5). The relative fold change in the MFI of PD-L1 is shown. Error bars represent ± SD. ***P < 0.001, ****P < 0.0001, 1-way ANOVA (A), repeated-measures ANOVA (B), and Mann-Whitney test (C and D).
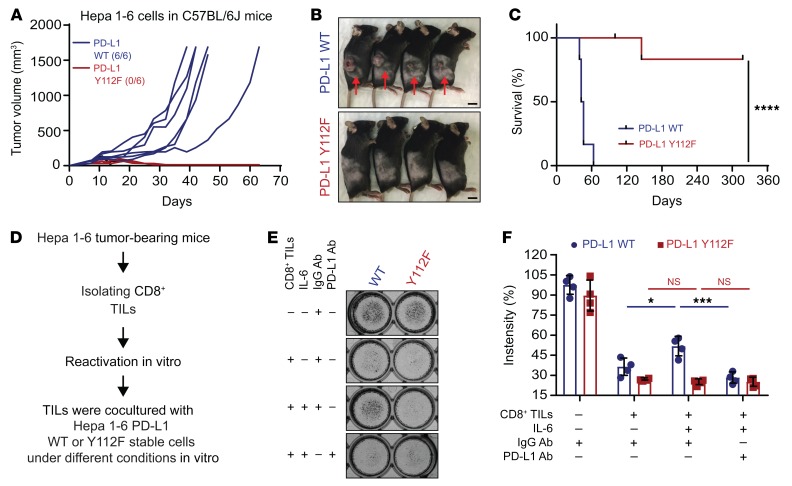
To further validate the above phenomenon in vivo, we injected FLAG–PD-L1 WT or Y112F–Hepa 1-6 cells into both immunodeficient (nonobese diabetic/severe combined immunodeficient, IL-2 receptor γ chain−/− null [NSG] mice) and immunocompetent mice. The PD-L1 WT and Y112F–Hepa 1-6 tumors from NSG mice exhibited similar growth and weight compared with WT tumors (Figure 8, B and C); however, the levels of PD-L1 expression were lower in the Y112F tumors than in WT tumors (Figure 8D). In contrast, we observed striking tumor regression (Figure 9, A and B) and no relapsed tumors for over 11 months (Figure 9C) in immunocompetent mice bearing PD-L1 Y112F compared with those with PD-L1 WT tumors. Moreover, more activated CD8+ (granzyme B+) T cells were present, and PD-L1 expression levels were much lower in Y112F tumors than in WT tumors (Supplemental Figure 11A). Similar but less profound results were observed in mice bearing tumors derived from PD-L1 WT– or Y112F–expressing B16F10 melanoma cells (Supplemental Figure 11, B and C). To further determine whether the CD8+ tumor-infiltrating lymphocyte–driven (TIL-driven) killing effect is reduced by the IL-6/JAK1/PD-L1 Y112 phosphorylation axis in cancer cells, we performed TIL coculture assay using PD-L1 WT and Y112F–Hepa 1-6 cells (Figure 9D). The PD-L1 WT–Hepa 1-6 cells had an increased survival rate under coculture with isolated and reactivated TILs in presence of IL-6 (Figure 9E). This effect was abolished by the addition of PD-L1 neutralizing antibody. As expected, IL-6 stimulation had no effect on the survival of PD-L1 Y112F–Hepa 1-6 cells cocultured with TILs, supporting the critical role of the IL-6/JAK1/PD-L1 Y112 phosphorylation axis in cancer cell immune evasion from CD8+ TILs. Together, these results indicated that PD-L1 Y112 phosphorylation is crucial for maintaining PD-L1 stabilization and its immune checkpoint function. Therefore, blocking the IL-6/JAK1/PD-L1 Y112 phosphorylation signaling axis should reduce PD-L1 expression and enhance immune surveillance in the tumor microenvironment.
Figure 9. PD-L1 Y112 phosphorylation is required for liver cancer tumorigenesis in immunocompetent mice.
(A) Individual tumor growth. (B and C) Representative images (B) and survival curves (C) of PD-L1 WT–Hepa 1-6 or Y112F–Hepa 1-6 cells in immunocompetent (C57BL/6J) mice (n = 6). One mouse in the PD-L1 Y112F group died accidentally at day 145. Scale bar: 1 cm. (D) Schematic of CD8+ tumor-infiltrating lymphocyte (TIL) and tumor cell coculture assay. (E) TIL coculture assay. Hepa 1-6 PD-L1 WT and Y112F cells were cocultured with activated CD8+ TILs from Hepa 1-6 tumor–bearing mice for 48 hours with or without IL-6 (20 ng/mL), PD-L1 antibody, or IgG control antibody. Cells were subjected to crystal violet staining (n = 4). Error bars represent ± SD. *P < 0.05, ***P < 0.001, ****P < 0.0001, log-rank Mantel-Cox test (C) and 1-way ANOVA (E).
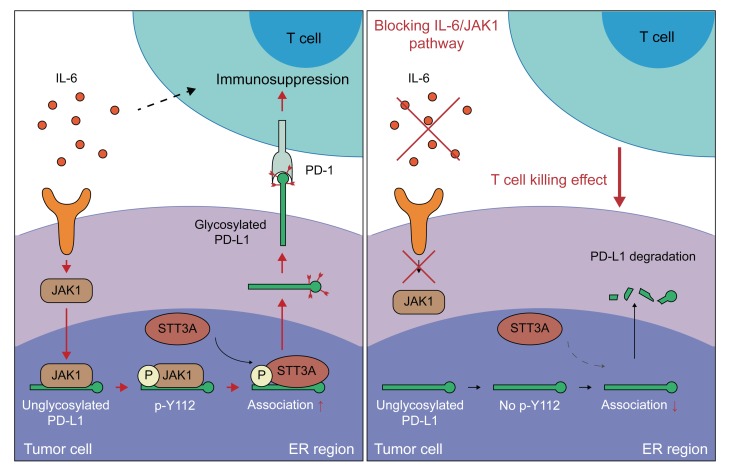
Collectively, our results indicate that IL-6–activated JAK1 interacts with and phosphorylates nonglycosylated PD-L1 at the Y112 residue in the ER, where the Y112-phosphorylated PD-L1 increases its association with the glycosyltransferase STT3A to initiate glycosylation. The glycosylated PD-L1 is stabilized and enhances the cancer immune escape from T cells in tumor microenvironment (Figure 10).
Figure 10. A proposed model illustrating PD-L1 protein Y112 phosphorylation, glycosylation initiation, and stability regulated by the IL-6/JAK1 signaling pathway in cancer immune escape.
Under IL-6 stimulation, JAK1 interacts with and phosphorylates nonglycosylated PD-L1 at Y112 in tumor cells, which enhances the association with STT3A for glycosylation initiation. Blocking the IL-6/JAK1 pathway leads to the loss of PD-L1 stability and sensitizes tumor cells to anti–Tim-3 immune checkpoint therapy.
Discussion
Previously, we reported that N-linked glycosylation on PD-L1 is required for maintaining PD-L1 stability and interaction with PD-1 (7, 8, 30), and that targeting PD-L1 via glycosylation-specific antibody demonstrated significant therapeutic efficacy in a triple-negative breast cancer mouse model (6). However, the oncogenic signaling pathway for initiating the glycosylation process of PD-L1 is not well understood. Elucidating this mechanism may provide a biomarker for improving clinical effectiveness of current anti–PD-1/PD-L1 treatment or a new marker-guided combination immunotherapy. In our study, we showed that the IL-6/JAK1/PD-L1–p-Y112/STT3A signaling axis enhances the glycosylation initiation and stabilization of PD-L1, suggesting it may be critical for tumorigenesis in immunocompetent mice. Importantly, increased expression of IL-6 is correlated with high PD-L1 expression in human HCC tumor tissue (Figure 1G and Table 2). Considering that the anti–PD-1 therapy nivolumab only achieves a 20% response rate in advanced HCC patients, IL-6 has the potential to serve as a biomarker to predict the response of PD-L1/PD-1 blockade therapy in HCC patients in the future. Furthermore, previous studies have shown that IL-6 also induces the expression of PD-1 in activated T cells, implying that the reduction of IL-6 expression in the tumor microenvironment stimulates anticancer immunity (20). Those studies and our current report together suggest that blocking the IL-6 pathway may abolish PD-L1/PD-1–driven cancer immune escape via different mechanisms in the tumor microenvironment (refs. 20, 31, 32, and Figure 10).
Interestingly, the PD-L1 Y112 phosphorylation appeared to be the dominant driver of cancer immune evasion in a Hepa 1-6 liver cancer mouse model (Figure 9A) but was less profound in B16F10 melanoma–bearing mice (Supplemental Figure 11, B and C). Multiple factors might affect PD-L1–driven immunosuppression, including the degree of cytotoxic T cell infiltration, mutation or neoantigen load, antigen presentation defects, and activation of interferon signaling, in different cancer types (15, 33, 34). These factors provided potential explanations why the PD-L1 Y112F clones exhibited less tumor regression in B16F10 than in Hepa 1-6 tumor–bearing mice in our studies. In addition to cancer cells, PD-L1 signaling in defined antigen-presenting cells upregulated by IFN-γ has also been reported to inhibit T cell activation (35). Moreover, expression of PD-L1 on dendritic cells and macrophages in melanoma patients correlated with the efficacy of PD-1 antibody treatment alone or in combination with CTLA-4 antibody (36). Because PD-L1 is still present on immune cells in PD-L1 WT and PD-L1 Y112F B16F10 tumor–bearing mouse models, it would be interesting to determine whether the IL-6/JAK1/PD-L1 Y112 phosphorylation/STT3A signaling axis also enhances glycosylation of PD-L1 on immune cells in different tumor microenvironments in the future.
Mechanisms of PD-L1 stabilization are tightly controlled by posttranslational modifications, including Ser/Thr phosphorylation, glycosylation, palmitoylation, and ubiquitination, all of which are important for immunosuppressive function and protein stability of PD-L1 (6, 7, 9, 10, 37–40). In this study, we identified JAK1 as a PD-L1–binding partner in the ER and showed that Tyr phosphorylation on PD-L1 by the IL-6/JAK1 pathway is essential for PD-L1’s association with the N-glycosyltransferase STT3A to prevent of ubiquitination and degradation of PD-L1. Although JAK1 has been shown to localize to the cytoplasmic membrane in JAK/STAT signaling pathway transduction and to the nucleus in epigenetic gene regulation by phosphorylating histone 3 Y41 as an oncoprotein (41–43), the current study further reveals its localization on the ER lumen to interact with PD-L1. We found that JAK1 protein level was increased in the ER region after IL-6 stimulation (Supplemental Figure 9C), suggesting that nonreceptor Tyr kinase can translocate into different organelles under ligand stimulation. Interestingly, the JAK family has been reported to translocate into the nucleus by association with a membrane receptor (41). Moreover, studies have also shown that membrane receptors can translocate into different cellular organelles via membrane-ER-nucleus retrograde trafficking pathways (44, 45). Together, these findings may provide a potential mechanism of how activated JAK1 translocates to other cellular compartments and warrant further investigation in the future. In addition, we recently reported that metformin-activated AMP-activated protein kinase (AMPK) directly binds to and phosphorylates PD-L1 at Ser195 in the ER. This event causes abnormal glycosylation of PD-L1 and leads to PD-L1 degradation via ER-associated protein degradation (30). A supply of ATP is required for kinase activation, but the catalysis of ATP uptake into the ER is still not fully understood. A recent study by Klein et al. reported that SLC35B1, also known as AXER (ATP/ADP exchanger in the ER membrane), maintains the ATP supply for protein biosynthesis in the ER (46), providing an explanation of how Tyr/Ser/Thr kinases gain ATP for their kinase activities in ER lumen. Together with our current findings, Tyr/Ser/Thr kinases can associate with PD-L1 in the ER region and regulate PD-L1 glycosylation.
Notably, glycoproteins in cancer cells not only prevent immune surveillance but also augment tumor cell signaling transduction, invasion, and angiogenesis (47). Our study also provides new insight into how oncogenic pathways directly orchestrate posttranslational modification crosstalk to enhance glycoprotein generation, namely initiation of PD-L1 glycosylation by recruitment of STT3A via JAK1-phosphorylated PD-L1. Using this approach makes possible the identification of potential oncogenic pathways that amplify the ability of glycoproteins to enhance tumor malignancy. These findings may support future clinical application for cancer therapy and prevention.
Activated JAK1 and JAK2 are known to upregulate the expression of immune checkpoint molecules (48, 49). However, the loss of function of JAK family members also contributes to the resistance of cancer to anti–CTLA-4 and anti–PD-1 therapy by reducing neoantigen presentation and IFN-γ–induced cancer cell apoptosis in patients (33, 34, 50, 51). Thus, direct inhibition of JAK1 kinase activity may disrupt immune surveillance in the tumor microenvironment. Alternatively, inactivation of IL-6 by a neutralization antibody in a combination with Tim-3 antibody has yielded effective therapeutic efficacy (Figure 2). Recently, Miao et al. showed that PBRM1 deficiency in tumors upregulates the IL-6/JAK/STAT3 pathway, which provided a clinical benefit in clear cell renal cell carcinoma patients receiving anti–PD-1 therapy (52). This phenomenon may be attributed to the activated IL-6/JAK pathway, which in turn increases PD-L1 expression in tumor cells. Therefore, blocking the PD-L1/PD-1 pathway may boost CTL activity in PBRM1-deficient cancer patients and further increase response rate. Treatment with immune checkpoint inhibitors has been shown to stimulate the production of IL-6 in serum, which can cause psoriasiform dermatitis, arthritis, and Crohn’s disease in cancer patients. Therefore, blocking the IL-6 pathway may resolve these side effects and extend the duration of immunotherapy (20).
Methods
Animal and toxicity studies.
Male 6- to 8-week-old C57BL/6J (catalog 000664) and NSG (catalog 005557) mice were purchased from The Jackson Laboratory. Murine Hepa 1-6 cells (5 × 10⁶), pGIPZ-sh(m)PD-L1/FLAG-(m)PD-L1WT or Y112F–Hepa 1-6 cells (5 × 10⁶), B16F10 cells (5 × 10⁴), or pGIPZ-sh(m)PD-L1/FLAG-(m)PD-L1WT or Y112F B16F10 cells (5 × 10⁴) in 50 μL of medium mixed with 50 μL of Matrigel basement membrane matrix (BD Biosciences) were injected s.c. into the right flanks of mice. IL-6 (150 μg; catalog MP5-20F3, Bio X Cell) and Tim-3 (150 μg; catalog B8.2C12, Bio X Cell) antibodies and an isotype control antibody (150 μg; catalog BE0088, Bio X Cell) were administered to mice via i.p. injection following the indicated treatment protocol (Figure 2A and Supplemental Figure 4A). Tumor size was measured as indicated in the figures (Figure 2B, Figure 8B, Figure 9A, Supplemental Figure 4B, and Supplemental Figure 11B), and tumor volume was calculated using the formula 1/2 × length × width2. Blood (200 μl) was collected from the orbital sinuses of mice using microhematocrit capillary tubes at the end of the experiment. Serum samples were subjected to biochemical analysis for the liver marker enzymes alanine transaminase and aspartate transaminase and the kidney marker byproducts creatinine and blood urea nitrogen to measure the toxicity of therapy using a COBAS INTEGRA 400 plus analyzer (Roche Diagnostics) in the Department of Veterinary Medicine and Surgery at MD Anderson.
Immunohistochemical staining of human HCC samples.
Paraffin-embedded HCC tissue array slides with 183 patient samples were obtained from the Liver Surgery Department at Zhongshan Hospital, Fudan University. Immunohistochemical staining of tissue array was performed as described previously (7). Briefly, tissue samples were incubated with antibodies against IL-6 (catalog sc-130326, Santa Cruz Biotechnology) and PD-L1 (catalog ab205921, Abcam) and then incubated with an avidin-biotin-peroxidase complex. Visualization was performed using amino-ethylcarbazole chromogen. For statistical analysis, the Fisher exact test and Spearman rank correlation coefficient were used, and P values less than 0.05 were considered statistically significant. Using histological scoring, the staining intensity was ranked into 1 of 3 groups: high (score 3), medium (score 2), and low (score 1 and 0).
Reagents.
MG-132 and cyclophosphamide were purchased from Sigma-Aldrich. The following reagents were purchased from PeproTech: IFN-γ, CCL1, IL-6, M-CSF, CXCL9, CCL3, TNF-α, TNF-β, and PDGF-BB. Ruxolitinib was purchased from Advanced ChemBlocks.
Plasmids.
A pGIPZ dual expression construct for knockdown and re-expression of FLAG PD-L1 was constructed as described previously (7). Briefly, green fluorescent protein cDNA on a pGIPZ-sh human (h) PD-L1 clone [3′-untranslated region of (h)PD-L1: TTGACTCCATCTTTCTTCA; Thermo Fisher Scientific) was replaced with FLAG-(h)PD-L1 WT (shRNA and ORFeome Core, MD Anderson). The pGIPZ-sh(h)PD-L1/FLAG-PD-L1 Y112F and ngPD-L1 (4 glycosylation sites: N35, N192, N200, and N219 to Q) were generated via site-directed mutagenesis of pGIPZ-sh(h)PD-L1/FLAG-PD-L1 WT. The same methods were applied to generate pGIPZ-sh mouse (m) PD-L1/FLAG-(m)PD-L1 WT and Y112F plasmids using pGIPZ-sh(m)PD-L1 clone 3 (Thermo Fisher Scientific) and FLAG-(m)PD-L1 WT (shRNA and ORFeome Core, MD Anderson). pPET21a His-PD-L1 was constructed by insertion of the extracellular domain of PD-L1 (aa 19–238) into a pPET21a vector. pcDH-mycJAK1 was constructed by subcloning JAK1 cDNA from 293T cells and inserting it into a pcDH vector. The pcDH-STT3A-HA expression plasmid was constructed as described previously (8).
Cell culture.
The cell lines Hep 3B, SK-HEP-1, A375, MDA-MB-231, Hepa 1-6, and B16F10 were obtained from the ATCC, and HA59T/VGH (HA59T) was obtained from the Center for Molecular Medicine, China Medical University. According to the characteristic result from ATCC, the SK-HEP-1 cells were isolated from ascites of liver cancer patients and had been identified as being of endothelial origin. All cells were independently confirmed using short tandem repeat DNA fingerprinting at MD Anderson, and tests for mycoplasma infection were negative. All cell lines were cultured in DMEM supplemented with 10% FBS and 1% antibiotic mixture. For cytokine stimulation and inhibitor-based treatment experiments, cells were serum-starved overnight and then treated under the indicated conditions.
Generation of exogenous PD-L1 stable cells and other knockdown and knockout stable cells.
Using a lentiviral-based pGIPZ-shPD-L1/FLAG-PD-L1 dual expression system, we established Hep 3B, SK-HEP-1, HA59T, and A375 stable cells expressing FLAG–PD-L1 WT, Y112F, or ngPD-L1 mutants with endogenous PD-L1 knockdown (KD). The same method was used to establish stable murine Hepa 1-6 and B16F10 cells with FLAG–PD-L1 WT or Y112F expression. JAK1-KD stable cells were generated using pLKO-JAK1 shRNA (catalog TRCN0000295813, Sigma-Aldrich). STT3A-knockout stable cells were generated using an STT3A CRISPR/Cas9 knockout (KO) plasmid (catalog sc-405155, Santa Cruz Biotechnology) according to the manufacturer’s instructions.
Transfection of siRNA and expression vectors.
Commercial siRNAs were used to knock down expression of JAK1 (#1 SASI_Hs01_00174612 and #2 SASI_Hs01_00174613, Sigma-Aldrich), JAK2 (#1 SASI_Hs02_00338675 and #2 SA SASI_Hs01_00041551, Sigma-Aldrich), TYK2 (#1 SASI_Hs01_00107854 and #2 SASI_Hs01_00107856, Sigma-Aldrich), and ON-TARGETplus STT3A siRNA SMARTpool (catalog L-017073-01-0005, Dharmacon). These siRNAs were transfected into Hep 3B and SK-HEP-1 pGIPZ shPD-L1/FLAG-PD-L1 WT cells using an electroporator (Nucleofector II, Lonza) according to the manufacturer’s instructions. pCMV HA-ubiquitin and pGIPZ shPD-L1/FLAG-PD-L1 WT or Y112F were transfected into HEK293T cells using Lipofectamine LTX with Plus Reagent (catalog 15338100, Life Technologies).
Western blotting and co-IP.
Whole-cell extracts were prepared by lysing of cells in a lysis buffer containing 20 mM Tris (pH 7.5), 150 mM NaCl, 1 mM EDTA, 1 mM EGTA, 1% Triton X-100, 2 mM NaF, 1 mM Na3VO4, and protease inhibitor cocktail (B14002, Biotool) freshly added to lysis buffer before lysis. Immunoblotting was performed with primary antibodies against PD-L1 (catalog 13684; 1:1000; Cell Signaling Technology), PD-L1 (catalog GTX104763; 1:2000; GeneTex), JAK1 (catalog sc-376996; 1:1000; Santa Cruz Biotechnology), JAK1 (catalog 610231; 1:2000; BD Biosciences), JAK2 (catalog 3230; 1:1000; Cell Signaling Technology), TYK2 (catalog 14193; 1:1000; Cell Signaling Technology), STT3A (catalog sc-100796; 1:1000; Santa Cruz Biotechnology), FLAG tag (catalog 14793; 1:2000; Cell Signaling Technology), FLAG tag (catalog F1804; 1:4000; Sigma-Aldrich), HA tag (catalog 3724; 1:3000; Cell Signaling Technology), phosphorylated STAT3 (Tyr705; catalog 9145; 1:3000; Cell Signaling Technology), STAT3 (catalog sc-482; 1:2000; Santa Cruz Biotechnology), α-tubulin (catalog B-5-1-2; 1:5000; Sigma-Aldrich), and β-actin (catalog A2228; 1:5000; Sigma-Aldrich). For co-IP, cells were lysed in lysis buffer. Lysates (2 mg) were mixed with antibodies against PD-L1 (catalog 13684; 1:200; Cell Signaling Technology), STT3A (catalog sc-100796; 1:200; Santa Cruz Biotechnology), FLAG tag (catalog 14793; 1:200; Cell Signaling Technology), and FLAG tag (catalog F1804; 1:200; Sigma-Aldrich) overnight at 4°C and then pulled down using a protein G magnetic bead (catalog 161-4023; 1:10; Bio-Rad Laboratories) at 4°C for 6 hours. Western blot signals were analyzed and quantified using the Image Studio Lite software program (LI-COR Biotechnology). See complete unedited blots in the supplemental material.
Trypsinization of ER microsomal fractions.
ER microsomal fraction was collected from cells by ER enrichment kit (catalog NBP2-29482, Novus Biologicals). After pretreatment with or without 1% Triton X-100 for 3 minutes, trypsin/EDTA (0.625 g/L trypsin and 0.05 g/L EDTA in PBS) solution was added to ER microsomal fraction. Samples were incubated for the indicated time. After trypsinization, samples were analyzed by Western blotting using primary antibodies against IRE1α (3294; 1:2000; Cell Signaling Technology), HSP90B1 (catalog NBP2-42379; 1:3000; Novus Biologicals), or JAK1 (catalog 610231; 1:2000; BD Biosciences).
Immunofluorescence staining.
Cells were washed with PBS and fixed in an ice-cold acetone-methanol mixture (1:1) for 5 minutes. After washing in PBS 3 times, the cells were placed in a blocking buffer (10% normal goat serum and 1% BSA in PBS) at room temperature for 1 hour. The cells were then stained with primary antibody against JAK1 (catalog sc-376996; 1:50; Santa Cruz Biotechnology) or HSP90B1 (catalog nb300-619; 1:100; Novus Biologicals) with 5% normal goat serum and 0.2% BSA in PBS at 4°C overnight. Secondary antibody conjugated to Alexa Fluor 594 or 488 (catalog A-21203 or A-21208; 1:3000; Life Technologies) was used to visualize the primary antibody. The cells were then counterstained with Hoechst dye and mounted. To show the binding between JAK1 and PD-L1, cells were subjected to Duolink in situ fluorescent staining (catalog DUO92101, Sigma-Aldrich) with anti-JAK1 (catalog sc-376996; 1:50; Santa Cruz Biotechnology) and anti–PD-L1 (catalog ab205921; 1:100; Abcam) primary antibodies according to the manufacturer’s instruction. After the Duolink assay, cells were further subjected to anti-HSP90B1 immunofluorescence staining as described above. Fluorescent images of the cells were observed under an LSM 710 confocal microscope (Carl Zeiss). For image quantification of JAK1 expression, a custom software program was designed using MATLAB (MathWorks) to analyze image data. Images were processed with background subtraction and using a Gaussian filter with a width of 2 pixels to reduce noise. Cells were then segmented using a watershed algorithm and Otsu’s thresholding method. Cytoplasmic immunofluorescence signals were calculated as the average intensities within the cytoplasmic regions. For immunofluorescent staining of mouse tumor samples, tumors were isolated from mice, embedded in optimal cutting temperature blocks, and frozen for cryostat sectioning. Cryostat sections (8 μm thick) were fixed with 4% paraformaldehyde for 15 minutes at room temperature. After washing in PBS, sections were incubated in a blocking solution (PBS with 3% donkey serum, 1% BSA, 0.3% Triton X-100, pH 7.4) for 30 minutes at room temperature. Samples were stained with primary antibodies against CD8 (catalog MCA609G; 1:100; Bio-Rad Laboratories) and granzyme B (catalog AF1865; 1:500; R&D Systems) in an antibody reaction buffer (PBS plus 1% BSA, 0.3% Triton X-100, pH 7.4) overnight at 4°C followed by secondary antibodies conjugated with Alexa Fluor 488, 546, and 647 (catalog A-11055, A-10040 and A-31573; 1:3000; Life Technologies) at room temperature for 1 hour. Hoechst 33342 (Life Technologies) was used for nuclear staining. Fluorescent images of the cells were observed as described above.
Quantitative real-time reverse transcriptase PCR.
Total RNA was extracted from cells using an RNeasy Mini Kit (Qiagen) after washing with PBS. cDNA was synthesized from purified RNA using a SuperScript III First-Strand cDNA synthesis system (18080051, Life Technologies) according to the manufacturer’s instructions. Quantitative PCR analysis was performed using a real-time PCR machine (iQ5, Bio-Rad Laboratories). The comparative Ct method was used for data analysis. Human PD-L1 mRNA was normalized to human actin mRNA. The primer sequences for quantitative real-time reverse transcriptase PCR were as follows: human PD-L1 forward, 5′-TCACTTGGTAATTCTGGGAGC-3′; human PD-L1 reverse, 5′-CTTTGAGTTTGTATCTTGGATGCC-3′; human actin forward, 5′-GCAAAGACCTGTACGCCAACA-3′; human actin reverse, 5′-TGCATCCTGTCGGCAATG-3′.
In vitro kinase assay.
Expression of the recombinant proteins His-PD-L1 WT and His-PD-L1 Y112F (extracellular domain; aa 19–238) was induced in E. coli (BL21) using isopropyl β-d-1-thiogalactopyranoside, and the proteins were purified using a HisTALON Superflow Cartridge (635683, Clontech). Purified recombinant proteins were incubated with activated JAK1 kinase (catalog SRP0335, Sigma-Aldrich) and 0.2 mM ATP in a kinase buffer (5 mM MgCl2, 5 mM MnCl2, 50 μM Na3VO4, 50 mM HEPES, pH 7.4, 5 mM DTT) at 30°C for 30 minutes. The kinase reaction was stopped by the addition of SDS sample and boiling. The samples were analyzed using Western blotting.
Antibody generation and detection.
An anti–PD-L1 Y112 phosphorylation antibody (anti–p-Y112 PD-L1) was generated against the region near the Tyr112 phosphorylation site of PD-L1. The phosphorylated synthetic peptide [C-QDAGV(pY)RCMISYGGADYKR] was used for immunization in the mice. The antibody was generated as described previously (7). For detecting ngPD-L1 Y112 phosphorylation, antibodies were preincubated with cold or hot peptide for 2 hours at 4°C and applied to pull-down of Y112 phosphorylation of ngPD-L1 using co-IP as described above.
Flow cytometric analysis and CTL profile analysis in mouse tumors.
Single-cell suspensions were prepared and resuspended in a staining buffer (catalog 554656, BD Biosciences). Human tumor cells were stained with APC–PD-L1 (catalog 329707; 1:100; BioLegend) according to standard protocols. To analyze CTL profiles and PD-L1 levels in mouse tumor samples, a Mouse Tumor Dissociation Kit (catalog 130-096-730, Miltenyi Biotec) and gentleMACS Octo Dissociator (catalog 130-096-427, Miltenyi Biotec) were used to digest mouse tumors into single cells. After removal of red blood cells and hybridizing with CD16/CD32 antibody (TruStain fcX, catalog 101319; 1:50; BioLegend), single cells were stained for flow cytometry according to standard protocols with antibodies against the following: PE-CD45 (catalog 103105; 1:200; BioLegend), APC-CD3ε (catalog 100311; 1:100; BioLegend), APC/Cy7-CD8a (catalog 100713; 1:100; BioLegend), and APC–PD-L1 (catalog 124311; 1:100; BioLegend). For further intracellular staining, cells were fixed, permeabilized, and stained with Pacific Blue IFN-γ (catalog 505817; 1:50; BioLegend), Pacific Blue granzyme B (catalog 515407; 1:50; BioLegend), or FITC–granzyme B (catalog 515403; 1:50; BioLegend). Stained cells were analyzed using a BD FACSCanto II cytometer (BD Biosciences). Data were processed using the FlowJo software program.
CD8+ TIL coculture assay.
Mouse Tumor Dissociation Kit (catalog 130-096-730, Miltenyi Biotec) and gentleMACS Octo Dissociator (catalog 130-096-427, Miltenyi Biotec) were applied to digest tumors from mice. Percoll gradient assay (catalog 17-5445-01, GE Healthcare) was then performed to enrich leukocytes. CD8+ tumor-infiltrating lymphocytes (TILs) were isolated using the Mouse CD8+ T Cell Isolation Kit (catalog 19853, STEMCELL Technologies). The isolated CD8+ TILs were activated by Dynabeads Mouse T-Activator CD3/CD28 (catalog 11456D, Thermo Fisher Scientific) for 3 days according to the manufacturer’s protocol. The experiments were performed in DMEM with IL-2 (10 ng/mL). Cancer cells were allowed to adhere to the plate overnight and then incubated for 48 hours with activated CD8+ TILs in the presence or absence of IL-6 (20 ng/mL), IgG control antibody (5 μg/mL; catalog BE0101, Bio X Cell), or mouse PD-L1 antibody (5 μg/mL; catalog BE0090, Bio X Cell). The ratio between cancer cells and CD8+ TILs was 1:5. T cells and cell debris were removed by PBS wash, and living cancer cells were then quantified by a spectrometer at OD 570 nm followed by crystal violet staining.
Statistics.
Statistical analyses were performed using SPSS analysis tools (IBM Corp.) or the Prism software program (GraphPad Software). All data are presented as means ± SD. The Mann-Whitney test was used to compare 2 groups. One-way and repeated-measures ANOVA was used to compare multiple groups. The log-rank (Mantel-Cox) test was used to compare mouse survival rates. P values less than 0.05 were considered statistically significant.
Study approval.
All animal experiments were performed in accordance with guidelines approved by The University of Texas MD Anderson Cancer Center Institutional Animal Care and Use Committee. Under IRB approval from MD Anderson, a total of 103 newly diagnosed patients with pathologically and/or radiologically confirmed HCC diagnosis were recruited during 2014 as part of an ongoing case-control study. Blood samples were collected at time of diagnosis prior to treatment intake. Clinico-radiological-pathological features of HCC patients were retrieved from medical records. Plasma samples were shipped to Rules-Based Medicine (RBM) for testing of the circulating level of IL-6 and certified by Clinical Laboratory Improvement Amendments. Mean value was assessed in a group of 200 normal controls who were included in the case-control study and defined as spouses and friends with other cancers. Written informed consent was obtained from all patients.
Author contributions
LCC designed and performed the experiments, analyzed data, and wrote the manuscript. CWL, WX, JMH, JHC, WHY, EYY, WCC, ZZ, SOL, YJL, CL, JL, YY, and LS performed experiments and analyzed data. HLW generated antibodies. HHL, YW, LN, XL, and SCW provided scientific input and designed experiments. QD, HL, and QY provided patient tissue samples. MMH, HMA, and AOK provided the analysis of patient plasma samples and clinicopathological features. JLH revised the manuscript. MCH supervised the entire project, designed the experiments, and wrote the manuscript.
Supplementary Material
Acknowledgments
This work was funded in part by the NIH/National Cancer Institute under awards P30CA016672, R01 CA211615, and AI116722; the Cancer Prevention & Research Institute of Texas (RP160710); The University of Texas MD Anderson Cancer Center–China Medical University and Hospital Sister Institution Fund (to MCH); the Ministry of Health and Welfare, China Medical University Hospital Cancer Research Center of Excellence (MOHW108-TDU-B-212-124024 and MOHW108-TDU-B-212-122015 to SCW); the Center for Biological Pathways; the Ministry of Science and Technology Overseas Project for Post Graduate Research (MOST 104-2917-I-564-003, to WHY); a National Research Foundation of Korea grant for the Global Core Research Center funded by the Korean government (MSIP 2011-0030001, to JHC); the MD Anderson Odyssey Fellowship Program (to YY); and an NIH T32 Training Grant in Cancer Biology (5T32CA186892, to LCC and HHL). We thank Ann-Lii Cheng (National Taiwan University Cancer Center) and Chih-Hung Hsu and Yu-Yun Shao (National Taiwan University Hospital) for immunohistochemical and clinical data analysis.
Version 1. 07/15/2019
Electronic publication
Version 2. 08/01/2019
Print issue publication
Footnotes
Conflict of interest: The authors have declared that no conflict of interest exists.
Copyright: © 2019, American Society for Clinical Investigation.
Reference information: J Clin Invest. 2019;129(8):3324–3338.https://doi.org/10.1172/JCI126022.
Contributor Information
Li-Chuan Chan, Email: Li-Chuan.Chan@uth.tmc.edu.
Chia-Wei Li, Email: cwli@mdanderson.org.
Weiya Xia, Email: wexia@mdanderson.org.
Jung-Mao Hsu, Email: jhsu@mdanderson.org.
Heng-Huan Lee, Email: hhlee@mdanderson.org.
Jong-Ho Cha, Email: JCha@mdanderson.org.
Hung-Ling Wang, Email: vivian2412@gmail.com.
Wen-Hao Yang, Email: Why0331@gmail.com.
Er-Yen Yen, Email: Er-Yen.yen@uth.tmc.edu.
Wei-Chao Chang, Email: ntu88447004.tw@yahoo.com.tw.
Zhengyu Zha, Email: ZZha@mdanderson.org.
Seung-Oe Lim, Email: limsoe@purdue.edu.
Yun-Ju Lai, Email: Yun-ju.lai.1@uth.tmc.edu.
Chunxiao Liu, Email: CLiu13@mdanderson.org.
Jielin Liu, Email: Jielin.Liu@uth.tmc.edu.
Qiongzhu Dong, Email: qzhdong@fudan.edu.cn.
Yi Yang, Email: YYang21@mdanderson.org.
Linlin Sun, Email: lsun1@tmu.edu.cn.
Yongkun Wei, Email: yongwei@mdanderson.org.
Lei Nie, Email: lnie@mdanderson.org.
Hui Li, Email: lihui0801@foxmail.com.
Qinghai Ye, Email: ye.qinghai@zs-hospital.sh.cn.
Hesham M. Amin, Email: hamin@mdanderson.org.
Xin Lin, Email: linxin307@tsinghua.edu.cn.
Shao-Chun Wang, Email: scpwang@mail.cmu.edu.tw.
References
- 1.Chen L, Han X. Anti-PD-1/PD-L1 therapy of human cancer: past, present, and future. J Clin Invest. 2015;125(9):3384–3391. doi: 10.1172/JCI80011. [DOI] [PMC free article] [PubMed] [Google Scholar]
- 2.Zou W, Wolchok JD, Chen L. PD-L1 (B7-H1) and PD-1 pathway blockade for cancer therapy: mechanisms, response biomarkers, and combinations. Sci Transl Med. 2016;8(328):328rv4. doi: 10.1126/scitranslmed.aad7118. [DOI] [PMC free article] [PubMed] [Google Scholar]
- 3.Mahoney KM, Rennert PD, Freeman GJ. Combination cancer immunotherapy and new immunomodulatory targets. Nat Rev Drug Discov. 2015;14(8):561–584. doi: 10.1038/nrd4591. [DOI] [PubMed] [Google Scholar]
- 4.Topalian SL, Taube JM, Anders RA, Pardoll DM. Mechanism-driven biomarkers to guide immune checkpoint blockade in cancer therapy. Nat Rev Cancer. 2016;16(5):275–287. doi: 10.1038/nrc.2016.36. [DOI] [PMC free article] [PubMed] [Google Scholar]
- 5.RodrÍguez E, Schetters STT, van Kooyk Y. The tumour glyco-code as a novel immune checkpoint for immunotherapy. Nat Rev Immunol. 2018;18(3):204–211. doi: 10.1038/nri.2018.3. [DOI] [PubMed] [Google Scholar]
- 6.Li CW, et al. Eradication of triple-negative breast cancer cells by targeting glycosylated PD-L1. Cancer Cell. 2018;33(2):187–201.e10. doi: 10.1016/j.ccell.2018.01.009. [DOI] [PMC free article] [PubMed] [Google Scholar]
- 7.Li CW, et al. Glycosylation and stabilization of programmed death ligand-1 suppresses T-cell activity. Nat Commun. 2016;7:12632. doi: 10.1038/ncomms12632. [DOI] [PMC free article] [PubMed] [Google Scholar]
- 8.Hsu JM, et al. STT3-dependent PD-L1 accumulation on cancer stem cells promotes immune evasion. Nat Commun. 2018;9(1):1908. doi: 10.1038/s41467-018-04313-6. [DOI] [PMC free article] [PubMed] [Google Scholar]
- 9.Lim SO, et al. Deubiquitination and stabilization of PD-L1 by CSN5. Cancer Cell. 2016;30(6):925–939. doi: 10.1016/j.ccell.2016.10.010. [DOI] [PMC free article] [PubMed] [Google Scholar]
- 10.Zhang J, et al. Cyclin D-CDK4 kinase destabilizes PD-L1 via cullin 3-SPOP to control cancer immune surveillance. Nature. 2018;553(7686):91–95. doi: 10.1038/nature25015. [DOI] [PMC free article] [PubMed] [Google Scholar]
- 11.Llovet JM, et al. Hepatocellular carcinoma. Nat Rev Dis Primers. 2016;2:16018. doi: 10.1038/nrdp.2016.18. [DOI] [PubMed] [Google Scholar]
- 12.Bruix J, et al. Regorafenib for patients with hepatocellular carcinoma who progressed on sorafenib treatment (RESORCE): a randomised, double-blind, placebo-controlled, phase 3 trial. Lancet. 2017;389(10064):56–66. doi: 10.1016/S0140-6736(16)32453-9. [DOI] [PubMed] [Google Scholar]
- 13.El-Khoueiry AB, et al. Nivolumab in patients with advanced hepatocellular carcinoma (CheckMate 040): an open-label, non-comparative, phase 1/2 dose escalation and expansion trial. Lancet. 2017;389(10088):2492–2502. doi: 10.1016/S0140-6736(17)31046-2. [DOI] [PMC free article] [PubMed] [Google Scholar]
- 14.Wolchok JD, et al. Overall survival with combined nivolumab and ipilimumab in advanced melanoma. N Engl J Med. 2017;377(14):1345–1356. doi: 10.1056/NEJMoa1709684. [DOI] [PMC free article] [PubMed] [Google Scholar]
- 15.Postow MA, et al. Nivolumab and ipilimumab versus ipilimumab in untreated melanoma. N Engl J Med. 2015;372(21):2006–2017. doi: 10.1056/NEJMoa1414428. [DOI] [PMC free article] [PubMed] [Google Scholar]
- 16.Park EJ, et al. Dietary and genetic obesity promote liver inflammation and tumorigenesis by enhancing IL-6 and TNF expression. Cell. 2010;140(2):197–208. doi: 10.1016/j.cell.2009.12.052. [DOI] [PMC free article] [PubMed] [Google Scholar]
- 17.Yang X, et al. MicroRNA-26a suppresses tumor growth and metastasis of human hepatocellular carcinoma by targeting interleukin-6-Stat3 pathway. Hepatology. 2013;58(1):158–170. doi: 10.1002/hep.26305. [DOI] [PubMed] [Google Scholar]
- 18.Shao YY, et al. High plasma interleukin-6 levels associated with poor prognosis of patients with advanced hepatocellular carcinoma. Jpn J Clin Oncol. 2017;47(10):949–953. doi: 10.1093/jjco/hyx103. [DOI] [PubMed] [Google Scholar]
- 19.He G, et al. Identification of liver cancer progenitors whose malignant progression depends on autocrine IL-6 signaling. Cell. 2013;155(2):384–396. doi: 10.1016/j.cell.2013.09.031. [DOI] [PMC free article] [PubMed] [Google Scholar]
- 20.Johnson DE, O’Keefe RA, Grandis JR. Targeting the IL-6/JAK/STAT3 signalling axis in cancer. Nat Rev Clin Oncol. 2018;15(4):234–248. doi: 10.1038/nrclinonc.2018.8. [DOI] [PMC free article] [PubMed] [Google Scholar]
- 21.Wu TJ, et al. Severe hepatitis promotes hepatocellular carcinoma recurrence via NF-κB pathway-mediated epithelial-mesenchymal transition after resection. Clin Cancer Res. 2016;22(7):1800–1812. doi: 10.1158/1078-0432.CCR-15-0780. [DOI] [PMC free article] [PubMed] [Google Scholar]
- 22.Kan Z, et al. Whole-genome sequencing identifies recurrent mutations in hepatocellular carcinoma. Genome Res. 2013;23(9):1422–1433. doi: 10.1101/gr.154492.113. [DOI] [PMC free article] [PubMed] [Google Scholar]
- 23.Marquardt JU, Andersen JB, Thorgeirsson SS. Functional and genetic deconstruction of the cellular origin in liver cancer. Nat Rev Cancer. 2015;15(11):653–667. doi: 10.1038/nrc4017. [DOI] [PubMed] [Google Scholar]
- 24.Hunter CA, Jones SA. IL-6 as a keystone cytokine in health and disease. Nat Immunol. 2015;16(5):448–457. doi: 10.1038/ni.3153. [DOI] [PubMed] [Google Scholar]
- 25.Jang JW, et al. Serum interleukin-6 and C-reactive protein as a prognostic indicator in hepatocellular carcinoma. Cytokine. 2012;60(3):686–693. doi: 10.1016/j.cyto.2012.07.017. [DOI] [PubMed] [Google Scholar]
- 26.Li H, et al. Tim-3/galectin-9 signaling pathway mediates T-cell dysfunction and predicts poor prognosis in patients with hepatitis B virus-associated hepatocellular carcinoma. Hepatology. 2012;56(4):1342–1351. doi: 10.1002/hep.25777. [DOI] [PubMed] [Google Scholar]
- 27.Flecken T, Sarobe P. Tim-3 expression in tumour-associated macrophages: a new player in HCC progression. Gut. 2015;64(10):1502–1503. doi: 10.1136/gutjnl-2014-309094. [DOI] [PubMed] [Google Scholar]
- 28.Brown ZJ, Heinrich B, Greten TF. Mouse models of hepatocellular carcinoma: an overview and highlights for immunotherapy research. Nat Rev Gastroenterol Hepatol. 2018;15(9):536–554. doi: 10.1038/s41575-018-0033-6. [DOI] [PubMed] [Google Scholar]
- 29.Breitling J, Aebi M. N-linked protein glycosylation in the endoplasmic reticulum. Cold Spring Harb Perspect Biol. 2013;5(8):a013359. doi: 10.1101/cshperspect.a013359. [DOI] [PMC free article] [PubMed] [Google Scholar]
- 30.Cha JH, et al. Metformin promotes antitumor immunity via endoplasmic-reticulum-associated degradation of PD-L1. Mol Cell. 2018;71(4):606–620.e7. doi: 10.1016/j.molcel.2018.07.030. [DOI] [PMC free article] [PubMed] [Google Scholar]
- 31.Wang LT, et al. Intestine-specific homeobox gene. Cancer Res. 2017;77(15):4065–4077. doi: 10.1158/0008-5472.CAN-17-0090. [DOI] [PubMed] [Google Scholar]
- 32.Tsukamoto H, et al. Combined blockade of IL6 and PD-1/PD-L1 signaling abrogates mutual regulation of their immunosuppressive effects in the tumor microenvironment. Cancer Res. 2018;78(17):5011–5022. doi: 10.1158/0008-5472.CAN-18-0118. [DOI] [PubMed] [Google Scholar]
- 33.Sharma P, Hu-Lieskovan S, Wargo JA, Ribas A. Primary, adaptive, and acquired resistance to cancer immunotherapy. Cell. 2017;168(4):707–723. doi: 10.1016/j.cell.2017.01.017. [DOI] [PMC free article] [PubMed] [Google Scholar]
- 34.Gao J, et al. Loss of IFN-γ pathway genes in tumor cells as a mechanism of resistance to anti-CTLA-4 therapy. Cell. 2016;167(2):397–404.e9. doi: 10.1016/j.cell.2016.08.069. [DOI] [PMC free article] [PubMed] [Google Scholar]
- 35.Tang H, et al. PD-L1 on host cells is essential for PD-L1 blockade-mediated tumor regression. J Clin Invest. 2018;128(2):580–588. doi: 10.1172/JCI96061. [DOI] [PMC free article] [PubMed] [Google Scholar]
- 36.Lin H, et al. Host expression of PD-L1 determines efficacy of PD-L1 pathway blockade-mediated tumor regression. J Clin Invest. 2018;128(2):805–815. doi: 10.1172/JCI96113. [DOI] [PMC free article] [PubMed] [Google Scholar]
- 37.Burr ML, et al. CMTM6 maintains the expression of PD-L1 and regulates anti-tumour immunity. Nature. 2017;549(7670):101–105. doi: 10.1038/nature23643. [DOI] [PMC free article] [PubMed] [Google Scholar]
- 38.Mezzadra R, et al. Identification of CMTM6 and CMTM4 as PD-L1 protein regulators. Nature. 2017;549(7670):106–110. doi: 10.1038/nature23669. [DOI] [PMC free article] [PubMed] [Google Scholar]
- 39.Shao B, et al. Deglycosylation of PD-L1 by 2-deoxyglucose reverses PARP inhibitor-induced immunosuppression in triple-negative breast cancer. Am J Cancer Res. 2018;8(9):1837–1846. [PMC free article] [PubMed] [Google Scholar]
- 40.Yang Y, et al. Palmitoylation stabilizes PD-L1 to promote breast tumor growth. Cell Res. 2019;29(1):83–86. doi: 10.1038/s41422-018-0124-5. [DOI] [PMC free article] [PubMed] [Google Scholar]
- 41.Zouein FA, Duhé RJ, Booz GW. JAKs go nuclear: emerging role of nuclear JAK1 and JAK2 in gene expression and cell growth. Growth Factors. 2011;29(6):245–252. doi: 10.3109/08977194.2011.614949. [DOI] [PMC free article] [PubMed] [Google Scholar]
- 42.Rui L, et al. Epigenetic gene regulation by Janus kinase 1 in diffuse large B-cell lymphoma. Proc Natl Acad Sci U S A. 2016;113(46):E7260–E7267. doi: 10.1073/pnas.1610970113. [DOI] [PMC free article] [PubMed] [Google Scholar]
- 43.Buchert M, Burns CJ, Ernst M. Targeting JAK kinase in solid tumors: emerging opportunities and challenges. Oncogene. 2016;35(8):939–951. doi: 10.1038/onc.2015.150. [DOI] [PubMed] [Google Scholar]
- 44.Chen MK, Hung MC. Proteolytic cleavage, trafficking, and functions of nuclear receptor tyrosine kinases. FEBS J. 2015;282(19):3693–3721. doi: 10.1111/febs.13342. [DOI] [PMC free article] [PubMed] [Google Scholar]
- 45.Wang YN, Yamaguchi H, Hsu JM, Hung MC. Nuclear trafficking of the epidermal growth factor receptor family membrane proteins. Oncogene. 2010;29(28):3997–4006. doi: 10.1038/onc.2010.157. [DOI] [PMC free article] [PubMed] [Google Scholar]
- 46.Klein MC, et al. AXER is an ATP/ADP exchanger in the membrane of the endoplasmic reticulum. Nat Commun. 2018;9(1):3489. doi: 10.1038/s41467-018-06003-9. [DOI] [PMC free article] [PubMed] [Google Scholar]
- 47.Pinho SS, Reis CA. Glycosylation in cancer: mechanisms and clinical implications. Nat Rev Cancer. 2015;15(9):540–555. doi: 10.1038/nrc3982. [DOI] [PubMed] [Google Scholar]
- 48.Benci JL, et al. Tumor interferon signaling regulates a multigenic resistance program to immune checkpoint blockade. Cell. 2016;167(6):1540–1554.e12. doi: 10.1016/j.cell.2016.11.022. [DOI] [PMC free article] [PubMed] [Google Scholar]
- 49.Prestipino A, et al. Oncogenic JAK2V617F causes PD-L1 expression, mediating immune escape in myeloproliferative neoplasms. Sci Transl Med. 2018;10(429):eaam7729. doi: 10.1126/scitranslmed.aam7729. [DOI] [PMC free article] [PubMed] [Google Scholar]
- 50.Zaretsky JM, et al. Mutations associated with acquired resistance to PD-1 blockade in melanoma. N Engl J Med. 2016;375(9):819–829. doi: 10.1056/NEJMoa1604958. [DOI] [PMC free article] [PubMed] [Google Scholar]
- 51.Pan D, et al. A major chromatin regulator determines resistance of tumor cells to T cell-mediated killing. Science. 2018;359(6377):770–775. doi: 10.1126/science.aao1710. [DOI] [PMC free article] [PubMed] [Google Scholar]
- 52.Miao D, et al. Genomic correlates of response to immune checkpoint therapies in clear cell renal cell carcinoma. Science. 2018;359(6377):801–806. doi: 10.1126/science.aan5951. [DOI] [PMC free article] [PubMed] [Google Scholar]
Associated Data
This section collects any data citations, data availability statements, or supplementary materials included in this article.


