Abstract
Cytosolic arginine sensor for mTORC1 subunits 1 and 2 (CASTOR1 and CASTOR2) inhibit the mammalian target of rapamycin complex 1 (mTORC1) upon arginine deprivation. mTORC1 regulates cell proliferation, survival, and metabolism and is often dysregulated in cancers, indicating that cancer cells may regulate CASTOR1 and CASTOR2 to control mTORC1 signaling and promote tumorigenesis. mTORC1 is the most effective therapeutic target of Kaposi sarcoma, which is caused by infection with the Kaposi sarcoma–associated herpesvirus (KSHV). Hence, KSHV-induced cellular transformation is a suitable model for investigating mTORC1 regulation in cancer cells. Currently, the mechanism of KSHV activation of mTORC1 in KSHV-induced cancers remains unclear. We showed that KSHV suppressed CASTOR1 and CASTOR2 expression to activate the mTORC1 pathway. CASTOR1 or CASTOR2 overexpression and mTOR inhibitors abolished cell proliferation and colony formation in soft agar of KSHV-transformed cells by attenuating mTORC1 activation. Furthermore, the KSHV-encoded miRNA miR-K4-5p, and probably miR-K1-5p, directly targeted CASTOR1 to inhibit its expression. Knockdown of miR-K1-5p and -K4-5p restored CASTOR1 expression and thereby attenuated mTORC1 activation. Overexpression of CASTOR1 or CASTOR2 and mTOR inhibitors abolished the activation of mTORC1 and growth transformation induced by pre–miR-K1 and -K4. Our results define the mechanism of KSHV activation of the mTORC1 pathway and establish the scientific basis for targeting this pathway to treat KSHV-associated cancers.
Keywords: AIDS/HIV, Virology
Keywords: Kaposi’s sarcoma, Molecular biology, Tumor suppressors
Introduction
The mammalian target of rapamycin complex 1 (mTORC1) is a central growth controller that coordinates intracellular anabolic and catabolic processes by integrating diverse environmental inputs (1). In cancer, mTORC1 is often dysregulated, resulting in abnormal cell proliferation and growth transformation (1). mTORC1 is activated in response to growth factors, stresses, energy status, and amino acids and hence functions as a downstream effector of the RTK and PI3K/AKT pathways (1). Recently, it was reported that under arginine deprivation conditions, the cytosolic arginine sensor for mTORC1 subunit 1 (CASTOR1) negatively regulates mTORC1 by interacting with and sequestering its critical positive regulator, the GATOR2 complex (2). Arginine disrupts CASTOR1-GATOR2 interaction by directly binding to CASTOR1, leading to GATOR2 dissociation and subsequent mTORC1 activation (2–4). In contrast, CASTOR2 lacks an arginine-binding capacity and is constitutively associated with GATOR2 complex, resulting in persistent mTORC1 inactivation (2). Because of the essential role of mTORC1 in cancer, we reasoned that cancer cells might manipulate CASTOR1 and/or CASTOR2 to promote growth transformation and tumorigenesis.
Kaposi sarcoma–associated herpesvirus (KSHV) is an oncogenic gammaherpesvirus etiologically associated with Kaposi sarcoma (KS), primary effusion lymphoma (PEL), multicentric Castleman’s disease (MCD), and KSHV inflammatory cytokine syndrome (KICS) (5–7). Despite intensive studies, the critical host factors required for KSHV-induced tumorigenesis remain unclear, chiefly owing to the lack of a relevant model of KSHV-induced cellular transformation and tumorigenesis. We have recently shown that KSHV can efficiently infect and transform rat primary embryonic metanephric mesenchymal (MM) precursor cells (8). KSHV-transformed MM (KMM) cells efficiently induce tumors in nude mice with virological and pathological features closely resembling those of KS, making it a robust model for studying KSHV-induced cellular transformation and tumorigenesis (8).
In KS tumors, most of the tumor cells are latently infected by KSHV, indicating the essential role of KSHV latent infection in the development of KS tumors (9). These latently infected tumor cells express only a small subset of viral genes including vFLIP (ORF71), vCyclin (ORF72), LANA (ORF73), and over 2 dozen miRNAs derived from a cluster of 12 precursor miRNAs (pre-miRNAs) called KSHV–miR-K12-1-12 (hereafter referred to as miR-K1-12) (9, 10).
miRNAs are 19- to 23-nucleotide-long small, noncoding single-stranded RNAs that usually exert their functions by binding to the 3′-UTR of their target genes to induce degradation or inhibit translation of the transcripts (11). KSHV-encoded miRNAs are highly expressed during viral latency and in KS tumors (12, 13) and play essential roles in KSHV-induced cellular transformation and tumorigenesis (14, 15). These viral miRNAs regulate numerous oncogenic pathways to control cell-cycle progression and cell survival by targeting diverse cellular genes, including IκBα, p21, TβRII, BACH1, Fos, SMAD5, DUSP1, SH3BGR, GADD45B, GRK2, and CD82 (14, 16–26). Furthermore, several KSHV miRNAs regulate viral latency by directly targeting viral genes or indirectly targeting cellular genes (19, 25, 27–30).
Numerous studies have shown activation of the mTORC1 pathway in KS tumors and KSHV-infected cells (31–34). Consistent with these observations, suppression of mTORC1 with rapamycin or similar drugs is the most effective treatment for patients with KS (35–37). Hence, KSHV-induced cellular transformation is a biologically relevant model for investigating the regulation of mTORC1 in cancer cells. Although KSHV-encoded ORF-K1, ORF45, vPK (ORF36), and vGPCR (ORF74) have been reported to activate mTORC1 (38–41), they are KSHV lytic genes that are barely expressed in KS tumor cells. Since most tumor cells are latently infected by KSHV, these viral genes are unlikely to mediate KSHV activation of the mTORC1 pathway in KS tumors. Hence, identification of KSHV latent genes and products and understanding how they activate the mTORC1 pathway in KS tumors would not only offer insight into the mechanism of KSHV-induced oncogenesis but also a scientific basis for the therapeutic targeting of mTORC1 in patients with KS. In this study, we have delineated a mechanism by which an oncogenic virus hijacks the mTORC1 pathway to drive cellular transformation. Specifically, we found that KSHV-encoded miR-K4-5p and -K1-5p activate mTORC1 by directly targeting CASTOR1, hence contributing to KSHV-induced cell proliferation and growth transformation. These findings demonstrate that CASTOR1 is a tumor-suppressive factor in KSHV-induced growth transformation.
Results
KSHV-transformed cells are sensitive to mTORC1 inhibition.
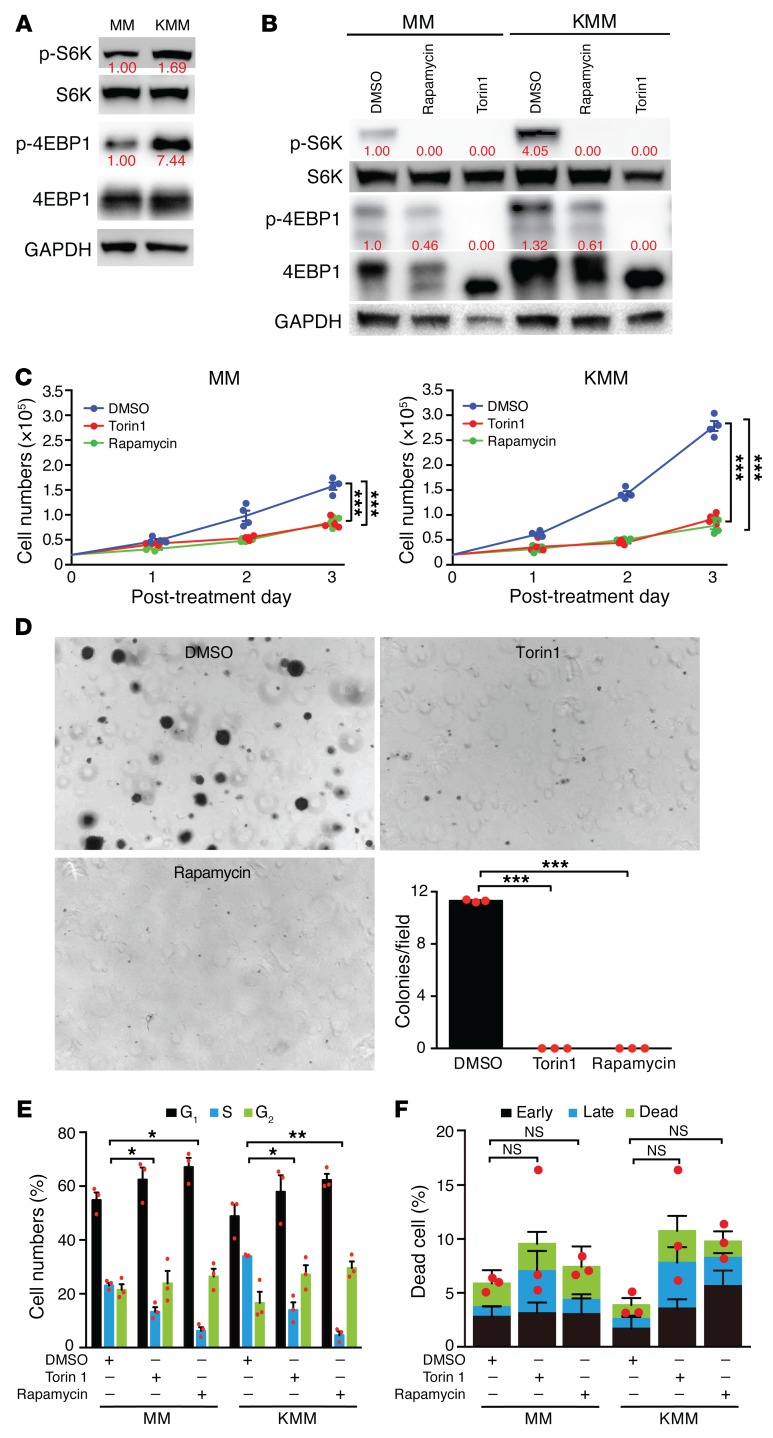
Rapamycin, a potent inhibitor of mTORC1, is the most effective therapy for patients with KS, indicating the importance of mTORC1 in KS tumors (31, 33). We examined activation of the mTORC1 pathway in KMM cells and detected the activation of 2 canonical downstream effectors of mTORC1 — S6K and 4EBP1 — in KMM cells as shown by their higher phosphorylation levels, with S6K being phosphorylated at Thr389 (p-S6K) and 4EBP1 at Ser65 (p-4EBP1), respectively, compared with the primary MM cells (Figure 1A). Thus, the mTORC1 pathway was activated in KSHV-transformed cells.
Figure 1. KSHV-transformed cells activate the mTORC1 pathway and are sensitive to mTOR inhibitors.
(A) mTORC1 was activated in KSHV-transformed cells. Cells were analyzed for p-4EBP1 at Ser65 and p-S6K at Thr389. Three independent experiments were repeated with similar results, and results of 1 representative experiment are shown. (B) Rapamycin and Torin1 inhibited mTORC1 activation in KSHV-transformed cells. Cells were treated with DMSO, 100 nm rapamycin, or 50 nm Torin1 for 16 hours and analyzed for mTORC1 activation. Three independent experiments were repeated with similar results, and results from 1 representative experiment are shown. The same set of samples were run in different gels but with the same loading calibration. (C) Rapamycin and Torin1 significantly inhibited proliferation of KSHV-transformed cells. Cells were treated with DMSO, 100 nM rapamycin, or 50 nM Torin1, and cell numbers were counted daily. Three independent experiments were repeated with similar results, and results from 1 representative experiment with 4 biological replicates are shown as the mean ± SEM. (D) Rapamycin and Torin1 significantly inhibited colony formation of KMM cells in soft agar. KMM cells treated with DMSO, 200 nM rapamycin, or 100 nM Torin1 were examined for colony formation in soft agar. Representative images acquired with a ×4 objective are shown. Graph shows the quantification of colonies with a diameter of greater than 50 μm. Three independent experiments were repeated, and results are shown as the mean ± SEM. (E and F) Rapamycin and Torin1 induced cell-cycle arrest but no significant apoptosis in MM and KMM cells. Cells were treated with DMSO, 100 nM rapamycin, or 50 nM Torin1 for 24 hours and analyzed for (E) cell-cycle progression or (F) apoptosis. Three independent experiments were repeated, and results are shown as the mean ± SEM. Data were analyzed by 1-way ANOVA followed by Tukey’s post hoc test for P values below 0.05. *P < 0.05, **P < 0.01, and ***P < 0.001.
We next determined whether KSHV-transformed cells were sensitive to mTOR inhibition by treating them with the mTOR inhibitors rapamycin and Torin1. Both mTOR inhibitors effectively decreased the levels of p-S6K and p-4EBP1 in KSHV-transformed cells (Figure 1B). Furthermore, inhibition of mTORC1 significantly reduced the proliferation and efficiency of colony formation in soft agar of KSHV-transformed cells (Figure 1, C and D). The mTOR inhibitors also reduced the proliferation of MM cells, but the inhibitory effect was much weaker than that seen in KMM cells (Figure 1C), indicating that KSHV-transformed cells were more addicted to the mTORC1 pathway. Furthermore, Torin1 and rapamycin induced cell-cycle arrest but no significant apoptosis in both MM and KMM cells (Figure 1, E and F). These results indicate that the status of the mTOR pathway and the response of KMM cells to mTOR inhibitors resemble those observed in KS tumors in the clinics (31–33). Therefore, the KMM model can be used to delineate the mechanism of KSHV-induced activation of the mTORC1 pathway.
KSHV latent infection activates mTORC1 by downregulating CASTOR1 and CASTOR2.
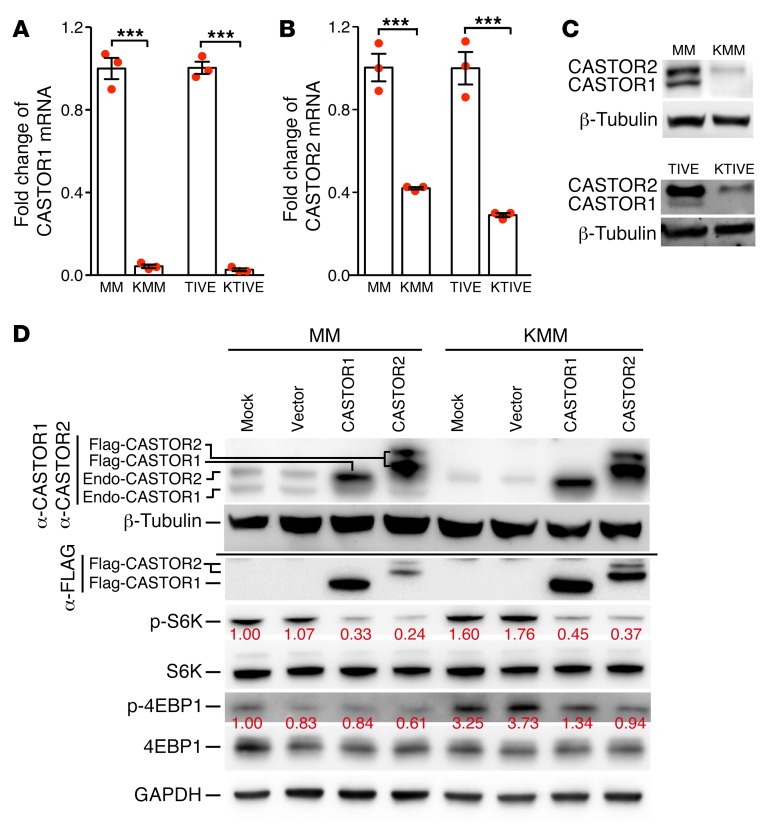
Previous studies have shown that CASTORs are negative regulators of the mTORC1 pathway upon arginine deprivation (2–4). We examined whether CASTORs might be downregulated in KSHV-transformed cells. Compared with MM cells, CASTOR1 and CASTOR2 transcripts were downregulated by 10- and 2.5-fold in KMM cells, respectively (Figure 2, A and B). To confirm these results, we examined telomerase-immortalized human umbilical vein endothelial (TIVE) cells latently infected by KSHV (KTIVE). Compared with the uninfected TIVE cells, CASTOR1 and CASTOR2 transcripts were downregulated in KTIVE by 30- and 4-fold, respectively (Figure 2, A and B). These results were further confirmed at the protein level (Figure 2C). Hence, latent KSHV infection downregulated the expression of CASTOR1 and CASTOR2. Because TIVE cells were already immortalized before KSHV infection, we chose to focus on MM cells.
Figure 2. Latent KSHV infection activates mTORC1 by downregulating CASTOR1 and CASTOR2.
(A–C) Latent KSHV infection downregulated CASTOR1 and CASTOR2 examined at the (A and B) mRNA level by RT-qPCR and (C) protein level by Western blotting. Three independent experiments were repeated with similar results, and results from 1 representative experiment are shown. mRNA results from 3 biological replicates are shown in A and B as the mean ± SEM. (C) For Western blot analysis, the same set of samples were run in different gels but with the same loading calibration. (D) Overexpression of CASTOR1 or CASTOR2 suppressed mTORC1 activation. Western blot analysis of CASTOR1 and CASTOR2 proteins with an anti-Flag antibody and an antibody that detected endogenous CASTOR1 and CASTOR2 proteins and the mTORC1 downstream effectors p-S6K and p-4EBP1 in untransduced MM and KMM cells, and MM and KMM cells transduced with vector control, CASTOR1, or CASTOR2. α, anti. Three independent experiments were repeated with similar results, and results from 1 representative experiment are shown. P values were calculated using an unpaired, 2-tailed Student’s t test. ***P < 0.001.
To determine whether KSHV-induced downregulation of CASTOR1 or CASTOR2 was the cause of mTORC1 activation, we overexpressed CASTOR1 or CASTOR2 in KMM cells. Overexpression of either CASTOR1 or CASTOR2 was sufficient to reduce the levels of p-S6K1 and p-4EBP1 in KMM cells (Figure 2D). Interestingly, the levels of p-S6K were also reduced in MM cells following overexpression of either CASTOR1 or CASTOR2 (Figure 2D), confirming the essential roles of CASTORs in regulating mTORC1 function in normal cells. Together, these results indicate that CASTORs mediate KSHV activation of mTORC1 in KSHV-transformed cells.
KSHV-encoded miR-K1 and -K4 mediate KSHV activation of mTORC1 by inhibiting CASTOR1 expression.
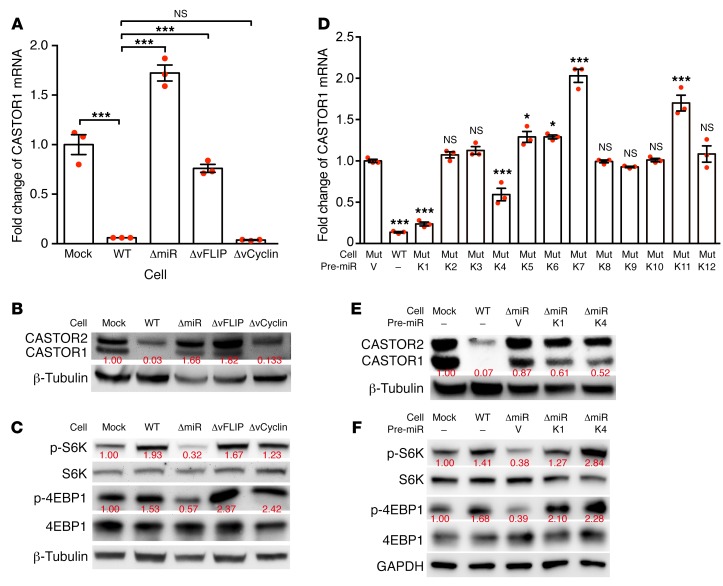
We focused on identifying the mechanism of KSHV downregulation of CASTOR1, since the extent of its downregulation was much more robust than that of CASTOR2. During KSHV latency, only a few viral products are expressed, including vFLIP, vCyclin, LANA and a cluster of 12 pre-miRNAs. To identify the viral products that downregulate CASTOR1, we generated MM cells latently infected by an individual KSHV mutant with a deletion of either vFLIP, vCyclin, or a cluster of 10 of the 12 pre-miRNAs (miR-K1–K9 and miR-K11). The expression levels of CASTOR1 in these cells named ΔvFLIP, ΔvCyclin, and ΔmiR, respectively, were compared with those of uninfected cells (MM or mock) or with cells infected by WT KSHV (KMM or WT). Because of the essential role of LANA in maintaining viral persistence (42), we were not able to obtain cells stably infected by a KSHV mutant containing a deletion of LANA. Deletion of either vFLIP or the miRNA cluster restored CASTOR1 expression to almost the same level as that in the uninfected MM cells, whereas deletion of vCyclin had no effect (Figure 3, A and B). These results indicated that both the miRNA cluster and vFLIP were required for suppression of CASTOR1 expression. To confirm these results, we examined mTORC1 activation in these mutant cells. Although deletion of the miRNA cluster significantly attenuated the mTORC1 pathway, as shown by the decreased p-S6K and p-4EBP1 levels, neither deletion of vFLIP nor vCyclin had any effect on mTORC1 activation (Figure 3C). These contradictory results between CASTOR1 expression and mTORC1 activation in ΔvFLIP-mutant cells suggested that an alternative mechanism in addition to CASTOR1 expression might be involved in vFLIP regulation of mTORC1 activation. Because the miRNA cluster mutant exhibited the most consistent results of CASTOR1 expression and mTORC1 activation, we subsequently focused on the miRNA cluster.
Figure 3. Pre–miR-K1 and -K4 mediate KSHV downregulation of CASTOR1 and activation of mTORC1.
(A and B) The miRNA cluster and vFLIP mediated KSHV downregulation of CASTOR1. Analysis of CASTOR1 mRNA levels by RT-qPCR (A) and protein levels by Western blotting (B) in mock (MM), WT (KMM), ΔmiR, ΔvFLIP, and ΔvCyclin, cells. Three independent experiments were repeated with similar results, and results from 1 representative experiment are shown. mRNA results from 3 biological replicates are shown as the mean ± SEM. (C) The miRNA cluster mediated KSHV activation of the mTORC1 pathway. Analysis of the mTORC1 downstream effectors p-S6K and p-4EBP1 in mock, WT, ΔmiR, ΔvFLIP, and ΔvCyclin cells by Western blotting. Three independent experiments were repeated with similar results, and results from 1 representative experiment are shown. The same set of samples were run in different gels but with the same loading calibration. (D and E) Pre–miR-K1 and -K4 mediated KSHV downregulation of CASTOR1. Analysis of CASTOR1 mRNA (D) and protein (E) levels in WT cells and ΔmiR cells complemented with vector control or individual KSHV pre-miRNAs. mRNA results in D were from 3 biological replicates and are shown as the mean ± SEM. Three independent experiments were repeated with similar results, and results from 1 representative experiment are shown. Mut, mutant. (F) Pre–miR-K1 and -K4 mediate mTORC1 activation. Western blot analysis of the mTORC1 downstream effectors p-S6K and p-4EBP1 in mock and WT cells and ΔmiR cells complemented with vector control (V) or pre–miR-K1 or -K4. Three independent experiments were repeated with similar results, and results from 1 representative experiment are shown. Data were analyzed by 1-way ANOVA followed by Tukey’s post hoc test for P values below 0.05. *P < 0.05 and ***P < 0.001.
Previous studies have shown that KSHV miRNAs are highly expressed in KS tumors and are required for KSHV-induced tumorigenesis (12–15). Deletion of the miRNA cluster abolished KSHV-induced cellular transformation and tumorigenesis (14). However, expression of numerous individual KSHV pre-miRNAs was sufficient to restore KSHV-induced cellular transformation and tumorigenesis, with pre–miR-K1, -K4, and -K11 exerting the strongest oncogenic effects (14). These cells, termed ΔmiR-pre-K1, -K4, and -K11, formed large colonies in soft agar and induced tumors in nude mice as efficiently as did the WT KMM cells. We examined CASTOR1 expression in ΔmiR cells expressing individual KSHV pre-miRNAs. Among all the pre-miRNAs examined, expression of either pre–miR-K1 or -K4 alone in ΔmiR cells significantly inhibited the expression of CASTOR1 transcripts (Figure 3D), which was confirmed at the protein level (Figure 3E). In agreement with these results, we detected higher p-S6K and p-4EBP1 levels in both ΔmiR-pre-K1 and -K4 cells than in ΔmiR cells, indicating activation of mTORC1 by pre–miR-K1 and -K4 (Figure 3F).
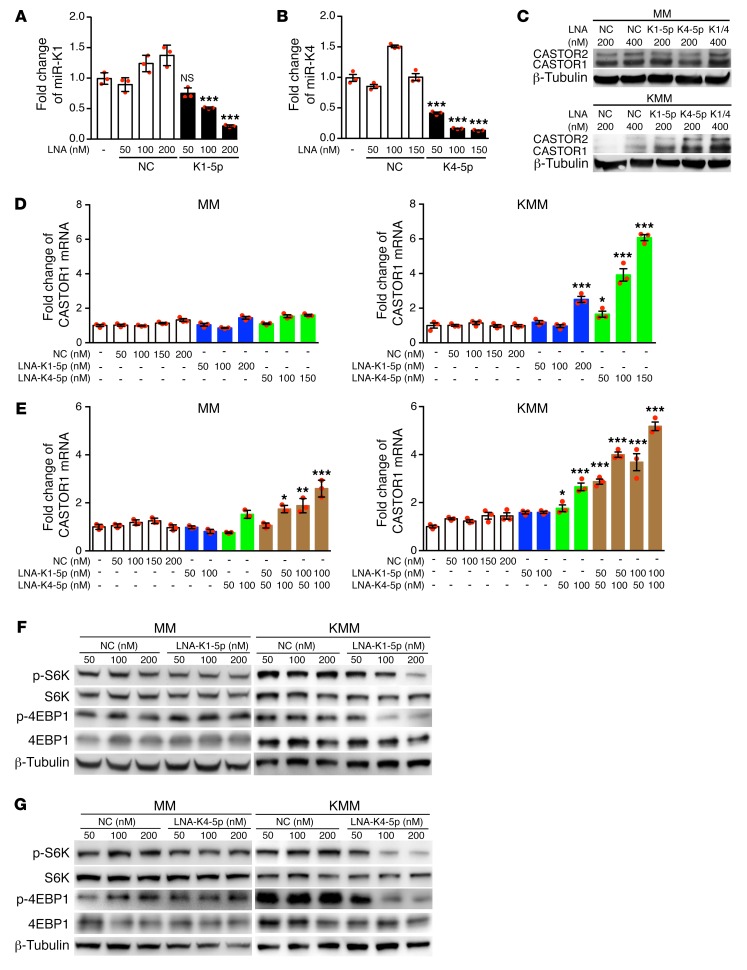
To confirm the above results, we first performed knockdown of miR-K1-5p and -K4-5p, derived from pre–miR-K1 and -K4, using different doses of locked nucleic acid–based (LNA-based) suppressors (Figure 4, A and B). Knockdown of miR-K1-5p and -K4-5p significantly increased CASTOR1 expression in a dose-dependent manner at both mRNA and protein levels in KMM but not MM cells (Figure 4, C–E). Additionally, simultaneous knockdown of both miR-K1-5p and -K4-5p in KMM cells additively increased CASTOR1 expression (Figure 4, C and E), indicating that both miRNAs worked synergistically to suppress CASTOR1 expression. Furthermore, knockdown of either miR-K1-5p or -K4-5p suppressed mTORC1 activation as shown by the decrease in p-S6K and p-4EBP1 levels (Figure 4, F and G). These results indicate that both miR-K1-5p and -K4-5p activate mTORC1 by inhibiting CASTOR1 expression.
Figure 4. KSHV miR-K1-5p and -K4-5p inhibit CASTOR1 expression and activate mTORC1.
miRNA suppressors reduced the level of miR-K1-5p (A) and -K4-5p (B) in KSHV-transformed cells. RT-qPCR examination of miR-K1-5p (A) and miR-K4-5p (B) in untransfected cells or in KMM cells transfected with a LNA-based scrambled control (NC), miRNA suppressor LNA-K1-5p (A), or LNA-K4-5p (B). Three independent experiments were repeated with similar results, and results from 1 representative experiment with 3 biological replicates are shown as the mean ± SEM. (C and D) Knockdown of either miR-K1-5p or -K4-5p increased CASTOR1 expression in KMM but not MM cells. Untransfected cells or cells transfected with different concentrations of LNA-based NC, LNA-K1-5p, or LNA-K4-5p were examined for CASTOR1 protein (C) and mRNA (D) levels. Three independent experiments were repeated with similar results, and results from 1 representative experiment are shown. mRNA results from 3 biological replicates in D are shown as the mean ± SEM. (E) Knockdown of miR-K1-5p and -K4-5p additively increased CASTOR1 mRNA levels. Untransfected cells or cells transfected with different concentrations of LNA-based NC, LNA-K1-5p, LNA-K4-5p, or LNA-K1-5p plus LNA-K4-5p were examined for CASTOR1 mRNA expression. Three independent experiments were repeated with similar results, and results from 1 representative experiment with 3 biological replicates are shown as the mean ± SEM. Knockdown of miR-K1-5p (F) or -K4-5p (G) inhibited mTORC1 activation in KMM cells but not MM cells. Cells transfected with LNA-based NC or LNA-K1-5p (F) or LNA-K4-5p (G) were examined for p-S6K and p-4EBP1 by Western blotting. Three independent experiments were repeated with similar results, and results from 1 representative experiment are shown. For the Western blot analysis of KMM cells in G, the same set of samples were run in different gels but with the same loading calibration. Data were analyzed by 1-way ANOVA followed by Tukey’s post hoc test for P values below 0.05. *P < 0.05, **P < 0.01, and ***P < 0.001.
CASTOR1 is directly targeted by miR-K4-5p and possibly miR-K1-5p.
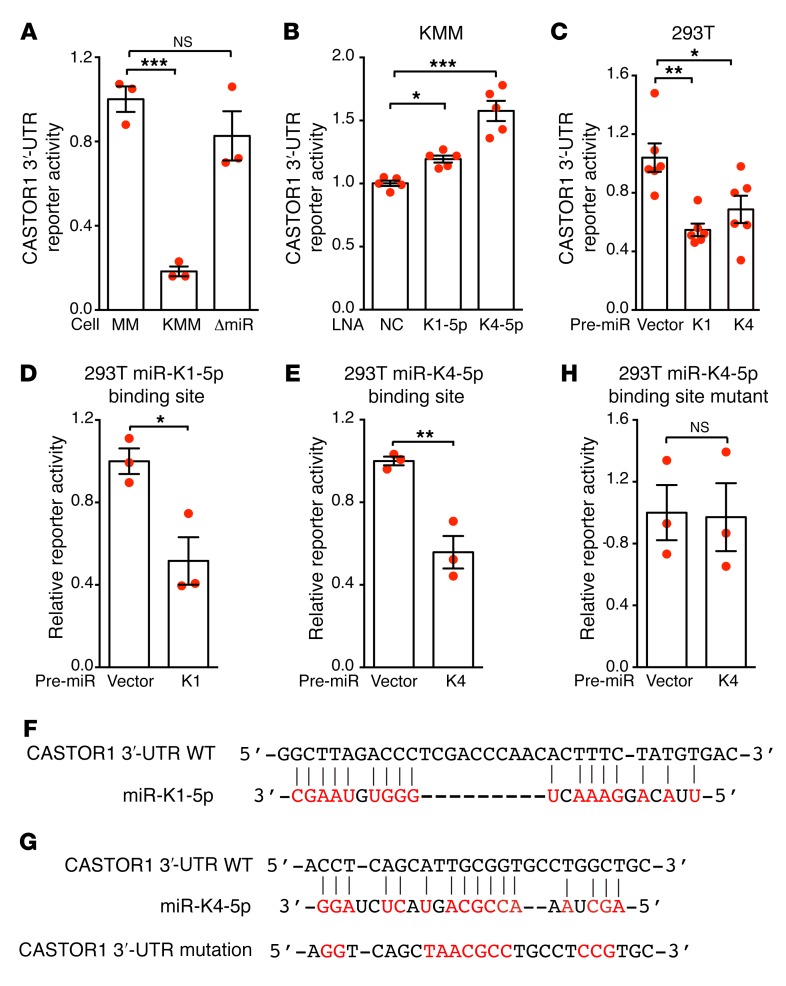
miRNAs induce the degradation of transcripts or inhibit the translation of proteins by directly binding to their target genes. To explore whether CASTOR1 is a direct target of miR-K1-5p and -K4-5p, we cloned the full-length 3′-UTR of CASTOR1 into the pGL3-control plasmid downstream of the luciferase gene (named pGL3-CASTOR1 3′-UTR). We detected pGL3-CASTOR1 3′-UTR luciferase reporter activity in MM, KMM, and ΔmiR-mutant cells. However, the activity was significantly reduced in KMM cells compared with MM and ΔmiR-mutant cells (Figure 5A), indicating that KSHV-encoded miRNAs might directly target the CASTOR1 3′-UTR. Accordingly, knockdown of either miR-K1-5p or -K4-5p in KMM cells significantly increased the luciferase reporter activity (Figure 5B), whereas expression of either pre–miR-K1 or -K4 decreased the CASTOR1 3′-UTR but not the pGL3-control construct reporter activity in 293T cells (Figure 5C). Further deletion analysis identified 35-bp and 26-bp fragments in the CASTOR1 3′-UTR that were targeted by miR-K1-5p and -K4-5p, respectively. Overexpression of pre–miR-K1 significantly reduced the luciferase activity of a reporter containing the 35-bp fragment in 293T cells (Figure 5D). Similarly, overexpression of pre–miR-K4 significantly reduced the luciferase activity of a reporter containing the 26-bp fragment in 293T cells (Figure 5E). Bioinformatics analysis identified a putative miR-K1-5p binding site in the 35-bp fragment (Figure 5F) and a putative miR-K4-5p binding site in the 26-bp fragment (Figure 5G), respectively. However, we were not able to confirm the miR-K1-5p binding site by mutagenesis analysis (results not shown). It is entirely possible that miR-K1-5p indirectly regulates the expression of CASTOR1. In contrast, mutation of the putative miR-K4-5p binding site in the 26-bp fragment abolished the inhibitory effect of miR-K4-5p on the CASTOR1 3′-UTR reporter in 293T cells (Figure 5H), thus confirming that miR-K4-5p bound to this site to suppress CASTOR1 expression. Nevertheless, the identified miR-K4-5p seed sequence is noncanonical. This mechanism of action has been reported for miRNAs, including KSHV miRNAs (19, 43). Collectively, these results indicate that CASTOR1 is a direct target of KSHV-encoded miR-K4-5p and possibly an indirect target of miR-K1-5p.
Figure 5. CASTOR1 transcript is directly targeted by miR-K4-5p and probably -K1-5p.
(A) Deletion of the miRNA cluster relieved KSHV suppression of the CASTOR1 3′-UTR. Reporter activity was examined in mock (MM), WT (KMM), and ΔmiR-mutant cells transfected with pGL3-CASTOR1 3′-UTR and pRL-TK–expressing Renilla luciferase for normalization. (B) Knockdown of miR-K1-5p or -K4-5p increased CASTOR1 3′-UTR activity in KMM cells. Cells transfected with pGL3-CASTOR1 3′-UTR and the miRNA suppressor LNA-K1-5p, LNA-K4-5p, or scrambled control (NC) were examined. (C) Pre–miR-K1 or -K4 inhibited the CASTOR1 3′-UTR. 293T cells were transfected with pGL3-CASTOR1 3′-UTR and pre–miR-K1 or -K4 plasmid or vector control, and reporter activity was assessed. (D) Pre–miR-K1 suppressed a reporter containing a 35-bp fragment from the CASTOR1 3′-UTR. 293T cells were transfected with a reporter containing a 35-bp fragment from the CASTOR1 3′-UTR and pre–miR-K1 plasmid or vector control, and the reporter activity was examined. (E) Pre–miR-K4 suppressed a reporter containing a 26-bp fragment from the CASTOR1 3′-UTR. 293T cells were transfected with a reporter containing a 26-bp fragment from the CASTOR1 3′-UTR and pre–miR-K4 plasmid or vector control, and the reporter activity was assessed. (F) Putative targeting sequence of miR-K1-5p in the CASTOR1 3′-UTR. (G) Putative targeting sequence of miR-K4-5p in the CASTOR1 3′-UTR and mutagenesis of the putative binding site. (H) Mutation of the miR-K4-5p binding site in the CASTOR1 3′-UTR fragment abolished reporter suppression by miR-K4-5p. 293T cells were transfected with a mutated reporter plasmid and pre–miR-K4 plasmid or vector control, and the reporter activity was examined. All experiments were independently repeated 3 times with similar results, and results from 1 representative experiment with at least 3 biological replicates are shown as the mean ± SEM. Data for 2 groups were analyzed by 2-tailed Student’s t test. Data for more than 2 groups were analyzed by 1-way ANOVA followed by Tukey’s post hoc test for P values of less than 0.05. *P < 0.05, **P < 0.01, and ***P < 0.001.
CASTOR1 and CASTOR2 inhibit KSHV-induced cell proliferation and growth transformation.
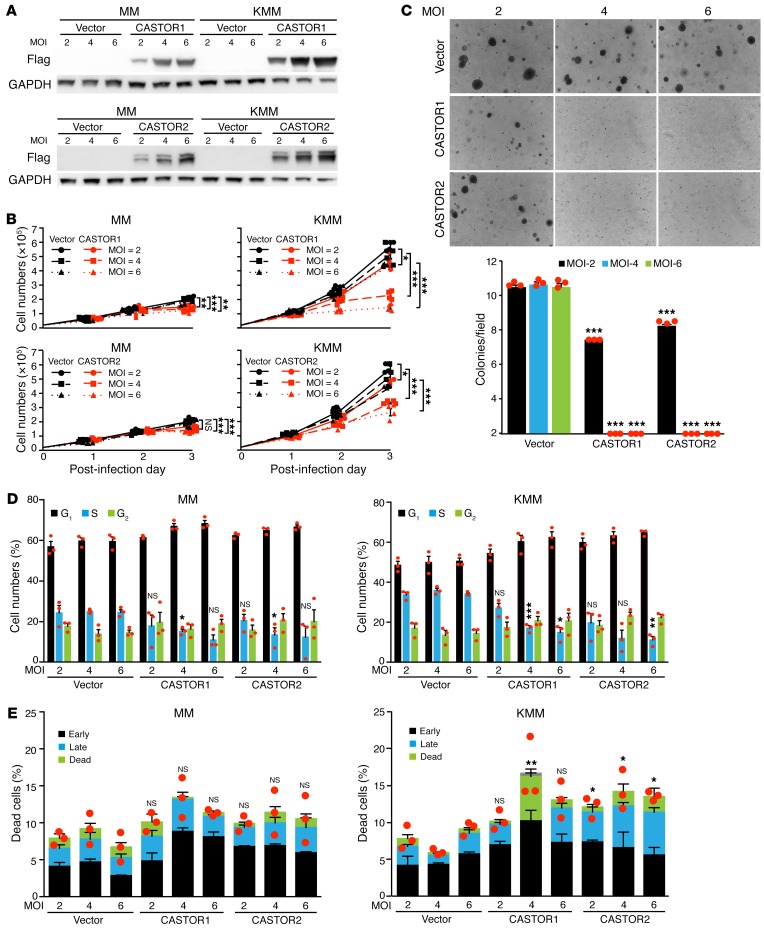
mTORC1 is dysregulated in diverse types of cancer and is a prime target in cancer therapy (1). Since CASTOR1 and CASTOR2 are downregulated and negatively regulate mTORC1 in KSHV-transformed cells, they might restrict the proliferation and growth transformation of KSHV-transformed cells. We infected MM and KMM cells with a lentivirus expressing Flag-tagged CASTOR1 or CASTOR2 at different MOI (Figure 6A). As expected, we observed significant inhibitory effects on the proliferation of KMM cells in a dose-dependent manner in response to the transduction of CASTORs, with CASTOR1 showing greater inhibitory efficiency than CASTOR2 (Figure 6B). At a MOI of 2, 4, and 6, CASTOR1 reduced cell proliferation by 24%, 67%, and 80%, respectively, whereas CASTOR2 reduced cell proliferation by 21%, 32%, and 59%, respectively (Figure 6B). In contrast, transduction of either CASTOR1 or CASTOR2 only had a marginally suppressive effect on the proliferation of MM cells (Figure 6B). Furthermore, transduction of either CASTOR1 or CASTOR2 at a MOI of 2 was sufficient to significantly reduce the efficiency of colony formation in soft agar, whereas a MOI of 4 or 6 almost completely abolished colony formation in soft agar of KSHV-transformed cells (Figure 6C). In agreement with these results, both CASTOR1 and CASTOR2 induced cell-cycle arrest of KMM cells but had a more marginal effect on cell-cycle progression of MM cells (Figure 6D). Transduction of either CASTOR1 or CASTOR2 also weakly increased the number of apoptotic or dead cells in KMM cells but not in MM cells (Figure 6E). Taken together, we conclude that CASTOR1 and CASTOR2 are tumor-suppressive genes for growth transformation of KSHV-transformed cells and that their downregulation by KSHV is critical for maintaining the growth transformation of these cells.
Figure 6. CASTOR1 and CASTOR2 inhibit proliferation and cellular transformation of KSHV-transformed cells.
(A) Dose-dependent expression of CASTOR1 and CASTOR2 in MM and KMM cells. Western blot analysis of CASTOR1 and CASTOR2 in MM and KMM cells transduced with increasing doses of lentiviruses of CASTOR1, CASTOR2, or vector control at 2, 4, or 6 MOI. Three independent experiments were repeated with similar results, and results from 1 representative experiment are shown. (B and C) Overexpression of either CASTOR1 or CASTOR2 impaired the proliferation and cellular transformation of KMM but not MM cells. MM and KMM cells transduced with different MOI of lentiviruses of CASTOR1, CASTOR2, or vector control, as described in A, were assessed for cell proliferation (B) and colony formation in soft agar (C). Representative images acquired with a x4 objective are shown. Graph shows the quantification of colonies with a diameter of greater than 50 μm. Three independent experiments were repeated with similar results, and results from 1 representative experiment with 4 biological replicates (B) or 3 combined experiments (C) are shown as the mean ± SEM. (D and E) Overexpression of either CASTOR1 or CASTOR2 induced cell-cycle arrest in KMM cells but had a weak effect on MM cells and weak apoptosis in KMM but not MM cells. MM and KMM cells transduced with increasing doses of lentiviruses of CASTOR1, CASTOR2, or a vector control at 2, 4, or 6 MOI for 48 hours were examined for cell-cycle progression (D) and apoptosis (E). Three independent experiments were repeated with similar results, and results from 1 representative experiment with 3 biological replicates are shown as the mean ± SEM. Data were analyzed by 1-way ANOVA followed by Tukey’s post hoc test for P values below 0.05. *P < 0.05, **P < 0.01, and ***P < 0.001.
CASTOR1 and CASTOR2 override KSHV pre–miR-K1 and -K4–induced cell proliferation and growth transformation.
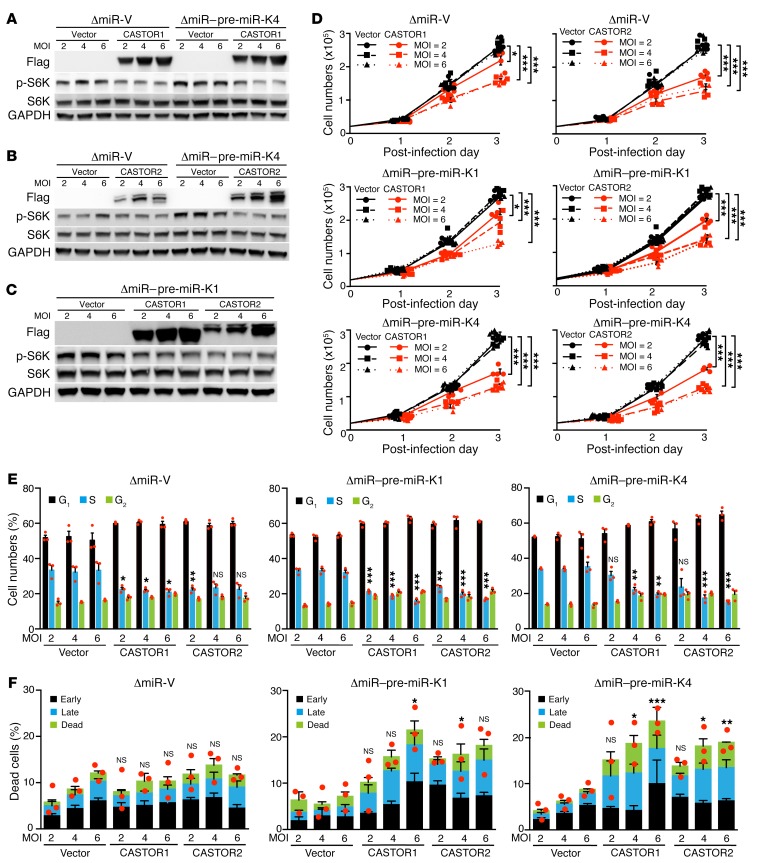
We have previously reported that KSHV pre–miR-K1 and -K4 are essential for KSHV-induced growth transformation (14). Whereas deletion of the miRNA cluster abolished KSHV-induced growth transformation and tumorigenesis, complementation of ΔmiR-mutant cells with either pre–miR-K1 or -K4 was sufficient to restore KSHV-induced growth transformation and tumorigenesis (14). To determine whether activation of the mTORC1 pathway by targeting CASTORs was essential for the pro-oncogenic effects of pre–miR-K1 and -K4, we infected pre–miR-K1– or -K4–complemented ΔmiR-mutant cells with a lentivirus expressing either CASTOR1 or CASTOR2 at different MOI (Figure 7, A–C). Although complementation of ΔmiR-mutant cells with either pre–miR-K1 or -K4 was sufficient for activation of the mTORC1 pathway, transduction of either CASTOR1 or CASTOR2 suppressed the activation of the mTORC1 pathway (Figure 7, A–C). In agreement with the observation of mTORC1 pathway suppression, both CASTOR1 and CASTOR2 inhibited cell proliferation induced by pre–miR-K1 or -K4 (Figure 7D). Furthermore, transduction of either CASTOR1 or CASTOR2 induced cell-cycle arrest (Figure 7E) and weakly increased the numbers of apoptotic and dead cells in pre–miR-K1– and -K4–complemented ΔmiR-mutant cells (Figure 7F). Collectively, these results demonstrate that CASTOR1 and CASTOR2 antagonize the oncogenic effects of pre–miR-K1 and -K4 and that targeting CASTOR1 by both miR-K1-5p and -K4-5p is essential for the pro-oncogenic functions of these 2 viral miRNAs, which are essential for KSHV-induced growth transformation.
Figure 7. CASTOR1 and CASTOR2 inhibit pre–miR-K1 and -K4–induced cell proliferation.
(A–C) CASTOR1 and CASTOR2 inhibited pre–miR-K1 and -K4–induced mTORC1 activation. ΔmiR-mutant cells stably expressing vector control (ΔmiR-V) or pre–miR-K4 (ΔmiR–pre–miR-K4 in A and B) or pre–miR-K1 (ΔmiR–pre–miR-K1 in C) were transduced with increasing doses of lentiviruses of CASTOR1, CASTOR2, or vector control at 2, 4, or 6 MOI for 48 hours and examined by Western blotting for expression of the mTORC1 downstream effectors p-S6K and p-4EBP1. Three independent experiments were repeated with similar results, and results from one representative experiment were shown. (D) CASTOR1 and CASTOR2 inhibited pre–miR-K4 and -K4–induced cell proliferation. ΔmiR-mutant cells stably expressing a vector control (ΔmiR-V), pre–miR-K4 (ΔmiR–pre–miR-K4) or pre–miR-K1 (ΔmiR–pre–miR-K1) were transduced with increasing doses of lentiviruses of CASTOR1, CASTOR2, or vector control at 2, 4, or 6 MOI for 48 hours and examined for cell proliferation. Three independent experiments were repeated with similar results, and results from 1 representative experiment with 4 biological replicates are shown as the mean ± SEM. (E and F) CASTOR1 and CASTOR2 inhibited pre–miR-K4 and -K4–induced cell-cycle progression and induced weak apoptosis. ΔmiR-mutant cells stably expressing vector control (ΔmiR-V), pre–miR-K4 (ΔmiR–pre-miR-K4) or pre–miR-K1 (ΔmiR–pre–miR-K1) were transduced with increasing doses of lentiviruses of CASTOR1, CASTOR2, or vector control at 2, 4, or 6 MOI for 48 hours and examined for cell-cycle progression (E) and apoptosis (F). Three independent experiments were repeated with similar results, and results from 1 representative experiment with 3 biological replicates are shown as the mean ± SEM. Data were analyzed by 1-way ANOVA followed by Tukey’s post hoc test for P values below 0.05. *P < 0.05, **P < 0.01, and ***P < 0.001.
mTOR inhibitors suppress KSHV pre–miR-K1 and -K4–induced cell proliferation and growth transformation.
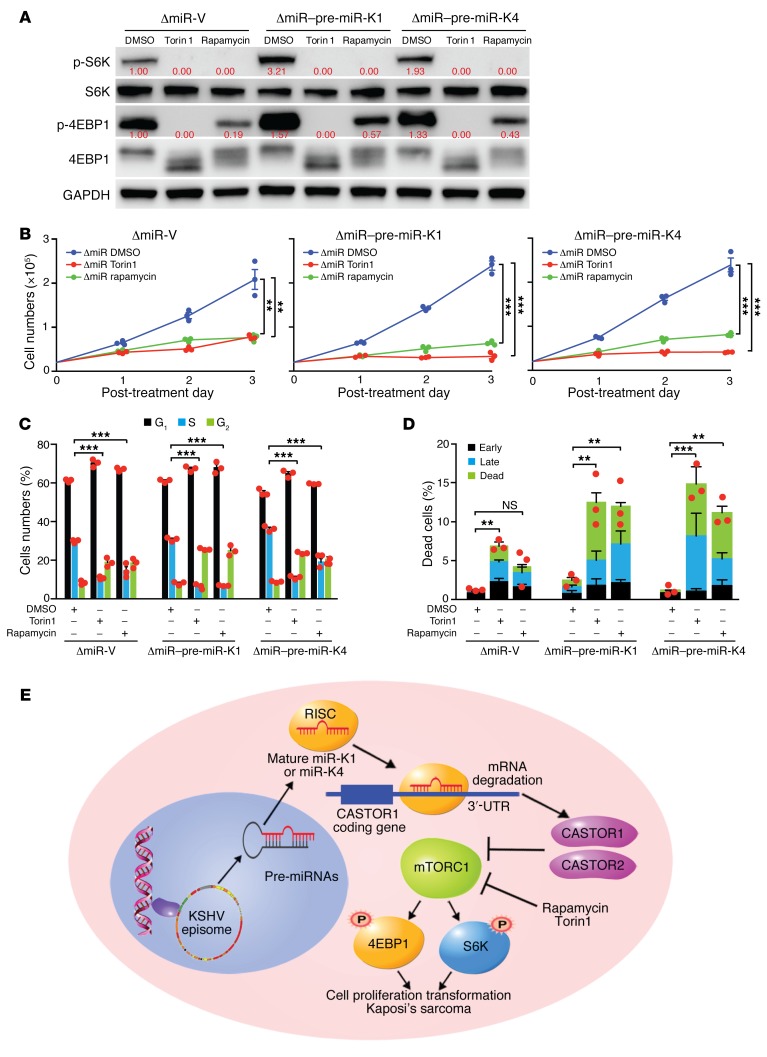
Since our results showed that CASTOR1 and CASTOR2 inhibited growth transformation induced by pre–miR-K1 and -K4 by suppressing the mTORC1 pathway, we further investigated whether the mTOR inhibitors rapamycin and Torin1 could mimic the effects of CASTORs. Both rapamycin and Torin1 efficiently inhibited the activation of mTORC1 induced by pre–miR-K1 or -K4 alone in ΔmiR-mutant cells complemented with pre–miR-K1 or -K4, as shown by the decrease in p-S6K and p-4EBP1 levels (Figure 8A). Consistent with mTORC1 inhibition, rapamycin and Torin1 significantly reduced pre–miR-K1– and -K4–induced cell proliferation (Figure 8B). Furthermore, mTOR inhibitors induced cell-cycle arrest in vector as well as pre–miR-K1– and -K4–complemented ΔmiR-mutant cells (Figure 8C). Both mTOR inhibitors increased the numbers of apoptotic and dead cells in pre–miR-K1– and -K4–complemented ΔmiR cells. However, only Torin1, and not rapamycin, increased the numbers of apoptotic and dead cells in vector-complemented ΔmiR-mutant cells (Figure 8D). Together, these results confirmed that pre–miR-K1 and -K4–induced cell proliferation could be reversed by mTORC1 inhibition.
Figure 8. mTOR inhibitors suppress pre–miR-K1 and -K4–induced cell proliferation.
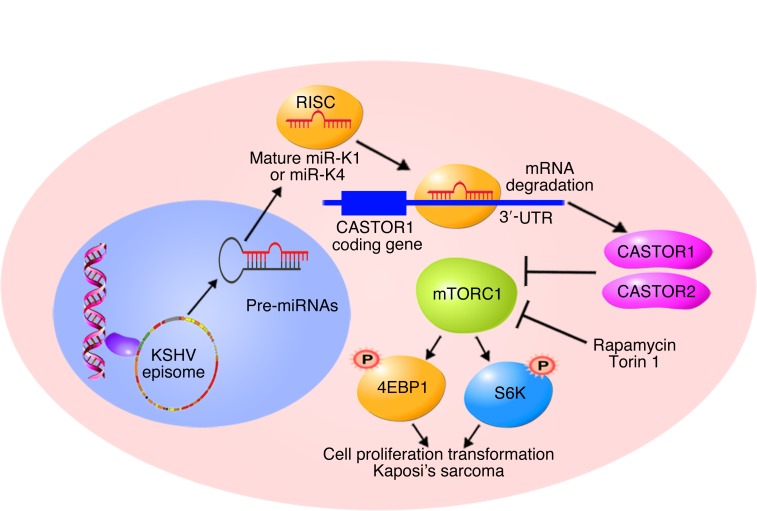
(A) The mTOR inhibitors rapamycin and Torin1 inhibited mTORC1 activation in ΔmiR-V, ΔmiR–pre–miR-K1, and ΔmiR–pre–miR-K4 cells. Cells were treated with DMSO, 200 nM rapamycin, or 50 nM Torin1 for 4 hours and analyzed for mTORC1 activation by examining expression of the downstream effectors p-S6K and p-4EBP1 by Western blotting. Results from 1 experiment are shown. (B) Rapamycin and Torin1 significantly inhibited pre–miR-K4 and -K4–induced cell proliferation. ΔmiR-mutant cells stably expressing vector control (ΔmiR-V), pre–miR-K4 (ΔmiR–pre–miR-K4), or pre–miR-K1 (ΔmiR–pre–miR-K1) were treated with DMSO, 100 nM rapamycin, or 50 nM Torin1, and cell numbers were counted daily. Three independent experiments were repeated with similar results, and results from 1 representative experiment with 3 biological replicates are shown as the mean ± SEM. (C and D) Rapamycin and Torin1 inhibit pre–miR-K4 and -K4-induced cell-cycle progression and induce apoptosis. ΔmiR-mutant cells stably expressing vector control (ΔmiR-V), pre–miR-K4 (ΔmiR-pre-K4) or pre–miR-K1 (ΔmiR-pre-K1) were treated with DMSO, 100 nM rapamycin or 50 nM Torin1 for 24 hours, and analyzed for cell-cycle progression (C) and apoptosis (D). Three independent experiments were repeated with similar results, and results from 1 representative experiment with 3 biological replicates are shown as the mean ± SEM. (E) Schematic illustration of KSHV miR-K4-5p and possibly miR-K1-5p direct suppression of CASTOR1, leading to activation of the mTORC1 pathway, enhanced cell proliferation, and cellular transformation. Data in B–D were analyzed by 1-way ANOVA followed by Tukey’s post hoc test for P values below 0.05. **P < 0.01 and ***P < 0.001.
Discussion
Although the mTORC1 complex is well conserved from prokaryotes to eukaryotes, it is hyperactivated and functions as a downstream effector of many oncogenic signaling pathways such those for PI3K/AKT and MAPK in diverse types of human cancer (1). Up to 95.7% of KS tumors showed strong staining for p-S6K, indicating robust mTORC1 activation in these tumors (32). Numerous reports have revealed that the mTOR inhibitor rapamycin and similar inhibitors are the most effective and tolerable therapeutic agents for KSHV-induced cancers (35, 44). Consistent with the results of clinical studies, we have shown that mTOR inhibitors are effective in inhibiting the proliferation and cellular transformation of KSHV-transformed cells and have minimal toxicity in normal cells (Figure 1, C–D). Previous studies have identified several KSHV genes, including vGPCR, vPK, ORF-K1, and ORF45, that activate mTORC1 (38, 40, 41, 45). However, all of them are viral lytic genes, which are barely expressed during latency or in KS tumors. Since most KS tumor cells are latently infected by KSHV (9), activation of the mTOR pathway is probably mediated by KSHV latent products. Hence, the underlying mechanism of mTOR pathway activation in KS and PEL remains unclear.
Numerous proteins such as sestrin1, sestrin2, SLC39A9, and SMATOR are found to negatively regulate mTORC1 activation in response to nutrition status (46). CASTOR1 and CASTOR2 are newly discovered suppressors of mTORC1, but their roles in cancer cells remain unclear (2–4). In this study, we report for the first time to our knowledge that CASTOR1 has a suppressive role in cell proliferation and cellular transformation. We show that KSHV-encoded miR-K4-5p and possibly miR-K1-5p activate mTORC1 by directly targeting CASTOR1, which facilitates KSHV-induced cell proliferation and cellular transformation.
CASTOR1 was originally described as an arginine sensor, because it regulates mTORC1 activity in response to arginine concentration (2–4). Because the tumor microenvironment is often deprived of nutrition including arginine, CASTOR1 is expected to be active in tumor cells. Hence, we speculate that tumor cells are expected to evolve mechanisms to inhibit CASTOR1 in order to facilitate anabolic proliferation. In this study, we observed that overexpression of either CASTOR1 or CASTOR2 dramatically inhibited the mTORC1 pathway even in replete medium, leading to decreased cell proliferation in KSHV-transformed cells. These results suggest that either the intracellular arginine concentration of KSHV-transformed cells is below the threshold required to interrupt CASTOR1-GATOR2 interaction, or there is an alternative mechanism by which CASTOR1 regulates the mTORC1 pathway. In fact, a high level of CASTOR1 could overcome the suppressive effect of arginine on CASTOR1 (2). These findings show that CASTOR proteins are negative regulators of KSHV-induced proliferation and growth transformation. Whether CASTOR1 is a tumor suppressor in other types of cancer requires further investigation.
KSHV miRNAs are highly expressed during latency and in KS tumors, implicating their essential roles in the development of KS (12, 13). Indeed, KSHV miRNAs target numerous growth and survival pathways to promote cell growth and cellular transformation (10). We have previously shown that KSHV pre–miR-K1, -K4, and -K11 have essential roles in KSHV-induced cellular transformation and tumorigenesis (14). miR-K1-5p and miR-K11, an ortholog of cellular oncogenic miR-155, enhance cell survival and viral latency by directly targeting IκBα to activate the NF-κB pathway and by repressing Fos and BACH1, respectively (14, 17, 19). However, the role of miR-K4-5p in KSHV-induced transformation remains unknown. Our results showed that miR-K4-5p and possibly miR-K1-5p directly target CASTOR1 to inhibit its expression, leading to mTORC1 activation and KSHV-induced cell proliferation and cellular transformation (Figure 8E). These results reveal a mechanism by which KSHV hijacks the mTORC1 pathway to promote tumorigenesis and hence provide the scientific basis for using mTOR inhibitors for the treatment of patients with KS.
We have shown that overexpression of CASTORs and treatment with mTOR inhibitors induce cell-cycle arrest and, in some cases, weak apoptosis in KMM cells and pre–miR-K1– and -K4–complemented ΔmiR-mutant cells, indicating that CASTORs and the mTORC1 pathway regulate both cell proliferation and survival in these cells. Although overexpression of CASTORs and treatment with mTOR inhibitors also induced cell-cycle arrest in MM cells and vector-complemented ΔmiR-mutant cells, there was a minimal effect on cell survival in these cells. These results indicate that KSHV miRNAs target other oncogenic and survival pathways in addition to the mTORC1 pathway, findings that are in agreement with the reported functions of KSHV miRNAs (10).
Methods
Cell culture.
TIVE and KTIVE cells were obtained from Rolf Renne of the University of Florida (Gainesville, Florida, USA) (47). TIVE cells were cultured in VascuLife VEGF Complete Media (Lifeline Cell Technology, LM-0024) plus 10% FBS (MilliporeSigma). KTIVE cells were cultured as TIVE cells in the presence of 10 μg/ml hygromycin. MM and KMM cells were cultured as previously described (8). 293T cells were obtained from American Type Culture Collection (ATCC) (CRL-3216). 293T cells were maintained in DMEM supplemented with 10% FBS and antibiotics containing 100 μg/mL penicillin and 100 μg/mL streptomycin.
Plasmids.
The reporter construct of the WT full-length CASTOR1 3′-UTR (CASTOR1 3′-UTR) was generated by cloning the CASTOR1 3′-UTR sequence downstream of the luciferase sequence into the pGL3-control plasmid using the primers 5′-AGTGGTACCGGAACAGCAGACCCAACC-3′ (forward) and 5′-AGTCTCGAGTCGGAACCAGAGGGCACAGC-3′ (reverse). The 35-bp and 26-bp DNA fragments from the CASTOR1 3′-UTR containing putative miRNA targeting sites and the mutated 26-bp fragment were synthesized by Integrated DNA Technology and cloned into the pGL3-control plasmid. The coding sequence of CASTOR1 and CASTOR2 with a Flag tag at the C-terminus was amplified by PCR using the cDNA prepared from MM cells as PCR templates and cloned into the NotI/BamHI sites of the pITA-puro lentiviral vector to generate CASTOR1 and CASTOR2 expression vectors. The primer sequences used for the cloning were as follows: 5′-TATGCGGCCGCGCCACCATGGACTACAAAGACGATGACGACAAGATGGAACTTCACATCCAGAGC-3′ (forward) and 5′-ATAGGATCCCTATGGATCTTTGGAAGCCAGG-3′ (reverse) for CASTOR1, and 5′-TATGCGGCCGCGCCACCATGGACTACAAAGACGATGACGACAGATGGAACTGCACATTCTGGAAC-3′ (forward) and 5′-ATAGGATCCCTAATGCTTCCCTGCTTGACTG-3′ (reverse) for CASTOR2. All the constructs were confirmed by direct DNA sequencing.
Lentiviral overexpression.
The Flag-tagged CASTOR1 and CASTOR2 expression plasmid pITA or empty vector pITA was cotransfected with pMDG and p8.74 packaging plasmids into 293T cells using Lipofectamine 2000 Transfection Reagent (Thermo Fisher Scientific, 11668019). On day 3 after transfection, the supernatant of the 293T cells was collected and filtered. Cells were transduced by spinning infection at 500 g for 1 hour in the presence of 10 μg/ml polybrene. Expression of CASTOR1 or CASTOR2 protein was confirmed by Western blot analysis on day 2 after transduction.
Colony formation in soft agar.
A soft agar assay was performed as previously described (8). Briefly, a total of 2 × 10⁴ cells suspended in 1 ml of 0.3% top agar (MilliporeSigma, A5431) were plated onto 1 well of 0.5% base agar in 6 well-plates and maintained for 2 weeks. Colonies with a diameter of less than 50 μm were counted and photographed by microscope with a ×4 objective lens.
Cell-cycle analysis and apoptosis assay.
Cell cycle was analyzed by propidium iodide (PI) staining and BrdU incorporation at the indicated time points, as previously described (8). Briefly, cells were pulsed with 10 μM BrdU (MilliporeSigma, B5002) for 2 hours and then fixed and stained with a BrdU monoclonal antibody (Thermo Fisher Scientific, B35129) and PI (MilliporeSigma, P4864). Apoptotic cells were detected using the Fixable Viability Dye eFluor 660 Kit (eBioscience, 650864) and a PE-Cy7 Annexin V Apoptosis Detection Set (eBioscience, 88810374) following the instructions of the manufacturer. Flow cytometry was performed using a FACSCanto System (BD Biosciences), and analysis was performed with FlowJo software.
Reverse transcription real-time quantitative PCR.
Total RNA was isolated with TRI Reagent (MilliporeSigma, T9424) according to the manufacturer’s instructions. For coding genes, reverse transcription was performed with total RNA using the Maxima H Minus First Strand cDNA Synthesis Kit (Thermo Fisher Scientific, K1652). Quantitative PCR (qPCR) analysis was performed using the SsoAdvanced Universal SYBR Green Supermix Kit (Bio-Rad, 172-5272). For miRNAs, reverse transcription was performed with total RNA using the TaqMan MicroRNA Reverse Transcription Kit (Thermo Fisher Scientific, 4366597). qPCR analysis was performed using the Power SYBR Green PCR Master Mix (Thermo Fisher Scientific, 4367659). The relative expression levels of target genes were normalized to the expression level of an internal control gene, which yielded 2–ΔΔCt values. All reactions were run in triplicate, with Ct values within 0.5-Ct differences among the triplicates. The primers used for gene expression were as follows: 5′-TCCATAGGGAACAGCAGACC-3′ (forward) and 5′-GCAGACATGTCCACAACCAC-3′ (reverse) for rat CASTOR1; 5′-AGAGGTTGGGGACAAGAGGT-3′ (forward) and 5′-TTGGAGACTGACCCTGCTCT-3′ (reverse) for rat CASTOR2; and 5′-CCATGTACCCAGGCATTGCT-3′ (forward) and 5′-AGCCACCAATCCACACAGAG-3′ (reverse) for rat β-actin; 5′-GCCACCACCCTCATAGATGT-3′ (forward) and 5′-AGGAGGTCACTGGGGAACTT-3′ (reverse) for human CASTOR1; 5′-AACTCCACATCCTGGAGCAC-3′ (forward) and 5′-GGAATCCTTCCTCATCGACA-3′ (reverse) for human CASTOR2; and 5′-ATCATTGCTCCTCCTGAGCG-3′ (forward) and 5′-CGGACTCGTCATACTCCTGC-3′ (reverse) for human β-actin. The primers used for KSHV miRNAs and U6 reverse transcription were the same as previously described (14, 19).
Western blot analysis.
Cell pellets were lysed in a sample buffer as previously described (48). To detect CASTOR1 and CASTOR2 proteins, we used in-house prepared 10% SDS-polyacrylamide gels at extended lengths. Other proteins were separated with 4% to 20% SDS-polyacrylamide gels (Genscript M00656 and M00657). Separated proteins were electrophoretically transferred to nitrocellulose membranes (GE Healthcare, 10600004). The membranes were incubated sequentially with primary and secondary antibodies. The signal was developed using the Luminiata Crescendo Western HRP substrate (EMD Millipore WBLUR0500). The antibodies used for Western blot analysis included rabbit antibodies against S6K1 (Abcam, 32359), p-S6K (Cell Signaling Technology, 9205), p-4EBP1 (Cell Signaling Technology, 9451), 4EBP1 (Cell Signaling Technology, 9644), and GAPDH (Cell Signaling Technology, 5174), as well as mouse monoclonal antibodies against Flag M2 (MilliporeSigma, F1804) and β-tubulin (MilliporeSigma, 7B9). Antibodies against CASTOR1 and CASTOR2 were prepared in rabbits using purified peptide YTLMVDEEGFKEL-C (Chemipeptide). The antibodies recognized both CASTOR1 and CASTOR2 proteins.
Transfection and dual-luciferase reporter assay.
The LNA-based suppressors for KSHV miRNAs were previously described (14, 19). Transfections of LNA-based miRNA suppressors (Exiqon) or plasmids were performed with Lipofectamine RNAiMAX (Thermo Fisher Scientific, 13778150) or Lipofectamine 2000 Transfection Reagent (Thermo Fisher Scientific, 11668019) following the manufacturer’s instructions. For luciferase assays, MM, KMM, or 293T cells transfected for 48 hours with DNAs of a luciferase reporter plasmid and the Renilla vector pRL-TK (Promega), together with the miRNA expression construct pSuper-miR-K1 or -K4, and with or without an LNA-based miRNA suppressor, were harvested. The relative luciferase activity was assayed using the Dual-Luciferase Reporter Assay System (Promega, E1960).
Statistics.
Results are expressed as the mean ± SEM from at least 3 independent experiments or biological replicates as indicated in the figure legends. The differences between 2 groups were analyzed by 2-tailed Student’s t test or 1-way ANOVA if multiple groups were compared, followed by Tukey’s post hoc test if the P value was less than 0.05. All statistical analyses were performed using GraphPad Prism 6.0 (GraphPad Software). A P value of less than 0.05 was considered statistically significant.
Author contributions
SJG conceived and managed the project. TL and SJG designed the experiments. TL and EJ performed the experiments. TL, EJ, and SJG performed the data analysis. TL, EJ, and SJG wrote and edited the manuscript.
Acknowledgments
We would like to thank Patrick S. Moore (UPMC Hillman Cancer Center) for his advice on statistical analysis of the data, and members of the Gao laboratory for their technical assistance and helpful discussions. This work was supported by grants from the NIH (CA096512, CA124332, CA132637, CA213275, CA177377, DE025465, and CA197153, to SJG) and, in part, by the National Cancer Institute (NCI) (P30 CA147904).
Version 1. 07/15/2019
Electronic publication
Version 2. 08/01/2019
Print issue publication
Footnotes
Conflict of interest: The authors declare that no conflict of interest exists.
Copyright: © 2019, American Society for Clinical Investigation.
Reference information: J Clin Invest. 2019;129(8):3310–3323.https://doi.org/10.1172/JCI127166.
Contributor Information
Tingting Li, Email: lit3@upmc.edu.
Enguo Ju, Email: jue@upmc.edu.
Shou-Jiang Gao, Email: gaos8@upmc.edu.
References
- 1.Saxton RA, Sabatini DM. mTOR signaling in growth, metabolism, and disease. Cell. 2017;168(6):960–976. doi: 10.1016/j.cell.2017.02.004. [DOI] [PMC free article] [PubMed] [Google Scholar]
- 2.Chantranupong L, et al. The CASTOR Proteins Are Arginine Sensors for the mTORC1 Pathway. Cell. 2016;165(1):153–164. doi: 10.1016/j.cell.2016.02.035. [DOI] [PMC free article] [PubMed] [Google Scholar]
- 3.Saxton RA, Chantranupong L, Knockenhauer KE, Schwartz TU, Sabatini DM. Mechanism of arginine sensing by CASTOR1 upstream of mTORC1. Nature. 2016;536(7615):229–233. doi: 10.1038/nature19079. [DOI] [PMC free article] [PubMed] [Google Scholar]
- 4.Xia J, Wang R, Zhang T, Ding J. Structural insight into the arginine-binding specificity of CASTOR1 in amino acid-dependent mTORC1 signaling. Cell Discov. 2016;2:16035. doi: 10.1038/celldisc.2016.35. [DOI] [PMC free article] [PubMed] [Google Scholar]
- 5.Bhutani M, Polizzotto MN, Uldrick TS, Yarchoan R. Kaposi sarcoma-associated herpesvirus-associated malignancies: epidemiology, pathogenesis, and advances in treatment. Semin Oncol. 2015;42(2):223–246. doi: 10.1053/j.seminoncol.2014.12.027. [DOI] [PMC free article] [PubMed] [Google Scholar]
- 6.Chang Y, et al. Identification of herpesvirus-like DNA sequences in AIDS-associated Kaposi’s sarcoma. Science. 1994;266(5192):1865–1869. doi: 10.1126/science.7997879. [DOI] [PubMed] [Google Scholar]
- 7.Soulier J, et al. Kaposi’s sarcoma-associated herpesvirus-like DNA sequences in multicentric Castleman’s disease. Blood. 1995;86(4):1276–1280. [PubMed] [Google Scholar]
- 8.Jones T, et al. Direct and efficient cellular transformation of primary rat mesenchymal precursor cells by KSHV. J Clin Invest. 2012;122(3):1076–1081. doi: 10.1172/JCI58530. [DOI] [PMC free article] [PubMed] [Google Scholar]
- 9.Ye F, Lei X, Gao SJ. Mechanisms of Kaposi’s sarcoma-associated herpesvirus latency and reactivation. Adv Virol. 2011;2011:193860. doi: 10.1155/2011/193860. [DOI] [PMC free article] [PubMed] [Google Scholar]
- 10.Zhu Y, Haecker I, Yang Y, Gao SJ, Renne R. γ-Herpesvirus-encoded miRNAs and their roles in viral biology and pathogenesis. Curr Opin Virol. 2013;3(3):266–275. doi: 10.1016/j.coviro.2013.05.013. [DOI] [PMC free article] [PubMed] [Google Scholar]
- 11.Foshay KM, Gallicano GI. Small RNAs, big potential: the role of microRNAs in stem cell function. Curr Stem Cell Res Ther. 2007;2(4):264–271. doi: 10.2174/157488807782793781. [DOI] [PubMed] [Google Scholar]
- 12.Cai X, Lu S, Zhang Z, Gonzalez CM, Damania B, Cullen BR. Kaposi’s sarcoma-associated herpesvirus expresses an array of viral microRNAs in latently infected cells. Proc Natl Acad Sci U S A. 2005;102(15):5570–5575. doi: 10.1073/pnas.0408192102. [DOI] [PMC free article] [PubMed] [Google Scholar]
- 13.Marshall V, et al. Conservation of virally encoded microRNAs in Kaposi sarcoma--associated herpesvirus in primary effusion lymphoma cell lines and in patients with Kaposi sarcoma or multicentric Castleman disease. J Infect Dis. 2007;195(5):645–659. doi: 10.1086/511434. [DOI] [PubMed] [Google Scholar]
- 14.Moody R, et al. KSHV microRNAs mediate cellular transformation and tumorigenesis by redundantly targeting cell growth and survival pathways. PLoS Pathog. 2013;9(12):e1003857. doi: 10.1371/journal.ppat.1003857. [DOI] [PMC free article] [PubMed] [Google Scholar]
- 15.Zhu Y, et al. An oncogenic virus promotes cell survival and cellular transformation by suppressing glycolysis. PLoS Pathog. 2016;12(5):e1005648. doi: 10.1371/journal.ppat.1005648. [DOI] [PMC free article] [PubMed] [Google Scholar]
- 16.Gottwein E, Cullen BR. A human herpesvirus microRNA inhibits p21 expression and attenuates p21-mediated cell cycle arrest. J Virol. 2010;84(10):5229–5237. doi: 10.1128/JVI.00202-10. [DOI] [PMC free article] [PubMed] [Google Scholar]
- 17.Gottwein E, et al. A viral microRNA functions as an orthologue of cellular miR-155. Nature. 2007;450(7172):1096–1099. doi: 10.1038/nature05992. [DOI] [PMC free article] [PubMed] [Google Scholar]
- 18.Hu M, et al. A KSHV microRNA directly targets G protein-coupled receptor kinase 2 to promote the migration and invasion of endothelial cells by inducing CXCR2 and activating AKT signaling. PLoS Pathog. 2015;11(9):e1005171. doi: 10.1371/journal.ppat.1005171. [DOI] [PMC free article] [PubMed] [Google Scholar]
- 19.Lei X, et al. Regulation of NF-kappaB inhibitor IkappaBalpha and viral replication by a KSHV microRNA. Nat Cell Biol. 2010;12(2):193–199. doi: 10.1038/ncb2019. [DOI] [PMC free article] [PubMed] [Google Scholar]
- 20.Lei X, Zhu Y, Jones T, Bai Z, Huang Y, Gao SJ. A Kaposi’s sarcoma-associated herpesvirus microRNA and its variants target the transforming growth factor β pathway to promote cell survival. J Virol. 2012;86(21):11698–11711. doi: 10.1128/JVI.06855-11. [DOI] [PMC free article] [PubMed] [Google Scholar]
- 21.Li W, et al. A viral microRNA downregulates metastasis suppressor CD82 and induces cell invasion and angiogenesis by activating the c-Met signaling. Oncogene. 2017;36(38):5407–5420. doi: 10.1038/onc.2017.139. [DOI] [PMC free article] [PubMed] [Google Scholar]
- 22.Li W, et al. The SH3BGR/STAT3 pathway regulates cell migration and angiogenesis induced by a gammaherpesvirus microRNA. PLoS Pathog. 2016;12(4):e1005605. doi: 10.1371/journal.ppat.1005605. [DOI] [PMC free article] [PubMed] [Google Scholar]
- 23.Liu X, Happel C, Ziegelbauer JM. Kaposi’s sarcoma-associated herpesvirus microRNAs target GADD45B to protect infected cells from cell cycle arrest and apoptosis. J Virol. 2017;91(3):e02045-16. doi: 10.1128/JVI.02045-16. [DOI] [PMC free article] [PubMed] [Google Scholar]
- 24.Liu Y, Sun R, Lin X, Liang D, Deng Q, Lan K. Kaposi’s sarcoma-associated herpesvirus-encoded microRNA miR-K12-11 attenuates transforming growth factor beta signaling through suppression of SMAD5. J Virol. 2012;86(3):1372–1381. doi: 10.1128/JVI.06245-11. [DOI] [PMC free article] [PubMed] [Google Scholar]
- 25.Lu F, Stedman W, Yousef M, Renne R, Lieberman PM. Epigenetic regulation of Kaposi’s sarcoma-associated herpesvirus latency by virus-encoded microRNAs that target Rta and the cellular Rbl2-DNMT pathway. J Virol. 2010;84(6):2697–2706. doi: 10.1128/JVI.01997-09. [DOI] [PMC free article] [PubMed] [Google Scholar]
- 26.Suffert G, et al. Kaposi’s sarcoma herpesvirus microRNAs target caspase 3 and regulate apoptosis. PLoS Pathog. 2011;7(12):e1002405. doi: 10.1371/journal.ppat.1002405. [DOI] [PMC free article] [PubMed] [Google Scholar]
- 27.Bellare P, Ganem D. Regulation of KSHV lytic switch protein expression by a virus-encoded microRNA: an evolutionary adaptation that fine-tunes lytic reactivation. Cell Host Microbe. 2009;6(6):570–575. doi: 10.1016/j.chom.2009.11.008. [DOI] [PMC free article] [PubMed] [Google Scholar]
- 28.Liang D, et al. A human herpesvirus miRNA attenuates interferon signaling and contributes to maintenance of viral latency by targeting IKKε. Cell Res. 2011;21(5):793–806. doi: 10.1038/cr.2011.5. [DOI] [PMC free article] [PubMed] [Google Scholar]
- 29.Lin X, Liang D, He Z, Deng Q, Robertson ES, Lan K. miR-K12-7-5p encoded by Kaposi’s sarcoma-associated herpesvirus stabilizes the latent state by targeting viral ORF50/RTA. PLoS ONE. 2011;6(1):e16224. doi: 10.1371/journal.pone.0016224. [DOI] [PMC free article] [PubMed] [Google Scholar]
- 30.Bai Z, et al. Genomewide mapping and screening of Kaposi’s sarcoma-associated herpesvirus (KSHV) 3’ untranslated regions identify bicistronic and polycistronic viral transcripts as frequent targets of KSHV microRNAs. J Virol. 2014;88(1):377–392. doi: 10.1128/JVI.02689-13. [DOI] [PMC free article] [PubMed] [Google Scholar]
- 31.Hernández-Sierra A, et al. Role of HHV-8 and mTOR pathway in post-transplant Kaposi sarcoma staging. Transpl Int. 2016;29(9):1008–1016. doi: 10.1111/tri.12800. [DOI] [PubMed] [Google Scholar]
- 32.Kerr DA, Busarla SVP, Gimbel DC, Sohani AR, Nazarian RM. mTOR, VEGF, PDGFR, and c-kit signaling pathway activation in Kaposi sarcoma. Hum Pathol. 2017;65:157–165. doi: 10.1016/j.humpath.2017.05.002. [DOI] [PubMed] [Google Scholar]
- 33.Stallone G, Infante B, Grandaliano G, Schena FP, Gesualdo L. Kaposi’s sarcoma and mTOR: a crossroad between viral infection neoangiogenesis and immunosuppression. Transpl Int. 2008;21(9):825–832. doi: 10.1111/j.1432-2277.2008.00697.x. [DOI] [PubMed] [Google Scholar]
- 34.Wang L, Damania B. Kaposi’s sarcoma-associated herpesvirus confers a survival advantage to endothelial cells. Cancer Res. 2008;68(12):4640–4648. doi: 10.1158/0008-5472.CAN-07-5988. [DOI] [PMC free article] [PubMed] [Google Scholar]
- 35.Stallone G, et al. Sirolimus for Kaposi’s sarcoma in renal-transplant recipients. N Engl J Med. 2005;352(13):1317–1323. doi: 10.1056/NEJMoa042831. [DOI] [PubMed] [Google Scholar]
- 36.Roy D, et al. mTOR inhibitors block Kaposi sarcoma growth by inhibiting essential autocrine growth factors and tumor angiogenesis. Cancer Res. 2013;73(7):2235–2246. doi: 10.1158/0008-5472.CAN-12-1851. [DOI] [PMC free article] [PubMed] [Google Scholar]
- 37.Riva G, Luppi M, Barozzi P, Forghieri F, Potenza L. How I treat HHV8/KSHV-related diseases in posttransplant patients. Blood. 2012;120(20):4150–4159. doi: 10.1182/blood-2012-04-421412. [DOI] [PubMed] [Google Scholar]
- 38.Chang HH, Ganem D. A unique herpesviral transcriptional program in KSHV-infected lymphatic endothelial cells leads to mTORC1 activation and rapamycin sensitivity. Cell Host Microbe. 2013;13(4):429–440. doi: 10.1016/j.chom.2013.03.009. [DOI] [PMC free article] [PubMed] [Google Scholar]
- 39.Martin D, Galisteo R, Molinolo AA, Wetzker R, Hirsch E, Gutkind JS. PI3Kγ mediates kaposi’s sarcoma-associated herpesvirus vGPCR-induced sarcomagenesis. Cancer Cell. 2011;19(6):805–813. doi: 10.1016/j.ccr.2011.05.005. [DOI] [PMC free article] [PubMed] [Google Scholar]
- 40.Tomlinson CC, Damania B. The K1 protein of Kaposi’s sarcoma-associated herpesvirus activates the Akt signaling pathway. J Virol. 2004;78(4):1918–1927. doi: 10.1128/JVI.78.4.1918-1927.2004. [DOI] [PMC free article] [PubMed] [Google Scholar]
- 41.Bhatt AP, et al. A viral kinase mimics S6 kinase to enhance cell proliferation. Proc Natl Acad Sci U S A. 2016;113(28):7876–7881. doi: 10.1073/pnas.1600587113. [DOI] [PMC free article] [PubMed] [Google Scholar]
- 42.Ye FC, Zhou FC, Yoo SM, Xie JP, Browning PJ, Gao SJ. Disruption of Kaposi’s sarcoma-associated herpesvirus latent nuclear antigen leads to abortive episome persistence. J Virol. 2004;78(20):11121–11129. doi: 10.1128/JVI.78.20.11121-11129.2004. [DOI] [PMC free article] [PubMed] [Google Scholar]
- 43.Flamand MN, Gan HH, Mayya VK, Gunsalus KC, Duchaine TF. A non-canonical site reveals the cooperative mechanisms of microRNA-mediated silencing. Nucleic Acids Res. 2017;45(12):7212–7225. doi: 10.1093/nar/gkx340. [DOI] [PMC free article] [PubMed] [Google Scholar]
- 44.Boulanger E, Afonso PV, Yahiaoui Y, Adle-Biassette H, Gabarre J, Agbalika F. Human herpesvirus-8 (HHV-8)-associated primary effusion lymphoma in two renal transplant recipients receiving rapamycin. Am J Transplant. 2008;8(3):707–710. doi: 10.1111/j.1600-6143.2007.02110.x. [DOI] [PubMed] [Google Scholar]
- 45.Sodhi A, et al. The TSC2/mTOR pathway drives endothelial cell transformation induced by the Kaposi’s sarcoma-associated herpesvirus G protein-coupled receptor. Cancer Cell. 2006;10(2):133–143. doi: 10.1016/j.ccr.2006.05.026. [DOI] [PubMed] [Google Scholar]
- 46.Sabatini DM. Twenty-five years of mTOR: Uncovering the link from nutrients to growth. Proc Natl Acad Sci U S A. 2017;114(45):11818–11825. doi: 10.1073/pnas.1716173114. [DOI] [PMC free article] [PubMed] [Google Scholar]
- 47.An FQ, et al. Long-term-infected telomerase-immortalized endothelial cells: a model for Kaposi’s sarcoma-associated herpesvirus latency in vitro and in vivo. J Virol. 2006;80(10):4833–4846. doi: 10.1128/JVI.80.10.4833-4846.2006. [DOI] [PMC free article] [PubMed] [Google Scholar]
- 48.Gao SJ, et al. Seroconversion to antibodies against Kaposi’s sarcoma-associated herpesvirus-related latent nuclear antigens before the development of Kaposi’s sarcoma. N Engl J Med. 1996;335(4):233–241. doi: 10.1056/NEJM199607253350403. [DOI] [PubMed] [Google Scholar]


