

Abstract
Obstructive sleep apnea (OSA) is associated with cardiovascular disease. Dyslipidemia has been implicated as one mechanism, but no consistent associations with lipids exist for OSA or positive airway pressure (PAP) treatment. We assessed relationships between fasting lipid levels and obesity and OSA severity, and explored the impact of PAP treatment on two-year fasting lipid level changes.
Analyses included moderate-to-severe OSA patients from the Icelandic Sleep Apnea Cohort. Fasting morning lipids were analyzed in 613 untreated participants not on lipid-lowering medications at baseline. Patients were then initiated on PAP and followed for two years. Sub-classification using propensity score quintiles, which aimed to replicate covariate balance associated with randomized trials and, therefore, minimize selection bias and allow causal inference, was used to design the treatment group comparisons; 199 PAP adherent patients and 118 non-users were identified.
At baseline, obesity was positively correlated with triglycerides and negatively correlated with total, LDL and HDL cholesterol. A small correlation was observed between the apnea-hypopnea index and HDL cholesterol. No effect of PAP adherence on two-year fasting lipid changes was observed.
Results do not support the concept of changes in fasting lipids as a primary mechanism for the increased risk of atherosclerotic cardiovascular disease in OSA.
Keywords: Sleep Apnea Syndromes, Fasting Lipids, Continuous Positive Airway Pressure, Obesity, Cardiovascular Disease, Propensity Scores
INTRODUCTION
Obstructive sleep apnea (OSA) is independently associated with atherosclerotic disease,[1] but mechanisms remains unclear. Dyslipidemia is central to atherosclerosis, with a strong association between lipid levels and risk of atherosclerotic cardiovascular disease.[2] Consequently, dyslipidemia has been implicated as a possible mechanism linking OSA with atherosclerosis. However, studies to date have not definitively established a relationship between the lipid profile and either OSA or positive airway pressure (PAP) treatment.[3–16]
OSA is characterized by repetitive collapse of the upper airway causing chronic intermittent hypoxia (CIH). Animal models demonstrate dyslipidemia proportional to CIH severity and development of atherosclerotic lesions.[9–11, 17–21] However, while studies in mice support a causal relationship between CIH and dyslipidemia, human studies evaluating the effects of OSA[3–11] and PAP treatment[8–16] on lipid levels are inconsistent. Moreover, studies examining PAP are of limited duration, following patients for at most 6 months.[8–16]
When examining inconsistencies in the effect of PAP, one important consideration is the impact of selection bias within observational studies. Propensity score (PS) methodologies are well-established techniques used in numerous fields, including cardiovascular research,[22] to minimize bias and perform comparative effectiveness research in observational studies. A recent NHLBI working group highlighted the importance of such methods within observational samples,[23] which are more inclusive of real-world patients than typical randomized trials. As previously discussed,[24, 25] sub-classification using PS is done without regard to outcome data, allowing the ‘design’ of non-randomized comparisons to examine treatment effects. In observational studies, propensity scores are analogous to randomization, eliminating systematic biases in non-randomized group comparisons due to imbalance from measured covariates, thus improving causal inference.[25] Therefore, PS methods allow treatment effect analyses to proceed as if patients were randomized.[24, 25]
Using the Icelandic Sleep Apnea Cohort (ISAC),[26, 27] sub-classification by PS quintiles was employed to compare fasting lipid level changes between PAP adherent patients and non-users, two years after OSA diagnosis and treatment initiation. We also explored associations for obesity and OSA severity with the fasting lipid profile. We hypothesized there would be a relationship between OSA severity and fasting lipids at baseline, and that PAP would improve fasting lipids in adherent subjects compared to non-users in the PS designed comparison.
METHODS
Study Subjects
Patients were diagnosed with moderate-to-severe OSA (apnea-hypopnea index [AHI]≥15) and referred for PAP treatment. Participants completed standardized questionnaires, physical examination, a type 3 sleep study, fasting morning blood samples and abdominal MRI at baseline. Two years after PAP treatment initiation, participants were invited for a follow-up visit where they answered the same questionnaires, underwent physical examination and anthropometric measures and had fasting morning blood samples drawn, as in baseline assessment. Analyses were restricted to patients not using lipid-lowering medications. Details of the analysis sample obtained from ISAC are presented in the supplement (Figure E1) and previously.[26, 27] Written consent was obtained from every participant. The study protocol was approved by the National Bioethics Committee, the Data Protection Authority of Iceland and the University of Pennsylvania Institutional Review Board.
Blood Samples
Fasting blood samples were taken the morning after sleep in untreated participants at baseline and follow-up (see supplement). Total cholesterol (TC), high-density lipoprotein cholesterol (HDL-C) and triglyceride (TG) concentrations were measured. Low-density lipoprotein cholesterol (LDL-C) was calculated using the Friedwald equation (LDL-C = TC – HDL-C – TG/5). Indicators of “abnormal” levels were defined using the National Cholesterol Education Program (NCEP) Adult Treatment Panel III (ATPIII) criteria[28]: TC≥200 mg/dL, LDL-C≥130 mg/dL, TG≥150 mg/dL and HDL-C<40 mg/dL.
PAP Adherence
Patients were followed for 2 years after PAP treatment initiation. PAP adherence was based on objective usage data from memory cards over the last 28 days, if available, or else on subjective questionnaires (for validation, see supplement). Adherent patients used PAP ≥4 hours/night and ≥20 of the last 28 nights by memory card download, or ≥60% of the night and ≥5 nights/week by questionnaire. Non-users did not use PAP and had no other specific OSA therapy, including surgery or mandibular advancement device. The sample included 240 (51%) adherent and 156 (33%) non-users. Seventy-one (15%) partial-users (patients using PAP, but not meeting ‘adherent’ criteria) were excluded from treatment effect analyses.
Statistical Analysis
Baseline Associations
Continuous and categorical covariates are summarized using means ± standard deviations and percentages, respectively, and compared among groups with T-tests or analysis of variance and chi-square or Fisher’s exact tests. Baseline lipid levels were natural log transformed for normality; associations with obesity and OSA severity were assessed using Pearson correlations.
Propensity Score Methodologies
We used sub-classification by PS quintiles to select samples of adherent patients and non-users in which to assess the PAP treatment effect, based on an established heuristic described by Maislin & Rubin.[24] Briefly, the heuristic consists of three stages that can be repeated as necessary in order to satisfy a set of “propensity score diagnostics” (described by Maislin & Rubin[24]). First, a main effects PS model including all desired covariates is fit to obtain PS quintiles. Second, within quintile bias effect sizes and other PS diagnostic information are analyzed to identify the most important cross-product and squared terms for inclusion in the PS model. Third, a PS model including all main effects and relevant cross-product and squared terms is estimated, and subjects in each treatment group with insufficient “covariate overlap” (as defined by the propensity scores) are excluded from the sample.
Of 240 adherent and 156 non-users in the observational sample, we identified 199 (83%) adherent and 118 (76%) non-users balanced within PS subclass for baseline age, gender, BMI, current smoking, presence of hypertension, cardiovascular disease and diabetes, exercise participation, excessive alcohol use, Epworth Sleepiness Scale (ESS), OSA severity (AHI, oxygen desaturation index [ODI], SaO2 nadir, percentage sleep time SaO2<90) and fasting lipid levels (TC, LDL-C, HDL-C, TG). Balance with respect to the included covariates was shown to be as good as that expected from randomization, strengthening causal inferences. See supplement for additional details and references about PS methodology.
Treatment Effect Analyses
Two-year fasting lipid changes were calculated within subject, using untransformed values. Treatment differences were assessed using analysis of covariance (ANCOVA), controlling for PS subclass and baseline lipid levels. Whether obesity moderated the association between PAP and lipid changes was tested using a PAP by BMI group interaction effect. Given limited power for interaction tests, treatment group comparisons were examined within BMI strata (<30, 30–35, ≥35 kg/m2) regardless of interaction results. There was ~90% power to detect treatment differences explaining 2.5% of variability (R2) in lipid changes (see online supplement for additional details).
RESULTS
Baseline Study Population
A comparison of the 193 (24%) users of lipid-lowering medication and 613 (76%) non-users is presented in Table E1. Users were older (p<0.0001), had higher AHI (p=0.039) and percentage time SaO2<90% (p=0.023), and greater prevalence of hypertension (p<0.0001), diabetes (p<0.0001) and cardiovascular disease (p<0.0001) compared to lipid-lowering medication non-users. Medication users had similar BMI, HDL-C and TG levels as non-users, but lower TC (p<0.0001) and LDL-C (p<0.0001).
Table 1 shows baseline characteristics for lipid-lowering medication non-users, stratified by BMI. Obese patients were younger, participated less in exercise, and had more prevalent hypertension and diabetes and more severe OSA. Compared to subjects with BMI<30, patients with BMI≥35 had lower TC, LDL-C and HDL-C, but higher TG levels (all p<0.02).
Table 1:
Baseline characteristics of the study population, stratified by BMI group
| Characteristic | BMI<30 (N=186) | BMI 30–35 (N=210) | BMI≥35 (N=217) | p† |
|---|---|---|---|---|
| Age (years) | 54.4±9.6 | 53.8±10.8 | 50.5±10.8 | <0.001 |
| Male | 82.3% | 81.0% | 78.3% | 0.597 |
| BMI (kg/m2) | 27.4±2.0 | 32.4±1.4 | 39.9±4.1 | <0.0001 |
| Current Smoker | 24.3% | 20.5% | 22.7% | 0.654 |
| Excessive Alcohol | 3.3% | 3.8% | 3.7% | 0.963 |
| Hypertension | 25.4% | 34.0% | 50.9% | <0.0001 |
| Cardiovascular Disease | 3.2% | 4.8% | 4.6% | 0.769 |
| Diabetes Mellitus | 2.2% | 2.4% | 6.5% | 0.045 |
| Participate in Exercise | 73.6% | 57.6% | 51.9% | <0.0001 |
| Epworth Sleepiness Scale | 11.7±4.8 | 11.4±5.1 | 12.3±5.3 | 0.183 |
| AHI (events/hour) | 37.4±15.2 | 44.7±20.4 | 49.0±23.2 | <0.0001 |
| ODI (events/hour) | 26.4±13.4 | 35.1±18.9 | 41.9±23.5 | <0.0001 |
| SaO2 Nadir | 79.0±6.6 | 76.9±7.5 | 73.2±8.9 | <0.0001 |
| Percent Time SaO2<90 | 6.1±9.1 | 12.4±16.1 | 19.7±22.3 | <0.0001 |
| Total Cholesterol (mg/dL) | 212.6±37.3 | 207.2±42.4 | 200.9±41.5 | 0.016 |
| Total Cholesterol ≥200‡ | 65.6% | 57.6% | 52.5% | 0.029 |
| LDL Cholesterol (mg/dL) | 156.1±35.2 | 152.1±38.2 | 145.4±36.9 | 0.012 |
| LDL Cholesterol ≥130‡ | 76.3% | 71.9% | 65.0% | 0.040 |
| HDL Cholesterol (mg/dL) | 43.6±14.3 | 39.6±9.2 | 38.2±9.4 | <0.0001 |
| HDL Cholesterol <40‡ | 48.4% | 57.1% | 67.3% | 0.001 |
| Triglycerides (mg/dL) | 147.1±63.2 | 177.9±81.6 | 198.9±103.2 | <0.0001 |
| Triglycerides ≥150‡ | 43.0% | 59.5% | 68.7% | <0.0001 |
Significant differences shown in bold.
p-values from ANOVA and chi-square or Fisher’s exact test
Based on the NCEP ATPIII published criteria[28]
BMI: body mass index; AHI: apnea-hypopnea index; ODI: oxygen desaturation index; LDL: low-density lipoprotein; HDL: high-density lipoprotein.
Magnetic resonance imaging (MRI) was available in 501 (82%) subjects; reasons for missing MRI included: claustrophobia (n=66), poor quality (n=33), very high obesity (n=6) and nonspecific (n=7). Table E2 compares patients with and without MRI.
Baseline Associations with fasting lipids
Associations with baseline fasting lipids for obesity measures and OSA severity in lipid-lowering medication non-users are shown in Tables 2 and E3. BMI, weight, neck circumference and waist circumference were negatively correlated with TC, LDL-C, and HDL-C and positively correlated with TG. Waist-to-hip ratio correlated with HDL-C and TG only. All MRI fat measures were positively correlated with TG; visceral fat was negatively correlated with HDL-C. AHI was positively correlated with HDL-C. No other correlations between OSA severity and lipid levels were observed.
Table 2:
Pearson correlations* between obesity and OSA severity measures and natural log transformed lipid measures
| Measure | Total Cholesterol |
LDL Cholesterol |
HDL Cholesterol |
Triglycerides |
||||
|---|---|---|---|---|---|---|---|---|
| rho | p | rho | p | rho | p | rho | p | |
| BMI (kg/m2) | −0.13 | 0.001 | −0.14 | 0.001 | −0.16 | <0.001 | 0.28 | <0.0001 |
| Weight (kg) | −0.16 | <0.0001 | −0.17 | <0.0001 | −0.16 | <0.001 | 0.25 | <0.0001 |
| Neck Circumference (cm) | −0.13 | 0.002 | −0.13 | 0.001 | −0.20 | <0.0001 | 0.34 | <0.0001 |
| Waist Circumference (cm) | −0.11 | 0.006 | −0.13 | 0.001 | −0.12 | 0.003 | 0.32 | <0.0001 |
| Waist-to-hip Ratio | −0.04 | 0.290 | −0.05 | 0.177 | −0.10 | 0.013 | 0.29 | <0.0001 |
| Total Abdominal fat (cm3) | −0.02 | 0.657 | −0.05 | 0.239 | −0.07 | 0.118 | 0.29 | <0.0001 |
| SAT (cm3) | −0.03 | 0.502 | −0.07 | 0.140 | −0.04 | 0.402 | 0.22 | <0.0001 |
| VAT (cm3) | 0.00 | 0.937 | −0.01 | 0.746 | −0.11 | 0.016 | 0.33 | <0.0001 |
| AHI (events/hour) | 0.04 | 0.300 | 0.01 | 0.725 | 0.09 | 0.022 | 0.03 | 0.428 |
| ODI (events/hour) | −0.01 | 0.901 | −0.02 | 0.559 | 0.02 | 0.606 | 0.06 | 0.157 |
| SaO2 Nadir | 0.02 | 0.568 | 0.02 | 0.621 | 0.04 | 0.384 | −0.01 | 0.804 |
| Percent Time SaO2<90† | −0.02 | 0.571 | −0.04 | 0.360 | 0.01 | 0.792 | 0.02 | 0.619 |
Significant correlations shown in bold
Correlations between obesity and lipids adjusted for age and gender, correlations for OSA severity adjusted for age, gender, and BMI
natural log transformed for normality
OSA: obstructive sleep apnea; BMI: body mass index; SAT: subcutaneous abdominal fat; VAT: visceral abdominal fat; AHI: apnea-hypopnea index; ODI: oxygen desaturation index; LDL: low-density lipoprotein; HDL: high-density lipoprotein.
Propensity Score Designed Observational Study
Sub-classification using PS quintiles identified 199 (83%) adherent patients and 118 (76%) non-users meeting model assumptions assuring that, within subclass, distributions of included baseline covariates were the same for both groups. Table E4 compares patients included and excluded from the PS designed comparison.
Demographics and covariate balance
Figure 1 (“Love plot”[29]) and Table 3 show that our PS designed study resulted in baseline covariate balance between adherent patients and non-users (see Methods). In the original observational cohort, 8 of 18 covariates were significantly different between adherent and non-users (Figure 1). After adjusting for PS subclass in the designed study, no baseline covariate differences remained (see Table 3 for p-values).
Figure 1.
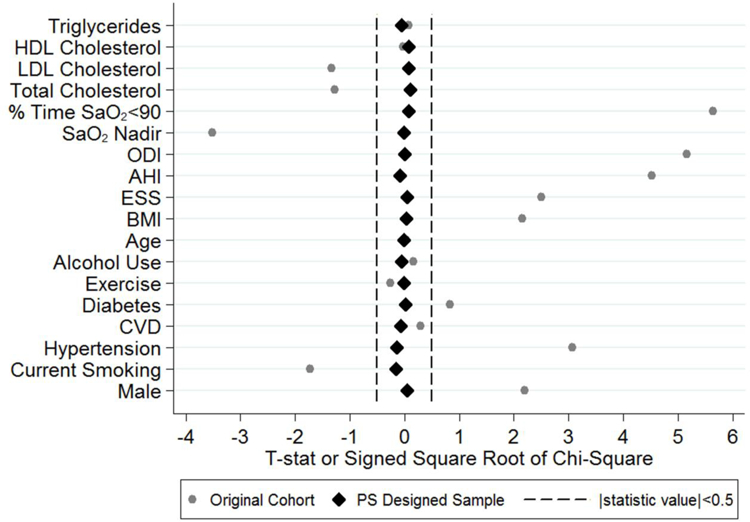
This “Love Plot”[29] illustrates the balance in covariates between PAP adherent patients and non-users in the original cohort and after controlling for propensity score subclass within the designed cohort. The plot shows the T-statistic or signed square root of the chi-square comparing covariates between groups. While a number of covariates were significantly different prior to sub-classification, after controlling for PS subclass in the designed cohort, all statistics are close to zero. HDL: high-density lipoprotein; LDL: low-density lipoprotein; SaO2: oxygen saturation; ODI: oxygen-desaturation index; AHI: apnea-hypopnea index; ESS: Epworth Sleepiness Scale; BMI: body mass index; CVD: cardiovascular disease; PS: propensity score.
Table 3:
Baseline and follow-up characteristics* of the PAP adherent and non-users within the PS designed sample
| Characteristic | Baseline |
Follow-Up |
||||
|---|---|---|---|---|---|---|
| Adherent (N=199) | Non-User (N=118) | p† | Adherent (N=199) | Non-User (N=118) | p‡ | |
| Age (years) | 51.8±10.4 | 52.8±10.0 | 0.996 | – | – | – |
| Male | 81.9% | 80.5% | 0.967 | – | – | – |
| BMI (kg/m2) | 33.9±5.9 | 33.1±5.9 | 0.975 | 34.9±6.1 | 32.9±5.4 | <0.0001 |
| Current Smoker | 20.6% | 20.3% | 0.897 | 18.7% | 28.0% | 0.004 |
| Excessive Alcohol | 2.5% | 2.5% | 0.954 | 1.5% | 2.5% | 0.342 |
| Hypertension | 33.2% | 28.8% | 0.892 | 33.8% | 30.5% | 0.953 |
| Cardiovascular Disease | 2.5% | 1.7% | 0.949 | 2.5% | 1.7% | 0.688 |
| Diabetes Mellitus | 1.5% | 0.9% | 0.987 | 3.1% | 3.5% | 0.460 |
| Participate in Exercise | 58.8% | 58.4% | 0.988 | 67.9% | 66.7% | 0.726 |
| Epworth Sleepiness Scale | 12.0±5.0 | 11.5±4.8 | 0.966 | 7.8±4.6 | 9.3±4.9 | 0.002 |
| AHI (events/hour) | 44.8±19.6 | 40.8±19.8 | 0.931 | – | – | – |
| ODI (events/hour) | 36.1±19.3 | 32.1±19.0 | 0.990 | – | – | – |
| SaO2 Nadir | 76.2±7.5 | 77.5±7.3 | 0.993 | – | – | – |
| Percent Time SaO2<90 | 2.1±1.0 | 1.8±1.0 | 0.942 | – | – | – |
| Total Cholesterol (mg/dL) | 204.7±41.6 | 204.9±35.4 | 0.917 | 211.4±41.6 | 213.3±36.0 | 0.528 |
| Total Cholesterol ≥200§ | 56.3% | 55.1% | 0.727 | 64.3% | 63.6% | 0.771 |
| LDL Cholesterol (mg/dL) | 149.4±37.3 | 149.7±33.8 | 0.933 | 149.5±30.9 | 151.3±33.3 | 0.475 |
| LDL Cholesterol ≥130§ | 70.9% | 72.9% | 0.905 | 75.9% | 72.9% | 0.475 |
| HDL Cholesterol (mg/dL) | 40.0±12.4 | 39.8±10.3 | 0.922 | 46.6±12.8 | 47.3±12.8 | 0.619 |
| HDL Cholesterol <40§ | 60.8% | 57.6% | 0.978 | 30.6% | 34.8% | 0.144 |
| Triglycerides (mg/dL) | 174.8±86.1 | 176.0±102.9 | 0.998 | 174.6±88.9 | 167.9±96.1 | 0.517 |
| Triglycerides ≥150§ | 59.8% | 55.1% | 0.737 | 54.8% | 49.2% | 0.544 |
Significant differences shown in bold
Summary statistics presented as mean and standard deviations or percentages of the overall sample, not accounting for PS subclass
p-value adjusted for PS subclass from ANCOVA model or conditional logistic regression
p-value from ANCOVA or conditional logistic examining the difference in follow-up values, adjusted for PS subclass and baseline value
based on the NCEP ATPIII published criteria[28].
PAP: positive airway pressure; BMI: body mass index; AHI: apnea-hypopnea index; ODI: oxygen desaturation index; LDL: low-density lipoprotein; HDL: high-density lipoprotein
Table 3 also summarizes two-year follow-up characteristics of the selected patients. We observed significant differences between groups in BMI, ESS and smoking status. Both PAP groups had lower ESS scores at follow-up, but adherent patients had greater decreases than non-users (p=0.002). Adherent patients also had increased BMI at follow-up compared to non-users (p<0.0001). Non-users were more likely to become smokers (p=0.004); 86% of patients who became smokers had a previous smoking history.
Differences in fasting lipid changes between PAP adherent and non-users
Summary measures of fasting lipid levels are presented in Table 3. As baseline lipid levels were included in the PS heuristic, there were no baseline differences between adherent patients and non-users.
Table 4 and Figure 2 show two-year fasting lipid changes between adherent and non-users, adjusted for PS subclass and baseline lipid level. We observed no significant differences in lipid changes between PAP groups, overall or within BMI strata. There was no evidence for interaction between PAP and BMI group.
Table 4:
Differences in two-year lipid changes between PAP adherent and non-users
| Lipid | BMI Group*,† |
LS Mean±SE
Change |
p‡ | |
|---|---|---|---|---|
| Adherent | Non-Users | |||
| Total Cholesterol | Overall | 6.5±2.2§ | 8.8±2.8§ | 0.528 |
| <30 | 2.4±4.0 | 9.7±4.4§ | 0.248 | |
| 30–35 | 15.1±3.4§ | 10.9±4.9§ | 0.493 | |
| ≥35 | 1.8±3.6 | 6.7±5.3 | 0.468 | |
| LDL Cholesterol | Overall | −0.2±1.9 | 2.2±2.5 | 0.475 |
| <30 | −5.7±3.8 | 1.6±4.1 | 0.210 | |
| 30–35 | 6.4±3.0§ | 2.6±4.3 | 0.481 | |
| ≥35 | −1.4±3.3 | 2.0±4.8 | 0.579 | |
| HDL Cholesterol | Overall | 6.7±0.7§ | 7.3±0.9§ | 0.619 |
| <30 | 6.7±1.2§ | 7.3±1.3§ | 0.750 | |
| 30–35 | 7.6±1.0§ | 8.2±1.5§ | 0.735 | |
| ≥35 | 5.6±1.1§ | 7.0±1.6§ | 0.501 | |
| Triglycerides | Overall | −0.9±5.6 | −7.1±7.4 | 0.517 |
| <30 | 17.5±11.4 | 6.9±12.5 | 0.548 | |
| 30–35 | 8.9±10.5 | 8.3±14.9 | 0.976 | |
| ≥35 | −26.4±7.3§ | −29.1±10.8§ | 0.844 | |
Significant differences shown in bold
The propensity score sample included 199 adherent (56 with BMI<30; 65 with BMI 30–35; 78 with BMI≥35) and 118 non-users (47 with BMI<30; 33 with BMI 30–35; 38 with BMI≥35)
p-values for PAP by BMI group interaction: p=0.557 for TC, p=0.500 for LDL, p=0.615 for HDL, p=0.563 for TG
p-value from ANCOVA comparing adherent and non-users within PS designed study, adjusted for PS subclass and baseline lipid level
Within group estimate of lipid change significantly (p<0.05) different from zero
BMI: body mass index; LDL: low-density lipoprotein; HDL: high-density lipoprotein; LS: least squares; SE: standard error
Figure 2.
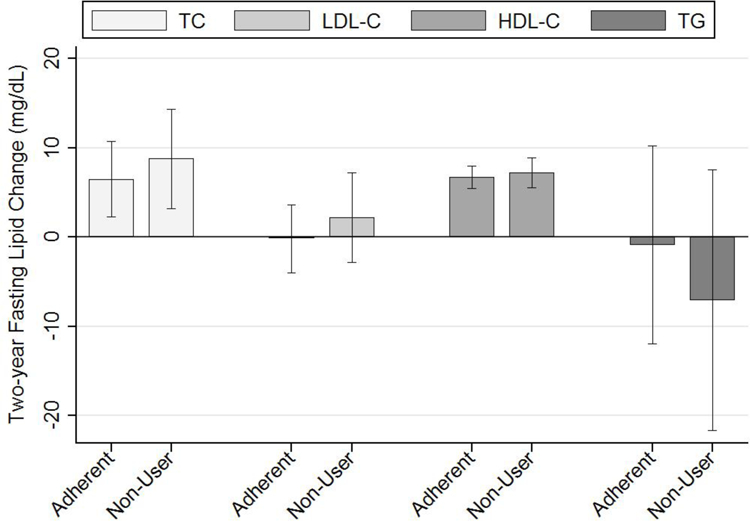
The mean and 95% confidence interval for two-year lipid changes (mg/dL) are shown for adherent and non-users, adjusted for PS subclass and baseline lipid level. We saw significant increases in total and HDL cholesterol over two years, but no change in LDL or triglycerides. There were no differences in two-year lipid changes between adherent and non-users. PAP: positive airway pressure; TC: total cholesterol; LDL-C: low-density lipoprotein cholesterol; HDL-C: high-density lipoprotein cholesterol; TG: triglycerides.
We examined differences in changes in the proportion of patients with abnormal lipid levels (Table E5); there were no differences between PAP adherent and non-users in the overall sample. Within BMI<30 subjects, the decrease in proportion of patients with abnormal HDL-C was greater in adherent compared to non-users (Table E5, p=0.024). The reason for this result is unclear, given no differences between PAP groups for mean HDL change (Table 4, p=0.750) or the proportion of patients near the abnormal HDL-C cut-point (p>0.46) in patients with BMI<30. We found no differences in the change in proportion abnormal between adherent and non-users for other BMI strata or lipid measures.
PAP Effect within Meaningful Subgroups
Patients with Abnormal Baseline Lipid Levels
We examined the patients exhibiting abnormal lipid levels at baseline, where we would expect the greatest PAP treatment effect. No group differences in fasting lipid changes were observed (Table E6). We found a PAP by BMI interaction for LDL-C change (p=0.041), likely driven by qualitative differences in the observed non-significant effects.
Patients with the Most Severe Hypoxia
To compare results with recent data from animal models,[9–11, 17–21] we limited our sample to patients in the top quartile of percent time SaO2<90%. No differences in fasting lipid changes between PAP adherent and non-users were observed (Table E7).
DISCUSSION
In a large cohort of moderate-to-severe OSA patients, this study used sub-classification by propensity score quintiles to minimize bias in the estimated differences between PAP adherent patients and non-users. This observational study design involved using an algorithm that selected patients without regard to outcome data, so that within sub-class, measured demographic and baseline variables achieved balance that was at least as good as that expected through randomization. Results do not support the hypothesis that PAP significantly impacts two-year changes in fasting lipid levels. Thus, increased risk of cardiovascular events and atherosclerosis in OSA patients is unlikely to be related to mechanisms involving the fasting lipid profile.
Despite evidence associating OSA with atherosclerotic cardiovascular disease,[1] and the relationship between dyslipidemia and atherosclerosis,[2] no definitive evidence points towards dyslipidemia as the mechanism linking OSA and atherosclerosis in humans.[3–16] We found no convincing association between OSA severity and fasting lipids, only a weak positive correlation between AHI and HDL-C, implying protection against atherosclerosis. Instead, we observed correlations between obesity and fasting lipids. Multiple obesity measures were positively correlated with triglycerides and negatively correlated with HDL-C, consistent with associations between obesity and “atherogenic dyslipidemia”, characterized by elevated triglycerides and decreased HDL-C and associated with cardiovascular risk.[30] We found significant, but weak, negative correlations between obesity and TC and LDL-C. Obesity is associated with reduced lipoprotein lipase (LPL) activity and increased production of very low density lipoprotein (VLDL).[30] Given the role of LPL in the conversion of VLDL into LDL-C, this reduced activity may explain these negative correlations with LDL, as well as the increased triglycerides.[31]
To our knowledge, our study is the longest to date exploring the relationship between PAP and fasting lipids. This manuscript focuses on the utility of propensity score methodologies in the principled design of observational studies, which substantially strengthens causal inference. These methods were used to select adherent patients and non-users with balance for measured covariates similar to that expected through randomization. Although balance is achieved for included variables, a limitation of the propensity score methodologies is the inability to address unobserved variables, which are theoretically controlled for in the context of a randomized controlled trial. While we recognize the potential for presently unknown or unmeasured confounders to influence results, we included as many relevant variables as possible. Given that unobserved confounders are controlled for to the degree that they are associated with included variables, including a large number of covariates reduces the likelihood of missing important confounders that are independent of measured variables.
We found no differences in two-year fasting lipid changes between PAP adherent patients and non-users. There is no definitive clinical evidence supporting lipid changes with PAP.[8–16] One randomized trial showing decreases in cholesterol was retracted.[32] Phillips et al[15] explored the effect of 2 months of PAP on postprandial lipidemia over 24 hours, observing decreased postprandial triglycerides and total cholesterol associated with PAP use, and a small corresponding decrease in HDL. We did not study postprandial lipids; it is possible that PAP use could have affected these. However, we note that Phillips et al[15] also observed no significant effect of PAP usage on fasting lipid levels, supporting our conclusions. Kohler et al[13] found that 2 weeks of PAP withdrawal was associated with a significant decrease in triglycerides compared to continued therapeutic PAP, as well as increased blood pressure and catecholamine levels.[13] Thus, over the short-term, there was no dyslipidemia produced by OSA.
Rodent models more convincingly demonstrate dyslipidemia proportional to duration and severity of CIH.[9–11, 17–21] Li et al[19] found increased fasting serum lipids in lean C57BL/6J mice exposed to 4 weeks of severe CIH (FiO2=5%); no change was observed with moderate CIH (FiO2=10%).[19] In an attempt to replicate this in humans, we restricted our sample to the top quartile of hypoxia severity, with little change in results (Table E7). Recent publications[20, 21] suggest CIH induces dyslipidemia and atherosclerosis by inhibiting clearance of triglyceride-rich lipoproteins (TRLP). In mice, CIH increases Angiopoietin-like 4 (Angptl4) expression in adipose tissue via up-regulation of hypoxia-inducible factor 1-alpha (HIF-1α).[20, 21] Increased Angptl4 inhibits activity of adipose LPL, inhibiting TRLP clearance and resulting in increased cholesterol and triglycerides.[20, 21] While nocturnal hypoxemia severity (but not BMI or AHI) correlated with Angptl4 mRNA levels in subcutaneous adipose tissue of obese bariatric surgery patients,[21] more research is needed to determine the relationship between Angptl4 and atherosclerosis in apneics. Conceivably, differences exist in molecular pathways between humans and mice. A mechanism other than dyslipidemia is suggested by Drager et al,[14] who observed no difference in lipid changes in severe OSA patients randomized to PAP versus no treatment, but decreases in carotid intima-media thickness and carotid-femoral pulse-wave velocity, early atherosclerosis markers.[14]
Twenty-four percent of our patients used lipid-lowering medications. Given their known efficacy, analyses were performed in patients not using these medications. Conceivably, the effect of OSA on fasting lipids might be most apparent in patients on lipid-lowering medications, but the effect is masked by medication use. However, we observed no differences in lipid changes between PAP adherent patients and non-users with abnormal lipids not using lipid-lowering medications (Table E6). Ultimately, in human populations with widespread screening for lipid abnormalities and use of lipid-lowering medications, whether OSA contributes to lipid levels may be unanswerable. Based on current results and previous publications, we conclude that, given widespread use of lipid-lowering medications, changes in fasting lipid levels are not the mechanism by which OSA contributes to cardiovascular risk.
Despite no relationship between PAP and fasting lipid changes, we observed effects on BMI and subjective sleepiness changes, as in previous publications.[33, 34] Adherent patients had an average increase in BMI of 1 kg/m2 over follow-up, compared to no change in non-users, confirming a recent report from the APPLES study.[33] While the mechanism causing increased BMI in PAP adherent patients in unclear, previous studies have suggested increased energy expenditure associated with OSA, and that PAP treatment reduces this expenditure.[33, 35, 36] Decreased energy expenditure among adherent patients, in the absence of increased exercise or dietary changes, could result in weight gain. Both PAP groups reported less subjective sleepiness at follow-up, but PAP adherent subjects had a significantly larger mean ESS decrease than non-users (4.0 vs. 2.5 points). Previous research with sham-CPAP showed reductions in subjective sleepiness attributed to a placebo effect.[34] While the reduction in sleepiness in our non-users is unexplained, it cannot be produced by a placebo effect.
Our study has strengths, but some limitations. The Icelandic population is a population of European descent and clinical practice in Iceland is identical to that in other countries. Results are expected to be generalizable to moderate-to-severe OSA patients of similar ethnicity. However, additional studies involving populations that include other ethnicities would be useful for increasing generalizability. The sample reflects the Icelandic population diagnosed with OSA, but consequently contains a relative lack of females. Our sample contained patients with moderate-to-severe OSA, and no control population, potentially limiting the ability to observe correlations between OSA severity and fasting lipids. However, PAP non-users provided a “control” sample for analyses of OSA treatment response. While patients were treated with PAP over two-years, the design of the cohort was such that adherence information was obtained over the period closest to follow-up. The reason for this was two-fold: 1) adherence information most proximal to the follow-up reassessments was believed to be the most relevant and 2) levels of compliance near the two-year follow-up are likely representative of overall adherence, as several publications have shown a significant relationship between early and long-term PAP compliance.[37–40] Detailed phenotyping allowed for assessment of various confounders, however, we cannot exclude the potential for unmeasured or unknown covariates to influence results.
We have shown how sub-classification by propensity scores strengthens the causal inferences permitted by the data. The approach allows simultaneous control for a greater number of covariates than multivariable regression. Compared to regression adjustment, propensity methods are applied at the design stage without access to outcome data, thereby reducing bias. Our approach was more inclusive of all real-world patients, a benefit compared to typical randomized trials, while addressing the challenge of selection bias by essentially reconstructing a stratified randomized design. Propensity score methodologies should be considered whenever non-randomized group comparisons are required, as advocated by the National Heart, Lung and Blood Institute.[23]
In conclusion, our study does not support a role for OSA in determining the fasting lipid profile. While dyslipidemia is a well-recognized atherosclerosis risk factor, our results suggest that changes in fasting lipids are not the mechanism for the increased atherosclerotic cardiovascular morbidity and mortality seen in OSA.
Supplementary Material
“Take Home” Message:
Fasting lipid changes likely do not cause increased cardiovascular risk in OSA, as they are unaffected by PAP treatment
Acknowledgements
We are grateful to Muredach Reilly and Daniel Rader for helpful discussions and to Sigrun Gudmundsdottir, Lovisa Gudmundsdottir, Magdalena Osk Sigurgunnarsdottir, Kristjan Andri Kristjansson, Erla Bjornsdottir, Bethany Staley, Matthew Thorne-Fitzgerald, Robert Hachadoorian and the Sleep Center staff at Landspitali – The National University Hospital of Iceland and the University of Pennsylvania, who helped assemble and analyze the data.
Funding
This work was supported by the National Institutes of Health (NIH) [grant number HL094307], the Eimskip Fund of the University of Iceland and the Landspitali University Hospital Science Fund.
Footnotes
Competing Interests
The authors declare no competing interests with regard to the submitted work. Dr. Arnardottir reports consulting fees from Nox Medical and Dr. Schwab reports consulting fees from ApniCure, both outside the scope of the submitted work.
REFERENCES
- 1.Pack AI, Gislason T. Obstructive sleep apnea and cardiovascular disease: a perspective and future directions. Prog Cardiovasc Dis 2009: 51(5): 434–451. [DOI] [PubMed] [Google Scholar]
- 2.Libby P, Ridker PM, Hansson GK. Progress and challenges in translating the biology of atherosclerosis. Nature 2011: 473(7347): 317–325. [DOI] [PubMed] [Google Scholar]
- 3.McArdle N, Hillman D, Beilin L, Watts G. Metabolic risk factors for vascular disease in obstructive sleep apnea: a matched controlled study. Am J Respir Crit Care Med 2007: 175(2): 190–195. [DOI] [PubMed] [Google Scholar]
- 4.Newman AB, Nieto FJ, Guidry U, Lind BK, Redline S, Pickering TG, Quan SF, Sleep Heart Health Study Research G. Relation of sleep-disordered breathing to cardiovascular disease risk factors: the Sleep Heart Health Study. Am J Epidemiol 2001: 154(1): 50–59. [DOI] [PubMed] [Google Scholar]
- 5.Chou YT, Chuang LP, Li HY, Fu JY, Lin SW, Yang CT, Chen NH. Hyperlipidaemia in patients with sleep-related breathing disorders: prevalence & risk factors. Indian J Med Res 2010: 131: 121–125. [PubMed] [Google Scholar]
- 6.Coughlin SR, Mawdsley L, Mugarza JA, Calverley PM, Wilding JP. Obstructive sleep apnoea is independently associated with an increased prevalence of metabolic syndrome. Eur Heart J 2004: 25(9): 735–741. [DOI] [PubMed] [Google Scholar]
- 7.Roche F, Sforza E, Pichot V, Maudoux D, Garcin A, Celle S, Picard-Kossovsky M, Gaspoz JM, Barthelemy JC, Group PS. Obstructive sleep apnoea/hypopnea influences high-density lipoprotein cholesterol in the elderly. Sleep Med 2009: 10(8): 882–886. [DOI] [PubMed] [Google Scholar]
- 8.Robinson GV, Pepperell JC, Segal HC, Davies RJ, Stradling JR. Circulating cardiovascular risk factors in obstructive sleep apnoea: data from randomised controlled trials. Thorax 2004: 59(9): 777–782. [DOI] [PMC free article] [PubMed] [Google Scholar]
- 9.Drager LF, Jun J, Polotsky VY. Obstructive sleep apnea and dyslipidemia: implications for atherosclerosis. Curr Opin Endocrinol Diabetes Obes 2010: 17(2): 161–165. [DOI] [PMC free article] [PubMed] [Google Scholar]
- 10.Adedayo AM, Olafiranye O, Smith D, Hill A, Zizi F, Brown C, Jean-Louis G. Obstructive sleep apnea and dyslipidemia: evidence and underlying mechanism. Sleep Breath 2012: doi: 10.1007/s11325-012-0760-9. [DOI] [PMC free article] [PubMed] [Google Scholar]
- 11.Drager LF, Polotsky VY, Lorenzi-Filho G. Obstructive sleep apnea: an emerging risk factor for atherosclerosis. Chest 2011: 140(2): 534–542. [DOI] [PMC free article] [PubMed] [Google Scholar]
- 12.Coughlin SR, Mawdsley L, Mugarza JA, Wilding JP, Calverley PM. Cardiovascular and metabolic effects of CPAP in obese males with OSA. Eur Respir J 2007: 29(4): 720–727. [DOI] [PubMed] [Google Scholar]
- 13.Kohler M, Stoewhas AC, Ayers L, Senn O, Bloch KE, Russi EW, Stradling JR. Effects of continuous positive airway pressure therapy withdrawal in patients with obstructive sleep apnea: a randomized controlled trial. Am J Respir Crit Care Med 2011: 184(10): 1192–1199. [DOI] [PubMed] [Google Scholar]
- 14.Drager LF, Bortolotto LA, Figueiredo AC, Krieger EM, Lorenzi GF. Effects of continuous positive airway pressure on early signs of atherosclerosis in obstructive sleep apnea. Am J Respir Crit Care Med 2007: 176(7): 706–712. [DOI] [PubMed] [Google Scholar]
- 15.Phillips CL, Yee BJ, Marshall NS, Liu PY, Sullivan DR, Grunstein RR. Continuous positive airway pressure reduces postprandial lipidemia in obstructive sleep apnea: a randomized, placebo-controlled crossover trial. Am J Respir Crit Care Med 2011: 184(3): 355–361. [DOI] [PubMed] [Google Scholar]
- 16.Steiropoulos P, Tsara V, Nena E, Fitili C, Kataropoulou M, Froudarakis M, Christaki P, Bouros D. Effect of continuous positive airway pressure treatment on serum cardiovascular risk factors in patients with obstructive sleep apnea-hypopnea syndrome. Chest 2007: 132(3): 843–851. [DOI] [PubMed] [Google Scholar]
- 17.Savransky V, Nanayakkara A, Li J, Bevans S, Smith PL, Rodriguez A, Polotsky VY. Chronic intermittent hypoxia induces atherosclerosis. Am J Respir Crit Care Med 2007: 175(12): 1290–1297. [DOI] [PMC free article] [PubMed] [Google Scholar]
- 18.Jun J, Polotsky VY. Sleep Disordered Breathing and Metabolic Effects: Evidence from Animal Models. Sleep Med Clin 2007: 2(2): 263–277. [DOI] [PMC free article] [PubMed] [Google Scholar]
- 19.Li J, Savransky V, Nanayakkara A, Smith PL, O’Donnell CP, Polotsky VY. Hyperlipidemia and lipid peroxidation are dependent on the severity of chronic intermittent hypoxia. J Appl Physiol 2007: 102(2): 557–563. [DOI] [PubMed] [Google Scholar]
- 20.Drager LF, Li J, Shin MK, Reinke C, Aggarwal NR, Jun JC, Bevans-Fonti S, Sztalryd C, O’Byrne SM, Kroupa O, Olivecrona G, Blaner WS, Polotsky VY. Intermittent hypoxia inhibits clearance of triglyceride-rich lipoproteins and inactivates adipose lipoprotein lipase in a mouse model of sleep apnoea. Eur Heart J 2012: 33(6): 783–790. [DOI] [PMC free article] [PubMed] [Google Scholar]
- 21.Drager LF, Yao Q, Hernandez KL, Shin MK, Bevans-Fonti S, Gay J, Sussan TE, Jun JC, Myers AC, Olivecrona G, Schwartz AR, Halberg N, Scherer PE, Semenza GL, Powell DR, Polotsky VY. Chronic intermittent hypoxia induces atherosclerosis via activation of adipose angiopoietin-like 4. Am J Respir Crit Care Med 2013: 188(2): 240–248. [DOI] [PMC free article] [PubMed] [Google Scholar]
- 22.D’Agostino RB Jr. Propensity scores in cardiovascular research. Circulation 2007: 115(17): 2340–2343. [DOI] [PubMed] [Google Scholar]
- 23.Lieu TA, Au D, Krishnan JA, Moss M, Selker H, Harabin A, Taggart V, Connors A, Lung CER. Comparative Effectiveness Research in Lung Diseases and Sleep Disorders Recommendations from the National Heart, Lung, and Blood Institute Workshop. Am J Respir Crit Care Med 2011: 184(7): 848–856. [DOI] [PMC free article] [PubMed] [Google Scholar]
- 24.Maislin G, Rubin DB. Design of Non-Randomized Medical Device Trials Based on Sub-Classification Using Propensity Score Quintiles, Topic Contributed Session on Medical Devices. Proceedings of the Joint Statistical Meetings 2010: 2182–2196.
- 25.Rubin DB. For Objective Causal Inference, Design Trumps Analysis. Ann Appl Stat 2008: 2(3): 808–840. [Google Scholar]
- 26.Arnardottir ES, Maislin G, Jackson N, Schwab RJ, Benediktsdottir B, Teff K, Juliusson S, Pack AI, Gislason T. The role of obesity, different fat compartments and sleep apnea severity in circulating leptin levels: the Icelandic Sleep Apnea Cohort study. Int J Obes (London) 2013: 37(6): 835–842. [DOI] [PMC free article] [PubMed] [Google Scholar]
- 27.Maislin G, Ahmed MM, Gooneratne N, Thorne-Fitzgerald M, Kim C, Teff K, Arnardottir ES, Benediktsdottir B, Einarsdottir H, Juliusson S, Pack AI, Gislason T, Schwab RJ. Single slice vs. volumetric MR assessment of visceral adipose tissue: reliability and validity among the overweight and obese. Obesity (Silver Spring) 2012: 20(10): 2124–2132. [DOI] [PMC free article] [PubMed] [Google Scholar]
- 28.National Cholesterol Education Program Expert Panel on Detection E, Treatment of High Blood Cholesterol in A. Third Report of the National Cholesterol Education Program (NCEP) Expert Panel on Detection, Evaluation, and Treatment of High Blood Cholesterol in Adults (Adult Treatment Panel III) final report. Circulation 2002: 106(25): 3143–3421. [PubMed] [Google Scholar]
- 29.Ahmed A, Husain A, Love TE, Gambassi G, Dell’Italia LJ, Francis GS, Gheorghiade M, Allman RM, Meleth S, Bourge RC. Heart failure, chronic diuretic use, and increase in mortality and hospitalization: an observational study using propensity score methods. Eur Heart J 2006: 27(12): 1431–1439. [DOI] [PMC free article] [PubMed] [Google Scholar]
- 30.Bamba V, Rader DJ. Obesity and atherogenic dyslipidemia. Gastroenterology 2007: 132(6): 2181–2190. [DOI] [PubMed] [Google Scholar]
- 31.Goldberg IJ. Lipoprotein lipase and lipolysis: central roles in lipoprotein metabolism and atherogenesis. J Lipid Res 1996: 37(4): 693–707. [PubMed] [Google Scholar]
- 32.Sharma SK, Agrawal S, Damodaran D, Sreenivas V, Kadhiravan T, Lakshmy R, Jagia P, Kumar A. Retraction: CPAP for the metabolic syndrome in patients with obstructive sleep apnea. N Engl J Med 2011;365:2277–86. N Engl J Med 2013: 369(18): 1770. [DOI] [PubMed] [Google Scholar]
- 33.Quan SF, Budhiraja R, Clarke DP, Goodwin JL, Gottlieb DJ, Nichols DA, Simon RD, Smith TW, Walsh JK, Kushida CA. Impact of Treatment with Continuous Positive Airway Pressure (CPAP) on Weight in Obstructive Sleep Apnea. J Clin Sleep Med 2013: 9(10): 989–993. [DOI] [PMC free article] [PubMed] [Google Scholar]
- 34.Jenkinson C, Davies RJ, Mullins R, Stradling JR. Comparison of therapeutic and subtherapeutic nasal continuous positive airway pressure for obstructive sleep apnoea: a randomised prospective parallel trial. Lancet 1999: 353(9170): 2100–2105. [DOI] [PubMed] [Google Scholar]
- 35.Kezirian EJ, Kirisoglu CE, Riley RW, Chang E, Guilleminault C, Powell NB. Resting energy expenditure in adults with sleep disordered breathing. Arch Otolaryngol Head Neck Surg 2008: 134(12): 1270–1275. [DOI] [PubMed] [Google Scholar]
- 36.Stenlof K, Grunstein R, Hedner J, Sjostrom L. Energy expenditure in obstructive sleep apnea: effects of treatment with continuous positive airway pressure. Am J Physiol 1996: 271(6 Pt 1): E1036–1043. [DOI] [PubMed] [Google Scholar]
- 37.Weaver TE, Grunstein RR. Adherence to Continuous Positive Airway Pressure Therapy: The Challenge to Effective Treatment. Proc Am Thorac Soc 2008:5(2):173–178. [DOI] [PMC free article] [PubMed] [Google Scholar]
- 38.Weaver TE, Kribbs NB, Pack AI, Kline LR, Chugh DK, Maislin G, Smith PL, Schwartz AR, Schubert NM, Gillen KA, Dinges DF. Night-to-night variability in CPAP use over the first three months of treatment. Sleep 1997:20(4):278–83. [DOI] [PubMed] [Google Scholar]
- 39.McArdle N, Devereux G, Heidarnejad H, Engleman HM, Mackay TW, Douglas NJ. Long-term use of CPAP therapy for sleep apnea/hypopnea syndrome. Am J Respir Crit Care Med 1999:159(4 pt 1):1108–1114. [DOI] [PubMed] [Google Scholar]
- 40.Budhiraja R, Parthasarathy S, Drake CL, Roth T, Sharief I, Budhiraja P, Saunders V, Hudgel DW. Early CPAP use identifies subsequent adherence to CPAP therapy. Sleep 2007:30(3):320–324. [PubMed] [Google Scholar]
Associated Data
This section collects any data citations, data availability statements, or supplementary materials included in this article.