Abstract
Objectives
To elicit patterns in pathogenic biofilm composition we characterized the oral microbiome present in patients with dentin caries in comparison to healthy subjects.
Methods
16S amplicon sequencing was used to analyse a total of 56 patients; 19 samples of carious dentin (pooled from at least three teeth) and 37 supragingival samples (pooled from three healthy tooth surfaces). Oral and periodontal status and socio-demographic parameters were recorded. Group assignment, smoking and further socio-demographic parameters were used as explanatory variables in the microbiome composition analysis.
Results
Overall, a total of 4,110,020 DNA high-quality sequences were yielded. Using a threshold of similarity >97% for assigning operational taxonomic units (OTU), a total of 1,537 OTUs were identified. PERMANOVA showed significant differences in microbiome composition between the groups caries/healthy (p = 0.001), smoking/non-smoking (p = 0.007) and fluoride intake during childhood yes/no (tablets p = 0.003, salt p = 0.023). The healthy microbiome had a significantly higher diversity (alpha diversity, p<0.001) and a lower dominance (Berger-Parker index, p<0.001). It was dominated by Fusobacteria. A linear discriminant analysis effect size (LEfSe) yielded a set of 39 OTUs being more abundant in carious dentin samples, including Atopobium spp. (14.9 log2FoldChange), Lactobacillus casei (11.6), Acinetobacter spp. (10.8), Lactobacillus gasseri (10.6), Parascardovia denticolens (10.5), Olsenella profusa (10.4), and others. Also Propionibacterium acidifaciens (7.2) and Streptococcus mutans (5.2) were overabundant in caries lesions.
Conclusions
The healthy microbiome was highly diverse. The advanced caries microbiome was dominated by a set of carious associated bacteria where S. mutans played only a minor role. Smoking and fluoride intake during childhood influenced the microbiome composition significantly.
Clinical significance
The presented investigation adds knowledge to the still not fully comprehended patterns of oral microbiomes in caries compared with oral health. By analysing the genetics of biofilm samples from oral health and severe tooth decay we found distinct discriminating species which could be targets for future therapeutic approaches.
Introduction
Microbiome analysis using Next Generation Sequencing (NGS) technology can unravel complex compositions of oral biofilms and so far helps finding non-culturable and “overlooked” bacteria [1–5]. Having insight into biofilm compositions at different sites and under various environmental or pathologic conditions is mandatory for further understanding of this extremely complex eco-system.
About 10 years ago, with the technological “OMICS”-breakthrough, Keijser et al. were the first to report on oral microbiome sequencing [6], subsequently presenting data on oral core microbiome composition [7]. Shortcomings of the first data sets were small sample size lacking representative character. The sequencing technologies then developed with impressive speed. Methodological shortcomings like DNA extraction and pre-amplification bias, sample contamination, and outcome effects by sequencing platforms and post-processing databases, are not yet solved, but improved. The enormous cost reduction made sequencing of large sample size possible.
For many decades, it was discussed whether mutans streptococci were the primary etiologic agent in cariology research, the “bad boys” of the caries process [8–10] or not. In recent years, molecular studies have unravelled that other genera, like Lactobacilli, Actinomyces, Bifidobacteria, Veillonella, Cutibacteria (formerly Propionibacteria) and Atopobia play significant roles in the pathology of dental caries, and hereby acting synergistically with or antagonistically against mutans streptococci [11–15]. Our research group previously detected Propionibacterium acidifaciens as being approximately 40-fold more abundant than Streptococcus mutans in deep caries samples [16]. Today, researchers widely agree that mutans streptococci serve as a good marker for disease, but not necessarily as the only and exclusive etiologic agent [17]. Also, the concept emerged that a healthy oral flora shows a rich and diverse homeostasis, which is narrowed down to a smaller range of a few outcompeting acidogenic and aciduric members in carious lesions [18].
Distinct patterns in healthy and diseased biofilm composition are yet to be determined. This complex research task is further challenged by the vast inter-individual differences in biofilm composition [19], which seem to get even more diffuse when biofilms enter a diseased stage. To gain a representative picture this study used comparably large cohorts of patients and evaluated the genetic composition of microbiome samples from healthy patients and patients with severely decayed teeth. Since caries is an ecologically driven disease [20], we recorded clinical and epidemiological parameters with a possible effect on microbiome composition, and used them for correlation analyses.
The hypothesis was that there would be differences in biofilm composition, diversity and dominance between healthy plaque and carious lesions.
Material and methods
Subject population
Adult subjects with severe dentin caries (n = 19) and caries-free controls (n = 37) were recruited consecutively from the Department of Conservative Dentistry at the University Clinic of Heidelberg between 2008 and 2016. Caries subjects required at least three dentin carious lesions and a DMFT>4. Caries-free subjects had to be free of caries for at least two years displaying a DMFT of 0–4. The recruited subjects were free of periodontal disease and any kind of systemic disease. The study protocol was approved by the Human Ethics Committee of the Medical Faculty of the University of Heidelberg (S-453/2007; S-079/2014). All subjects gave written informed consent. They underwent clinical examination to document the dental and periodontal status. Epidemiological data were taken from the patient records.
Sampling
Healthy subjects had to abstain from oral hygiene, mouth rinsing and chewing gum consumption for at least 24 hours prior to sampling. Before sampling was started, cotton rolls were placed in the oral cavity to avoid saliva contamination. On tooth sites with visible plaque, supragingival samples were swiped off using a sterile periodontal probe or curette. This was done from at least four different tooth surfaces in different locations of the mouth. Patients with at least three radiographically detectable dentin carious lesions were scheduled for restorative treatment. During this treatment, the carious lesions were isolated using rubber dam and then excavated with a spoon excavator or with a round bur at slow speed. Supragingival plaque from healthy subjects and carious dentin samples from diseased subjects were pooled, respectively, in a sterile, 1.5-ml micro centrifuge tube and frozen at -20°C. To avoid DNA degradation the samples were further processed as quickly as possible within a maximum of 7 days.
Isolation of bacterial DNA
Bacterial DNA was isolated following published protocols [21, 22] and by using a modification of the QIAamp DNA Mini Kit (Appendix D: protocols for bacteria; isolation of genomic DNA from gram-positive bacteria; Qiagen, Hilden, Germany).
Library preparation for next generation sequencing (NGS)
DNA was amplified using universal bacterial primers targeting the V4 region of the 16S rRNA gene (515F and 806R from [23]). Each primer was barcoded to assign the sequences to the samples. PCR reaction mix contained Q5 High-Fidelity 1X Master Mix (New England BiolabsGmbH, Germany), 0.5 μM of each primer, 2 μL of DNA, and sterile water for a final volume of 25 μL. The thermal reaction was as follows: The first denaturation at 94°C for 3 min, followed by 30 amplification cycles (94°C for 45 sec, 50°C for 1 min, and 72°C for 1 min 30 sec), and the final extension at 72°C for 10 minutes (cycler: Primus 25, Peqlab Biotechnologie GmbH, Germany or FlexCycler2, Analytik Jena AG, Germany). Proper negative controls were processed in parallel to control contamination using sterile water as template. PCR products were evaluated by agarose gel electrophoresis (2%) for presence of amplicons and then purified by using Agencourt AMPure XP beads (Beckman Coulter, Germany) according to the manufacturer’s instructions. Purified products were checked for quality and concentration using the Quant-iT PicoGreen dsDNA Assay Kit (ThermoFisher Scientific GmbH, Dreieich, Germany) and the Bioanalyzer (Agilent Technologies Inc., Böblingen, Germany). Equimolar mix of all the PCR products was then sent to GATC Biotech (Konstanz, Germany), which performed the ligation of the sequencing adapters to the library and the paired-end sequencing on an Illumina Miseq sequencing system with 250 cycles.
Analysis of sequences
Paired sequences were assembled with the following parameters: A minimum overlap of 100 nt and a maximum mismatch of 5 nt. Contigs were then filtered for quality; sequences with a quality score lower than 30 over 97% of the length were discarded. Each contig was assigned to the sample with the barcodes on both the right and left end (allowing no mismatch per barcode) using MOTHUR software [24]. Sequences were cleaned from ambiguity (no ambiguity allowed) and homopolymers (the maximum homopolymer length allowed: 8nt). Chimera detection was done by using the algorithm Uchime (Edgar et al. 2011). Clean sequences were subsampled to attain the same number of sequences for each sample (n = 4432), and Good’s estimator of coverage was calculated to ensure that coverage was sufficient. Sequences were clustered as Operational Taxonomic Units (OTU) (using a divergence threshold of 3%), and representative sequences were then classified at taxonomic levels by alignment with sequences from the Human Oral Microbiome Database (HOMD) (Bootstrap cut off at 80%).
Statistical analysis
Various indices were calculated from the microbiota data: alpha diversity (non-parametric Shannon index), richness (Chao1 richness estimate, number of OTUs observed), evenness (non-parametric Shannon index-based measure of evenness) and dominance (Berger-Parker index). Beta diversity was assessed by calculating distance matrices based on Morisita-Horn distances and visualized by Principal Coordinates Analysis (PCoA). A PERMANOVA analysis was performed to assess the statistical significance of differences in explanatory variables among samples or groups of samples. All assessed clinical and epidemiological parameters, (Table 1) related to either caries or health, were considered in the PERMANOVA analysis. To detect differentially abundant OTUs between groups, linear discriminant analysis (LDA) effect size (LEfSe) analysis was performed. All statistical analyses were performed with MOTHUR 1.33.0 [24] and R 3.1.2 [25].
Table 1. Descriptive statistics on age and gender of patients.
| Subjects | Gender | Age (years) | |||||||
|---|---|---|---|---|---|---|---|---|---|
| Female | Male | Mean | Median | Standard deviation | Minimum | Maximum | |||
| Group | Overall | 56 | 33 | 23 | 31.4 | 27.5 | 7.9 | 20.3 | 68.5 |
| Health | 37 | 26 | 11 | 28.4 | 26.9 | 4.6 | 22.0 | 52.0 | |
| Caries | 19 | 7 | 12 | 37.2 | 32.7 | 11.9 | 20.3 | 68.5 | |
Results
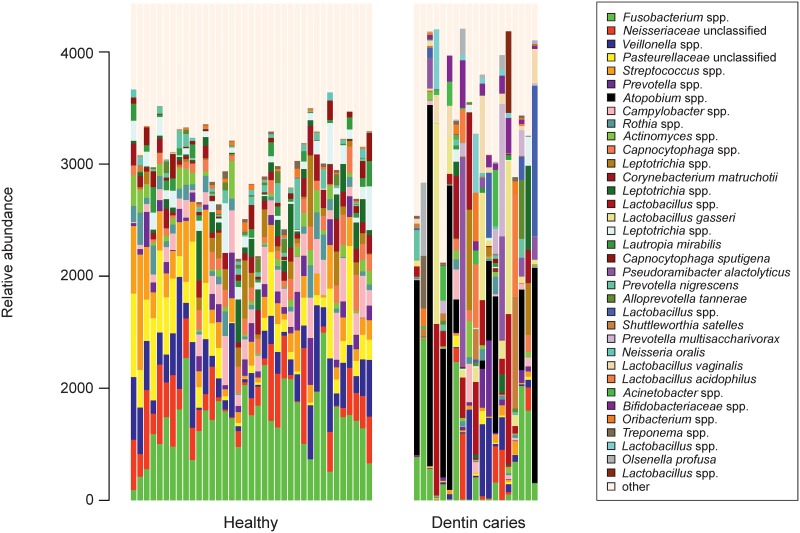
Thirty-three women and 23 men with a mean age of 31.4 years participated (for further parameters of the cohort see Table 1). Overall, 56 pooled oral samples were obtained from all participants yielding 4,110,020 DNA high-quality sequences. Using a distance-based similarity of >97% for operational taxonomic unit (OTU) assignment, a total of 1,537 OTUs were identified. The ten most abundant species detected among all samples were Fusobacterium spp., Neisseriaceae unclassified, Veillonella spp., Pasteurellaceae unclassified, Streptococcus spp., Prevotella spp., Atopobium spp., Campylobacter spp. Rothia spp., and Actinomyces spp. (Fig 1). The pattern of species distribution in healthy specimens seems well organized. In caries samples single and varying species dominate the individual samples in a seemingly random distribution (Fig 1).
Fig 1. Microbiome structure.
Microbiome structure of the 56 oral samples. Only the relative abundance of the 35 more abundant species are plotted, the rest are named “other”.
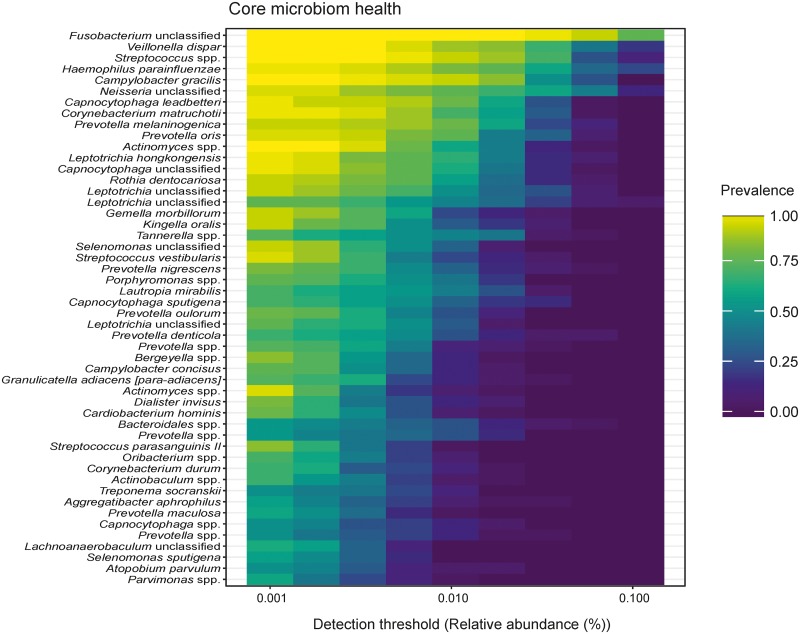
A heatmap of the healthy core microbiome (Fig 2) displays Fusobacteria unclassified, Veillonella dispar, Streptococcus spp., Haemophilus parainfluenzae, Campylobacter gracilis, Neisseria unclassified, Capnocytophaga leadbetteri, Corynebacteriuim matruchotii, Prevotella melaninogenica, and Prevotella oris as the ten most prevalent.
Fig 2. Heat map of the core microbiome in health.
The healthy core microbiome is displayed by a heat map that identifies Fusobacteria unclassified, Veillonella dispar, Streptococcus spp., Haemophilus parainfluenzae, Campylobacter gracilis, Neisseria unclassified, Capnocytophaga leadbetteri, Corynebacteriuim matruchotii, Prevotella melaninogenica, and Prevotella oris as the ten most prevalent species.
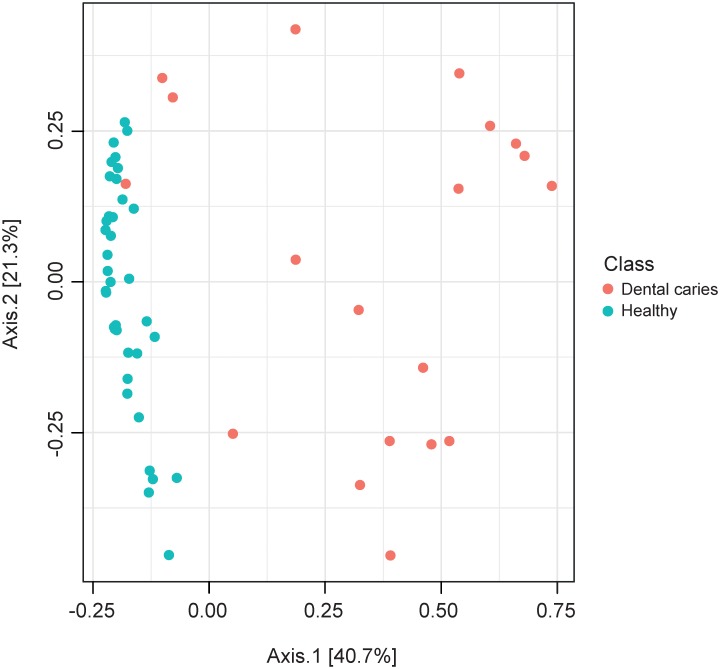
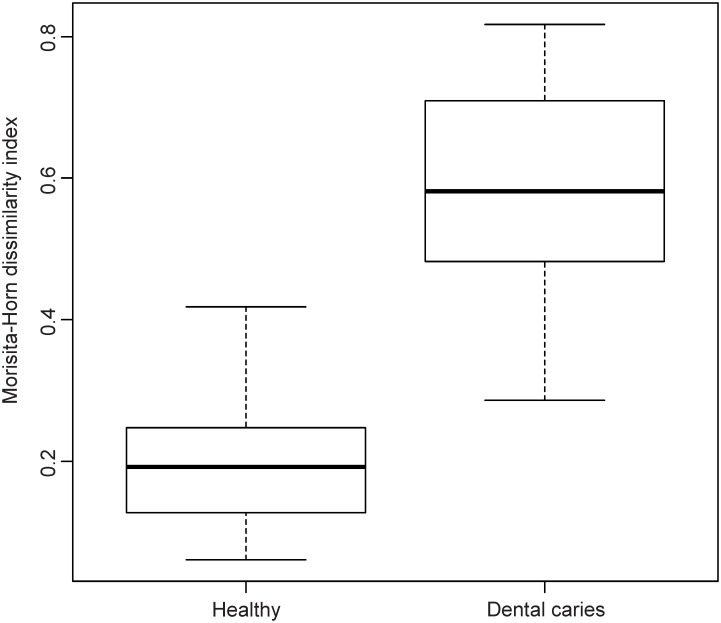
The similarity between microbiome structure of the specimens was studied by Principal Coordinates Analysis (PCoA) using the Morisita-Horn dissimilarity index. In the PCoA plot the healthy samples clustered homogenously due to higher composition similarity, whereas caries specimens scattered diffusely (Figs 3 and 4).
Fig 3. Similarity of microbiome composition.
Scatter plot of the Principal Coordinates Analysis (PCoA) using the Morisita-Horn dissimilarity index.
Fig 4. Similarity of microbiome composition.
Boxplots of Morisita-Horn distances.
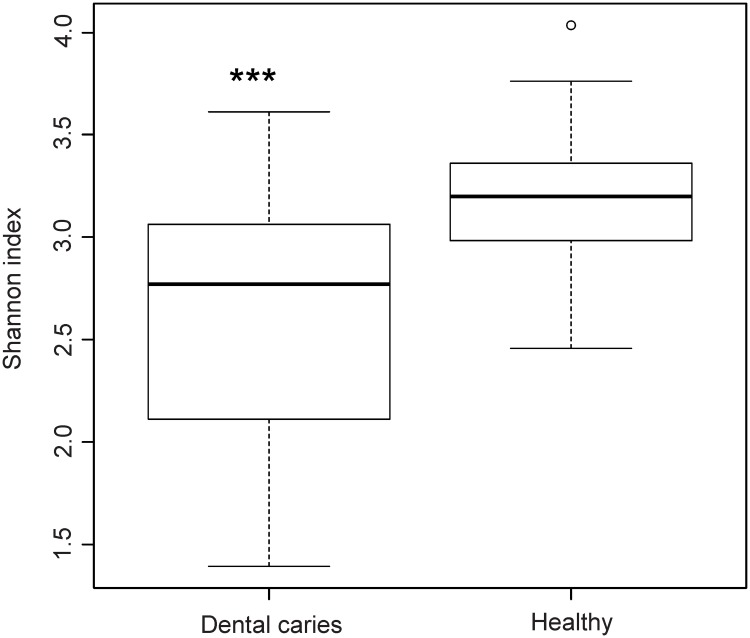
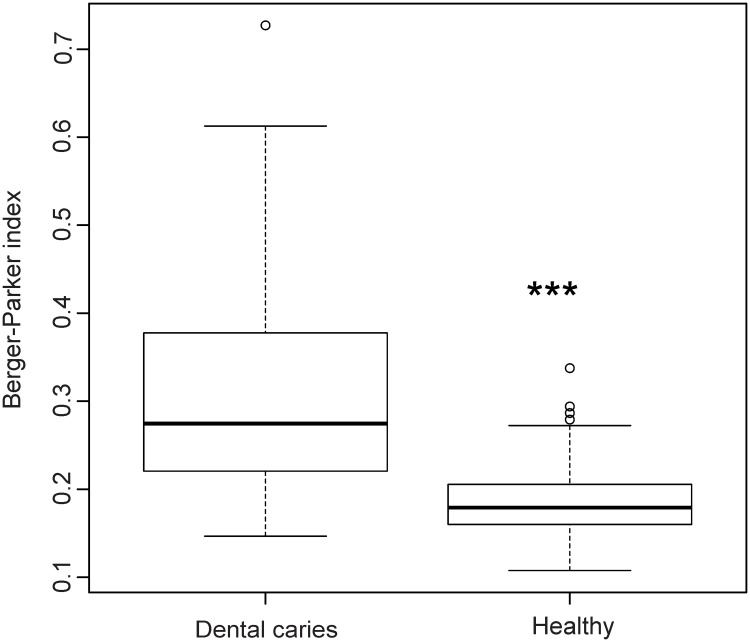
We then evaluated the effect of group assignment (caries vs. healthy) on microbial diversity (Non-parametric Shannon index) and on microbial dominance (Berger-Parker index). The Shannon index, which reflects a more diverse microbiota with increasing values, was significantly higher for the healthy samples. Berger-Parker evaluates the relative abundance of the dominant OTU. It can, therefore, be interpreted as a marker for biofilm dysbiosis allegorizing single species dominance in the environment. Our data displayed a highly significant difference in alpha diversity between the groups (p<0.001) and a significantly higher dominance in the diseased samples versus healthy samples (p<0.001) (Figs 5 and 6).
Fig 5. Microbial diversity.
Boxplot of the non-parametric Shannon index evaluating the effect of group assignment on microbial diversity.
Fig 6. Microbial dominance.
Boxplot of the Berger-Parker index evaluating the effect of group assignment on microbial dominance.
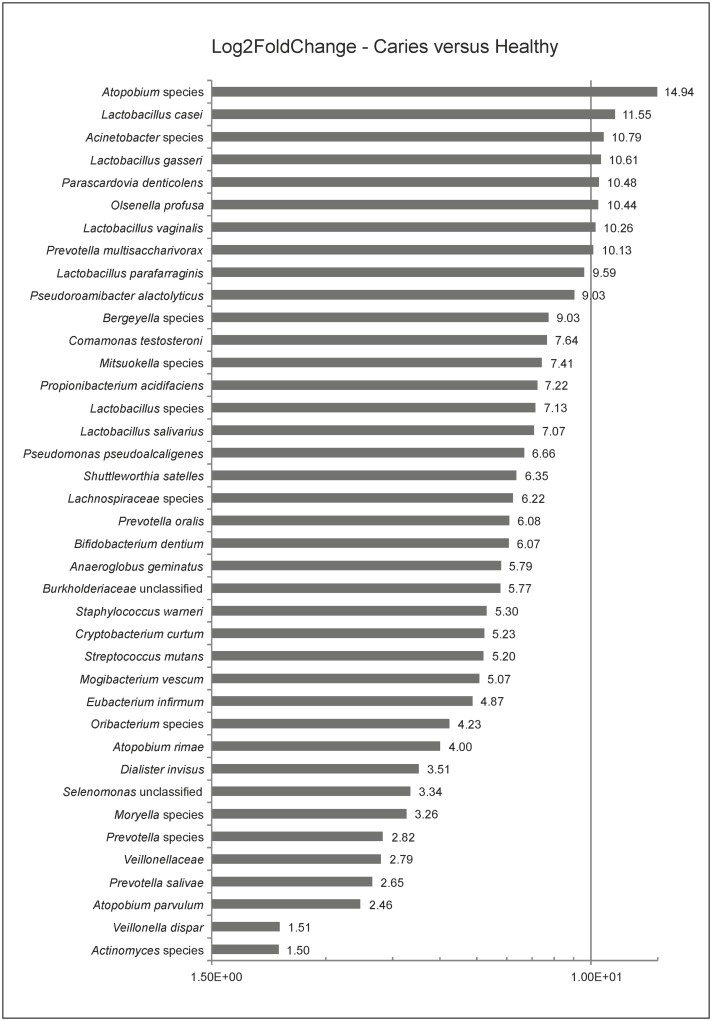
To screen for differences in microbiome compositions between the two groups, a linear discriminant analysis effect size (LEfSe) was used to test for differences in the OTUs’ abundances. LEfSe yielded a set of 39 species being significantly more abundant in caries specimens (Fig 7). The log2 fold change ratios of these overabundant species varied between 1.5 and 14.94 (p<0.001 for all representatives). The top overabundant members of the investigated caries community were Atopobium spp. (14.94), Lactobacillus casei (11.55), Acinetobacter spp. (10.79), Lactobacillus gasseri (10.61), Parascardovia denticolens (10.48), Olsenella profusa (10.44), Lactobacillus vaginalis (10.26), and Prevotella multisaccharivorax (10.13). Propionibacterium acidifaciens (7.22) and Streptococcus mutans (5.2) ranged in the middle segment of the fold change range (Fig 7).
Fig 7. Differences in microbiome composition.
Log2FoldChange bar charts of linear discriminant analysis effect size (LEfSe) using the distinctive parameter “class” to test for OUT differences.
Analyses of the influence clinical and socio-demographic parameters on the microbial structure were done by non-parametric multivariate statistical testing (PERMANOVA). Significant values were yielded for class (caries vs. healthy; p = 0.001), smoking (yes/no; p = 0.007), DMFT (p = 0.001), Dt (p = 0.001), Mt (p = 0.002), Ft (p = 0.001), and fluoride tablet and salt intake during childhood (p = 0.003, p = 0.023, respectively). The parameter “fluoride” represented the present use of fluoridated oral hygiene products. With p = 0.066 it was, compared with the other parameters, the one with the highest tendency towards significance (Table 2).
Table 2. Descriptive statistics.
| Factor | Df | SumsOfSqs | MeanSqs | F.Model | R2 (% of Variation Distance) | Pr(>F) | Code |
|---|---|---|---|---|---|---|---|
| Class (caries/healthy) | 1 | 3.71 | 3.71 | 23.35 | 0.30 | 0.001 | *** |
| Smoker (yes/no) | 1 | 0.74 | 0.74 | 3.48 | 0.06 | 0.007 | ** |
| Caries experience of parents (yes/no) | 1 | 0.34 | 0.34 | 1.54 | 0.03 | 0.146 | |
| Caries experience of siblings (yes/no) | 1 | 0.42 | 0.42 | 1.93 | 0.03 | 0.111 | |
| Dental visits per year | 1 | 0.14 | 0.14 | 0.64 | 0.01 | 0.649 | |
| DMFT | 1 | 3.20 | 3.20 | 19.05 | 0.26 | 0.001 | *** |
| Dt | 1 | 1.50 | 1.50 | 7.48 | 0.12 | 0.001 | *** |
| Mt | 1 | 1.78 | 1.78 | 9.14 | 0.14 | 0.002 | ** |
| Ft | 1 | 2.63 | 2.63 | 14.71 | 0.21 | 0.001 | *** |
| Fluoride tablets childhood (yes/no) | 1 | 0.91 | 0.91 | 4.34 | 0.07 | 0.003 | ** |
| Fluoride salt childhood (yes/no) | 1 | 0.65 | 0.65 | 3.00 | 0.05 | 0.023 | * |
| Dental hygiene (times/day) | 1 | 0.19 | 0.19 | 0.83 | 0.02 | 0.482 | |
| Dental hygiene (minutes/tooth brushing) | 1 | 0.25 | 0.25 | 1.10 | 0.02 | 0.353 | |
| Chlorhexidine use (yes/no) | 1 | 0.22 | 0.22 | 0.99 | 0.02 | 0.339 | |
| Fluoride use (yes/no) | 1 | 0.48 | 0.48 | 2.18 | 0.04 | 0.066 | . |
| Tea consumption (yes/no) | 1 | 0.36 | 0.36 | 1.62 | 0.03 | 0.163 | |
| Sugar intake (times/day) | 1 | 0.29 | 0.29 | 1.29 | 0.02 | 0.263 | |
| Whole food (yes/no) | 1 | 0.25 | 0.25 | 1.13 | 0.02 | 0.325 | |
| Vegetarian (yes/no) | 1 | 0.17 | 0.17 | 0.74 | 0.01 | 0.562 | |
| Use of chewing gum (yes/no) | 1 | 0.13 | 0.13 | 0.58 | 0.01 | 0.713 | |
| Use of xylitol (yes/no) | 1 | 0.06 | 0.06 | 0.26 | 0.00 | 0.937 | |
| Use of calcium containing products (yes/no) | 1 | 0.16 | 0.16 | 0.70 | 0.01 | 0.630 | |
| Use of probiotics (yes/no) | 1 | 0.25 | 0.25 | 1.13 | 0.02 | 0.324 |
Descriptive statistics on class, dental status and epidemiologic parameters; epidemiological parameters were gained by questionnaires; clinical data was extracted from records. Codes *, **, *** represent p≤0.05, 0.05>p<0.001, and p≤0.001, respectively.
LEfSe was also used to test for OTU differences between smokers and non-smokers yielding a set of four species being more abundant in smokers. Neisseria unclassified (Log2 fold change 4.26), Haemophilus parainfluenzae (2.57), Lautropia mirabilis (3.66), and Corynebacterium durum (3.38) were overabundant in smokers (p-values <0.000, for all). A correlation network analysis yielded strong correlation between a set of species and fluoride intake during childhood (Table 3). Correlation coefficients (Rho) ranged from 0.42 to 0.54 for the intake of fluoride salt and from 0.42 to 0.6 for the intake of fluoride tablets in childhood. A correlation of 40–60% (Rho 0.4–0.6) is considered to be strong.
Table 3. Correlation network analysis.
| Factor | Species | Rho | p-value |
|---|---|---|---|
| Fluoride salt intake during childhood | Haemophilus parainfluenzae | 0.42 | 0.001 |
| Streptococcus spp. | 0.54 | 0.000 | |
| Rothia dentocariosa | 0.46 | 0.000 | |
| Gemella morbillorum | 0.44 | 0.001 | |
| Granulicatella adiacens | 0.44 | 0.001 | |
| Actinobaculum spp. | 0.46 | 0.000 | |
| Fluoride tablet intake during childhood | Haemophilus parainfluenzae | 0.60 | 0.000 |
| Gemella morbillorum | 0.43 | 0.001 | |
| Alloprevotella spp. | 0.50 | 0.000 | |
| Bergeyella spp. | 0.42 | 0.001 | |
| Abiotrophia defectiva | 0.46 | 0.000 |
Results of the correlation network analysis yielded a correlation between two parameters and a set of species.
Discussion
The presented investigation adds data to the still not comprehended patterns of oral microbiome composition in caries compared with oral health [26]. By analysing biofilm samples from patients with oral health and patients with severe tooth decay we aimed at further describing “Who is there?” Furthermore, it was our interest to investigate how the clinical and epidemiological parameters relate to microbiome composition.
We found that the healthy microbiome displayed stable and repetitive character compared with the diseased ones. The healthy core community was dominated by Fusobacteria, Veillonella, Streptococcus spp., Haemophilus parainfluenzae, Campylobacter gracilis, Neisseria unclassified, Capnocytophaga leadbetteri, Corynebacteriuim matruchotii, Prevotella melaninogenica, Prevotella oris, and thus confirms literature data [7]. These bacteria, and Actinomyces as well were already shown to be relatively constant and abundant within and between individuals [27]. In this study, the health associated core microbiome was higher in alpha diversity. Conflicting data exists on this parameter in concordant studies [28–30], but also in deviant ones [31–33]. Clearly, species richness is high in a healthy oral environment and narrows down to few out-competing pathogens in the course of a disease. In caries, the degree of dominance of pathogens, however, does not only depend on the extent of the disease but also on environmental factors during disease progression. For example, Johannsson et al. found that absence of dental care in a Romanian cohort led to an overabundance of Streptococcus mutans in caries lesions when compared to a Swedish cohort with access to preventive measures [32]. Fluoride application and professional dental care can successfully target mutans streptococci, yet disease still occurs. Substituting pathogens emerge and benefit from this effect. The resulting dysbiotic microbiomes are not as uniformly dominated by traditional pathogens, but show higher pathogenic diversity [34].
In the present investigation, deep dentin lesions showed higher dominance, less diversity (Figs 3 and 4), and a set of carious associated bacteria where Streptococcus mutans played a role of only minor importance (Fig 7). Eriksson et al. have tried to classify Streptococcus mutans with the presence of accompanying bacterial species in a kind of Streptococcus mutans abundance model [35]. Low Streptococcus mutans was associated with the presence of Propionibacterium propionicum [35]. Propionibacteria are found at many sites of the human body, also in the mouth. There they seem to be associated with dentin caries, especially Propionibacterium propionicum [35] and Propionibacterium acidifaciens [16]. This seems plausible since Propionibacteria are Gram-positive, anaerobic and generally producing lactic acid, propionic acid, and acetic acid from glucose. The fact that they are proteolytic and co-aggregating with Lactobacillus species gives them a competitive advantage in deep lesions where the glucose supply is limited and proteins are more frequently available by collagen degradation. In the present data set Streptococcus mutans is only moderately overabundant whereas Propionibacterium acidifaciens and diverse Lactobacillus species are the dominating species. Referring to the model of Eriksson et al., we seem to have the predominantly low Streptococcus mutans–high Propionibacterium (and Lactobacillus) pattern. Obata et al. also found that in their caries samples of 32 Japanese patients aged 4–76 years more than half of the mean bacterial distributions of bacterial genera in carious dentin were Lactobacillus and Propionibacterium [36]. What was also notable in this study was that the main species of the genus Propionibacterium was Propionibacterium acidifaciens. The data was analysed regarding high, middle and low Lactobacillus abundance clusters. The bacterial composition pattern in the cluster with middle Lactobacillus abundance was composed of high proportions of Propionibacterium and Olsenella pointing to a possible co-aggregation [36]. By now, evidence is increasing that Streptococcus mutans is an effective pathogen and highly prevalent in initial lesions. However, with progression of disease, Streptococcus mutans cannot persist against the “truly acid-tolerant heavyweights” (e.g., certain Lactobacilli and others [37], which drive the pH to such low values that no longer can be tolerated by less aciduric isolates of mutans streptococci [26]. Similar to the healthy oral core microbiome, the mystery of a microbiome for late stage diseases is disclosed more and more.
The correlation network analysis of the present study evaluated a strong correlation between fluoride intake during childhood and specific biofilm species (Haemophilus parainfluenzae, Streptococcus spp., Rothia dentocariosa, Gemella morbillorum, Granulicatella adiacens, Alloprevotella spp., Bergeyella spp., and Abiotrophia defektiva) (Table 3). The PERMANOVA analysis yielded those parameters as significant in affecting the microbiome composition, whereas the present fluoride intake by oral hygiene products was not (Table 2). When looking closer at this seemingly disconcerting result, an explanatory approach could be the fact that developed and individually stable adult microbiomes can be resilient [38], also against effects of antimicrobial substances [39–41]. However, there is a proven cariostatic effect of topically applied fluorides. A recent in vitro study emphasized that this effect did not manifest via biofilm modification or growth, but via mechanisms of acid production inhibition, EPS (extracellular polysaccharides) volume decrease, and/or via a shift in the de/remineralization balance [42]. Interestingly, our data points at a possible biofilm modifying effect of fluorides, when taken in form of tablets and salt during childhood biofilm development; an effect, which might last throughout a person’s lifetime. So far there is no study known to the authors that would have investigated this hypothesis, and data interpretation must be done very cautiously. Further research and discussion on this hypothesis is clearly necessary.
Under critical review, the study has some limitations. First, the sample size of the carious group is smaller than that of the healthy group. Furthermore, we compared two different sample materials, plaque and carious dentin. However, the study concept was a cross-sectional juxta positioning of the most differing states (oral health vs. late stage of carious disease) in order to find the main discriminating patterns. Also, it could be criticized that we focused on mere genetic information with no data on the vitality and metabolism of the species detected. However, we see strengths in the very strictly standardized clinical sampling protocol with high effort to avoid contamination, in the use of evidence based processing protocols, and in the assessment of a wide range of clinical and epidemiological data from the evaluated cohort. The latter helped to integrate the microbiome data in a reasonable co-variable context.
Conclusion
The healthy oral core microbiome had a high alpha diversity, was stable and showed repetitive patterns of health representatives. Fusobacteria were the predominant species. Higher dominance and less diversity was seen in samples taken from individuals with advanced dentin caries, when compared with the oral microbiomes of caries-free individuals. Also, a set of caries associated bacteria was present. Lactobacilli were distinctly overabundant, Streptococcus mutans played a minor role. There might be an effect of fluoride intake during childhood on microbiome composition throughout life.
Acknowledgments
We are particularly grateful for the laboratory assistance given by Tanja Krueger and Tina Maxelon, for the clinical study support provided by Maria Inceoglu, and for the manuscript editing by Carmen Buckley.
Data Availability
Shared and taxonomy data used for analysis have been uploaded and are available in Figshare (https://figshare.com/s/74d3667a6d368eb8598b).
Funding Statement
The authors received no specific funding for this work.
References
- 1.Benn A, Heng N, Broadbent JM, Thomson WM. Studying the human oral microbiome: challenges and the evolution of solutions. Aust Dent J. 2018. March;63(1):14–24. 10.1111/adj.12565 . [DOI] [PubMed] [Google Scholar]
- 2.Siqueira JF Jr., Rocas IN. As-yet-uncultivated oral bacteria: breadth and association with oral and extra-oral diseases. J Oral Microbiol. 2013. May;5 10.3402/jom.v5i0.21077 . [DOI] [PMC free article] [PubMed] [Google Scholar]
- 3.Jiang Q, Liu J, Chen L, Gan N, Yang D. The Oral Microbiome in the Elderly With Dental Caries and Health. Front Cell Infect Microbiol. 2019. January;8:442 10.3389/fcimb.2018.00442 . [DOI] [PMC free article] [PubMed] [Google Scholar]
- 4.Hurley E, Barrett MPJ, Kinirons M, Whelton H, Ryan CA, Stanton C, et al. Comparison of the salivary and dentinal microbiome of children with severe-early childhood caries to the salivary microbiome of caries-free children. BMC Oral Health. 2019. January;19(1):13 10.1186/s12903-018-0693-1 . [DOI] [PMC free article] [PubMed] [Google Scholar]
- 5.Rupf S, Laczny CC, Galata V, Backes C, Keller A, Umanskaya N, et al. Comparison of initial oral microbiomes of young adults with and without cavitated dentin caries lesions using an in situ biofilm model. Sci Rep. 2018. September;8(1):14010 10.1038/s41598-018-32361-x . [DOI] [PMC free article] [PubMed] [Google Scholar]
- 6.Keijser BJ, Zaura E, Huse SM, van der Vossen JM, Schuren FH, Montijn RC, et al. Pyrosequencing analysis of the oral microflora of healthy adults. J Dent Res. 2008. November;87(11):1016–20. 10.1177/154405910808701104 . [DOI] [PubMed] [Google Scholar]
- 7.Zaura E, Keijser BJ, Huse SM, Crielaard W. Defining the healthy "core microbiome" of oral microbial communities. BMC Microbiol. 2009. December;9:259 10.1186/1471-2180-9-259 . [DOI] [PMC free article] [PubMed] [Google Scholar]
- 8.Loesche WJ. Role of Streptococcus mutans in human dental decay. Microbiol Rev 1986. December;50(4):353–80. . [DOI] [PMC free article] [PubMed] [Google Scholar]
- 9.Tanzer JM, Livingston J, Thompson AM. The microbiology of primary dental caries in humans. J Dent Educ. 2001. October;65(10):1028–37. . [PubMed] [Google Scholar]
- 10.Philip N, Suneja B, Walsh L. Beyond Streptococcus mutans: clinical implications of the evolving dental caries aetiological paradigms and its associated microbiome. Br Dent J. 2018. February;224(4):219–25. 10.1038/sj.bdj.2018.81 . [DOI] [PubMed] [Google Scholar]
- 11.Munson MA, Banerjee A, Watson TF, Wade WG. Molecular analysis of the microflora associated with dental caries. J Clin Microbiol. 2004. July;42(7):3023–9. 10.1128/JCM.42.7.3023-3029.2004 . [DOI] [PMC free article] [PubMed] [Google Scholar]
- 12.Chhour KL, Nadkarni MA, Byun R, Martin FE, Jacques NA, Hunter N. Molecular analysis of microbial diversity in advanced caries. J Clin Microbiol. 2005. February;43(2):843–9. 10.1128/JCM.43.2.843-849.2005 . [DOI] [PMC free article] [PubMed] [Google Scholar]
- 13.Becker MR, Paster BJ, Leys EJ, Moeschberger ML, Kenyon SG, Galvin JL, et al. Molecular analysis of bacterial species associated with childhood caries. J Clin Microbiol. 2002. March;40(3):1001–9. 10.1128/JCM.40.3.1001-1009.2002 . [DOI] [PMC free article] [PubMed] [Google Scholar]
- 14.Aas JA, Griffen AL, Dardis SR, Lee AM, Olsen I, Dewhirst FE, et al. Bacteria of dental caries in primary and permanent teeth in children and young adults. J Clin Microbiol. 2008. April;46(4):1407–17. 10.1128/JCM.01410-07 . [DOI] [PMC free article] [PubMed] [Google Scholar]
- 15.Al-Hebshi NN, Baraniya D, Chen T, Hill J, Puri S, Tellez M, et al. Metagenome sequencing-based strain-level and functional characterization of supragingival microbiome associated with dental caries in children. J Oral Microbiol. 2018. December 9;11(1):1557986 10.1080/20002297.2018.1557986 . [DOI] [PMC free article] [PubMed] [Google Scholar]
- 16.Wolff D, Frese C, Maier-Kraus T, Krueger T, Wolff B. Bacterial biofilm composition in caries and caries-free subjects. Caries Res. 2013;47(1):69–77. 10.1159/000344022 . [DOI] [PubMed] [Google Scholar]
- 17.Beighton D. The complex oral microflora of high-risk individuals and groups and its role in the caries process. Community Dent Oral Epidemiol. 2005. August;33(4):248–55. 10.1111/j.1600-0528.2005.00232.x . [DOI] [PubMed] [Google Scholar]
- 18.Filoche S, Wong L, Sissons CH. Oral biofilms: emerging concepts in microbial ecology. J Dent Res. 2010. January;89(1):8–18. 10.1177/0022034509351812 . [DOI] [PubMed] [Google Scholar]
- 19.Langfeldt D, Neulinger SC, Heuer W, Staufenbiel I, Kunzel S, Baines JF, et al. Composition of microbial oral biofilms during maturation in young healthy adults. PLoS One. 2014. February;9(2):e87449 10.1371/journal.pone.0087449 . [DOI] [PMC free article] [PubMed] [Google Scholar]
- 20.Anderson AC, Rothballer M, Altenburger MJ, Woelber JP, Karygianni L, Lagkouvardos I, et al. In-vivo shift of the microbiota in oral biofilm in response to frequent sucrose consumption. Sci Rep. 2018. September;8(1):14202 10.1038/s41598-018-32544-6 . [DOI] [PMC free article] [PubMed] [Google Scholar]
- 21.Martin FE, Nadkarni MA, Jacques NA, Hunter N. Quantitative microbiological study of human carious dentine by culture and real-time PCR: association of anaerobes with histopathological changes in chronic pulpitis. J Clin Microbiol. 2002. May;40(5):1698–704. 10.1128/JCM.40.5.1698-1704.2002 . [DOI] [PMC free article] [PubMed] [Google Scholar]
- 22.Nadkarni MA, Martin FE, Jacques NA, Hunter N. Determination of bacterial load by real-time PCR using a broad-range (universal) probe and primers set. Microbiology. 2002. January;148(Pt 1):257–66. 10.1099/00221287-148-1-257 . [DOI] [PubMed] [Google Scholar]
- 23.Caporaso JG, Lauber CL, Walters WA, Berg-Lyons D, Huntley J, Fierer N, et al. Ultra-high-throughput microbial community analysis on the Illumina HiSeq and MiSeq platforms. ISME J. 2012. August;6(8):1621–4. 10.1038/ismej.2012.8 . [DOI] [PMC free article] [PubMed] [Google Scholar]
- 24.Schloss PD, Westcott SL, Ryabin T, Hall JR, Hartmann M, Hollister EB, et al. Introducing mothur: open-source, platform-independent, community-supported software for describing and comparing microbial communities. Appl Environ Microbiol. 2009. December;75(23):7537–41. 10.1128/AEM.01541-09 . [DOI] [PMC free article] [PubMed] [Google Scholar]
- 25.R Development Core Team. R: A Language and Environment for Statistical Computing. Vienna: R Foundation for Statistical Computing: Vienna, Austria; 2014.
- 26.Burne RA. Getting to Know "The Known Unknowns": Heterogeneity in the Oral Microbiome. Adv Dent Res. 2018. February;29(1):66–70. 10.1177/0022034517735293 . [DOI] [PMC free article] [PubMed] [Google Scholar]
- 27.Utter DR, Mark Welch JL, Borisy GG. Individuality, Stability, and Variability of the Plaque Microbiome. Front Microbiol. 2016. April;7:564 10.3389/fmicb.2016.00564 . [DOI] [PMC free article] [PubMed] [Google Scholar]
- 28.Gross EL, Beall CJ, Kutsch SR, Firestone ND, Leys EJ, Griffen AL. Beyond Streptococcus mutans: dental caries onset linked to multiple species by 16S rRNA community analysis. PLoS One. 2012;7(10):e47722 10.1371/journal.pone.0047722 . [DOI] [PMC free article] [PubMed] [Google Scholar]
- 29.Belstrom D, Fiehn NE, Nielsen CH, Holmstrup P, Kirkby N, Klepac-Ceraj V, et al. Altered bacterial profiles in saliva from adults with caries lesions: a case-cohort study. Caries Res. 2014;48(5):368–75. 10.1159/000357502 . [DOI] [PubMed] [Google Scholar]
- 30.Xiao C, Ran S, Huang Z, Liang J. Bacterial Diversity and Community Structure of Supragingival Plaques in Adults with Dental Health or Caries Revealed by 16S Pyrosequencing. Front Microbiol. 2016. July;7:1145 10.3389/fmicb.2016.01145 . [DOI] [PMC free article] [PubMed] [Google Scholar]
- 31.Zhou J, Jiang N, Wang Z, Li L, Zhang J, Ma R, et al. Influences of pH and Iron Concentration on the Salivary Microbiome in Individual Humans with and without Caries. Appl Environ Microbiol. 2017. February;83(4). 10.1128/AEM.02412-16 . [DOI] [PMC free article] [PubMed] [Google Scholar]
- 32.Johansson I, Witkowska E, Kaveh B, Lif Holgerson P, Tanner AC. The Microbiome in Populations with a Low and High Prevalence of Caries. J Dent Res. 2016. January;95(1):80–6. 10.1177/0022034515609554 . [DOI] [PMC free article] [PubMed] [Google Scholar]
- 33.Griffen AL, Beall CJ, Campbell JH, Firestone ND, Kumar PS, Yang ZK, et al. Distinct and complex bacterial profiles in human periodontitis and health revealed by 16S pyrosequencing. ISME J. 2012. June;6(6):1176–85. 10.1038/ismej.2011.191 . [DOI] [PMC free article] [PubMed] [Google Scholar]
- 34.Richards VP, Alvarez AJ, Luce AR, Bedenbaugh M, Mitchell ML, Burne RA, et al. Microbiomes of Site-Specific Dental Plaques from Children with Different Caries Status. Infect Immun. 2017. July;85(8). 10.1128/IAI.00106-17 . [DOI] [PMC free article] [PubMed] [Google Scholar]
- 35.Eriksson L, Lif Holgerson P, Esberg A, Johansson I. Microbial Complexes and Caries in 17-Year-Olds with and without Streptococcus mutans. J Dent Res. 2018. March;97(3):275–82. 10.1177/0022034517731758 . [DOI] [PubMed] [Google Scholar]
- 36.Obata J, Takeshita T, Shibata Y, Yamanaka W, Unemori M, Akamine A, et al. Identification of the microbiota in carious dentin lesions using 16S rRNA gene sequencing. PLoS One. 2014. August;9(8):e103712 10.1371/journal.pone.0103712 . [DOI] [PMC free article] [PubMed] [Google Scholar]
- 37.Zheng J, Wu Z, Niu K, Xie Y, Hu X, Fu J, et al. Microbiome of Deep Dentinal Caries from Reversible Pulpitis to Irreversible Pulpitis. J Endod. 2019. March;45(3):302–9 e1. 10.1016/j.joen.2018.11.017 . [DOI] [PubMed] [Google Scholar]
- 38.Rosier BT, Marsh PD, Mira A. Resilience of the Oral Microbiota in Health: Mechanisms That Prevent Dysbiosis. J Dent Res. 2018. April;97(4):371–80. 10.1177/0022034517742139 . [DOI] [PubMed] [Google Scholar]
- 39.Koopman JE, van der Kaaij NC, Buijs MJ, Elyassi Y, van der Veen MH, Crielaard W, et al. The Effect of Fixed Orthodontic Appliances and Fluoride Mouthwash on the Oral Microbiome of Adolescents—A Randomized Controlled Clinical Trial. PLoS One. 2015. September;10(9):e0137318 10.1371/journal.pone.0137318 . [DOI] [PMC free article] [PubMed] [Google Scholar]
- 40.Reilly C, Rasmussen K, Selberg T, Stevens J, Jones RS. Biofilm community diversity after exposure to 0.4% stannous fluoride gels. J Appl Microbiol. 2014. December;117(6):1798–809. 10.1111/jam.12655 . [DOI] [PMC free article] [PubMed] [Google Scholar]
- 41.Reilly C, Goettl M, Steinmetz M, Nikrad J, Jones RS. Short-term effects of povidone iodine and sodium fluoride therapy on plaque levels and microbiome diversity. Oral Dis. 2016. March;22(2):155–61. 10.1111/odi.12407 . [DOI] [PubMed] [Google Scholar]
- 42.Thurnheer T, Belibasakis GN. Effect of sodium fluoride on oral biofilm microbiota and enamel demineralization. Arch Oral Biol. 2018. May;89:77–83. 10.1016/j.archoralbio.2018.02.010 . [DOI] [PubMed] [Google Scholar]
Associated Data
This section collects any data citations, data availability statements, or supplementary materials included in this article.
Data Availability Statement
Shared and taxonomy data used for analysis have been uploaded and are available in Figshare (https://figshare.com/s/74d3667a6d368eb8598b).


