

Abstract
Background:
Insulin resistance is implicated in Alzheimer’s disease (AD), whereas intranasal insulin is an experimental treatment in clinical trials. We previously proposed insulin signaling mediators in plasma neuronal-enriched extracellular vesicles (EVs) as biomarkers of brain insulin resistance.
Objective:
We sought to demonstrate the capacity of neuronal-enriched EV biomarkers to demonstrate target engagement in response to intranasal insulin and their ability to track treatment-associated cognitive changes in AD.
Methods:
We isolated neuronal-enriched EVs from plasma samples of participants with amnestic mild cognitive impairment or probable AD involved in a 4-month duration placebo-controlled clinical trial of 20 or 40IU intranasal insulin. We measured insulin signaling mediators as biomarkers and examined treatment-associated changes and their relationship with cognitive performance (ADAS-Cog).
Results:
There were no EV biomarker changes from baseline in any of the treatment groups. In participants treated with 20 IU insulin, EV biomarkers of insulin resistance (pS312-IRS-1, pY-IRS-1) showed strong positive correlations with ADAS-Cog changes, especially in ApoE ε4 non-carriers.
Conclusion:
Neuronal EV biomarkers of insulin resistance (pS312-IRS-1, pY-IRS-1) were associated with cognitive changes in response to low dose intranasal insulin suggesting engagement of the insulin cascade in neurons of origin.
Keywords: Alzheimer’s disease, biomarkers, brain insulin resistance, extracellular vesicles, exosomes, intranasal insulin
INTRODUCTION
Extracellular vesicles (EVs) are gaining interest in neurodegenerative diseases due to their implication in disease pathogenesis and as a source of biomarkers [1]. EVs released by all cells circulate in peripheral blood. The pathways leading to EV biogenesis (exosomes originating from the endosomal system and microvesicles originating from plasma membrane budding) result in EVs expressing surface markers reflecting their cellular origin [1–3]. Immunoprecipitation against L1 neural cell adhesion molecule (L1CAM) has enabled us to isolate a fraction of plasma EVs enriched for neuronal origin [2]. In multiple case-control studies, we showed that plasma neuronal-enriched EVs provide biomarkers for Alzheimer’s disease (AD) [4–9] including intra-cellular signaling molecules typically undetectable in plasma and potentially reflecting abnormalities in neuronal metabolism [2, 10, 11].
In the brain, insulin modulates glucose utilization, but also neuronal development, synaptic transmission, and neuroprotection [12], whereas insulin resistance impairs learning and memory and increases neurodegenerative disease risk [12, 13]. Extensive evidence points to brain insulin resistance as a key factor in AD pathogenesis [14–16] impacting both amyloid-β (Aβ) and tau processing [14, 17] as well as glucose metabolism [18]. Disturbed insulin signaling is a mechanism by which soluble Aβ modulates tau phosphorylation [19], whereas Aβ oligomers induce both tau phosphorylation and insulin receptor substrate-1 (IRS-1) inactivation raising the possibility of a pathogenic feed-forward loop [20]. Consequently, brain insulin resistance has been the target of multiple interventions in clinical trials including intranasal insulin. Intranasal insulin rapidly reaches the brain via olfactory and trigeminal perivascular channels and olfactory bulb axonal transport [21, 22]. Two placebo-controlled clinical trials in participants with mild cognitive impairment/early AD have shown that intranasal insulin improves cognition [21, 23].
In light of these findings, in this study, we investigated whether intranasal insulin engages the insulin signaling cascade as reflected on neuronal-enriched EV cargo. We blindly analyzed plasma samples from the Study of Nasal Insulin in the Fight Against Forgetfulness (SNIFF120), which showed positive changes in cognition and brain glucose metabolism in AD [23]. The molecular basis of brain insulin resistance is deficient signal propagation downstream of the binding of insulin to its receptor, particularly at the levels of the insulin receptor substrate-1 (IRS-1) [24, 25]. We previously detected higher Ser312-phosphorylated IRS-1 (pS312-IRS-1) and lower (panTyr) pY-IRS-1 (jointly suggestive of insulin resistance) in plasma neuronal-enriched EVs of AD patients [6] and showed them to be associated with brain atrophy [26]. We also found multiple insulin signaling cascade mediators downstream of IRS-1 to be highly expressed in plasma neuronal-enriched EVs, raising the possibility that they may also be used as biomarkers [2]. Moreover, we previously demonstrated that IRS-1 in neuronal-enriched EVs responds to a dietary intervention [11] and to exenatide treatment in a clinical trial in Parkinson’s disease [27]. Therefore, to assess whether intranasal insulin in SNIFF engaged the insulin signaling cascade using neuronal-enriched EVs, we measured total IRS-1 (t-IRS-1) and its phospho-types (pY-IRS-1, pS312-IRS-1, pS616-IRS-1) before and after intranasal insulin treatment. We hypothesized that, if intranasal insulin engages the insulin cascade, EV IRS-1 changes in response to it (and, secondarily, changes in downstream mediators) would be associated with a change in cognition. Secondarily, in an exploratory manner, we measured phosphorylated levels of downstream canonical route mediators (p-AKT, p-GSK3β), alternate route mediators (p-ERK1/2, p-JNK, and p-p38 MAPK) and mTOR pathway mediators (t-mTOR, p-mTOR, p-p70S6K, p-S6RP) (Fig. 1 depicts the relevant members of the insulin cascade).
Fig. 1.
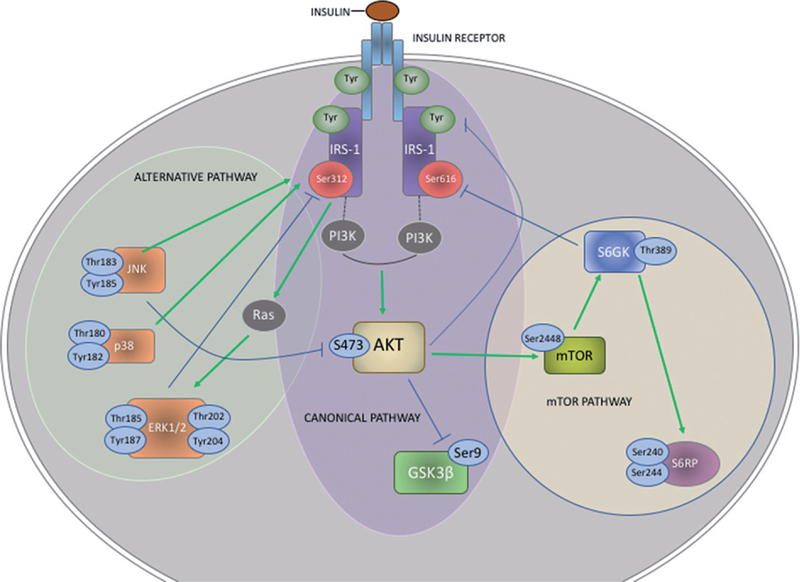
Insulin signaling pathways. Signaling downstream of the insulin receptor and its adaptor molecule (IRS-1) unfolds in two divergent routes: the canonical route involving activation of phospho-inositide-3 kinase (PI3K) and protein kinase B (PKB or else AKT); and the alternative route involving activation of mitogen-activated protein kinases (MAPK) [45]. Activated AKT deactivates glycogen synthase kinase 3 beta (GSK3β) and activates mammalian target of rapamycin complex 1 (mTORC1) [46, 47] and its downstream mediators, ribosomal protein (S6RP) and S6 kinase beta-1 (p70S6K) [48, 49]. The alternative route involves the conventional MAPK mediator extracellular signalregulated kinase 1 and 2 (ERK1/2) [50, 51], p38 and c-JUN N-terminal kinase (JNK). In addition, negative regulation of signal propagation relies on serine/threonine phosphorylation of insulin receptor and IRS-1 by JNK and protein kinases including GSK3β and p70S6K [52, 53]. We highlight phosphorylation sites that were measured in circulating EVs in this study. Green arrows represent activating phosphorylations, whereas blue lines represent inhibitory phosphorylations and negative feed-back loops. States of perpetual insulin receptor activation induce aberrant Ser/Thr phosphorylations on IRS-1, AKT and GSK3β.
MATERIALS AND METHODS
Participants and study design
We used plasma samples from SNIFF120 (NCT00438568), a Phase II randomized double-blind placebo-controlled clinical trial, in which 35 participants with AD and 56 participants mild cognitive impairment (total of 91, Table 1) received intranasal administrations of either 20 or 40 IU of insulin or placebo (saline) daily for 4 months [23]. Morning blood samples were obtained after a 12 h fast and participants were assessed with Mini-Mental State Examination test (MMSE) [28] and the Alzheimer’s Disease Assessment Scale for Cognition (ADAS-Cog) [29] at baseline and after four months.
Table 1.
Demographics, baseline and outcome characteristics of SNIFF120 Study participants included in this study
| Baseline characteristics of the study cohort | ||||||||||
| Placebo (n = 26) | 20 IU Insulin (n = 33) | 40 IU Insulin (n = 32) | p-value | |||||||
| Sex, n (%) | ||||||||||
| Male | 11 (42.3) | 12 (36.4) | 12 (37.5) | |||||||
| Female | 15 (57.7) | 21 (63.6) | 20 (62.5) | 0.899 | ||||||
| APOE ε4 carriers, % of patients | ||||||||||
| No | 46 | 55 | 56 | |||||||
| Yes | 50 | 45 | 44 | 0.813 | ||||||
| Diagnosis, % of patients | ||||||||||
| aMCI | 69 | 55 | 63 | |||||||
| AD | 31 | 45 | 38 | 0.511 | ||||||
| Age, y (mean, SD) | 76.2 (9.06) | 70.9 (6.83) | 69.6 (9.13) | 0.016* | ||||||
| MMSE (mean, SD) | 85.0 (13.56) | 83.64 (14.15) | 84.31 (15.44) | 0.951 | ||||||
| ADAS-Cog adjusted # (mean, SD) | 1.93 (0.13) | 2.21 (0.12) | 2.2 (0.12) | |||||||
| ADAS-Cog (median, P25, P75) | 8.3 | 5.8 | 12.8 | 9.3 | 6.0 | 14.5 | 8.3 | 5.7 | 13.3 | 0.843 |
| EV biomarkers at baseline | ||||||||||
| Median (P50) |
P25 | P75 | Median (P50) |
P25 | P75 | Median (P50) |
P25 | P75 | ||
| pS312-IRS-1 (AU) | 765.0 | 319.0 | 1308.0 | 548.0 | 310.5 | 1816.0 | 479.0 | 264.0 | 1242.0 | 0.441 |
| pY-IRS-1 (AU) | 194.0 | 119.3 | 289.0 | 171.0 | 138.5 | 310.0 | 168.5 | 130.3 | 264.5 | 0.825 |
| pS616-IRS-1 (AU) | 902.5 | 443.5 | 1798.6 | 960.5 | 624.8 | 1669.3 | 826.5 | 629.5 | 1163.3 | 0.747 |
| total IRS-1 (AU) | 225.5 | 102.3 | 732.4 | 216.0 | 129.8 | 991.5 | 330.8 | 114.8 | 855.9 | 0.662 |
| pS473-AKT (AU) | 138.0 | 120.8 | 176.3 | 168.0 | 128.0 | 230.5 | 165.0 | 136.0 | 212.0 | 0.088 |
| p-GSK3β (AU) | 152.0 | 130.0 | 196.3 | 176.0 | 139.5 | 216.5 | 170.5 | 142.5 | 209.5 | 0.434 |
| p-p70S6K (AU) | 138.0 | 119.5 | 180.3 | 178.0 | 129.0 | 235.5 | 168.0 | 139.3 | 206.0 | 0.154 |
| p-S6RP (AU) | 137.0 | 124.0 | 169.3 | 159.0 | 135.0 | 202.5 | 170.0 | 129.3 | 191.8 | 0.205 |
| m-TOR (AU) | 138.5 | 115.9 | 280.4 | 172.0 | 139.0 | 403.5 | 181.5 | 124.9 | 371.3 | 0.340 |
| pm-TOR (AU) | 226.0 | 175.8 | 361.5 | 277.0 | 207.5 | 578.5 | 330.0 | 192.5 | 500.0 | 0.217 |
| EV concentration (particles / ml) mean, SD | 2.80E11 (1.56E11) | 2.98E11 (1.50E11) | 3.04E11 (1.79E11) | 0.354 | ||||||
| Size mean (nm) mean, SD | 228 (25) | 224 (28) | 223 (28) | 0.582 | ||||||
| Size mode (nm) mean, SD | 178 (18) | 175 (20) | 178 (21) | 0.818 | ||||||
| Characteristics of the study cohort at 4 months | ||||||||||
| Placebo (n = 26) | 20 IU Insulin (n = 33) | 40 IU Insulin (n = 32) | p-value | |||||||
| ADAS-cog adjusted # (mean, SD) | 2.11 (0.13) | 2.27 (0.11)** | 2.31 (0.11)** | |||||||
| ADAS-cog (median, P25, P75) | 9.7 | 6.3 | 13.7 | 10.3 | 7.4 | 13.9 | 8.7 | 6.8 | 16.2 | |
| EV biomarkers at 4 months | ||||||||||
| Median (P50) |
P25 | P75 | Median (P50) |
P25 | P75 | Median (P50) |
P25 | P75 | ||
| pS312-IRS-1 (AU) | 606.0 | 390.0 | 1224.5 | 699.0 | 325.5 | 2195.0 | 599.5 | 251.3 | 1365.5 | 0.507 |
| pY-IRS-1 (AU) | 182.0 | 137.0 | 295.0 | 191.0 | 149.0 | 317.0 | 191.0 | 136.3 | 280.3 | 0.798 |
| pS616-IRS-1 (AU) | 938.5 | 494.3 | 1936.1 | 985.0 | 509.0 | 1701.8 | 845.3 | 526.6 | 1250.5 | 0.705 |
| total IRS-1 (AU) | 262.5 | 98.3 | 607.5 | 360.0 | 118.0 | 1172.0 | 316.3 | 125.3 | 744.3 | 0.560 |
| pS473-AKT (AU) | 133.5 | 124.8 | 180.8 | 164.0 | 147.0 | 224.5 | 175.0 | 130.5 | 197.0 | 0.033* |
| p-GSK3β (AU) | 150.5 | 136.3 | 187.8 | 175.0 | 154.5 | 225.0 | 170.0 | 142.0 | 203.8 | 0.128 |
| p-p70S6K (AU) | 140.0 | 118.8 | 187.3 | 173.0 | 142.5 | 223.5 | 167.0 | 135.5 | 204.5 | 0.077 |
| p-S6RP (AU) | 137.0 | 124.0 | 169.3 | 159.0 | 135.0 | 202.5 | 170.0 | 129.3 | 191.8 | 0.038* |
| m-TOR (AU) | 180.0 | 112.5 | 299.3 | 215.0 | 148.5 | 438.3 | 192.5 | 132.3 | 266.0 | 0.449 |
| pm-TOR (AU) | 228.5 | 173.9 | 398.6 | 308.5 | 211.3 | 614.0 | 306.0 | 205.9 | 468.3 | 0.384 |
| EV concentration (particles / ml) mean, SD | 3.22E11 (1.55E11) | 2.80E11 (1.71E11) | 2.74E11 (1.68E11) | 0.850 | ||||||
| Size mean (nm) mean, SD | 227 (24) | 223 (28) | 223 (28) | 0.872 | ||||||
| Size mode (nm) mean, SD | 178 (18) | 175 (20) | 177 (21) | 0.259 | ||||||
p < 0.05,
p < 0.05 for the interaction between treatment group and time for baseline versus month 4 compared with placebo group,
ADAS-Cog adjusted for age, and age by treatment interaction.
Extracellular vesicle isolation
NIA investigators received 0.5 ml plasma aliquots and processed them blindly. Pre-analytical factors comply with guidelines for EV biomarker analysis [30]. Blood was collected in EDTA tubes, processed to derive plasma within 1 hour and aliquots were frozen at −80°C. A detailed description of the methods was published [2]. Briefly, plasma samples were defibrinated with Thromboplastin-D adding protease and phosphatase inhibitors. A pellet of total EVs was precipitated with Exoquick® (System Biosciences, Inc., Mountainview, CA). EVs were re-suspended in Ultra-pure distilled water with protease and phosphatase inhibitors and incubated for 1 hour at 4°C with 4 micrograms of mouse anti-human CD171 (or else L1CAM) biotiny-lated antibody (clone 5G3, Thermo Scientific, Inc.), followed by incubation with 25 μl of Pierce™ Strep-tavidin Plus UltraLink™ Resin (Thermo Scientific, Inc.) for 30 min at 4°C. After centrifugation, pellets were re-suspended in 0.1 M glycine-HCl to detach neuronal-enriched EVs followed by centrifugation to remove beads. Supernatants containing neuronal-enriched EVs were transferred to clean tubes, pH was neutralized, and EVs were lysed with MPER and two freeze-thaw cycles. Suspensions of EV proteins were stored at −80oC.
Extracellular vesicle characterization
Suspensions of intact neuronal-enriched EVs were diluted 1:200 to permit quantification in the range of 3–15 × 108/ml with nanoparticle tracking analysis by Nanosight NS500 (Malvern, Amesbury, UK). Five exposures of 20 s each were recorded from fields chosen randomly by NanoSight software (NanoSight NTA 3.2), which also calculated average EV concentration (Table 1). Graphical representation of EV particle concentration per ml over size distribution (nm) for all three groups (Placebo, 20 IU insulin, and 40 IU insulin at baseline and follow-up visit are shown in Supplementary Figure 1).
Quantification of EV proteins
We performed electrochemiluminescence assays using the MesoScale Discovery platform for total (t) and phosphorylated (p) proteins: pS312-IRS-1, pS616-IRS-1, t-IRS1, (K150HLD), pY-IRS-1 (N45CA-1), pS473-AKT, pS9-GSK3β, pS240/244-S6RP, and pT389-p70S6K (K15177), total t-mTOR, p-mTOR S2448 (K15170D), pERK1/2 (T202/Y204; T185/Y187), pJNK (T183/Y185), and pp38 (T180/Y182) (K15101D). All assays for all participants were conducted in duplicate and average values were used in the analyses. The average Coefficients of Variance (CVs) were 10.7% (pS312-IRS-1), 3.9% (pS616-IRS-1), 8.4% (pY-IRS-1), 5.5% (t-IRS-1), 5.4% (pS473-AKT), 3.8% (pS9-GSK3β), 4.7% (p-S6RP), 6.2% (p-p70S6K), 2.5% (t-mTOR), 3.5% (pS2448-mTOR)), 6.1% (p-ERK1/2), 2.5% (p-JNK), and 3.8% (p-p38). The plates were read with Quick-Plex SQ120 imager and workbench Software 4.0 (MesoScale Discovery). For phospho-protein assays, a standard curve could not be constructed and thus he electrochemiluminescence signal was used for the analysis. Both samples from a given participant were included on the same plate to avoid within-subject variability caused by plate-plate variability. Plate to plate variability was assessed using an internal standard (EVs from a control subject); between plate CVs were under 10% for all assays.
Statistical analyses
Analyses were carried out with SPSS, v23. To assess the variability of neuronal-enriched EV biomarkers within subjects we leveraged the placebo group and used Spearman’s test to compute correlations of baseline values and after 4 months. Spearman’s correlation coefficient (r) shows the strength and direction of association between two ranked variables; p value <0.05 is considered statistically significant. Change (Δ) was defined as follow-up minus baseline value.
EV biomarker measures at baseline did not follow normal distributions. Therefore, we compared EV biomarkers for between group differences at baseline using Kruskal-Wallis one-way analysis of variance followed by Mann-Whitney U test for pairwise comparisons. Biomarker measures at baseline or follow-up were used as a test variable, while treatment was a grouping variable. Significant results were followed by group to group comparison using Mann-Whitney U test. To compare baseline characteristics for categorical variables, we used Pearson χ2 test.
To examine groups differences after 4 months of experimental treatment we used Kruskal-Wallis one-way analysis of variance followed by Mann-Whitney U test for pairwise comparisons. Change from baseline (Δ) was test variable with treatment as grouping variable. Significant results were followed by group to group comparison using Mann-Whitney U test.
Finally, to assess relationships between EV IRS-1 biomarker changes and change in ADAS-Cog (Supplementary Table 1, Fig. 2, Supplementary Figures 2 and 3), we used Spearman’s rank correlation test within each treatment group. In an exploratory fashion, we further subdivided subjects by ApoE ε4 carrier status and performed Spearman’s rank correlation test within each treatment and ApoE ε4 carrier groups.
Fig. 2.

Relationship between pS312-IRS-1 and pY-IRS-1, and ADAS-Cog. Relationship between changes in pS312-IRS-1 and pY-IRS-1 measured in EVs from neuronal origin (raw values, as difference between baseline and follow-up visit (Δ)) and change in ADAS-Cog in placebo and insulin treated groups (20 and 40 IU insulin). Correlations were estimated using the Spearman’s rank-order test. Spearman’s correlation coefficient (r) shows the strength and direction of association between two ranked variables. p value < 0.05 is considered statistically significant.
RESULTS
Stability of EV biomarkers over time
All biomarkers measured in plasma neuronal-enriched EVs in placebo group showed a remarkable within-subject stability over four months (determined using Spearman’s correlation between baseline and follow-up visit measurements in the placebo group) (Table 2 and individually showing scatter plots of key markers (follow-up value versus baseline value) with the line y = x, Supplementary Figures 2 and 3).
Table 2.
Within-subject correlations of EV biomarker levels (raw values) between baseline and follow-up visit in the placebo group. Correlations were estimated using the Spearman’s rank-order test. Spearman’s correlation coefficient (r) shows the strength and direction of association between two ranked variables. p value < 0.05 is considered statistically significant. First column refers to a supplemental figures that show scatter plots with y = x line corresponding to Spearman correlation tests in measured biomarkers at follow up and baseline
| Supplementary Figure | EV biomarker | r | p |
|---|---|---|---|
| 2A | pIRS-1 (Ser312) | 0.797 | <0.0001 |
| 2B | pIRS-1 (Tyr-panY) | 0.933 | <0.0001 |
| 2C | pIRS-1 (Ser616) | 0.952 | <0.0001 |
| 2D | total IRS-1 | 0.901 | <0.0001 |
| 2E | pAKT (Ser473) | 0.714 | <0.0001 |
| 2F | pGSK3β (Ser9) | 0.690 | <0.0001 |
| 3A | total mTOR | 0.883 | <0.0001 |
| 3B | pmTOR (Ser2448) | 0.918 | <0.0001 |
| 3C | pp70S6K (Thr389) | 0.730 | <0.0001 |
| 3D | pS6RP (Ser240/244) | 0.717 | <0.0001 |
| 3E | pERK1/2 (Thr202/Tyr204;Thr185/Tyr187) | 0.825 | <0.0001 |
| 3F | pJNK (Thr183/Tyr185) | 0.705 | <0.0001 |
| 3G | pp38 (Thr180/Tyr182) | 0.884 | <0.0001 |
| 3H | EV concentration | 0.412 | 0.04 |
Baseline differences and treatment-associated changes in EV biomarkers
At baseline, there were no group differences for IRS-1 or downstream EV biomarkers when the 20IU and 40 IU intranasal insulin groups were compared to the placebo group and to each other (Table 1). There were no significant group differences for change from baseline (Δ) for IRS-1 or for any downstream EV biomarkers. As can be seen in Table 1, two EV biomarkers (pS473-AKT and pS6RP) were higher in the 20 IU and 40 IU groups compared to the placebo group at 4 months, although there were no significant differences at baseline. Even though these significant differences support the notion of insulin signaling engagement by intranasal insulin, we report them cautiously, since these biomarkers did not show any significant group differences for change from baseline (Δ).
Relationships between change in EV biomarkers and cognitive performance (Supplementary Table 1)
There were no significant correlations between change in EV biomarkers and change in cognitive performance for the placebo and 40 IU groups. For the group treated with 20 IU, change in ADAS-Cog was positively correlated (Fig. 2) with changes in pY-IRS-1 (Rho = 0.533, p<0.002) and pS312-IRS-1 (Rho = 0.447, p = 0.010). For context, we remind readers that patients treated with 20 IU and 40 IU showed a smaller increase on ADAS-cog at 4 months than the increase in the placebo group, such that the interaction of time* group was significant at 4 months (Table 1) [23].
In an exploratory fashion and motivated by the literature that shows intranasal insulin effects depending on ApoE status, we divided the group treated with 20 IU insulin according to ApoE ε4 status. In this post-hoc analysis, strong positive correlations were observed only in ApoE ε4 non-carrier carriers (Fig. 3) for both pS312-IRS-1 (Rho = 0.664, p = 0.005) and pY-IRS-1(Rho = 0.755, p = 0.0007) (Fig. 3) There were no significant change-change correlations for total IRS-1 or for EV biomarkers downstream to IRS-1.
Fig. 3.

Relationship between pS312-IRS-1 and pY-IRS-1, and ADAS-Cog in the group treated with 20 IU insulin and stratified by ApoE ε4 status. Relationship between changes in pS312-IRS-1 and pY-IRS-1 measured in EVs from neuronal origin (raw values, as difference between baseline and follow-up visit) and change in ADAS-Cog in a group treated with 20 IU insulin in ApoE ε4 carriers and ApoE ε4 non-carriers. Correlations were estimated using the Spearman’s rank-order test. Spearman’s correlation coefficient (r) shows the strength and direction of association between two ranked variables. P value < 0.05 is considered statistically significant.
DISCUSSION
The main finding of this study is that the change from baseline in insulin signaling molecules in neuronal-enriched EVs in response to an experimental treatment (20 IU of intranasal insulin) is associated with a change in cognition, which suggests engagement of the insulin cascade in the brain. Specifically, 20 IU of intranasal insulin induced changes in pS312-IRS-1 and pY-IRS-1 that were strongly tracking changes in performance in a comprehensive test of cognition (ADAS-Cog). Interestingly, intranasal insulin effects were dose-dependent showing an association with cognition only in the group treated with 20 IU intranasal insulin, but not in the 40 IU group. In the pilot study of intranasal insulin, the 20 IU insulin group showed the greatest cognitive improvement [23]. The interpretation of the negative finding for the 40 IU group can only be speculative (as for most negative findings). One possibility is that intranasal insulin is more efficient in activating insulin signaling pathways in smaller compared to higher doses, which can potentially induce brain insulin resistance and exacerbate already present cognitive deficits (as suggested by Chapman et al. [31]). It was also very interesting to observe that these associations were strongly modified by ApoE ε4 status.
Based on the finding that 20 IU of intranasal insulin showed evidence of engagement of the insulin signaling cascade at the level of IRS-1 (Fig. 1), we also investigated whether changes in signaling mediators downstream to IRS-1 were also associated with changes in cognition (Supplementary Table 1). Changes in downstream AKT, MAPK, and mTOR pathway signaling mediators were not associated with changes in cognitive performance. We should bear in mind that some of these molecules can function as both effectors and substrates for IRS-1 and opposing effects may have made it difficult to see clear changes in response to an experimental treatments [32].
The mechanism of insulin resistance in AD likely includes chronic upregulation of normally adaptive mechanisms that attenuate feed-forward signaling via feed-back serine kinase action of GSK3β and S6K1 on IRS-1 [24, 25–33]. Cortical neurons pre-treated with insulin to induce insulin resistance exhibited attenuated phosphorylation of AKT, p70S6K, and GSK3β [34]. Moreover, in an autopsy study comparing AD and control subjects, there were no differences in hippocampal levels of phosphorylated S2448-mTOR and S2481-mTOR or total mTOR [35]. Our findings suggest that, although intranasal insulin may have engaged the cascade at the level of IRS-1, its effects downstream may have been attenuated by the activity of feed-back loops and therefore may not have been observable in neuronal-enriched EVs.
As previously reported, APOE genotype had modulatory effects on cognitive outcomes in SNIFF [36]. The basis of this effects may be speculated on the basis of mechanistic studies investigating peripheral and brain insulin signaling [36–39]. Insulin sensitivity (measured by insulin-mediated glucose disposal rate) is lower (i.e., insulin resistance is higher) in ε4 non-carrier compared to ε4 carrier AD patients. Moreover, with insulin infusion-induced hyper-insulinemia, ε4 non-carrier AD patients showed improved memory compared to AD ε4 carriers. Collectively, these data and our present findings suggest that, in AD, engagement of the insulin cascade by intranasal insulin may be strongest in ε4 non-carriers that show the greatest insulin resistance at baseline and for moderate doses (20 IU, as opposed to 40 IU).
We also found that, in placebo-assigned participants (Table 2 and Supplementary Figures 2 and 3), the concentration and phosphoprotein content of plasma neuronal-enriched EVs remained relatively stable over time, as previously shown for total plasma EVs [40], suggesting that circulating neuronal-enriched EVs in individual humans demonstrate a unique signature that remains stable over time. In addition, several studies have established the stability of EVs during storage and their resistance to a limited number of freeze-thaw cycles [41, 42], whereas EV phosphoproteins remain stable over 5 years in storage [43] suggesting that EV biomarkers may reflect the phosphoprotein status in their cells of origin even after years in storage. The presence of intracellular mediators that belong to a common cascade in different phosphorylated states raises the possibility that the status of signaling cascade in the parent cells may be interrogated using circulating EVs. Here and in a similar paper in Parkinson’s disease [27], we make the case that these EV phos-phoproteins constitute an indirect but valid evidence for target engagement by experimental interventions, akin to “messages in a bottle” [44]. Although this would be desirable and, in fact, is one of our long-term goals, presently, we cannot select patients that are more likely to respond to intranasal insulin (or any experimental treatment) on the basis of their EV markers. We hope to get to this point through continuous refinement and validation of the methodology, including the establishment of cut-off values.
The evidence for insulin resistance as an important factor in AD is strong and multifaceted [14]. The present study renders mechanistic support to clinical trials of intranasal insulin and helps explain why certain individuals may show greater responses to it. More broadly, the capacity of EV biomarkers to demonstrate target engagement and identify responder sub-groups may be exploited in clinical trials, by providing them with a proximal outcome and helping them select participants that are more likely to respond to an experimental intervention, thereby, limiting the number of participants required for demonstrating an effect. This may result in a greater ability to test hypotheses in small proof of concept studies than it is currently possible, which would spearhead therapeutic discovery in AD.
Supplementary Material
ACKNOWLEDGMENTS
This research was supported by the Intramural research Program of the NIH, National Institute on Aging, and grants P30 AG049638 (Craft, PI) and RO1 AG027415 (Craft, PI).
Footnotes
Authors’ disclosures available online (https://www.j-alz.com/manuscript-disclosures/18-0578r3).
SUPPLEMENTARY MATERIAL
The supplementary material is available in the electronic version of this article: http://dx.doi.org/10.3233/JAD-180578.
REFERENCES
- [1].Bellingham SA, Guo BB, Coleman BM, Hill AF (2012) Exosomes: Vehicles for the transfer of toxic proteins associated with neurodegenerative diseases? Front Physiol 3, 124. [DOI] [PMC free article] [PubMed] [Google Scholar]
- [2].Mustapic M, Eitan E, Werner JK Jr, Berkowitz ST, Lazaropoulos MP, Tran J, Goetzl EJ, Kapogiannis D (2017) Plasma extracellular vesicles enriched for neuronal origin: A potential window into brain pathologic processes. Front Neurosci 11, 278. [DOI] [PMC free article] [PubMed] [Google Scholar]
- [3].Raposo G, Stoorvogel W (2013) Extracellular vesicles: Exosomes, microvesicles, and friends. J Cell Biol 200, 373–383. [DOI] [PMC free article] [PubMed] [Google Scholar]
- [4].Goetzl EJ, Abner EL, Jicha GA, Kapogiannis D, Schwartz JB (2018) Declining levels of functionally specialized synaptic proteins in plasma neuronal exosomes with progression of Alzheimer’s disease. FASEB J 32, 888–893. [DOI] [PMC free article] [PubMed] [Google Scholar]
- [5].Goetzl EJ, Mustapic M, Kapogiannis D, Eitan E, Lobach IV, Goetzl L, Schwartz JB, Miller BL (2016) Cargo proteins of plasma astrocyte-derived exosomes in Alzheimer’s disease. FASEB J 30, 3853–3859. [DOI] [PMC free article] [PubMed] [Google Scholar]
- [6].Kapogiannis D, Boxer A, Schwartz JB, Abner EL, Biragyn A, Masharani U, Frassetto L, Petersen RC, Miller BL, Goetzl EJ (2015) Dysfunctionally phosphorylated type 1 insulin receptor substrate in neural-derived blood exosomes of preclinical Alzheimer’s disease. FASEB J 29, 589–596. [DOI] [PMC free article] [PubMed] [Google Scholar]
- [7].Goetzl EJ, Boxer A, Schwartz JB, Abner EL, Petersen RC, Miller BL, Kapogiannis D (2015) Altered lysosomal proteins in neural-derived plasma exosomes in preclinical Alzheimer disease. Neurology 85, 40–47. [DOI] [PMC free article] [PubMed] [Google Scholar]
- [8].Goetzl EJ, Boxer A, Schwartz JB, Abner EL, Petersen RC, Miller BL, Carlson OD, Mustapic M, Kapogiannis D (2015) Low neural exosomal levels of cellular survival factors in Alzheimer’s disease. Ann Clin Transi Neurol 2, 769–773. [DOI] [PMC free article] [PubMed] [Google Scholar]
- [9].Fiandaca MS, Kapogiannis D, Mapstone M, Boxer A, Eitan E, Schwartz JB, Abner EL, Petersen RC, Federoff HJ, Miller BL, Goetzl EJ (2015) Identification of preclinical Alzheimer’s disease by a profile of pathogenic proteins in neurally derived blood exosomes: A case-control study. Alzheimers Dement 11, 600–607 e601. [DOI] [PMC free article] [PubMed] [Google Scholar]
- [10].Suire CN, Eitan E, Shaffer NC, Tian Q, Studenski S, Mattson MP, Kapogiannis D (2017) Walking speed decline in older adults is associated with elevated pro-BDNF in plasma extracellular vesicles. Exp Gerontol 98, 209–216. [DOI] [PMC free article] [PubMed] [Google Scholar]
- [11].Eitan E, Tosti V, Suire CN, Cava E, Berkowitz S, Bertozzi B, Raefsky SM, Veronese N, Spangler R, Spelta F, Mustapic M, Kapogiannis D, Mattson MP, Fontana L (2017) In a randomized trial in prostate cancer patients, dietary protein restriction modifies markers of leptin and insulin signaling in plasma extracellular vesicles. Aging Cell 16, 1430–1143. [DOI] [PMC free article] [PubMed] [Google Scholar]
- [12].Blazquez E, Velazquez E, Hurtado-Carneiro V, Ruiz-Albusac JM (2014) Insulin in the brain: Its pathophysiological implications for States related with central insulin resistance, type 2 diabetes and Alzheimer’s disease. Front Endocrinol (Lausanne) 5, 161. [DOI] [PMC free article] [PubMed] [Google Scholar]
- [13].Duarte AI, Moreira PI, Oliveira CR (2012) Insulin in central nervous system: More than just a peripheral hormone. J Aging Res 2012, 384017. [DOI] [PMC free article] [PubMed] [Google Scholar]
- [14].Mullins RJ, Diehl TC, Chia CW, Kapogiannis D (2017) Insulin resistance as a link between amyloid-beta and tau pathologies in Alzheimer’s disease. Front Aging Neurosci 9, 118. [DOI] [PMC free article] [PubMed] [Google Scholar]
- [15].Bomfim TR, Forny-Germano L, Sathler LB, Brito-Moreira J, Houzel JC, Decker H, Silverman MA, Kazi H, Melo HM, McClean PL, Holscher C, Arnold SE, Talbot K, Klein WL, Munoz DP, Ferreira ST, De Felice FG (2012) An anti-diabetes agent protects the mouse brain from defective insulin signaling caused by Alzheimer’s disease-associated Abeta oligomers. J Clin Invest 122, 1339–1353. [DOI] [PMC free article] [PubMed] [Google Scholar]
- [16].Talbot K, Wang HY, Kazi H, Han LY, Bakshi KP, Stucky A, Fuino RL, Kawaguchi KR, Samoyedny AJ, Wilson RS, Arvanitakis Z, Schneider JA, Wolf BA, Bennett DA, Tro-janowski JQ, Arnold SE (2012) Demonstrated brain insulin resistance in Alzheimer’s disease patients is associated with IGF-1 resistance, IRS-1 dysregulation, and cognitive decline. J Clin Invest 122, 1316–1338. [DOI] [PMC free article] [PubMed] [Google Scholar]
- [17].Yarchoan M, Toledo JB, Lee EB, Arvanitakis Z, Kazi H, Han LY, Louneva N, Lee VM, Kim SF, Trojanowski JQ, Arnold SE (2014) Abnormal serine phosphorylation of insulin receptor substrate 1 is associated with tau pathology in Alzheimer’s disease and tauopathies. Acta Neuropathol 128, 679–689. [DOI] [PMC free article] [PubMed] [Google Scholar]
- [18].Willette AA, Modanlo N, Kapogiannis D, Alzheimer’s Disease Neuroimaging Initiative (2015) Insulin resistance predicts medial temporal hypermetabolism in mild cognitive impairment conversion to Alzheimer disease. Diabetes 64, 1933–1940. [DOI] [PMC free article] [PubMed] [Google Scholar]
- [19].Tokutake T, Kasuga K, Yajima R, Sekine Y, Tezuka T, Nishizawa M, Ikeuchi T (2012) Hyperphosphorylation of Tau induced by naturally secreted amyloid-beta at nanomolar concentrations is modulated by insulin-dependent Akt-GSK3beta signaling pathway. J Biol Chem 287, 35222–35233. [DOI] [PMC free article] [PubMed] [Google Scholar]
- [20].Ma QL, Yang F, Rosario ER, Ubeda OJ, Beech W, Gant DJ, Chen PP, Hudspeth B, Chen C, Zhao Y, Vinters HV, Frautschy SA, Cole GM (2009) Beta-amyloid oligomers induce phosphorylation of tau and inactivation of insulin receptor substrate via c-Jun N-terminal kinase signaling: Suppression by omega-3 fatty acids and curcumin. J Neurosci 29, 9078–9089. [DOI] [PMC free article] [PubMed] [Google Scholar]
- [21].Reger MA, Watson GS, Green PS, Baker LD, Cholerton B, Fishel MA, Plymate SR, Cherrier MM, Schellenberg GD, Frey WH 2nd, Craft S (2008) Intranasal insulin administration dose-dependently modulates verbal memory and plasma amyloid-beta in memory-impaired older adults. J Alzheimers Dis 13, 323–331. [DOI] [PMC free article] [PubMed] [Google Scholar]
- [22].Holscher C (2014) First clinical data of the neuroprotective effects of nasal insulin application in patients with Alzheimer’s disease. Alzheimers Dement 10, S33–37. [DOI] [PubMed] [Google Scholar]
- [23].Craft S, Baker LD, Montine TJ, Minoshima S, Watson GS, Claxton A, Arbuckle M, Callaghan M, Tsai E, Plymate SR, Green PS, Leverenz J, Cross D, Gerton B (2012) Intranasal insulin therapy for Alzheimer disease and amnestic mild cognitive impairment: A pilot clinical trial. Arch Neurol 69, 29–38. [DOI] [PMC free article] [PubMed] [Google Scholar]
- [24].Boura-Halfon S, Zick Y (2009) Phosphorylation of IRS proteins, insulin action, and insulin resistance. Am J Physiol Endocrinol Metab 296, E581–591. [DOI] [PubMed] [Google Scholar]
- [25].Sun XJ, Liu F (2009) Phosphorylation of IRS proteins Yin-Yang regulation of insulin signaling. Vitam Horm 80, 351–387. [DOI] [PubMed] [Google Scholar]
- [26].Mullins RJ, Mustapic M, Goetzl EJ, Kapogiannis D (2017) Exosomal biomarkers of brain insulin resistance associated with regional atrophy in Alzheimer’s disease. Hum Brain Mapp 38, 1933–1940. [DOI] [PMC free article] [PubMed] [Google Scholar]
- [27].Athauda D, Gulyani S, Karnati H, Li Y, Tweedie D, Mustapic M, Chawla S, Chowdhury K, Skene SS, Greig NH, Kapogiannis D, Foltynie T (2019) Utility of neuronal-derived exosomes to examine molecular mechanisms that affect motor function in patients with parkinson disease: A secondary analysis of the Exenatide-PD Trial. JAMA Neurol, doi: 10.1001/jamaneurol.2018.4304 [DOI] [PMC free article] [PubMed] [Google Scholar]
- [28].Folstein MF, Folstein SE, McHugh PR (1975) “Mini-mental state”. A practical method for grading the cognitive state of patients for the clinician. J Psychiatr Res 12, 189–198. [DOI] [PubMed] [Google Scholar]
- [29].Rosen WG, Mohs RC, Davis KL (1984) A new rating scale for Alzheimer’s disease. Am J Psychiatry 141, 1356–1364. [DOI] [PubMed] [Google Scholar]
- [30].Witwer KW, Buzas EI, Bemis LT, Bora A, Lasser C, Lot-vall J, Nolte-’t Hoen EN, Piper MG, Sivaraman S, Skog J, Thery C, Wauben MH, Hochberg F (2013) Standardization of sample collection, isolation and analysis methods in extracellular vesicle research. J Extracell Vesicles 2(1), 1–25. [DOI] [PMC free article] [PubMed] [Google Scholar]
- [31].Chapman CD, Schioth HB, Grillo CA, Benedict C (2018) Intranasal insulin in Alzheimer’s disease: Food for thought. Neuropharmacology 136, 196–201. [DOI] [PMC free article] [PubMed] [Google Scholar]
- [32].Xie J, Proud CG (2014) Signaling crosstalk between the mTOR complexes. Translation (Austin) 2, e28174. [DOI] [PMC free article] [PubMed] [Google Scholar]
- [33].Hoehn KL, Hohnen-Behrens C, Cederberg A, Wu LE, Turner N, Yuasa T, Ebina Y, James DE (2008) IRS1-independent defects define major nodes of insulin resistance. Cell Metab 7, 421–433. [DOI] [PMC free article] [PubMed] [Google Scholar]
- [34].Kim B, Sullivan KA, Backus C, Feldman EL (2011) Cortical neurons develop insulin resistance and blunted Akt signaling: A potential mechanism contributing to enhanced ischemic injury in diabetes. Antioxid Redox Signal 14,1829–1839. [DOI] [PMC free article] [PubMed] [Google Scholar]
- [35].Perez SE, He B, Nadeem M, Wuu J, Ginsberg SD, Ikonomovic MD, Mufson EJ (2015) Hippocampal endo-somal, lysosomal, and autophagic dysregulation in mild cognitive impairment: Correlation with abeta and tau pathology. J Neuropathol Exp Neurol 74, 345–358. [DOI] [PMC free article] [PubMed] [Google Scholar]
- [36].Claxton A, Baker LD, Wilkinson CW, Trittschuh EH, Chapman D, Watson GS, Cholerton B, Plymate SR, Arbuckle M, Craft S (2013) Sex and ApoE genotype differences in treatment response to two doses of intranasal insulin in adults with mild cognitive impairment or Alzheimer’s disease. J Alzheimers Dis 35, 789–797. [DOI] [PMC free article] [PubMed] [Google Scholar]
- [37].Reger MA, Watson GS, Frey WH 2nd, Baker LD, Cholerton B, Keeling ML, Belongia DA, Fishel MA, Plymate SR, Schellenberg GD, Cherrier MM, Craft S (2006) Effects of intranasal insulin on cognition in memory-impaired older adults: Modulation by APOE genotype. Neurobiol Aging 27, 451–458. [DOI] [PubMed] [Google Scholar]
- [38].Hanson AJ, Craft S, Banks WA (2015) The APOE geno-type: Modification of therapeutic responses in Alzheimer’s disease. Curr Pharm Des 21, 114–120. [DOI] [PubMed] [Google Scholar]
- [39].Craft S, Asthana S, Schellenberg G, Cherrier M, Baker LD, Newcomer J, Plymate S, Latendresse S, Petrova A, Raskind M, Peskind E, Lofgreen C, Grimwood K (1999) Insulin metabolism in Alzheimer’s disease differs according to apolipoprotein E genotype and gender. Neuroendocrinology 70, 146–152. [DOI] [PubMed] [Google Scholar]
- [40].Eitan E, Green J, Bodogai M, Mode NA, Baek R, Jorgensen MM, Freeman DW, Witwer KW, Zonderman AB, Biragyn A, Mattson MP, Noren Hooten N, Evans MK (2017) Age-related changes in plasma extracellular vesicle characteristics and internalization by leukocytes. Sci Rep 7, 1342. [DOI] [PMC free article] [PubMed] [Google Scholar]
- [41].Abu-Seer E (2017) The reliability of plasma exosome concentrations in healthy male individuals. J Health Sci 5, 81–94. [Google Scholar]
- [42].Yuana Y, Boing AN, Grootemaat AE, van der Pol E, Hau CM, Cizmar P, Buhr E, Sturk A, Nieuwland R (2015) Handling and storage of human body fluids for analysis of extracellular vesicles. J Extracell Vesicles 4, 29260. [DOI] [PMC free article] [PubMed] [Google Scholar]
- [43].Chen IH, Xue L, Hsu CC, Paez JS, Pan L, Andaluz H, Wendt MK, Iliuk AB, Zhu JK, Tao WA (2017) Phosphoproteins in extracellular vesicles as candidate markers for breast cancer. Proc Natl Acad Sci U S A 114, 3175–3180. [DOI] [PMC free article] [PubMed] [Google Scholar]
- [44].Dubal DB, Pleasure SJ (2019) Neural-derived extracellular vesicles in clinical trials: Message in a bottle. JAMA Neurol, doi: 10.1001/jamaneurol.2018.4325 [DOI] [PubMed] [Google Scholar]
- [45].Avruch J (1998) Insulin signal transduction through protein kinase cascades. Mol Cell Biochem 182, 31–48. [PubMed] [Google Scholar]
- [46].Memmott RM, Dennis PA (2009) Akt-dependent and – independent mechanisms of mTOR regulation in cancer. Cell Signal 21, 656–664. [DOI] [PMC free article] [PubMed] [Google Scholar]
- [47].Narayanan SP, Flores AI, Wang F, Macklin WB (2009) Akt signals through the mammalian target of rapamycin pathway to regulate CNS myelination. J Neurosci 29, 6860–6870. [DOI] [PMC free article] [PubMed] [Google Scholar]
- [48].Tremblay F, Marette A (2001) Amino acid and insulin signaling via the mTOR/p70 S6 kinase pathway. A negative feedback mechanism leading to insulin resistance in skeletal muscle cells. J Biol Chem 276, 38052–38060. [DOI] [PubMed] [Google Scholar]
- [49].Takano A, Usui I, Haruta T, Kawahara J, Uno T, Iwata M, Kobayashi M (2001) Mammalian target of rapamycin pathway regulates insulin signaling via subcellular redistribution of insulin receptor substrate 1 and integrates nutritional signals and metabolic signals of insulin. Mol Cell Biol 21, 5050–5062. [DOI] [PMC free article] [PubMed] [Google Scholar]
- [50].Roux PP, Blenis J (2004) ERK and p38 MAPK-activated protein kinases: A family of protein kinases with diverse biological functions. Microbiol Mol Biol Rev 68, 320–344. [DOI] [PMC free article] [PubMed] [Google Scholar]
- [51].Plotnikov A, Zehorai E, Procaccia S, Seger R (2011) The MAPK cascades: Signaling components, nuclear roles and mechanisms of nuclear translocation. Biochim Biophys Acta 1813,1619–1633. [DOI] [PubMed] [Google Scholar]
- [52].Miller WP, Ravi S, Martin TD, Kimball SR, Dennis MD (2017) Activation of the Stress Response Kinase JNK (c-Jun N-terminal Kinase) Attenuates insulin action in retina through a p70S6K1-dependent mechanism. J Biol Chem 292, 1591–1602. [DOI] [PMC free article] [PubMed] [Google Scholar]
- [53].Frojdo S, Vidal H, Pirola L (2009) Alterations of insulin signaling in type 2 diabetes: A review of the current evidence from humans. Biochim Biophys Acta 1792, 83–92. [DOI] [PubMed] [Google Scholar]
Associated Data
This section collects any data citations, data availability statements, or supplementary materials included in this article.