

Abstract
Background:
Understanding how hospitals functioned during the 2009 influenza A(H1N1)pdm09 pandemic may improve future public health emergency response, but information about its impact on US hospitals remains largely unknown.
Research Design:
We matched hospital and emergency department (ED) discharge data from the Agency for Healthcare Research and Quality (AHRQ) Healthcare Cost and Utilization Project with community-level influenza-like illness activity during each hospital’s pandemic period in fall 2009 compared with a corresponding calendar baseline period. We compared inpatient mortality for sentinel conditions at high-surge versus nonsurge hospitals.
Results:
US hospitals experienced a doubling of pneumonia and influenza ED visits during fall 2009 compared with prior years, along with an 18% increase in overall ED visits. Although no significant increase in total inpatient admissions occurred overall, approximately 10% of all study hospitals experienced high surge, associated with higher acute myocardial infarction and stroke case fatality rates. These hospitals had similar characteristics to other US hospitals except that they had higher mortality for acute cardiac illnesses before the pandemic. After adjusting for 2008 case fatality rates, the association between high-surge hospitals and increased mortality for acute myocardial infarction and stroke patients persisted.
Conclusions:
The fall 2009 pandemic period substantially impacted US hospitals, mostly through increased ED visits. For a small proportion of hospitals that experienced a high surge in inpatient admissions, increased mortality from selected clinical conditions was associated with both prepandemic outcomes and surge, high-lighting the linkage between daily hospital operations and disaster preparedness.
Keywords: pandemic influenza, hospital surge capacity, emergency department
In the decade preceding the influenza A(H1N1)pdm09 pandemic, governments worldwide engaged in extensive pandemic planning.1,2 Between April 2009 and April 2010, an estimated 60.8 million Americans became ill, 274,000 were hospitalized, and 12,500 died due to pH1N1.3 Postpandemic review confirmed that visits to specialized, pediatric emergency departments (EDs) increased dramatically.4 Despite some media reports of overwhelmed EDs and inpatient settings in the United States,5 no nationwide analyses of the impact of the pH1N1 pandemic on acute care hospitals or EDs are available.
We linked the Healthcare Cost and Utilization Project (HCUP), a nationwide, administrative data source that captures hospital admissions and ED encounters,6 with the US Centers for Disease Control and Prevention’s (CDC) Influenza-Like Illness Surveillance Program (ILINet) data, to assess the impact of the 2009 pH1N1 fall wave on US hospitals and EDs.3,7,8
METHODS
General Approach
To measure pH1N1 surge and its impacts, we conducted 3 types of analyses. First, we compared the volume of ED visits and inpatient admissions during the pH1N1 fall wave with previous years as baseline. Second, we compared ED and inpatient admission volume between the pH1N1 fall wave and the 2003–2004 influenza season, the most severe season in the last decade.9 Third, we compared in-hospital mortality for selected conditions in high-surge, medium-surge, and nonsurge hospitals during the pH1N1 fall wave. Table 1 provides an overview of data sources and methods.
TABLE 1.
Description of Overall Approach, Data, and Statistical Methods Used in Analyses of Hospital and ED Impacts Associated With the pH1N1 Fall Wave in the United States
| Outcomes | Pandemic Period | Comparison Period |
Statistical Analysis |
|---|---|---|---|
| Analysis 1: Surge in the pH1N1 pandemic period compared with prior baseline years | |||
| No. inpatient admissions* | pH1N1 pandemic weeks in fall 2009, defined at the CBSA level based on CDC’s ILINet surveillance. Sensitivity analysis using a fixed pandemic period (August 30–December 12, 2009) | Corresponding weeks in 2003–2008 | % change in number of encounters in 2009 vs. baseline, t test |
| No. ED encounters (all and treat-and-release only)* | pH1N1 pandemic weeks in fall 2009, defined at the CBSA level based on CDC’s ILINet surveillance. Sensitivity analysis using a fixed pandemic period (August 30-December 12, 2009) | Corresponding weeks in 2005–2008 | % change in number of encounters in 2009 vs. baseline, t test |
| Census:bed ratio* | pH1N1 pandemic weeks in fall 2009, defined at the CBSA level based on CDC’s ILINet surveillance | Corresponding weeks in 2003–2008 | % hospitals in 2009 with a >20% increase in census:bed ratio over baseline period |
| Analysis 2. Surge in the pH1N1 pandemic period compared with severe 2003–04 influenza | season | ||
| No. inpatient admissions† | August 30–December 12, 2009 | November 2, 2003–January 10, 2004 | % change in number of encounters and encounters per day in 2009 vs. 2003–04 |
| No. ED encounters (all and treat-and-release only)† | August 30–December 12, 2009 | November 2, 2003- January 10, 2004 | % change in number of encounters and encounters per day in 2009 vs. 2003–04 |
| Analysis 3: Association of in-hospital mortality with high surge | |||
| In-hospital mortality for AMI, CHF, stroke, injury (adults), and injury, and chronic conditions (pediatrics) | pH1N1 pandemic weeks in fall 2009, defined at the CBSA level based on CDC’s ILINet surveillance. Sensitivity analysis using (1) ED surge; (2) additional hospital and local area control variables; and (3) a fixed pandemic period (August 30–December 12, 2009) | — | Logistic regression with controls for patient and hospital characteristics, including 2008 in-hospital mortality rate for condition |
If a facility did not report SID or SEDD data during a baseline year, we imputed the missing data using average values from the available baseline years. We required the baseline comparison periods to have no more than approximately 10% of imputed data.
Restricted to hospitals providing SID and SEDD data in 2003, 2004 and 2009.
AMI indicates acute myocardial infarction, CBSA, Core Based Statistical Area; CDC, Centers for Disease Control and Prevention; CHF, congestive heart failure; ED, emergency department; SEDD, State Emergency Department Databases; SID, State Inpatient Databases.
Data Sources
Patient-encounter data came from HCUP State Inpatient Databases (SID) and State Emergency Department Databases (SEDD).6 HCUP contains patient age, sex, primary expected payer, severity of illness, length of stay (inpatient only), and discharge disposition.10 We identified patient comorbidities using the Elixhauser Comorbidity Software.11 We included data from 2387 and 1832 acute care hospitals and EDs, respectively, in 26 SIDs and 19 SEDDs (Supplemental Digital Content 1, http://links.lww.com/MLR/A418 for map of included states). We analyzed ED treat-and-release visits, all ED visits, and inpatient admissions, as well as inpatient census:bed ratio. We considered the following patient subcategories: pregnancy and elective admissions with a procedure performed12 (Supplemental Digital Content 1, http://links.lww.com/MLR/A418 for detailed definitions).
Hospital size, ownership, and teaching status were derived from the American Hospital Association’s (AHA) 2008 Annual Survey.13
Influenza cases were generally uncommon during the fall seasons of baseline years, except 2003. To provide a meaningful comparison between periods; therefore, we based our main analyses on total encounters and pneumonia and influenza (P&I) encounters (Supplemental Digital Content 2, http://links.lww.com/MLR/A419 for influenza-only analysis).
Study Periods
For our primary analyses, we used ILINet to identify hospital-specific pandemic periods8 during fall 2009, defined as weeks in which influenza-like illness activity in a hospital’s Core Based Statistical Area14 was >3 SDs above baseline.3,15–17 We restricted each hospitals’ data to its Core Based Statistical Area-specific pandemic time period.
Not all hospitals, especially those in rural locations, could be included in this primary analysis since the ILINet surveillance did not encompass all geographic regions. Therefore, we performed a sensitivity analysis using all hospitals based on a uniform pandemic time period—August 30 to December 12, 2009—the first and last weeks when national influenza-like illness prevalence was >3 SDs above baseline.15
Analyses
ED and Inpatient Volume
To measure the extent of inpatient surge during the pH1N1 fall wave, we calculated the difference between admissions during the pandemic period and mean admissions during corresponding weeks in prior years separately for each hospital. We then divided the difference by the SD of the baseline number of admissions (Z-score). We categorized hospitals based on the Z-score as follows: “high-surge hospitals” (Z-score ≥ 2), “medium-surge hospitals” (0< Z-score<2), and “no-surge hospitals” (Z-score ≤0). We repeated these analyses with uniform pandemic periods and used an analogous approach with ED data.
Next, we calculated the hospital-specific weekly census:bed ratio to account for patients admitted to the facility and patients who were still in the facility during pandemic weeks (ie, the number of patients who were present in the hospital during an outbreak week divided by the number of “set up and staffed” hospital beds). We compared the 2009 pandemic census:bed ratio to the hospital-specific baseline average for corresponding weeks in previous years.
We also compared ED visits and inpatient admissions during the pH1N1 fall wave with those during the severe 2003–2004 influenza season. Given the different length of influenza activity periods in this analysis, we compared average daily volumes and cumulative volumes.
Mortality Risk Analyses
To assess whether increased patient volume during the pH1N1 fall wave impacted hospitals’ capabilities to deliver quality health care, we analyzed the mortality risk for patients with conditions commonly used to assess hospitals’ processes of care: adults with acute myocardial infarction (AMI), congestive heart failure (CHF), stroke, traumatic injury, and pediatric patients with traumatic injury or chronic comorbidities. For each condition, we assessed the association of in-hospital mortality with surge (high, medium, and no surge) during the pH1N1 fall wave. We analyzed encounter-level data with multivariable logistic regression models controlling for patient sex, age, comorbidities, P&I diagnosis, severity of illness, hospital bed size, teaching status, and ownership. To control for baseline quality of care, we included the 2008 hospital-specific mortality rate for the studied clinical condition as a covariate. We used 2008 rather than the whole range of 2003–2008 to establish the baseline mortality for the regression analyses to avoid confounding with secular trends in improved care for these conditions from 2003 to 2007. We used logistic regression with SEs adjusted for the clustering of admissions in hospitals (Supplemental Digital Content 1, http://links.lww.com/MLR/A418 for variable definitions and Supplemental Digital Content 2 for sensitivity analyses).
RESULTS
Encounter Volume in Pandemic and Comparison Periods
We obtained hospital-specific pandemic period information for 1047 (43.9%) SID hospitals and 760 (41.5%) SEDD hospitals. Pandemic activity lasted a median of 8 weeks for each hospital.
Using the hospital-specific pandemic period, EDs had 4,468,880 total visits and 3,756,251 treat-and-release encounters during 2009 pandemic weeks, an approximately 18% increase over baseline (P <0.05, Table 2 and Supplemental Digital Content 2, http://links.lww.com/MLR/A419). More than 88% of EDs experienced an increase in visits. Sensitivity analyses using the uniform pandemic period demonstrated smaller percentage increases (Table 2).
TABLE 2.
Change in Hospital Volume During pH1N1 Fall Wave Compared With Baseline Years,* by Disease Category and Type of Encounter
| Hospital-specific Pandemic Period |
Uniform Pandemic Period |
|||||
|---|---|---|---|---|---|---|
| Disease Category† | 2005–2008 Annual Mean | 2009 | % Change in 2009 (P) | 2005–2008 Annual Mean | 2009 | % Change in 2009 (P) |
| Emergency departments, all encounters | ||||||
| All encounters | 3,795,393 | 4,468,880 | 17.7 % (P = 0.001) | 9,154,938 | 10,517,302 | 14.9% (P<0.001) |
| Pneumonia and influenza | 90,090 | 270,272 | 200.0% (P <0.001) | 223,782 | 530,982 | 137.3% (P<0.001) |
| Emergency departments, treat-and-release encounters | ||||||
| All encounters | 3,162,509 | 3,756,251 | 18.8% (P<0.001) | 7,719,656 | 8,837,940 | 14.5% (P<0.001) |
| Pneumonia and influenza | 30,023 | 184,482 | 514.5% (P <0.001) | 75,039 | 330,051 | 339.8% (P<0.001) |
| Inpatient admissions | ||||||
| All encounters | 1,994,227 | 2,002,614 | 0.4% (P = 0.44) | 4,533,741 | 4,549,623 | 0.4% (P = 0.54) |
| Pneumonia and influenza | 104,309 | 147,616 | 41.5% (P<0.001) | 251,498 | 338,062 | 34.4% (P<0.001) |
Baseline years for the inpatient analysis are 2003–2008. For the emergency department analysis, baseline years are 2005–2008.
Sensitivity analysis based on influenza-specific codes presented in Supplemental Digital Content.
In comparison with 2003–2004 seasonal influenza, total ED encounters and treat-and-release ED encounters per day were 31% and 34% higher, respectively, during the pH1N1 fall wave. Much of the increase was due to visits with diagnostic codes for conditions other than P&I (Table 3).
TABLE 3.
Hospital Volume During pH1N1 Fall Wave Compared With 2003–2004 Seasonal Influenza Epidemic, by Disease Category and Type of Encounter
| 2003–2004 |
Fall 2009 |
|||||
|---|---|---|---|---|---|---|
| Disease Category* | No. Encounters | Encounters Per Day | No. Encounters | % Change From 2003 to 2004 | Encounters Per Day | % change From 2003 to 2004 |
| Emergency departments, all encounters† | ||||||
| All encounters | 1,867,861 | 26,684 | 3,668,021 | 96.38% | 34,934 | 30.92% |
| Pneumonia and influenza | 125,279 | 1790 | 199,216 | 59.02% | 1897 | 5.98% |
| Emergency departments, treat-and-release encounters† | ||||||
| All encounters | 1,537,290 | 21,961 | 3,098,494 | 101.56% | 29,510 | 34.37% |
| Pneumonia and influenza | 74,385 | 1063 | 130,824 | 75.87% | 1246 | 17.22% |
| Inpatient admissions‡ | ||||||
| All encounters | 3,099,931 | 44,285 | 4,546,920 | 46.68% | 43,304 | −2.22% |
| Pneumonia and influenza | 288,956 | 4128 | 337,791 | 16.90% | 3217 | −22.07% |
Sensitivity analysis based on influenza-specific codes presented in Supplemental Digital Content.
The emergency department analysis was performed using data from the following states, which were available in both time periods: Georgia, Hawaii, Indiana, Maryland, Missouri, Minnesota, Nebraska, South Carolina, Tennessee, and Vermont.
The inpatient analysis was performed using data from the following states, which were available in both time periods: Arizona, California, Colorado, Georgia, Hawaii, Illinois, Indiana, Iowa, Kentucky, Maryland, Missouri, Minnesota, Nebraska, Nevada, New Jersey, Ohio, Oregon, Rhode Island, South Carolina, South Dakota, Tennessee, Virginia, Vermont, Washington, and Wisconsin.
Total hospitals admission volume was similar during pandemic and baseline weeks (statistically insignificant 0.4% increase during pandemic weeks, Table 2). Although fewer than half of hospitals had any increase in admissions, about 8% had more than a 20% increase in admissions over baseline; 10% of hospitals had greater than a 20% increase in census:bed ratio.
Our sample included 106 high-surge hospitals (10%), 386 moderate-surge hospitals (37%), and 555 hospitals (53%) that had no surge in admissions. High-surge hospitals were of similar size, ownership, urban/rural location, and teaching status as the other hospitals (Table 4).
TABLE 4.
Comparison of High Surge to All Other Hospitals
| Characteristics | High-surge Hospitals |
All Other Hospitals (n = 106) |
P* (n = 941) |
|---|---|---|---|
| Teaching status (%) | |||
| Teaching | 37.74% | 33.91% | 0.43 |
| Nonteaching | 62.26% | 66.09% | |
| Ownership (%) | |||
| Public | 11.32% | 11.77% | 0.30 |
| Nonprofit ownership | 77.26% | 71.17% | |
| For-profit ownership | 11.32% | 17.06% | |
| Location (%) | |||
| Urban | 98.11% | 93.74% | 0.11 |
| Rural | 1.89% | 6.26% | |
| Average No. set up and staffed beds | 280.3 | 249.1 | 0.10 |
χ2 or t test.
In contrast to all-cause admissions, there was widespread surge in P&I admissions associated with the pH1N1 fall wave, with >87% of hospitals experiencing an increase over baseline. Yet when the pH1N1 fall wave was compared with the 2003–2004 influenza season, daily P&I admissions were decreased by 22% (Table 2).
In fall 2009, hospital admissions for births and other delivery-related conditions declined by 5.5% compared with previous years, making it the clinical category responsible for the largest reduction of admissions. We did not find a consistent pattern of decreases in elective admissions for procedures (data not shown).
In-hospital Mortality and Surge
Patients with stroke, CHF, or AMI at a high-surge hospital had a significant increase in mortality risk compared with patients with those conditions at no-surge hospitals (Fig. 1). There was no association between hospital surge level and mortality risk for adult or pediatric trauma or for pediatric patients with chronic conditions.
FIGURE 1.
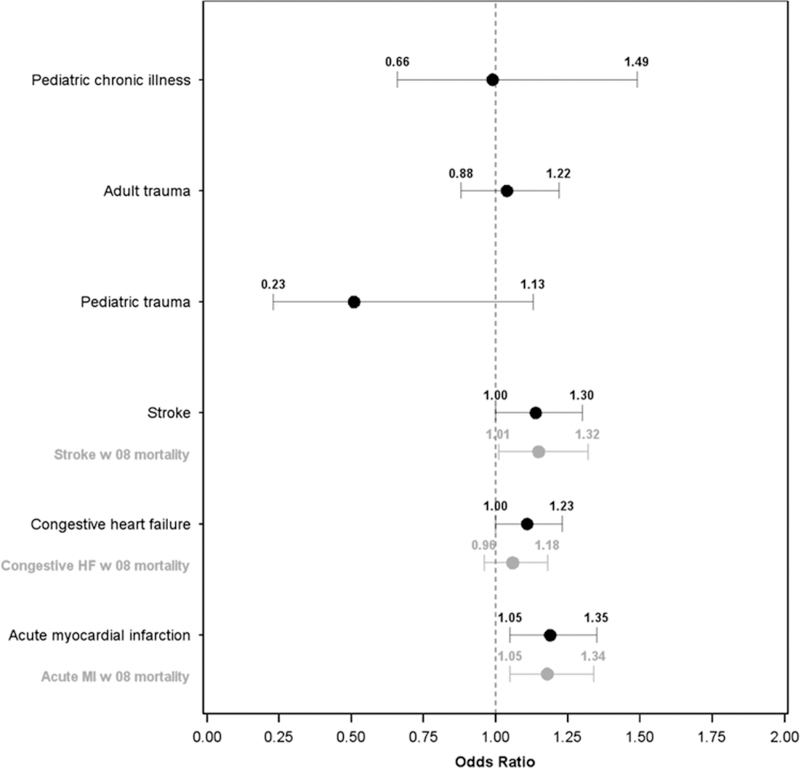
Adjusted odds ratios for mortality by condition, high-surge hospitals versus nonsurge hospitals during the pH1N1 fall wave. Covariates (not shown on figures) include age, sex, All Patient Refined Diagnosis Related Group (APR-DRG) severity, presence of 29 Comorbidity Software variables, hospital size, hospital teaching status, hospital ownership/control, as well as pneumonia and influenza diagnosis.
CHF and AMI patients admitted to hospitals in 2008 that experienced high surge in 2009 had statistically significant higher mortality risk (data not shown). Yet after adjusting for 2008 mortality rates, an elevated mortality risk remained at hospitals experiencing high surge in 2009 pandemic weeks for patients with AMI and stroke (Fig. 1). Sensitivity analyses using the uniform pandemic period gave similar results.
We found no significant association between ED surge and in-hospital mortality, and these findings were not sensitive to alternative definitions of ED surge based on different Z-score cutpoints.
DISCUSSION
During the pH1N1 fall wave, we found large increases in ED visits over baseline, but only a subset of hospitals experienced high inpatient surge. We found evidence that hospitals with poorer prepandemic outcomes may have even poorer outcomes during times of surge.
The combination of unchanged total hospital admissions and increased P&I admissions over baseline during the pH1N1 fall wave suggests an offsetting decrease in admissions for other conditions. Although pregnant woman made up a disproportionate share of patients admitted for influenza complications18,19 during the pandemic, hospitals experienced a relatively sharp decline in the total number of labor-related and delivery-related admissions. The reduction in births was a likely consequence of the concurrent US economic slowdown20 and may have offset one third of the increase in admissions due to P&I.
In contrast to inpatient volumes, high surge in EDs was not associated with increased mortality risk for inpatients with the conditions considered. A number of factors, including changes in staffing and operations, likely contributed to the ability of EDs to surge. These efforts merit additional investigation as they could provide valuable lessons for the future.
The SID and SEDD used in this study cover a subset of states. Nevertheless, the states in our analyses still represent 54% and 41% of the US population, respectively. HCUP provides the most comprehensive data available on hospital and ED use at the encounter level. When combined with ILINet, HCUP’s broad geographic representation and inclusivity of all ages and payers allowed a more detailed analysis of health care utilization than would have been possible using administrative data from Medicare or individual health plans.
Our study is subject to important limitations. The associations among influenza activity, cardiovascular events, and mortality have been frequently described.21 Also, respiratory infections have been associated with stroke incidence and stroke severity.22 Our mortality risk analysis could have been confounded if high-surge hospitals were associated with higher influenza activity than nonsurge hospitals and if mortality risk was higher in AMI patients with influenza than in AMI patients without influenza. However, we did not find evidence for such an interaction after adjustment for age, comorbidities, and severity of illness.
A further limitation may have been our definition of epidemic activity, although we considered both local and nationally representative pandemic periods. Alternative measures may have identified less extreme but more temporally durable excursion over the normal range. In addition, outbreaks in a given community may not immediately be reflected in the geographically proximate hospitals.
The finding that hospital-specific pandemic surge and mortality risk for selected conditions were associated with prepandemic quality of care provides an intriguing insight regarding the relationship between some specific measures of hospital quality and emergency-specific hospital preparedness. We cannot determine whether this increase in baseline mortality is due to patient mix, hospital care processes, or even residual confounding due to imbalanced effects of influenza on certain hospitals.23 Despite these limitations, the finding offers a unique opportunity to consider the broader linkages between daily hospital operations and disaster preparedness. Structural and procedural efforts to increase some aspects of hospital quality have the potential to induce positive effects on acute and longer-term hospital emergency response capabilities. Improving baseline quality and providing additional support during surges may improve performance in hospitals with underlying quality issues. Support may include directing patients with selected conditions away from high-surge hospitals. However, more research is needed to fully elucidate the association between hospital quality and performances in emergency situations and assess how to best support hospitals during such events, before firm recommendations can be made.
Supplementary Material
ACKNOWLEDGMENTS
The H1N1 Impact on US Hospitals Analysis Team (HIHAT) acknowledges the exceptional consultation and guidance provided by Drs Richard Frank and Sherry Glied during conceptual development of the HIHAT project. Also, we acknowledge Alicia Livinski, MPH, MA from the National Institutes of Health Library for her valuable assistance with editorial review and manuscript preparation.
The authors gratefully acknowledge the data organizations in participating states that contributed data to HCUP and that we used in this study: Arizona Department of Health Services, California Office of Statewide Health Planning & Development, Colorado Hospital Association, Georgia Hospital Association, Hawaii Health Information Corporation, Illinois Department of Public Health, Indiana Hospital Association, Iowa Hospital Association, Kentucky Cabinet for Health and Family Services, Maryland Health Services Cost Review Commission, Minnesota Hospital Association, Missouri Hospital Industry Data Institute, Nebraska Hospital Association, New Jersey Department of Health & Senior Services, Nevada Department of Health and Human Services, Ohio Hospital Association, Oregon Association of Hospitals and Health Systems, Rhode Island Department of Health, South Carolina State Budget & Control Board, South Dakota Association of Healthcare Organizations, Tennessee Hospital Association, Vermont Association of Hospitals and Health Systems, Virginia Health Information, Washington State Department of Health, Wisconsin Department of Health Services, and Wyoming Hospital Association.
Footnotes
The findings and conclusions in this report are those of the author(s) and do not necessarily represent the views of the Department of Health and Human Services or its components.
The authors declare no conflict of interest.
Supplemental Digital Content is available for this article. Direct URL citations appear in the printed text and are provided in the HTML and PDF versions of this article on the journal’s Website, www.lww-medicalcare.com.
REFERENCES
- 1.Outbreak of swine-origin influenza. A (H1N1) virus infection—Mexico, March-April 2009. MMWR Morb Mortal Wkly Rep. 2009;58: 467–470. [PubMed] [Google Scholar]
- 2.Dawood FS, Jain S, Finelli L, et al. Emergence of a novel swine-origin influenza A (H1N1) virus in humans. N Engl J Med. 2009;360: 2605–2615. [DOI] [PubMed] [Google Scholar]
- 3.Shrestha SS, Swerdlow DL, Borse RH, et al. Estimating the burden of 2009 pandemic influenza A (H1N1) in the United States (April 2009-April 2010). Clin Infect Dis. 2011;52(suppl 1):S75–S82. [DOI] [PubMed] [Google Scholar]
- 4.Sills MR, Hall M, Simon HK, et al. Resource burden at children’s hospitals experiencing surge volumes during the spring 2009 H1N1 influenza pandemic. Acad Emerg Med. 2011;18:158–166. [DOI] [PubMed] [Google Scholar]
- 5.Sternberg S H1N1 flu pushing hospitals to their limits. USA Today. http://usatoday30.usatoday.com/news/health/2009-10-26-swine-flu-hospitals_N.htm?csp=DailyBriefing Accessed October 10, 2011. [Google Scholar]
- 6.Agency for Healthcare Research and Quality. HCUP Databases. Healthcare Cost and Utilization Project (HCUP) 2003–2009. Agency for Healthcare Research and Quality; Available at: http://www.hcup-us.ahrq.gov/databases.jsp. Accessed October 10, 2011. [Google Scholar]
- 7.Brammer L, Blanton L, Epperson S, et al. Surveillance for influenza during the 2009 influenza A (H1N1) pandemic—United States, April 2009-March 2010. Clin Infect Dis. 2011;52(suppl 1):S27–S35. [DOI] [PubMed] [Google Scholar]
- 8.Jhung MA, Swerdlow D, Olsen SJ, et al. Epidemiology of 2009 pandemic influenza A (H1N1) in the United States. Clin Infect Dis. 2011;52(suppl 1):S13–S26. [DOI] [PubMed] [Google Scholar]
- 9.Estimates of deaths associated with seasonal influenza—United States, 1976–2007 MMWR Mor Mortal Wkly Rep. 2010;59:1057–1062. [PubMed] [Google Scholar]
- 10.Agency for Healthcare Research and Quality. Healthcare Cost and Utilization Project (HCUP). Available at: http://www.hcup-us.ahrq.gov. Accessed October 10, 2011. [PubMed]
- 11.Elixhauser A, Steiner C, Harris DR, et al. Comorbidity measures for use with administrative data. Med Care. 1998;36:8–27. [DOI] [PubMed] [Google Scholar]
- 12.United States Government Accountability Office. Hospital Emergency Departments: Crowding Continues to Occur, and Some Patients Wait Longer Than Recommended Time Frames. Washington, DC: United States Government Accountability Office; 2009;58. [Google Scholar]
- 13.American Hospital Association. Annual Survey 2003–2008. Available at: http://www.ahadata.com/ahadata/html/AHASurvey.html. Accessed October 10, 2011.
- 14.US Census Bureau. Metropolitan and Micropolitan Statistical Areas. Available at: http://www.census.gov/population/metro. Accessed October 10, 2011.
- 15.Centers for Disease Control and Prevention. Weekly Influenza Surveillance Report. Available at: http://www.cdc.gov/flu/weekly/pastreports.htm. Accessed October 10, 2011.
- 16.Burkom H, Kniss K, Meltzer MI, et al. Investigating the effect of high spring incidence of pandemic influenza A (H1N1) on early autumn incidence. Epidemiol Infect. 2012;140:2210–2222. [DOI] [PMC free article] [PubMed] [Google Scholar]
- 17.Centers for Disease Control and Prevention. Overview of Influenza Surveillance in the United States. October 2, 2011. Available at: http://www.cdc.gov/flu/weekly/overview.htm/outpatient. Accessed October 10, 2011.
- 18.Creanga AA, Johnson TF, Graitcer SB, et al. Severity of 2009 pandemic influenza A (H1N1) virus infection in pregnant women. Obstet Gynecol. 2010;115:717–726. [DOI] [PubMed] [Google Scholar]
- 19.Creanga AA, Kamimoto L, Newsome K, et al. Seasonal and 2009 pandemic influenza A (H1N1) virus infection during pregnancy: a population-based study of hospitalized cases. Am J Obstet Gynecol. 2011;204:S38–S45. [DOI] [PubMed] [Google Scholar]
- 20.Sutton P, Hamilton B, Mathews T. Recent Decline in Births in United States, 2007–2009 NCHS data brief. Hyattsville, MD: National Center for Health Statistics; 2011;8. [PubMed] [Google Scholar]
- 21.Finelli L, Chaves SS. Influenza and acute myocardial infarction. J Infect Dis. 2011;203:1701–1704.s [DOI] [PubMed] [Google Scholar]
- 22.Grau AJ, Urbanek C, Palm F. Common infections and the risk of stroke. Nat Rev Neurol. 2010;6:681–694. [DOI] [PubMed] [Google Scholar]
- 23.Curry LA, Spatz E, Cherlin E, et al. What distinguishes top-performing hospitals in acute myocardial infarction mortality rates? A qualitative study. Ann Intern Med. 2011;154:384–390. [DOI] [PMC free article] [PubMed] [Google Scholar]
Associated Data
This section collects any data citations, data availability statements, or supplementary materials included in this article.