

ABSTRACT
Background
Microbial metabolism of lignans from high-fiber plant foods produces bioactive enterolignans, such as enterolactone (ENL) and enterodiol (END). Enterolignan exposure influences cellular pathways important to cancer risk and is associated with reduced colon tumorigenesis in animal models and lower colorectal cancer risk in humans.
Objectives
The aim of this study was to test the effects of a flaxseed lignan supplement (50 mg secoisolariciresinol diglucoside/d) compared with placebo on host gene expression in colon biopsies and exfoliated colonocyte RNA in feces and fecal microbial community composition, and to compare responses in relation to ENL excretion.
Methods
We conducted a 2-period randomized, crossover intervention in 42 healthy men and women (20–45 y). We used RNA-seq to measure differentially expressed (DE) genes in colonic mucosa and fecal exfoliated cells through the use of edgeR and functional analysis with Ingenuity Pathway Analysis. We used 16S ribosomal RNA gene (V1–V3) analysis to characterize the fecal microbiome, and measured END and ENL in 24-h urine samples by gas chromatography–mass spectrometry.
Results
We detected 32 DE genes (false discovery rate <0.05) in the exfoliome, but none in the mucosal biopsies, in response to 60 d of lignan supplement compared with placebo. Statistically significant associations were detected between ENL excretion and fecal microbiome measured at baseline and at the end of the intervention periods. Further, we detected DE genes in colonic mucosa and exfoliome between low- and high-ENL excreters. Analysis of biopsy samples indicated that several anti-inflammatory upstream regulators, including transforming growth factor β and interleukin 10 receptor, were suppressed in low-ENL excreters. Complementary analyses in exfoliated cells also suggested that low-ENL excreters may be predisposed to proinflammatory cellular events due to upregulation of nuclear transcription factor κB and NOS2, and an inhibition of the peroxisome proliferator–activated receptor γ network.
Conclusions
These results suggest that ENL or other activities of the associated gut microbial consortia may modulate response to a dietary lignan intervention. This has important implications for dietary recommendations and chemoprevention strategies. This study was registered at clinicaltrials.gov as NCT01619020.
Keywords: human intervention, colon, lignan, enterolactone, secoisolariciresinol, fecal microbiome, gene expression
Introduction
Colorectal cancer (CRC) is the third most common cause of cancer-related deaths in men and women in the United States. Diet and lifestyle are important risk factors for CRC, and increasing intake of plant foods high in dietary fiber has been proposed as one approach to lower CRC risk in populations with low-average fiber intakes (1). In humans, it is not clear whether a protective effect of high-fiber foods may be due to the dietary fiber itself, the phytochemicals in these foods, or the products of bacterial metabolism of components of high-fiber foods (2).
Lignans are abundant in the woody portions of plants, seed coats, and the bran layer of grains. Numerous plant lignans can be converted by gut bacteria to the enterolignans enterodiol (END) and enterolactone (ENL) (3, 4), which are thought to be more biologically active than their precursors. In vitro and animal studies support a role for lignans and lignan-rich foods in the modulation of cancer-related pathways and colon tumorigenesis (5). Experimental evidence suggests that enterolignans possess a variety of biological activities, including antioxidant, antitumor, weak estrogenic, and antiestrogenic properties, and modulate enzymes involved in steroid hormone metabolism (5). However, results of epidemiologic studies evaluating associations between lignan exposure and CRC have been inconsistent, possibly due to variation in the capacity of individuals to produce enterolignans.
Wide ranges in urinary enterolignan excretion have been observed in humans on various habitual diets (6, 7) and in relation to a flaxseed challenge (8–11). Further, pharmacokinetic evaluation of END and ENL profiles with supplementation of the plant lignan secoisolariciresinol diglycoside (SDG) suggests that there is great variation in the microbial production of enterolignans (12). In observational studies, dietary factors account for a modest amount of the variation in enterolignan excretion; and other often unaccounted sources of variation include gastrointestinal transit time, sex, and gut microbiome composition (13). Several studies have reported differences in gut microbial communities among individuals with low and high urinary ENL excretion (14, 15), and ENL production has been linked to the abundance of Rumincoccus bromii and Ruminococcus lactaris (16). The impact of this variation in ENL production on host gut physiologic and immunologic responses to lignan supplementation has not been quantified.
The primary aim of this human mechanistic study was to evaluate, in healthy individuals, the effects of a flaxseed lignan extract on gene expression in colonic mucosa and exfoliated cells in stool. We used a randomized, crossover intervention study to test the effect of dietary lignans compared with placebo on mRNA expression, and to evaluate the modifying effect of gut microbial community on ENL production and the host response. The noninvasive exfoliated transcriptome (exfoliome) and tissue-level transcriptome were also compared in paired samples as a secondary aim.
Methods
Research design
The study was a randomly assigned, double-blind, placebo-controlled crossover intervention comparing supplemental flaxseed lignan extract with placebo (Figure 1). Each intervention period lasted 60 d with at least a 60-d washout period between the 2 interventions, and the baseline colon cleanse was 60 d prior to the start of the first intervention period. All study procedures and materials were approved by the Fred Hutchinson Cancer Research Center (Fred Hutch) Human Research Protection Program, Institutional Review Board Committee B, and Texas A&M University, and informed, written consent was obtained from all participants prior to their starting the study. The study was registered at http://www.clinicaltrials.gov as NCT01619020.
FIGURE 1.

Recruitment and study activities of the FlaxFX study. FFQ, food-frequency questionnaire; Sig, sigmoidoscopy.
Participants
Healthy men and women, aged 20–45 y, were recruited from the greater Seattle area between September 2012 and August 2016. Methods for recruitment included an informational website, flyers posted on university campuses in Seattle, and advertisements in campus and local newspapers. Potential eligibility was assessed initially by questionnaire. Exclusion criteria included age <20 or >45 y; tobacco use; consumption of >2 alcoholic beverages/d (equivalent to 720 mL beer, 240 mL wine, or 90 mL hard liquor); regular use of prescription or over-the-counter medications; oral or intravenous antibiotic use within the past 3 mo; weight loss or gain of >4.5 kg in the past year; current or planned pregnancy; breastfeeding; chronic medical illness; history of gastrointestinal disorder (e.g., ulcerative colitis, Crohn disease, celiac sprue, hereditary nonpolyposis colorectal cancer, familial adenomatous polyposis, pancreatic disease, previous gastrointestinal resection, radiation, or chemotherapy) and cancer (other than nonmelanoma skin cancer); known allergy to nuts, seeds, and flaxseed; contraindications to sigmoidoscopy; inability to swallow pills; and dietary fiber intake ≥20 g/d as assessed with the Block Fruit/Vegetable/Fiber Screener (NutritionQuest) (17). The rationale for excluding individuals with higher fiber intakes was to reduce the exposure to other plant lignans associated with intake of high-fiber foods. Participants who met the initial eligibility criteria completed a self-administered food-frequency questionnaire (18) and a health and demographic survey, and provided a stool sample. After completing the stool collection, prospective participants also consumed the study flaxseed lignan extract for 3 d and completed a 24-h urine collection on day 3 in order to characterize participants as low- or high-ENL excreters for randomization.
Individuals still interested in participating in the intervention underwent further screening before randomization, including a medical history, measurement of blood pressure and complete blood count, liver panel, chemistry panel, blood urea nitrogen, serum creatinine measured in a fasting blood draw, and a urine pregnancy test in women. The screening assays were completed by a commercial laboratory (CLIA-licensed Quest Diagnostics). Individuals with normal laboratory values [white blood cell count 3000–11,000/mm3; platelet count 100,000–400,000 mm3; hematocrit 33–50% (women), 36–50% (men); bilirubin 0.2–1.3 mg/dL; aspartate aminotransferase 0–35 U/L; alanine aminotransferase 0–40 U/L; alkaline phosphatase 20–125 U/L; creatinine ≤1.2 mg/dL; potassium 3.5–5.0 mmol/L] were invited to participate in the study. Participants also completed a colon cleanse with oral magnesium citrate (60 mg/mL, 296 mL; Safeway, Inc.) to ensure that they could tolerate this aspect of the procedure and to provide continuity in gut perturbation across the timeline of the study.
Flaxseed lignan extract supplements
Eligible participants were randomly assigned, blocked on sex and lignan-metabolism status, i.e., ratio of ENL/[secoisolariciresinol (SECO) + END + ENL] in 24-h urine after 3 d of a daily lignan capsule, to the order in which they received lignan extract or placebo. A biostatistician (TWR) generated the random allocation sequence and the project coordinator (LL) enrolled and assigned participants to the intervention sequence. Participants consumed the lignan extract capsule containing 50 mg SDG plus rice bran (Barlene's Organic Oils), or a visually identical placebo (only rice bran), as 1 capsule by mouth daily for 60 d. Capsules were packaged by the manufacturer in sealed plastic bottles with a count of 70 capsules per bottle. All active capsules came from the same lot. Separate testing of the lignan extract in triplicate by HPLC (19) confirmed that the mean SDG content was within specifications. Further, the mean lariciresinol and pinoresinol (other plant lignans) content was 0.8 and 3.0 mg/capsule, respectively. During each intervention period, adherence to the study capsules was monitored by pill count.
Specimen collection
Stool, urine, and blood collection.
Participants collected 24-h urine and stool samples at the beginning and end of each intervention period, prior to preparation for sigmoidoscopy. Stool samples were collected into RNAlater for bacterial measures and additionally into Ambion Denaturation solution (Life Tech) for exfoliated cell RNA (at the end of each period). For bacterial measures, participants were provided with fecal collection tubes with a scoop in the lid (Sarstedt) containing 5 mL preservation solution and 12–15 glass beads (3 mm; Fisher). They were instructed to collect 2 pea-sized aliquots of stool immediately at the time of defecation and place the stool into each of the collection tubes and mix well by shaking. The samples were delivered to the laboratory within 24 h and stored at −80°C. At the time of stool collection, participants also indicated stool consistency through the use of the Bristol Stool Scale (20). Fasting blood samples were also collected at baseline and at the end of each period.
Sigmoidoscopy, biopsy collection, and tissue separation.
A flexible sigmoidoscopy was performed at least 60 d after the start of each intervention period. Participants took the study capsules up until 24 h before sigmoidoscopy and prepared for sigmoidoscopy by adherence to a clear-liquid diet for 24 h before the procedure and drinking oral magnesium citrate solution (296 mL) the evening before. The sigmoidoscopy procedure was conducted in the Gastroenterology suites at the Seattle Cancer Care Alliance Outpatient Clinic. At sigmoidoscopy, a large-cup flexible biopsy forceps [maximum capacity with needle (3.7 mm), Boston Scientific] was used to biopsy normal-appearing mucosa from the sigmoid colon (30–35 cm from the level of the external anal aperture) and rectum (10–12 cm from the level of the external anal aperture, around the second valve of Houston). Seven biopsies were taken at each site. As described previously (21), epithelial cells were separated from the stromal layer. Both fractions were separately stored in Ambion denaturation solution at −80°C until RNA extraction.
Laboratory analyses
Urinary enterolignans.
SECO, END, and ENL were measured by gas chromatography-mass spectrometry in 24-h urine samples collected at the end of each intervention period (22–24). The lowest level of quantitation of the 3 analytes in 2 mL urine was 6.5 ng/mL. Mean intra- and interbatch coefficients of variation for quality control samples were 5.1% and 9.5% for SECO, 8.0% and 11.3% for END, and 4.8% and 6.0% for ENL, respectively.
RNA extraction, sequencing, and gene expression analysis in gut mucosa and exfoliated cells.
Total RNA was isolated from stromal and epithelial biopsies with the use of the Ambion RNAqueous kit following the manufacturer's instructions. Following isolation, DNA was removed with DNAFree (Ambion) and RNA quality was assessed with an Agilent Bioanalyzer 2100 on an RNA 6000 Nano chip. RNA concentrations were measured on a NanoDrop spectrophotometer (Thermo Scientific). Stool polyA+ RNA was isolated with the mTRAP Maxi kit (Active Motif) followed by DNA removal with DNAFree. Sequencing libraries were generated from 250 ng of biopsy RNA with the use of the TruSeq RNA sample preparation kit (Illumina) as previously described (25). Briefly, libraries from stool RNA were generated with 100 ng RNA in the Ovation 3′-DGE kit (NuGEN) to produce cDNA followed by the Encore NGS Library System (NuGEN) to create Illumina libraries. All libraries were quantified through the use of the Library Quantification kit (Kapa Biosystems), and sequencing was performed on an Illumina HiSeq 2500 platform on the Texas A&M campus with standard Illumina protocols. Approximately 32 million 50–bp single-end reads were sequenced for each biopsy sample and 46 million reads for stool samples. RNA reads obtained from sequencing were mapped with the STAR aligner (26) with the use of the default parameters for the Ensembl GRCh38 human reference. Reads were examined for quality control with FastQC (27), and quantified with HTSeq-count (28). RNA sequencing reads were filtered to remove genes present in low abundance. For biopsies, genes with at least 3 counts per million in at least 5 samples were retained. For stool exfoliated cells, the RNA-seq gene count matrix is very sparse, with most entries corresponding to zero transcripts; thus genes in stool were removed if >12 samples contained only 0 or 1 read in both treatment groups.
Fecal microbiome measures.
Stool samples collected in RNAlater were thawed and homogenized, and 2 subsamples were extracted for DNA following previously published protocols (29). For paired-end sequencing of the V1–V3 region of the 16S ribosomal RNA (16S rRNA) gene, we used the 27F mod forward polymerase chain reaction (PCR) primer sequence 5′-AGRGTTNGATCMTGGCTYAG-3′ and the 519R reverse PCR primer sequence 5′-GTNTTACNGCGGCKGCTG-3′ (30) as described previously (29). Sequencing was performed (Molecular Research) on the MiSeq with the use of the MiSeq Reagent Kit version 3 following the manufacturer's guidelines to obtain 2 × 300-bp paired-end reads (Illumina). FastQ files were exported and securely transferred to Fred Hutch (BaseSpace, Illumina) for bioinformatic analysis.
Total Eubacterials were measured with TaqMan real-time PCR (Applied Biosystems, QuantStudio 5) 8FM (5′-AGAGTTTGATCMTGGCTCAG-3′)-530R primers (5′-TTACCGCGGCKGCTGGCAC-3′) and a Bac 338 NED labeled probe (5′-CCAKACTCCTACGGGAGGCAGCAG-3′) (Applied Biosystems), and Archaeal 16S rRNA genes (FW 5′-CCGGGTATCTAATCCGGTTC-3′; 5′-CTCCCAGGGTAGAGGTGAAA-3′; FAM-labeled probe F FAM: 5′-CCGTCAGAATCGTTCCAGTCAG-3′). For quality-control purposes, we used a standard made of DNA extracted from the following pure cultures: Bacillus fragilis HM-20D BEI Resources, Bifobacterium adolescentis 15703D ATCC, Clostridium difficile BAA-1382D-5 ATCC, Veillonella parvula 10790D-5 ATCC, Methanobrevibacteri smithii, DSM 11975, and Escherichia coli. DNA extracted from pure cultures was used to generate standard curves with the same primer probe set. The TaqMan PCR assays were carried out following a standard procedure (30, 31). We expressed M. smithii as a ratio of total Eubacteria in the sample (31). Data were analyzed with QuantStudio software version 1.2.x (Applied Biosystems).
Microbiome bioinformatic analysis.
To classify bacterial taxonomy, sequences were processed with QIIME version 1.9, as previously published except that we used SILVA (release 132) and operational taxonomic unit (OTU) picking was implemented in Vsearch (29, 32, 33). To further evaluate the microbial pathways associated with a dysbiotic gut environment, functional genes within the bacterial LPS synthesis pathway (defined in KEGG, www.genome.jp/pathways/map00540) were imputed from 16S rRNA genes (34).
Statistical analysis
Urinary enterolignans.
Urinary enterolignans (SECO, END, and ENL) were transformed with the natural logarithm to improve the normality of distributions prior to analysis. The distribution of ENL/(SECO + END + ENL) was transformed by squaring the ratio. Zero values were imputed as half the lowest value for each enterolignan. Linear mixed models (Stata version15.1; StataCorp) were used to assess the effects of flaxseed lignan extract compared with placebo on 24-h enterolignan excretion at the end of each intervention. Analyses were adjusted for age, BMI (kg/m2), and sex and assay batch.
Gene expression analysis in gut mucosa and exfoliated cells.
The pipeline for data preprocessing, normalization, and analyses involved testing for differentially expressed (DE) genes, and the identification of combinations of genes that best separated intervention effects in terms of classification error is described in Supplemental Figure 1. The edgeR software package (35) was used for data normalization and DE gene testing. To adjust for sample-to-sample variation with respect to sequencing depth, RNA-seq data were normalized with edgeR, accounting for group effects and applying the upper-quartile method. Subsequently, boxplots of log2-transformed normalized gene counts were generated, and select samples excluded if the median was close to 0 and total gene reads were <100,000. Tagwise dispersions were shrunk toward the trended local-fit dispersion, dispersion estimates obtained, and negative binomial models fitted to the data with edgeR. The generalized linear model option in edgeR was subsequently used to identify DE genes. This procedure was applied uniformly to 3 experimental contrasts: 1) placebo compared with lignan intervention in the biopsy samples; 2) placebo compared with lignan intervention in the exfoliated cells; and 3) low- compared with high-ENL excreters in both biopsy and exfoliated cell samples. Low- and high-ENL excreters were defined as below and above the median 24-h ENL excretion at the end of the lignan extract intervention (23.4 µmol/24 h) (Figure 2). Benjamini-Hochberg (36) false discovery rate (FDR) was used to account for multiple testing, and genes were considered to be DE if the corrected P values were <0.05.
FIGURE 2.

Urinary ENL excretion (24 h) in participants at the end of 60-d placebo (triangles) and lignan (squares) intervention periods. Participants (n = 42) were categorized as low (open symbols) and high (solid symbols) ENL excreters based on median ENL excretion after lignan supplementation (23.4 µmol/24 h). ENL, enterolactone.
Linear discriminant analysis
Multiple genes together often distinguish different classes better than a single gene. Thus, we utilized linear discriminant analysis (LDA) to identify multivariate discriminators (feature gene sets) for intervention classification (25, 37). Specifically, LDA was used to validate and complement the analysis of DE genes. Estimation of the classification error is of critical importance, and when sample size is limited, an error estimator may have a large variance and, therefore, may often be low, even if it is approximately unbiased (37). This can produce many feature sets and classifiers with low error estimates. To mitigate this problem, the bolstered error estimation was applied (38). This procedure places a kernel at each data point and computes the error by integrating the kernels over their misclassification regions, rather than simply by counting incorrectly classified points, thereby giving more weight to points near the classification boundary (37, 38). The result of this approach is a list of highly ranked feature sets possessing minimum bolstered classification error estimates.
Variance filtering
For the exfoliated cell data, the preprocessing and normalization steps described above could not fully account for the high and unequal variance of a subset of genes in each intervention group. In addition, several samples had extremely high gene reads, which could lead to falsely declaring a gene to be DE even after applying the FDR correction step. Thus, we adopted a postprocessing step (Supplemental Figure 1) based on the normalized gene count variance. This postprocessing step was introduced to filter out DE genes with highly variable normalized gene counts in each intervention group. For this purpose, we computed the SD of normalized counts for each gene within the same intervention group. Subsequently, for each intervention, quartiles of the corresponding SDs were adopted with Q3 + 1.5  IQR as a filter cutoff for the respective group, where Q3 is the 75th percentile and IQR is the corresponding calculated interquartile range. Genes with variance of their normalized counts that exceeded that cutoff value were filtered out from the list of the DE genes.
Ingenuity analysis
“Functional enrichment” analysis was performed with Ingenuity Pathway Analysis (IPA) software (Qiagen) as we have previously described (39, 40). This in silico analysis is based on prior knowledge of expected effects between transcriptional regulators and their target genes stored in the Ingenuity Knowledge Base and the observed effects as seen in the DE gene data. A network analysis that used the IPA Network Generation Algorithm was used to identify biologically relevant gene sets. The score computed by IPA for each network indicates the likelihood of the genes being found together in that network by random chance (41).
Microbiome analysis
Files of sequence counts were used in the statistical analysis. To account for the compositional nature of the microbial abundances, we calculated the centered log-ratio (CLR) transform (42). We tested the effect of lignan intervention compared with placebo on α (Shannon-Weaver) and β diversity (first 3 axes from principal coordinates analyses through the use of weighted and unweighted Unifrac distance matrices), and imputed bacterial functional genes (34) based on linear mixed models that accounted for the repeated sampling crossover design and adjusted for age, sex, and BMI. We performed a (global) permutational multivariate MANOVA (43, 44) to test for an effect of the intervention on the fecal microbial community based on the weighted and unweighted Unifrac distance metrics. Finally, in a global test that accounted for the paired microbiome samples, we applied a (penalized) paired Hotelling's T2 test (45) to the CLR-transformed microbial abundance profiles from each participant. Potential carryover effects (including terms for intervention sequence and interaction of intervention × period) were not found to be significant in any of the models.
Next, given the variation in enterolignan excretion in response to the intervention (Figure 2), we investigated the hypothesis that a person's fecal microbial composition is associated with enterolignan production. We examined the association between 24-h urinary ENL and END at the end of the lignan intervention (continuous) and the global microbiome composition at 3 time points (baseline, end-of-placebo, and end-of-intervention). To test for this association, we used ENL and END production as outcomes in MiRKAT (46), adjusted for age, sex, and BMI. As MiRKAT allows for multiple distance measures and adjusts for these in an omnibus test, we used weighted and unweighted Unifrac as well as Euclidean distance applied to CLR-transformed abundances [e.g., (47)]. Similarly, to investigate individual taxa in this association, we fit linear regression models for each of the 80 genera present in >25% of participants after placebo, estimating their effect on urinary enterolignan excretion (continuous) after lignan extract, adjusted for age, sex, and BMI. We fit the same linear mixed model described above for functional genes within the bacterial LPS synthesis pathway. Analyses were performed with Stata version 15.1, and the R programming language (version 1.0.1) (48).
Results
A total of 210 people (mean ± SD age 31.6 ± 8.5 y; 52.4% women) submitted eligibility screening questionnaires in response to study advertisements (Figure 1). Fifty-two participants started the trial with 5 (2 men and 3 women) dropping out before the end of Period 1 because they started on prescription medications, and 1 during Period 2 due to pregnancy. Forty-six participants finished all aspects of the study; however, due to delays in recruitment of the last 4, we include here the 42 for whom biopsy data were available for analysis within the grant timeline. Participant characteristics stratified by sex are presented in Table 1. There were no differences in characteristics by low- and high-ENL excretion (below and above the median; data not shown).
TABLE 1.
Demographics of the FlaxFX study participants (n = 42)1
| Men n = 20 | Women n = 22 | |
|---|---|---|
| Age, y | 33.2 ± 8.7 | 31.4 ± 8.0 |
| Height, cm | 175.9 ± 5.6 | 166.6 ± 9.5 |
| Weight, kg | 80.3 ± 10.7 | 77.3 ± 23.4 |
| BMI, kg/m2 | 26.0 ± 3.9 | 27.7 ± 7.4 |
| Minority, n (%) | 10 (50.0) | 7 (31.8) |
| Family history CRC, n (%) | 0 (0.0) | 3 (13.6) |
| Take supplements, n (%) | 6 (30.0) | 7 (31.8) |
| Ever smoked, n (%) | 1 (5.0) | 4 (18.2) |
| Energy,2 kcal/d | 2250 ± 828 | 1996 ± 495 |
| Total fat,2 g/d | 87 ± 41 | 87 ± 25 |
| Fiber,2 g/d | 23.0 ± 11.8 | 20.1 ± 7.4 |
| Calcium,2 mg/d | 852 ± 424 | 885 ± 375 |
| SECO,3 µmol/24 h | 0.53 (0.03–2.8) | 0.41 (0.03–1.6) |
| END,3 µmol/24 h | 0.93 (0.04–4.4) | 1.83 (0.02–13.2) |
| ENL,3 µmol/24/h | 5.80 (0.1–24.2) | 10.2 (0.03–60.8)4 |
Data are presented as means ± SDs, n (%), or mean (range). CRC, colorectal cancer; END, enterodiol; ENL, enterolactone; SECO, secoisolariciresinol.
Based on 3-d food records: women n = 21 (1 missing).
Values are means (ranges); values at day 0 of first period; urinary enterolignan excretion in µmol/24 h; zeros imputed as half the lowest value for each variable.
Excludes 1 outlier with a baseline value of 107.7 µmol/24-h, although this individual is included in all subsequent analyses.
Participants were on the study capsules for a mean ± SD of 62 ± 3 d and compliance based on capsules returned was 98%, with only 1 participant falling <80% compliance during 1 study period (62% capsules returned during placebo period). Urinary lignan excretion (24 h) of SECO, END, and ENL was statistically significantly higher after the lignan intervention compared with placebo (P < 0.001 for all; Table 2), whereas the ratio ENL/SECO + END + ENL was significantly lower after the lignan intervention. Individual 24-h urinary ENL excretion at the end of the lignan supplement intervention period varied among participants, ranging from 0.02 to 84.36 µmol/24 h (Figure 2). Bristol Stool Scale scores did not differ between the 2 intervention periods (data not shown; P = 0.47).
TABLE 2.
Effects of 60 d of flaxseed lignan extract compared with placebo on urinary enterolignan excretion (n = 42)1
| Lignan | Placebo | Lignan extract | P value2 |
|---|---|---|---|
| SECO | 0.03 (0.006) | 2.95 (0.61) | <0.001 |
| END | 0.38 (1.01) | 5.19 (1.36) | <0.001 |
| ENL | 2.85 (0.67) | 13.62 (3.19) | <0.001 |
| ENL/SECO + END + ENL | 0.77 (0.03) | 0.62 (0.02) | <0.001 |
Urinary enterolignan excretion in µmol/24 h; values presented as back-transformed adjusted geometric means (geometric SDs) or back-transformed square root (SDs) for ratio ENL/SECO + END + ENL. END, enterodiol; ENL, enterolactone; SECO, secoisolariciresinol.
P values derived from linear mixed models evaluating the effects of flaxseed lignan extract compared with placebo on urinary lignan excretion adjusted for age, BMI, sex, intervention sequence, and assay batch.
Gene expression in colonic mucosa and exfoliated cells
Before evaluating the data for intervention effects, we compared gene expression results from biopsy samples and exfoliated cells. A total of 21,011 genes (including noncoding genes, pseudogenes, and protein-coding gene transcripts) were detected in both biopsy and exfoliated cells, accounting for 55% of genes in colonic biopsy samples and 92% of genes in exfoliated cells (Figure 3A). Data preprocessing and filtering resulted in the identification of 15,120 genes from the biopsy samples and 4577 genes from the exfoliated epithelial cell samples (Figure 3B and Supplemental Figure 1).
FIGURE 3.

Venn diagrams representing detectable transcripts in colonic biopsies and exfoliated cells. (A) A total of 21,011 genes (including noncoding genes, pseudogenes, and protein-coding gene transcripts) were detected in both gut mucosal biopsy samples and exfoliated cells, accounting for 92% of genes in exfoliated cells and 55% of genes in colonic biopsy samples (n = 219 biopsy samples and 54 exfoliated samples). (B) Data preprocessing and filtering resulted in the identification of 15,120 genes from the biopsy samples and 4577 genes from the exfoliated epithelial cells samples.
The anatomic origin of the gene expression signature derived from the exfoliated cells (exfoliome) was determined. We extracted the counts of genes previously identified and expressed predominantly in specific anatomic locations (i.e., stomach, pancreas, small intestine, and colon). Interestingly, the exfoliome contained virtually no reads from genes representing the stomach or pancreas. In contrast, there was a signature arising from both the colon and small intestine (Figure 4A). In addition to the anatomic origin, we also evaluated the cell types represented in the colonic mucosal biopsies and exfoliome. For this purpose, we reviewed the literature for marker genes expressed either solely by a specific cell type or at least highly enriched in a specific cell type (25). As expected, the mucosal biopsies expressed many gene markers suggesting the contribution of crypt epithelial cells, including goblet cells. Further examination of the exfoliome revealed the expression of marker genes typically associated with intestinal enteroendocrine and tuft cells (Figure 4B).
FIGURE 4.

Comparison of gene expression in stroma and epithelial tissue from biopsies and exfoliome in stool. The exfoliome signature arises from cells sloughed from both the small intestine and colon and comprises reads from a diverse array of cell types expected to be found in the intestinal mucosa. (A) Heatmap showing counts of genes that are reported to be primarily expressed at specific anatomic locations (stomach, pancreas, small intestine, colon). All genes with counts >400 are dark blue. (B) Heatmap showing counts of biomarker genes from each cell type and each data source. N = 219 biopsy samples and 54 exfoliated samples. Abbreviations in Supplemental Table 7 and at https://www.ncbi.nlm.nih.gov/gene/.
After characterizing the cellular source of the gene signatures, we examined the biopsy and exfoliome transcriptomes for alterations induced by lignan treatment. Assessment of biopsy gene expression patterns revealed no DE genes (FDR <0.05) upon comparison of the lignan extract with placebo interventions. This finding was further substantiated by the 2-gene LDA, where the minimum classification error among all possible feature sets of size 2 was 0.34. Typically, a misclassification error of 0.5 is regarded as a random assignment providing no meaningful information for identifying couples of genes that can differentiate intervention from control effects. In contrast, testing for intervention effects in exfoliated cell samples revealed 973 DE genes (FDR <0.05) genes (Figure 5A), of which 32 passed the variance filter and were also identified by 2-gene LDA with a bolstered resubstitution error <0.227 (Supplemental Table 1). Gene ontology analysis revealed enrichment for several genes involved in cancer (e.g., translocation associated membrane protein 1(TRAM1), IL-18, homeobox A10(HOXA10), hes family bHLH transcription factor 1(HES1), and ATP binding cassette subfamily A member 5 (ABCA5), and expression of RNA, e.g., ASXL transcriptional regulator 2 (ASXL2), cAMP responsive element binding protein 3 like 3 (CREB3L3), eukaryotic translation initiation factor 5 (EIF5), iron responsive element binding protein 2 (IREB2), and nuclear receptor coactivator 2 (NCOA2)).
FIGURE 5.

Overlap of DE genes. (A) Depiction of the overlap between the DE (FDR <0.05) genes with respect to lignan intervention compared with placebo in exfoliated cells (n = 54 samples). LDA identified genes (bolstered resubstitution error <0.227), and the genes that successfully passed the low variance filter. Testing for intervention effects in exfoliated cell samples revealed 973 DE (FDR <0.05) genes. Among those genes, 32 (star) were also identified in 2-gene LDA with bolstered resubstitution error <0.227 and passed the low variance postprocessing step. (B) Depiction of the overlap between the DE (FDR <0.05) protein-coding genes with respect to low- compared with high-ENL excreter status in biopsies (n = 219 samples) and exfoliated cells (n = 54 samples). See Supplemental Tables 2 and 3 for additional details. DE, differentially expressed; ENL, enterolactone; FDR, false detection rate; LDA, linear discriminant analysis.
Given that urinary ENL excretion varied substantially among individuals in response to the lignan intervention (Figure 2), we examined DE separately in low- compared with high-ENL excreters (Figure 5B). Assessment of biopsy gene expression patterns revealed 552 DE genes (FDR <0.05) upon comparison of the low- with the high-ENL excreters (Figure 5B and Supplemental Table 2). In comparison, examination of exfoliated cells revealed 1113 DE genes (FDR <0.05), with only 28 DE in common between the biopsies and exfoliome (Supplemental Tables 2 and 3). To identify host gene networks and upstream regulators modulated by ENL status, we performed an IPA upstream regulator analysis. Initially, we quantified known targets of transcriptional regulators present in our data set and compared their direction of change (over- or underexpression) to predict likely relevant regulators including transcription factors, nuclear receptors, and enzymes (Supplemental Table 4). Figure 6 provides a representation of highly ranked upstream regulators and their respective annotated DE genes. The complete ranked list is described in Supplemental Table 5. Biopsies from low-ENL compared with high-ENL excreters exhibited a suppression of the immune regulatory genes associated with transforming growth factor β (TGFβ) (Figure 6A) and interleukin 10 (IL-10) receptor (Figure 6B) signaling. Exfoliated cell analyses indicated an activation of gut cell metabolism gene regulators nuclear transcription factor κB (NF-κB) (Figure 6C) and NOS2 (Figure 6D) in low-ENL excreters. Low-ENL excreters compared with high-ENL excreters also exhibited an inhibition of the peroxisome proliferator–activated receptor γ (PPARγ) network in the exfoliome (Figure 7). The complete ranked list is described in Supplemental Table 6.
FIGURE 6.

Differentially expressed genes and upstream regulators in colon biopsies and exfoliated cells. Colon biopsies: TGFβ1 (A), IL-10 receptor (B). Exfoliated cells: NF-κB (C) and NOS2 (D). z Scores >2.0, P values <0.05. See Supplemental Tables 4 and 5 for additional details. Data are derived from 219 biopsy samples and 54 exfoliated samples that had a fold change of >1.3 or <−1.3 and an FDR of <0.05. IL-10, interleukin 10; NF-κB, nuclear transcription factor κB; TGFβ1, transforming growth factor β. Abbreviations in Supplemental Table 7 and at https://www.ncbi.nlm.nih.gov/gene/.
FIGURE 7.

Exfoliated cell network. PPARγ signaling activity network was the highest scoring network, with low-ENL excreters < high-ENL excreters. Green represents underexpressed mRNAs (low-ENL < high-ENL). Red represents overexpression. See Supplemental Table 6 for additional details. ENL, enterolactone; PPARγ, peroxisome proliferator–activated receptor γ. Abbreviations in Supplemental Table 7 and at https://www.ncbi.nlm.nih.gov/gene/.
Fecal microbiome
In the fecal samples from this study, we identified 9 phyla, 15 classes, 20 orders, 44 families, 147 genera, and 1324 OTUs. There was an mean ± SD of 27,000 ± 12,000 sequences per sample and a mean ± SD sequence length of 503 ± 27 bp. No statistically significant intervention effect on α diversity (Shannon-Weaver) (P = 0.28) was observed. There were no significant differences in the microbial community structure between the placebo and the intervention period according to paired (Hotelling's T2, P = 0.25) or unpaired multivariate tests (mirKAT P > 0.4 for all distance metrics). Further, no individual genera were statistically significantly different between lignan and placebo intervention (FDR <0.05; data not shown).
Given that the effects of lignan intervention on colonic gene expression may depend on exposure to ENL or reflect an ENL-producing microbial phenotype, we evaluated the association between fecal microbiome parameters at each of the 3 stool sampling times (baseline, and end of lignan and placebo intervention) and urinary ENL and END excretion (continuous variables) at the end of the lignan intervention. ENL, but not END, was statistically significantly associated with microbiome composition (Table 3), and Figure 8 illustrates this observed association between ENL and microbial composition. Eleven bacterial genera plus Methanobrevibacter in the domain Archaea were statistically significantly associated with ENL and 3 were associated with END after lignan intervention at a nominal P < 0.05 (Table 4). After controlling for FDR <0.1, the relative abundance of one genus, Alistipes, remained significantly positively associated with ENL. The microbial LPS synthesis pathway was statistically significantly inversely associated with ENL excretion (β coefficient: −0.66; 95% CI: −1.32, −0.01; P = 0.049; data not shown).
TABLE 3.
Kernel association test results between 24-h excretion of END or ENL and global microbial composition at each of 3 time points1
| Gut microbial community sampling time | Urinary lignan variable | Unweighted Unifrac P value | Weighted Unifrac P value | Centered log-ratio P value | Omnibus test P value |
|---|---|---|---|---|---|
| At baseline (n = 34) | ENL | 0.006 | 0.520 | 0.109 | 0.020 |
| END | 0.742 | 0.540 | 0.192 | 0.425 | |
| After placebo (n = 36) | ENL | 0.007 | 0.057 | 0.017 | 0.023 |
| END | 0.292 | 0.609 | 0.124 | 0.306 | |
| After lignan (n = 35) | ENL | 0.006 | 0.798 | 0.134 | 0.020 |
| END | 0.541 | 0.694 | 0.402 | 0.688 |
All tests were adjusted for sex, BMI, and age. The MiRKAT test allows for multiple distance measures (3 used here) and adjusts for these in an omnibus test. The centered log-ratio column refers to a kernel association test based on Euclidean distances between genus-level abundances that were transformed by the centered log-ratio. END, enterodiol; ENL, enterolactone.
FIGURE 8.
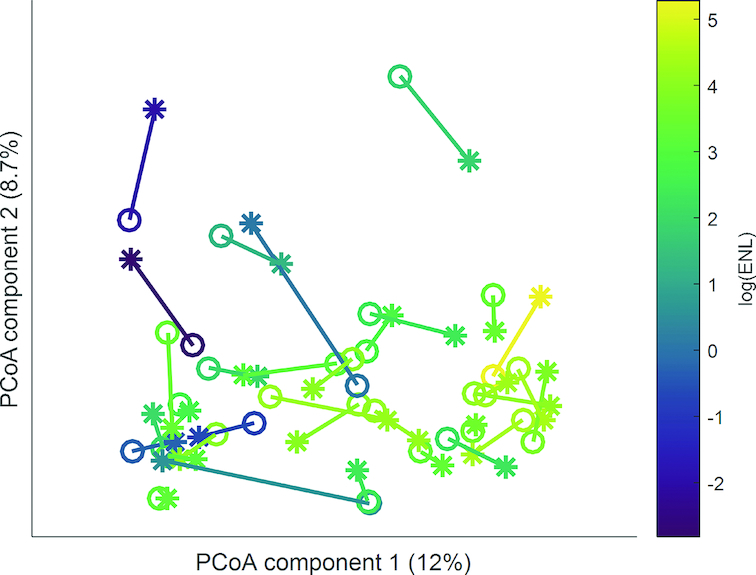
Plot based on the first two PCoA axes from unweighted Unifrac. A line connects within-person placebo (open circle) and lignan intervention (star) gut microbiome samples, with each participant colored by log(µmol/24-h) urinary ENL excretion at end of the lignan intervention period (n = 33). ENL, enterolactone; PCoA, principal coordinates analysis.
TABLE 4.
Association between gut bacterial genera at the end of placebo period and urinary ENL and END excretion after 60 d of lignan extract (n = 38)1
| Bacterial taxon | n (%) of 38 participants harboring each genus | Direction of association2 | P value |
|---|---|---|---|
| ENL | |||
| Bacteria; Bacteroidetes; Bacteroidia; Bacteroidales; Rikenellaceae; Alistipes | 37 (97) | + | 0.0013 |
| Bacteria; Proteobacteria; Alphaproteobacteria; Rhodospirillales; uncultured; uncultured bacterium | 5 (13) | + | 0.004 |
| Bacteria; Firmicutes; Clostridia; Clostridiales; Ruminococcaceae; Ruminococcus2 | 21 (55) | + | 0.01 |
| Bacteria; Firmicutes; Clostridia; Clostridiales; Lachnospiraceae; [Eubacterium] xylanophilum group | 14 (37) | + | 0.015 |
| Archaea; Euryarcheota; Methanobacteria; Methanobacteriales; Methanobacteriaceae; Methanobrevibacter | 22 (61) | + | 0.015 |
| Bacteria; Firmicutes; Clostridia; Clostridiales; Ruminococcaceae; UBA1819 | 7 (18) | − | 0.024 |
| Bacteria; Firmicutes; Clostridia; Clostridiales; Lachnospiraceae; Roseburia | 38 (100) | + | 0.026 |
| Bacteria; Firmicutes; Clostridia; Clostridiales; Lachnospiraceae; Coprococcus3 | 17 (45) | − | 0.034 |
| Bacteria; Firmicutes; Clostridia; Clostridiales; Lachnospiraceae; CAG-56 | 5 (13) | − | 0.039 |
| Bacteria; Proteobacteria; Deltaproteobacteria; Desulfovibrionales; Desulfovibrionaceae; Bilophila | 13 (34) | − | 0.040 |
| Bacteria; Firmicutes; Clostridia; Clostridiales; Lachnospiraceae; [Ruminococcus] gnavus group | 9 (24) | − | 0.048 |
| Bacteria; Firmicutes; Clostridia; Clostridiales; Lachnospiraceae; Dorea | 38 (100) | − | 0.049 |
| END | |||
| Bacteria; Cyanobacteria; Melainabacteria; Gastranaerophilales; uncultured_bacterium; Other | 4 (11) | − | 0.023 |
| Bacteria; Bacteroidetes; Bacteroidia; Bacteroidales; Barnesiellaceae; Barnesiella | 20 (53) | + | 0.034 |
| Bacteria; Firmicutes; Clostridia; Clostridiales; Ruminococcaceae; CAG-352 | 6 (16) | + | 0.043 |
Results from linear regression models for the association of urinary enterolignan excretion (continuous) after lignan intervention with each genus abundance at the end of placebo period, adjusted for sex, BMI, and age; only genera significant at P < 0.05 are listed. END, enterodiol; ENL, enterolactone.
+, higher relative abundance in high- compared with low-ENL excreters; −, lower relative abundance in high- compared with low-ENL excreters.
Significant with Benjamini-Hochberg false discovery rate (<0.1 for 80 tests within each analysis for ENL and END).
Discussion
Transcriptomic profiling of colon biopsies and exfoliated cells in stool was used to evaluate the effect of a 60-d flaxseed lignan intervention as compared with placebo on pathways relevant to colon cancer risk. We detected modest differences in colonic gene expression and the exfoliome in response to the supplement. However, we identified significant contributions of the gut microbiome to production of the enterolignan ENL during the lignan intervention, and substantial differences in colonic and exfoliome gene expression between low- and high-ENL excreters.
Effect of intervention on gene expression: utility of exfoliated cells compared with biopsies
This study was novel in that it included a comparison of intervention response in both colonic mucosal biopsies and exfoliated cells within the same individual. In general, the exfoliated cells (exfoliome) contained fewer genes attributable to the human genome than the epithelial cell (tissue) transcriptome from colon biopsies (Figure 3). This is consistent with our previous findings where we demonstrated that the exfoliated transcriptome reflects a subset of the tissue-level transcriptome in a mouse model of nonsteroidal anti-inflammatory drug enteropathy (25). Although we did not attempt to identify the precise sources of cells, marker genes representing various anatomic regions and cell types revealed that the signature in the exfoliome was derived from both the small intestine and colon with virtually no signature coming from the stomach or pancreas (Figure 4). Many of the cell types associated with the colonic mucosa (epithelium and stroma) were present in the exfoliome, suggesting contribution from a variety of mucosal cell types. These findings corroborate and extend previous observations made in mice (25).
Having established that the exfoliome and transcriptome from colonic epithelial biopsies were uniquely influenced by ENL-excreter phenotype (Figure 5B), we used DE gene data to examine which pathways and upstream regulators (driver genes) were both modulated by ENL excreter status and implicated in gut homeostasis. Analysis of biopsy samples indicated that several anti-inflammatory upstream regulators including transforming growth factor β (49) and IL-10 receptor (50, 51) were suppressed in low-ENL excreters (Supplemental Table 4 and Figure 6). Complementary analyses in exfoliated cells also suggested that low-ENL excreters may be predisposed to proinflammatory events due to the upregulation of NF-κB and NOS2 (52, 53) (Figure 6) and inhibition of the PPARγ network (Figure 7). Interestingly, emerging evidence indicates that colonocyte metabolism determines the types of microbes that thrive in the gut (54, 55). This new paradigm identifies energy metabolism of surface colonocytes as a factor critical to controlling oxygen availability and dysbiosis in the lumen of the colon. Low- compared with high-ENL excreters exhibited differences in the activation status of PPARγ, NOS2, and NF-κB consistent with a signature of epithelial dysfunction (56).
Effect of intervention on fecal microbiome and ENL-excreter phenotype
The lignan intervention did not change fecal microbial community composition compared with placebo—a finding that was not unexpected. Lagkouvardos et al. (16) also reported, in the context of a 1-wk flaxseed intervention, that overall diversity and the composition of dominant bacteria remained similar and participant specific. Studies suggest that there is a strong association between gut microbial community and habitual diet and that, experimentally, substantial changes in diet can alter gut microbial community structure (57–59). In contrast, supplementation with 50 mg SDG appears to be a minor perturbation. Further, production of ENL requires a polymicrobial consortium, and the members that are identified in conjunction with ENL production are often subdominant groups (60). Consequently, each member of the consortium may not contribute strongly to overall microbial composition although the overall consortium confers a metabolic phenotype that may affect host health. Future studies that incorporate microbial pathway analysis estimated from measures of microbial functional genes (i.e., metatranscriptomics) may capture more robustly the polymicrobial contribution to the ENL phenotype.
Several striking patterns emerge that give insight into the role of the microbiome in ENL production and the impact on health outcomes. ENL production may be a hallmark of a healthy lifestyle since several of the genera positively associated with END and ENL excretion in our study (e.g., Alistipes, Barnesiella, Ruminococcaceae) have also been correlated with health in a large cross-study meta-analysis (61). However, signals associated with consortial production of ENL are complex. The conversion of SDG to END and ENL involves 4 major catalytic reactions—O-deglycosylation, O-demethylation, dihydroxylation, and dehydrogenation—and requires consortial metabolism to produce ENL (16). Not only are numerous enzymatic reactions involved to produce ENL but each reaction is catalyzed by a specialized group of bacteria that is often a minor component of the overall microbiome (13, 14). This is evident here, since global analysis based on presence/absence showed stronger association between microbial composition and postintervention ENL production (Table 3).
We also found evidence of certain bacteria involved in consortial production of ENL, although the signal did not survive adjustment for multiple comparisons (Table 4). ENL production has been linked to abundance of Ruminococcus bromii and Ruminococcus lactaris (16), and a member of the Ruminococcaceae was positively associated with ENL production. Methanobrevibacter tended to be in higher abundance in high-ENL excreters. Methanobrevibacteri smithii is central to the syntrophic hydrogen metabolism that may be important to ENL production (62). In addition, Bilophila was inversely associated with ENL production. Some members of this desulfodigenic group can metabolize bile salts and are reduced with consumption of a high plant food-based diet (57). Given the complexity of ENL production as outlined above, it is not surprising that single bacterial groups are not easily identified with ENL production in humans.
The LPS synthesis pathway was significantly inversely associated with ENL production. LPS, a component of the cell wall material from gram-negative bacteria, activates an inflammation cascade through NF-κB by binding to Toll-like receptors (63). Other studies have shown that the LPS pathway is associated with inflammation in obesity (64, 65). Taken together with our colonic gene expression findings, these data suggest that the low-ENL excreter phenotype is associated with microbial signatures of epithelial dysfunction.
The strengths of the study include the use of a randomized, placebo-controlled crossover study design in which each person served as his or her own control. Use of a flaxseed lignan extract isolated the effects of SDG compared with other components in flaxseeds and lignan-rich foods, thus reducing confounding effects from exposure to other bioactive compounds. Instead of relying on urinary or plasma ENL concentrations, we characterized ENL excreter status through the use of 24-h urine collections after 60 d of SDG supplementation, which provides a more robust estimate of an individual's microbial capacity to produce ENL. Limitations included the small sample size, which reduced our statistical power for stratified analyses. Several technical and logistic aspects of the study may also have made it more difficult to detect subtle changes in biopsy gene expression with the lignan intervention. The clear liquid diet and oral magnesium citrate solution may have changed gene expression in the colon cells (obtained via biopsy) to a greater degree than in the exfoliome (collected prior to colon preparation), contributing to differences between the two types of samples. It may also explain in part why statistically significantly DE genes in response to intervention were detected in the exfoliated cells, but not the biopsies. Alternatively, changes in gene expression may be more pronounced in the right compared with the left side of the colon, such that changes are not detected in sigmoid colon biopsies, but are detected in the exfoliome, which includes cells sloughed from the length of the large bowel. Further investigation of the differences in these transcriptional profiles is warranted. This study also would be enhanced by the use of metatranscriptomics to evaluate changes in fecal bacterial gene expression.
In conclusion, among all participants, we detected modest differences in the colonic mucosal transcriptome and the exfoliome in response to a 60-d flaxseed lignan intervention. In contrast, the finding that metabolic and inflammatory pathways in colonic mucosa and exfoliated cells differed between the low- and high-ENL excreters suggests that ENL or other activities of the associated gut microbial consortia are modulators of response to a dietary lignan intervention. This has important implications for personalized dietary recommendations and chemoprevention strategies (i.e., not all individuals will experience sufficient exposure to ENL as a result of plant lignan consumption so as to elicit a beneficial, cancer-preventive response).
Supplementary Material
Acknowledgments
We thank Rachel C. Wright for generating the summary diagrams.
The authors’ responsibilities were as follows—JWL, MAJH, RSC, II, and TWR: designed the study; LL, AMK, CD, and DMH: conducted the research; EK, LAD, JSG, FLM, SLN, TWR, NZ, II, and MAJH: analyzed the specimens and data; JWL, RSC, MAJH, EK, LAD, SLN, TWR, and II: wrote the paper; AMK, CD, and DMH: provided critical review; JWL: had primary responsibility for final content; and all authors: read and approved the final manuscript. None of the authors reported a conflict of interest related to the study.
Notes
Supported by US NIH grants U01 CA162077, R35 CA197707, and P30 CA015704 and funds from the Allen Endowed Chair in Nutrition & Chronic Disease Prevention. This material is the result of work supported in part by resources from the VA Puget Sound Health Care System (AMK). The views expressed in this article are those of the authors and do not necessarily represent the views of the Department of Veterans Affairs.
MAJH and RSC share senior authorship.
Supplemental Figure 1 and Supplemental Tables 1–6 are available from the “Supplementary data” link in the online posting of the article and from the same link in the online table of contents at https://academic.oup.com/ajcn/.
Abbreviations used: CLR, centered log-ratio; CRC, colorectal cancer; DE, differentially expressed; END, enterodiol; ENL, enterolactone; FDR, false discovery rate; IPA, Ingenuity Pathway Analysis; LDA, linear discriminant analysis; NF-κB, nuclear transcription factor κB; PCR, polymerase chain reaction; PPARγ, peroxisome proliferator–activated receptor γ; SECO, secoisolariciresinol; SDG, secoisolariciresinol diglycoside; 16S rRNA, 16S ribosomal RNA.
References
- 1. World Cancer Research Fund/American Institute for Cancer Research. Continuous Update Project Expert Report: diet, nutrition, physical activity and colorectal cancer. http://www.dietandcancerreport.org. 2018. [Google Scholar]
- 2. Trock B, Lanza E, Greenwald P. Dietary fiber, vegetables, and colon cancer: critical review and meta-analyses of the epidemiologic evidence. J Natl Cancer Inst. 1990;82:650–61. [DOI] [PubMed] [Google Scholar]
- 3. Heinonen S, Nurmi T, Liukkonen K, Poutanen K, Wähälä K, Deyama T, Nishibe S, Adlercreutz H. In vitro metabolism of plant lignans: new precursors of mammalian lignans enterolactone and enterodiol. J Agric Food Chem. 2001;49:3178–86. [DOI] [PubMed] [Google Scholar]
- 4. Raffaelli B, Hoikkala A, Leppala E, Wähälä K. Enterolignans. J Chromatogr B Analyt Technol Biomed Life Sci. 2002;777:29–43. [DOI] [PubMed] [Google Scholar]
- 5. Webb AL, McCullough ML. Dietary lignans: potential role in cancer prevention. Nutr Cancer. 2005;51:117–31. [DOI] [PubMed] [Google Scholar]
- 6. Adlercreutz H, Fotsis T, Heikkinen R, Dwyer JT, Goldin BR, Gorbach SL, Lawson AM, Setchell KD. Diet and urinary excretion of lignans in female subjects. Med Biol. 1981;59:259–61. [PubMed] [Google Scholar]
- 7. Adlercreutz H, Musey PI, Fotsis T, Bannwart C, Wähälä K, Mäkelä T, Brunow G, Hase T. Identification of lignans and phytoestrogens in urine of chimpanzees. Clin Chim Acta. 1986;158:147–54. [DOI] [PubMed] [Google Scholar]
- 8. Cunnane SC, Hamadeh MJ, Liede AC, Thompson LU, Wolever TM, Jenkins DJ. Nutritional attributes of traditional flaxseed in healthy young adults. Am J Clin Nutr. 1995;61:62–8. [DOI] [PubMed] [Google Scholar]
- 9. Hutchins AM, Martini MC, Olson BA, Thomas W, Slavin JL. Flaxseed influences urinary lignan excretion in a dose-dependent manner in postmenopausal women. Cancer Epidemiol Biomarkers Prev. 2000;9:1113–8. [PubMed] [Google Scholar]
- 10. Lampe JW, Martini MC, Kurzer MS, Adlercreutz H, Slavin JL. Urinary lignan and isoflavonoid excretion in premenopausal women consuming flaxseed powder. Am J Clin Nutr. 1994;60:122–8. [DOI] [PubMed] [Google Scholar]
- 11. Nesbitt PD, Lam Y, Thompson LU. Human metabolism of mammalian lignan precursors in raw and processed flaxseed. Am J Clin Nutr. 1999;69:549–55. [DOI] [PubMed] [Google Scholar]
- 12. Kuijsten A, Arts IC, Vree TB, Hollman PC. Pharmacokinetics of enterolignans in healthy men and women consuming a single dose of secoisolariciresinol diglucoside. J Nutr. 2005;135:795–801. [DOI] [PubMed] [Google Scholar]
- 13. Clavel T, Henderson G, Engst W, Dore J, Blaut M. Phylogeny of human intestinal bacteria that activate the dietary lignan secoisolariciresinol diglucoside. FEMS Microbiol Ecol. 2006;55:471–8. [DOI] [PubMed] [Google Scholar]
- 14. Hullar MA, Lancaster SM, Li F, Tseng E, Beer K, Atkinson C, Wahala K, Copeland WK, Randolph TW, Newton KM et al.. Enterolignan-producing phenotypes are associated with increased gut microbial diversity and altered composition in premenopausal women in the United States. Cancer Epidemiol Biomarkers Prev. 2015;24:546–54. [DOI] [PMC free article] [PubMed] [Google Scholar]
- 15. Holma R, Kekkonen RA, Hatakka K, Poussa T, Vapaatalo H, Adlercreutz H, Korpela R. Low serum enterolactone concentration is associated with low colonic Lactobacillus-Enterococcus counts in men but is not affected by a synbiotic mixture in a randomised, placebo-controlled, double-blind, cross-over intervention study. Br J Nutr. 2014;111:301–9. [DOI] [PubMed] [Google Scholar]
- 16. Lagkouvardos I, Klaring K, Heinzmann SS, Platz S, Scholz B, Engel KH, Schmitt-Kopplin P, Haller D, Rohn S, Skurk T et al.. Gut metabolites and bacterial community networks during a pilot intervention study with flaxseeds in healthy adult men. Mol Nutr Food Res. 2015;59:1614–28. [DOI] [PubMed] [Google Scholar]
- 17. Block G, Gillespie C, Rosenbaum EH, Jenson C. A rapid food screener to assess fat and fruit and vegetable intake. Am J Prev Med. 2000;18:284–8. [DOI] [PubMed] [Google Scholar]
- 18. Patterson RE, Kristal AR, Tinker LF, Carter RA, Bolton MP, Agurs-Collins T. Measurement characteristics of the Women's Health Initiative food frequency questionnaire. Ann Epidemiol. 1999;9:178–87. [DOI] [PubMed] [Google Scholar]
- 19. Peñalvo JL, Haajanen KM, Botting N, Adlercreutz H. Quantification of lignans in food using isotope dilution gas chromatography/mass spectrometry. J Agric Food Chem. 2005;53:9342–7. [DOI] [PubMed] [Google Scholar]
- 20. Heaton KW, Radvan J, Cripps H, Mountford RA, Braddon FE, Hughes AO. Defecation frequency and timing, and stool form in the general population: a prospective study. Gut. 1992;33:818–24. [DOI] [PMC free article] [PubMed] [Google Scholar]
- 21. Knight JM, Kim E, Ivanov I, Davidson LA, Goldsby JS, Hullar MA, Randolph TW, Kaz AM, Levy L, Lampe J et al.. Comprehensive site-specific whole genome profiling of stromal and epithelial colonic gene signatures in human sigmoid colon and rectal tissue. Physiol Genomics. 2016;48:651–9. [DOI] [PMC free article] [PubMed] [Google Scholar]
- 22. Atkinson C, Lampe JW, Scholes D, Chen C, Wähälä K, Schwartz SM. Lignan and isoflavone excretion in relation to uterine fibroids: a case-control study of young to middle-aged women in the United States. Am J Clin Nutr. 2006;84:587–93. [DOI] [PubMed] [Google Scholar]
- 23. Lampe JW, Atkinson C, Hullar MA. Assessing exposure to lignans and their metabolites in humans. J AOAC Int. 2006;89:1174–81. [PubMed] [Google Scholar]
- 24. Song KB, Atkinson C, Frankenfeld CL, Jokela T, Wähälä K, Thomas WK, Lampe JW. Prevalence of daidzein-metabolizing phenotypes differs between Caucasian and Korean American women and girls. J Nutr. 2006;136:1347–51. [DOI] [PubMed] [Google Scholar]
- 25. Whitfield-Cargile CM, Cohen ND, He K, Ivanov I, Goldsby JS, Chamoun-Emanuelli A, Weeks BR, Davidson LA, Chapkin RS. The non-invasive exfoliated transcriptome (exfoliome) reflects the tissue-level transcriptome in a mouse model of NSAID enteropathy. Sci Rep. 2017;7:14687. [DOI] [PMC free article] [PubMed] [Google Scholar]
- 26. Dobin A, Davis CA, Schlesinger F, Drenkow J, Zaleski C, Jha S, Batut P, Chaisson M, Gingeras TR. STAR: ultrafast universal RNA-seq aligner. Bioinformatics. 2013;29:15–21. [DOI] [PMC free article] [PubMed] [Google Scholar]
- 27. D'Antonio M, D'Onorio De Meo P, Pallocca M, Picardi E, D'Erchia AM, Calogero RA, Castrignano T, Pesole G. RAP: RNA-Seq Analysis Pipeline, a new cloud-based NGS web application. BMC Genomics. 2015;16:S3. [DOI] [PMC free article] [PubMed] [Google Scholar]
- 28. Anders S, Pyl PT, Huber W. HTSeq—a Python framework to work with high-throughput sequencing data. Bioinformatics. 2015;31:166–9. [DOI] [PMC free article] [PubMed] [Google Scholar]
- 29. Fu BC, Randolph TW, Lim U, Monroe KR, Cheng I, Wilkens LR, Le Marchand L, Lampe JW, Hullar MAJ. Temporal variability and stability of the fecal microbiome: the Multiethnic Cohort Study. Cancer Epidemiol Biomarkers Prev. 2018:10.1158/055-9965.Epi-18-0348. NIHMS 1506461. [DOI] [PMC free article] [PubMed] [Google Scholar]
- 30. Baker GC, Smith JJ, Cowan DA. Review and re-analysis of domain-specific 16S primers. J Microbiol Methods. 2003;55:541–55. [DOI] [PubMed] [Google Scholar]
- 31. DeLong EF. Archaea in coastal marine environments. Proc Natl Acad Sci USA. 1992;89:5685–9. [DOI] [PMC free article] [PubMed] [Google Scholar]
- 32. Rognes T, Flouri T, Nichols B, Quince C, Mahe F. VSEARCH: a versatile open source tool for metagenomics. Peer J. 2016;4:e2584. [DOI] [PMC free article] [PubMed] [Google Scholar]
- 33. Caporaso JG, Kuczynski J, Stombaugh J, Bittinger K, Bushman FD, Costello EK, Fierer N, Pena AG, Goodrich JK, Gordon JI et al.. QIIME allows analysis of high-throughput community sequencing data. Nat Methods. 2010;7:335–6. [DOI] [PMC free article] [PubMed] [Google Scholar]
- 34. Langille MGI, Zaneveld J, Caporaso JG, McDonald D, Knights D, Reyes JA, Clemente JC, Burkepile DE, Thurber RLV, Knight R et al.. Predictive functional profiling of microbial communities using 16S rRNA marker gene sequences. Nat Biotechnol. 2013;31:814–21. [DOI] [PMC free article] [PubMed] [Google Scholar]
- 35. Robinson MD, McCarthy DJ, Smyth GK. edgeR: a Bioconductor package for differential expression analysis of digital gene expression data. Bioinformatics. 2010;26:139–40. [DOI] [PMC free article] [PubMed] [Google Scholar]
- 36. Benjamini Y, Hochberg Y. Controlling the false discovery rate—a practical and powerful approach to multiple testing. J Roy Stat Soc B Met. 1995;57:289–300. [Google Scholar]
- 37. Chapkin RS, Zhao C, Ivanov I, Davidson LA, Goldsby JS, Lupton JR, Mathai RA, Monaco MH, Rai D, Russell WM et al.. Noninvasive stool-based detection of infant gastrointestinal development using gene expression profiles from exfoliated epithelial cells. Am J Physiol Gastrointest Liver Physiol. 2010;298:G582–9. [DOI] [PMC free article] [PubMed] [Google Scholar]
- 38. Braga-Neto U, Dougherty E. Bolstered error estimation. Pattern Recogn. 2004;37:1267–81. [Google Scholar]
- 39. Triff K, McLean MW, Konganti K, Pang J, Callaway E, Zhou B, Ivanov I, Chapkin RS. Assessment of histone tail modifications and transcriptional profiling during colon cancer progression reveals a global decrease in H3K4me3 activity. Biochim Biophys Acta. 2017;1863:1392–402. [DOI] [PMC free article] [PubMed] [Google Scholar]
- 40. Triff K, Konganti K, Gaddis S, Zhou B, Ivanov I, Chapkin RS. Genome-wide analysis of the rat colon reveals proximal-distal differences in histone modifications and proto-oncogene expression. Physiol Genomics. 2013;45:1229–43. [DOI] [PMC free article] [PubMed] [Google Scholar]
- 41. Long F, Liu H, Hahn C, Sumazin P, Zhang MQ, Zilberstein A. Genome-wide prediction and analysis of function-specific transcription factor binding sites. In Silico Biol. 2004;4:395–410. [PubMed] [Google Scholar]
- 42. Gloor GB, Macklaim JM, Pawlowsky-Glahn V, Egozcue JJ. Microbiome datasets are compositional: and this is not optional. Front Microbiol. 2017;8:2224. [DOI] [PMC free article] [PubMed] [Google Scholar]
- 43. Anderson MJ. A new method for non-parametric multivariate analysis of variance. Austral Ecology. 2001;26:32–46. [Google Scholar]
- 44. Legendre P, Legendre L. Numerical ecology. Amsterdam: Elsevier; 1998. [Google Scholar]
- 45. Zhao N, Zhan X, Guthrie KA, Mitchell CM, Larson J. Generalized Hotelling's test for paired compositional data with application to human microbiome studies. Genet Epidemiol. 2018;1:459–69. [DOI] [PubMed] [Google Scholar]
- 46. Zhao N, Chen J, Carroll IM, Ringel-Kulka T, Epstein MP, Zhou H, Zhou JJ, Ringel Y, Li H, Wu MC. Testing in microbiome-profiling studies with MiRKAT, the Microbiome Regression-Based Kernel Association Test. Am J Hum Genet. 2015;96:797–807. [DOI] [PMC free article] [PubMed] [Google Scholar]
- 47. Gloor GB, Wu JR, Pawlowsky-Glahn V, Egozcue JJ. It's all relative: analyzing microbiome data as compositions. Ann Epidemiol. 2016;26:322–9. [DOI] [PubMed] [Google Scholar]
- 48. R Core Team. R: a Language and Environment for Statistical Computing. [Internet].R Foundation for Statistical Computing, Vienna, Austria: Available from: http://www.R-project.org 2016. [Google Scholar]
- 49. Bauche D, Marie JC. Transforming growth factor beta: a master regulator of the gut microbiota and immune cell interactions. Clin Transl Immunology. 2017;6:e136. [DOI] [PMC free article] [PubMed] [Google Scholar]
- 50. Paul G, Khare V, Gasche C. Inflamed gut mucosa: downstream of interleukin-10. Eur J Clin Invest. 2012;42:95–109. [DOI] [PubMed] [Google Scholar]
- 51. Engelhardt KR, Grimbacher B. IL-10 in humans: lessons from the gut, IL-10/IL-10 receptor deficiencies, and IL-10 polymorphisms. Curr Top Microbiol Immunol. 2014;380:1–18. [DOI] [PubMed] [Google Scholar]
- 52. Kanwar JR, Kanwar RK, Burrow H, Baratchi S. Recent advances on the roles of NO in cancer and chronic inflammatory disorders. Curr Med Chem. 2009;16:2373–94. [DOI] [PubMed] [Google Scholar]
- 53. Ben-Neriah Y, Karin M. Inflammation meets cancer, with NF-kappaB as the matchmaker. Nat Immunol. 2011;12:715–23. [DOI] [PubMed] [Google Scholar]
- 54. Byndloss MX, Olsan EE, Rivera-Chavez F, Tiffany CR, Cevallos SA, Lokken KL, Torres TP, Byndloss AJ, Faber F, Gao Y et al.. Microbiota-activated PPAR-gamma signaling inhibits dysbiotic Enterobacteriaceae expansion. Science. 2017;357:570–5. [DOI] [PMC free article] [PubMed] [Google Scholar]
- 55. Litvak Y, Byndloss MX, Tsolis RM, Baumler AJ. Dysbiotic Proteobacteria expansion: a microbial signature of epithelial dysfunction. Curr Opin Microbiol. 2017;39:1–6. [DOI] [PubMed] [Google Scholar]
- 56. Cani PD. Gut cell metabolism shapes the microbiome. Science. 2017;357:548–9. [DOI] [PubMed] [Google Scholar]
- 57. David LA, Maurice CF, Carmody RN, Gootenberg DB, Button JE, Wolfe BE, Ling AV, Devlin AS, Varma Y, Fischbach MA et al.. Diet rapidly and reproducibly alters the human gut microbiome. Nature. 2014;505:559–63. [DOI] [PMC free article] [PubMed] [Google Scholar]
- 58. O'Keefe SJ, Li JV, Lahti L, Ou J, Carbonero F, Mohammed K, Posma JM, Kinross J, Wahl E, Ruder E et al.. Fat, fibre and cancer risk in African Americans and rural Africans. Nat Commun. 2015;6:6342. [DOI] [PMC free article] [PubMed] [Google Scholar]
- 59. Wu GD, Compher C, Chen EZ, Smith SA, Shah RD, Bittinger K, Chehoud C, Albenberg LG, Nessel L, Gilroy E et al.. Comparative metabolomics in vegans and omnivores reveal constraints on diet-dependent gut microbiota metabolite production. Gut. 2016;65:63–72. [DOI] [PMC free article] [PubMed] [Google Scholar]
- 60. Clavel T, Henderson G, Alpert CA, Philippe C, Rigottier-Gois L, Dore J, Blaut M. Intestinal bacterial communities that produce active estrogen-like compounds enterodiol and enterolactone in humans. Appl Environ Microbiol. 2005;71:6077–85. [DOI] [PMC free article] [PubMed] [Google Scholar]
- 61. Mancabelli L, Milani C, Lugli GA, Turroni F, Cocconi D, van Sinderen D, Ventura M. Identification of universal gut microbial biomarkers of common human intestinal diseases by meta-analysis. FEMS Microbiol Ecol. 2017;93, 1. [DOI] [PubMed] [Google Scholar]
- 62. Samuel BS, Hansen EE, Manchester JK, Coutinho PM, Henrissat B, Fulton R, Latreille P, Kim K, Wilson RK, Gordon JI. Genomic and metabolic adaptations of Methanobrevibacter smithii to the human gut. Proc Natl Acad Sci USA. 2007;104:10643–8. [DOI] [PMC free article] [PubMed] [Google Scholar]
- 63. Dobrovolskaia MA, Vogel SN. Toll receptors, CD14, and macrophage activation and deactivation by LPS. Microbes Infect. 2002;4:903–14. [DOI] [PubMed] [Google Scholar]
- 64. Cani PD, Bibiloni R, Knauf C, Waget A, Neyrinck AM, Delzenne NM, Burcelin R. Changes in gut microbiota control metabolic endotoxemia-induced inflammation in high-fat diet-induced obesity and diabetes in mice. Diabetes. 2008;57:1470–81. [DOI] [PubMed] [Google Scholar]
- 65. Citronberg JS, Curtis KR, White E, Newcomb PA, Newton K, Atkinson C, Song X, Lampe JW, Hullar MA. Association of gut microbial communities with plasma lipopolysaccharide-binding protein (LBP) in premenopausal women. ISME J. 2018;12(7):1631–41. [DOI] [PMC free article] [PubMed] [Google Scholar]
Associated Data
This section collects any data citations, data availability statements, or supplementary materials included in this article.