

Abstract
Objectives:
Early organ dysfunction in sepsis confers a high risk of in-hospital mortality, but the relative contribution of specific types of organ failure to overall mortality is unclear. The objective of this study was to assess the predictive ability of individual types of organ failure to in-hospital mortality or prolonged intensive care.
Methods:
Retrospective cohort study of adult emergency department patients with sepsis from October 1, 2013, to November 10, 2015. Multivariable regression was used to assess the odds ratios of individual organ failure types for the outcomes of in-hospital death (primary) and in-hospital death or ICU stay ≥ 3 days (secondary).
Results:
Of 2796 patients, 283 (10%) experienced in-hospital mortality, and 748 (27%) experienced in-hospital mortality or an ICU stay ≥ 3 days. The following components of Sequential Organ Failure Assessment (SOFA) score were most predictive of in-hospital mortality (descending order): coagulation (odds ratio [OR]: 1.60,95% confidence interval [CI]: 1.32–1.93), hepatic (1.58, 95% CI: 1.32–1.90), respiratory (OR: 1.33,95% CI: 1.21–1.47), neurologic (OR: 1.20, 95% CI: 1.07–1.35), renal (OR: 1.14, 95% CI: 1.02–1.27), and cardiovascular (OR: 1.13, 95% CI: 1.01–1.25). For mortality or ICU stay ≥3 days, the most predictive SOFA components were respiratory (OR: 1.97, 95% CI: 1.79–2.16), neurologic (OR: 1.72, 95% CI: 1.54–1.92), cardiovascular (OR: 1.38, 95% CI: 1.23–1.54), coagulation (OR: 1.31, 95% CI: 1.10–1.55), and renal (OR: 1.19, 95% CI: 1.08–1.30) while hepatic SOFA (OR: 1.16, 95% CI: 0.98–1.37) did not reach statistical significance (P = .092).
Conclusion:
In this retrospective study, SOFA score components demonstrated varying predictive abilities for mortality in sepsis. Elevated coagulation or hepatic SOFA scores were most predictive of in-hospital death, while an elevated respiratory SOFA was most predictive of death or ICU stay >3 days.
Keywords: sepsis, septic shock, organ failure
Introduction
Patients with sepsis presenting to the emergency department (ED) continue to have a high risk of in-hospital mortality. A recent analysis of the National Hospital Ambulatory Medical Care Survey spanning 2009 to 2011 estimated 850 000 cases of sepsis annually in the United States or 1 of every 120 adult ED visits.1 The number of patients presenting to the ED for sepsis care has continued to rise over the last decade, while the number and rate of hospitalizations continue to climb each year.2–3 Research shows that early, aggressive recognition and treatment of sepsis reduce morbidity and mortality.4–5
Several scoring systems have been devised to quantify disease severity and predict outcomes in this patient population. The most recent revision of the sepsis definitions (Sepsis 3) stresses the defining feature of sepsis as a “dysregulated host response to infection” and increases focus on quantification of organ dysfunction in sepsis.6 The Sepsis-3 guidelines specifically use the Sequential Organ Failure Assessment (SOFA) score as a measure of disease severity and a mortality risk stratification tool. Sequential Organ Failure Assessment score (Table 1) evaluates 6 organ systems with points assigned from 0 (no dysfunction) to 4 (severe dysfunction), with 24 being the highest possible score. A SOFA score ≥2 reflects an overall mortality risk of approximately 10% in a general hospital population with suspected infection.7–8 However, an application of a full SOFA score in the ED setting is potentially problematic, as calculation of the SOFA score is cumbersome. An accurate SOFA score requires numerous calculations and potentially invasive measurements, including laboratory measurements that are not routinely ordered in a large percentage of infected ED patients undergoing routine care. Practically, therefore, the complexity of the tool dissuades routine bedside use of SOFA in the ED for sepsis risk stratification, suggesting the need for better understanding of the most critical components that predict patient outcomes and may aid clinical decision-making. This would allow for practical clinical dissemination to achieve the root goal of SOFA assessment, namely, an increased focus on organ failure recognition. Although the quick-SOFA (qSOFA) score, which consists of 3 objective patient parameters (hypotension, tachypnea, and altered mental status) was designed as a bedside risk stratification tool, a score of <2 still requires application of full SOFA, limiting its utility in addressing this need.
Table 1.
Sequential Organ Failure Assessment Score.
| SOFA Score | 0 | 1 | 2 | 3 | 4 |
|---|---|---|---|---|---|
| Respiratory | >400 | <400 | <300 | <200 | <100 |
| Pao2/FIO2 | >302 | <302 | <221 | <142 | <67 |
| Spo2/FIO2 | |||||
| Cardiovascular | MAP ≥ 70 mm Hg | MAP ≤ 70 mm Hg | Dopamine ≤5 or ANY Dobutamine | Dopamine >5 or Norepinephrine ≤0.1 Phenylephrine ≤0.8 | Dopamine >15 or Norepinephrine >0.1 Phenylephrine >0.8 ANY Vasopressin |
| Liver Function | < 1.2 | 1.2 −1.9 | 2.0–5.9 | 6.0–11.9 | > 12 |
| Bilirubin, | |||||
| mg/dL | |||||
| Renal | < 1.2 | 1.2–1.9 | 2.0–3.4 | 3.5–4.9 | >5.0 |
| Creatinine, | |||||
| mg/dL | |||||
| Coagulation | ≥ 150 | <150 | < 100 | <50 | <20 |
| Platelets × | |||||
| 103/mm3 | |||||
| Neurologic | 15 | 13–14 | 10–12 | 6–9 | <6 |
| GCS | |||||
Abbreviations: PaO2, arterial partial pressure of oxygen; FiO2, fraction of inspired oxygen; SpO2, oxygen saturation using pulse oximetry; MAP, mean arterial pressure; GCS, Glasgow Coma Score.
Although it is known that the calculation of a full SOFA score is accurately predictive of in-hospital mortality from sepsis, it remains less clear which specific types of organ failure are most strongly associated with the poor outcomes. The objective of this study is to identify which components of the SOFA score are most predictive of in-hospital mortality and prolonged ICU stay among patients admitted for sepsis to aid and simplify bedside screening of patients at increased risk of adverse outcomes.
Methods
Study Design and Setting
We conducted a retrospective review of all adult ED patients admitted to our institution for sepsis from October 1, 2013, to November 10, 2015. Our institution is a 696-bed, level-1 trauma center with 142 intensive care beds and is a regional referral center. Patients meeting clinical criteria for sepsis on admission and with an International Classification of Diseases, Ninth Revision (ICD-9) or ICD-10 code for sepsis were identified via the electronic health record.3 Review of this study and approval were obtained from the hospital’s institutional review board.
Study Protocol
Data collection and variables.
The retrospective electronic health record query yielded data on patient demographics (age, sex, and race), initial vital signs, and laboratory values for the calculation of scoring criteria within 24 hours of ED presentation. Additional data including culture results, inpatient disposition, ICU length of stay, mechanical ventilation use, vasopressor use, and in-hospital mortality were also collected. Comorbidities were quantified using the Charlson Comorbidity Index.
Measures.
All data for SOFA score calculation were abstracted from the chart retrospectively, and have been previously reported.9 For the calculation of SOFA score, platelet count, creatinine, and total bilirubin were recorded from the first set of recorded laboratory values on the date of admission. For the respiratory SOFA score, the partial pressure of oxygen (Pao2) from an arterial blood gas (ABG) sample with its corresponding fractional percentage of inspired oxygen (FIO2) was preferentially used if performed in the first 24 hours. If an ABG was not performed, oxygen saturation (Spo2) was used from the first set of recorded vital signs, and FIO2 closest to the time point of the laboratory or clinical value was recorded from the chart. For cardiovascular SOFA score, all patient medications were extracted from the chart for vasopressors or inotropes in the first 24 hours. We first determined whether or not the patient was on vasopressin and if so assigned a cardiovascular SOFA score of 4. We then determined whether the patient was on dopamine, epinephrine, norepi-nephrine, phenylephrine, or dobutamine and then calculated cardiovascular SOFA using the patient’s recorded weight and highest drug dose. For those not on medications, we used the initial mean arterial pressure recorded while in the ED to assign a cardiovascular SOFA of 0 or 1. Glasgow coma scale was obtained from nursing documentation which is routine practice in higher acuity ED patients at our facility and was used for neurologic SOFA. If laboratory or clinical parameters necessary to calculate any component of the SOFA score were unavailable, these data fields were recorded as missing and addressed in the statistical analysis.
Data Analysis
Descriptive summaries were frequencies and percentages for categorical variables and means, standard deviations, medians, and quartiles for continuous variables. The primary analysis sought to investigate whether individual components of SOFA score (respiratory, cardiovascular, liver function, renal, coagulation, and neurologic) were associated with the primary outcome of in-hospital mortality and the composite outcome (in-hospital mortality or ICU stay ≥3 days).
Associations between individual SOFA score components and primary and composite outcomes were first determined by univariate analysis. In the univariate analysis, associations were assessed using the nonparametric Wilcoxon rank-sum test for continuous data; Pearson χ2 test was used for categorical data. Given a relatively large amount of missingness in the case of some variables (such as total bilirubin) and clinical practice patterns, it is highly likely the missing data were not randomly distributed, and therefore assumption of normal values may not be appropriate. We subsequently fit adjusted multivariable regression models with in-hospital mortality as the primary outcome and each individual SOFA component as primary exposure with independent variables with > 5% missing data (total bilirubin and GCS) imputed using multiple imputation. Variables with <5% missing data were treated as missing. In the multivariable logistic regression, the effects of the SOFA components were adjusted for variables including age, gender, race, Charlson Comorbidity Index, vasopressor use, biomarker values, and mechanical ventilation. Backward elimination was used to assess the best predictive model. The goodness of fit of the final model was assessed using Residual χ2 score statistic. All analyses were performed using SAS for Windows Version 9.4 (Cary, North Carolina).
Results
There were 2796 patients with sepsis who met study criteria. Mean age was 58 years (standard deviation [SD]: 17), with 51% female patients, 50% African American, and 45% caucasian patients. The overall in-hospital mortality was 10% (283/2796). Of the study cohort, 27% (748/2796) of patients experienced the composite outcome of in-hospital mortality or ICU LOS ≥3 days. Mechanical ventilation was required by 162 (6%) patients, while 722 (26%) patients received vasopressors during admission. Diabetes mellitus (39%) and chronic obstructive pulmonary disease (32%) were the most common comorbidities. Patient demographic and baseline characteristics by in-hospital mortality are presented in Table 2. Combined outcomes (in-hospital mortality or ICU LOS ≥ 3 days) are also presented Supplemental Material.
Table 2.
| Variable | Category | Overall (n = 2796) |
Alive (n = 2513) |
Dead (n = 283) |
P Value |
|---|---|---|---|---|---|
| Age, mean (SD) | 58 (17) | 57 (17) | 68 (15) | <.001a | |
| median (QI;Q3) | 59 (48;70) | 58 (46; 69) | 67 (58; 80) | ||
| Gender | Female | 1431 (51) | 1279 (51) | 152 (54) | .369b |
| Race | Black | 1400 (50) | 1251 (50) | 149 (53) | .391b |
| White | 1255 (45) | 1138 (45) | 117 (41) | ||
| Other | 141 (5) | 124 (5) | 17 (6) | ||
| Comorbidities | |||||
| AIDS | Yes | 89 (3) | 86 (3) | 3 (1) | .032b |
| Cancer | Yes | 286 (10) | 239 (10) | 47 (17) | <.001lb |
| CHF | Yes | 563 (20) | 478 (19) | 85 (30) | <.001b |
| COPD | Yes | 906 (32) | 796 (32) | 110 (39) | .013b |
| CVD | Yes | 233 (8) | 208 (8) | 25 (9) | .741b |
| DM (no complications)1 | Yes | 852 (31) | 771 (31) | 81 (29) | .488b |
| DM (complications)2 | Yes | 204 (7) | 188 (7) | 16 (6) | .266b |
| Dementia | Yes | 133 (5) | 117 (5) | 16 (6) | .450b |
| ESRD | Yes | 200 (7) | 163 (6) | 37 (13) | <.001b |
| Liver (mild)c | Yes | 281 (10) | 219 (9) | 62 (22) | <.001b |
| Liver (moderate-severe)d | Yes | 63 (2) | 45 (2) | 18 (6) | <.001b |
| Myocardial infarction | Yes | 198 (7) | 162 (6) | 36 (13) | <.001b |
| Metastatic cancer | Yes | 98 (4) | 76 (3) | 22 (8) | <.001b |
| Charlson comorbidity index | |||||
| median (Q1;Q3) | 2 (0; 4) | 2 (0; 3) | 3 (2; 5) | <.001a | |
| Sepsis bundle treatment | Yes | 337 (12) | 294 (12) | 43 (15) | .087b |
| Mechanical ventilation | Yes | 162 (6) | 101 (4) | 61 (22) | <.001b |
| Vasopressors | Yes | 722 (26) | 482 (19) | 240 (85) | <.001b |
Abbreviations: AIDS, acquired immune deficiency syndrome; CHF, congestive heart failure; COPD, chronic obstructive pulmonary disease; CVD, cerebrovascular disease; DM, diabetes mellitus; ESRD, end stage renal disease; 1, no end-organ damage; 2, end-organ damage (eg, retinopathy, neuropathy, nephropathy).
Wilcoxon rank sum test.
Pearson χ2 test.
mild = without portal hypertension, includes chronic hepatitis.
moderate-severe= portal hypertension, cirrhosis.
Comparing survivors versus nonsurvivors, only initial WBC count did not differ significantly (P = .88) between the 2 groups. Similar findings were noted comparing the groups based on the composite outcome. Features of sepsis encounters by in-hospital mortality are presented in Table 3, while features of sepsis encounters by composite outcome are presented in Supplemental Material.
Table 3.
| Variable, n | Overall, 2796 | Alive, 2513 | Dead, 283 | P Value |
|---|---|---|---|---|
| Initial vital signsc | ||||
| SBP, (mm Hg) | 122 (104;142);2700 | 124 (106;143);2435 | 106 (88;131);265 | <.001d |
| HR, (beats/min) | 102 (87;117);2685 | 102 (88;117);2409 | 106 (87;125);276 | .017d |
| RR, (breaths/min) | 218 (16;21);2791 | 18 (16;20);2510 | 20 (18;24);281 | <.001d |
| Temperature, (°F) | 98.8 (98.1;100.3);2793 | 99.9 (98.1;100.4);2512 | 98.1 (97.3;99.1);281 | <.001d |
| Spo2 (%) | 96 (5.5);2791 | 96 (4.9);2508 | 94 (8.9);283 | <.001d |
| Lab findingsc | ||||
| Initial WBCc, thous/mm3 | 13.9 (9.2;18.2);2795 | 13.8 (9.3;18.1);2512 | 14.2 (8.4;19.6);283 | .880d |
| Lactatec, mmol/L | 1.9 (1.3;3.1);1387 | 1.8 (1.3;2.8);1157 | 3.6 (2.1;7.4);230 | <.001d |
| Lactate, mmol/L | ||||
| ≥ 4 | 231 (17) | 122 (11) | 109 (47) | <.001e |
| 2 to 3.9 | 458 (33) | 389 (34) | 69 (30) | |
| ≥ 2 | 698 (50) | 646 (55) | 52 (23) | |
| Creatinine, mg/dLc | 1.1 (0.8;1.8);2796 | 1.1 (0.8;1.7);2513 | 1.7 (1.1;3.3);283 | <.001e |
| Any positive culture | 2279 | 1905 | 374 | |
| Blood | 785 (34) | 655 (34) | 130 (35) | .004e |
| Respiratory | 594 (27) | 477 (25) | 117 (31) | |
| Urine | 757 (33) | 641 (34) | 116 (31) | |
| Wound | 143 (6) | 132 (7) | 11 (3) | |
Abbreviations: SBP, systolic blood pressure, WBC = white blood cell count, HR = heart rate, RR = respiratory rate.
Wilcoxon rank sum test.
Q3 = 3 rd quartile, n = group size.
For median (Q1;Q3);n, Q1 — 1st quartile.
Data are counts (percentages), unless otherwise specified.
Pearson χ2 test.
Prior to imputation, the most missing SOFA component was for hepatic SOFA for which 74% (2082/2796) of data were complete followed by neurologic for which 88% of data were complete (2457/2796). Cardiovascular SOFA had 96.6% complete data (2700/2796); coagulation SOFA was 98.6% (2758/2796) complete; renal SOFA was 99.7% (2789/2796) complete; and respiratory SOFA was 99.8% complete (2791/2796). After multiple imputation, data were 96.6% complete, and the median overall SOFA score for patients experiencing in-hospital mortality was 7 (interquartile range [IQR]: 4–10) versus 1 (IQR: 0–4) among survivors. The median overall SOFA score for patients experiencing in-hospital mortality or ICU stay ≥ 3 days was 6 (IQR: 3–9) versus 1 (IQR: 0–3) among patients without either of these outcomes. The SOFA scores by in-hospital mortality and the composite outcome are presented in Tables 4 and 5, respectively.
Table 4.
SOFA Scores Components by In-hospital Mortality.
| Variable | Category | Alive, 2513 | Dead, 283 | Overall, 2796 |
|---|---|---|---|---|
| Neurologic, GCS | 0 | 1721 (68) | 130 (46) | 1851 (66) |
| 1 | 438 (17) | 40 (14) | 478 (17) | |
| 2 | 162 (6) | 24 (8) | 186 (7) | |
| 3 | 158 (6) | 53 (19) | 211 (8) | |
| 4 | 34 (1) | 36 (13) | 70 (3) | |
| Cardiovascular | 0 | 1885 (77) | 94 (35) | 1979 (73) |
| 1 | 299 (12) | 24 (9) | 323 (12) | |
| 2 | 18 (1) | 11 (4) | 29 (1) | |
| 3 | 160 (7) | 70 (26) | 230 (9) | |
| 4 | 73 (3) | 66 (25) | 139 (5) | |
| Coagulation | 0 | 2106 (85) | 191 (68) | 2297 (83) |
| 1 | 239 (10) | 45 (16) | 284 (10) | |
| 2 | 113 (5) | 29 (10) | 142 (5) | |
| 3 | 18 (1) | 8 (3) | 26 (1) | |
| 4 | 3 (0) | 6 (2) | 9 (0) | |
| Liver | 0 | 2230 (89) | 209 (74) | 2439 (87) |
| 1 | 157 (6) | 26 (9) | 183 (7) | |
| 2 | 104 (4) | 32 (11) | 136 (5) | |
| 3 | 17 (1) | 11 (4) | 28 (1) | |
| 4 | 5 (0) | 5 (2) | 10 (0) | |
| Renal | 0 | 1439 (57) | 90 (32) | 1529 (55) |
| 1 | 541 (22) | 68 (24) | 609 (22) | |
| 2 | 269 (11) | 58 (21) | 327 (12) | |
| 3 | 111 (4) | 33 (12) | 144 (5) | |
| 4 | 147 (6) | 33 (12) | 180 (6) | |
| Respiratory | 0 | 1922 (77) | 115 (41) | 2037 (73) |
| 1 | 198 (8) | 27 (10) | 225 (8) | |
| 2 | 136 (5) | 40 (14) | 176 (6) | |
| 3 | 166 (7) | 52 (18) | 218 (8) | |
| 4 | 86 (3) | 49 (17) | 135 (5) | |
Table 5.
SOFA Scores by In-hospital Mortality or ICU Length of Stay >=3.
| Variable | Category | No Mortality or ICU < 3 days, n = 2048 |
Mortality or ICU > 3 days, n = 748 |
Overall, n = 2796 |
|---|---|---|---|---|
| Neurologic, | 0 | 1721 (68) | 130 (46) | 1851 (66) |
| GCS | 1 | 438 (17) | 40 (14) | 478 (17) |
| 2 | 162 (6) | 24 (8) | 186 (7) | |
| 3 | 158 (6) | 53 (19) | 211 (8) | |
| 4 | 34 (1) | 36 (13) | 70 (3) | |
| Cardiovascular | 0 | 1885 (77) | 94 (35) | 1979 (73) |
| 1 | 299 (12) | 24 (9) | 323 (12) | |
| 2 | 18 (1) | 11 (4) | 29 (1) | |
| 3 | 160 (7) | 70 (26) | 230 (9) | |
| 4 | 73 (3) | 66 (25) | 139 (5) | |
| Coagulation | 0 | 2106 (85) | 191 (68) | 2297 (83) |
| 1 | 239 (10) | 45 (16) | 284 (10) | |
| 2 | 113 (5) | 29 (10) | 142 (5) | |
| 3 | 18 (1) | 8 (3) | 26 (1) | |
| 4 | 3 (0) | 6 (2) | 9 (0) | |
| Liver | 0 | 2230 (89) | 209 (74) | 2439 (87) |
| 1 | 157 (6) | 26 (9) | 183 (7) | |
| 2 | 104 (4) | 32 (11) | 136 (5) | |
| 3 | 17 (1) | 11 (4) | 28 (1) | |
| 4 | 5 (0) | 5 (2) | 10 (0) | |
| Renal | 0 | 1439 (57) | 90 (32) | 1529 (55) |
| 1 | 541 (22) | 68 (24) | 609 (22) | |
| 2 | 269 (11) | 58 (21) | 327 (12) | |
| 3 | 111 (4) | 33 (12) | 144 (5) | |
| 4 | 147 (6) | 33 (12) | 180 (6) | |
| Respiratory | 0 | 1922 (77) | 115 (41) | 2037 (73) |
| 1 | 198 (8) | 27 (10) | 225 (8) | |
| 2 | 136 (5) | 40 (14) | 176 (6) | |
| 3 | 166 (7) | 52 (18) | 218 (8) | |
| 4 | 86 (3) | 49 (17) | 135 (5) | |
Abbreviations: ICU, intensive care unit.
For all patients (2796), the percentage of patients with a component score ≥1 was as follows: hepatic 13% (357/2796), coagulation 17% (461/2796), renal 45% (1260/2796), respiratory 27% (754/2796), neurologic 34% (945/2796), and cardiovascular 27% (721/2796). Of the 283 patients who met the primary outcome of in-hospital death, the percentage that had a component SOFA score elevation >1 were as follows: hepatic 26% (74/283), coagulation 32% (88/283), renal 68% (192/283), respiratory 59% (168/283), neurologic 54% (153/283), and cardiovascular 65% (171/283). After multivariable regression and adjustment for demographics, each SOFA component was independently associated with in-hospital mortality based on adjusted odds ratios in descending order: coagulation (OR: 1.60, 95% CI: 1.32–1.93), hepatic (1.58, 95% CI: 1.32–1.90), respiratory (OR: 1.33, 95% CI: 1.21–1.47), neurologic (OR: 1.20, 95% CI: 1.07–1.35), renal (OR: 1.14, 95% CI :1.02–1.27), and cardiovascular (OR: 1.13, 95% CI: 1.01–1.25). For the primary outcome of in-hospital mortality, elevated coagulation and hepatic SOFA were the strongest independent predictors. Figure 1 depicts the frequencies of in-hospital deaths by individual SOFA score values (0–4) for each SOFA component.
Figure 1.
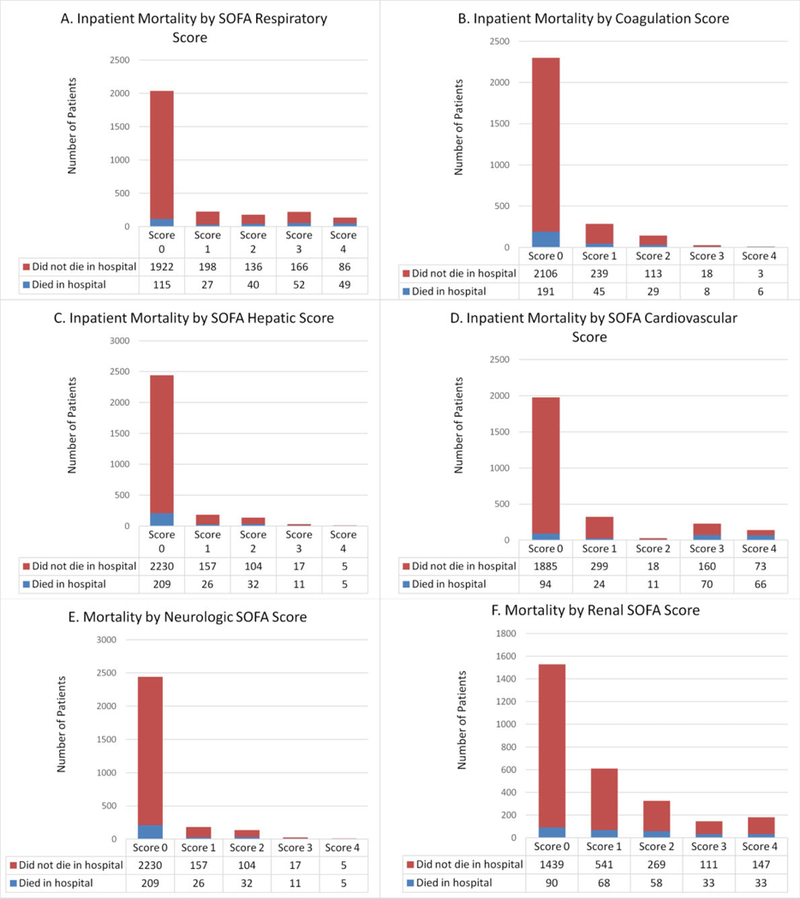
In-hospital mortality by component of SOFA score.
Similar results were observed with the composite outcome. The adjusted odds ratios were in descending order: respiratory (OR: 1.97, 95% CI: 1.79–2.16), neurologic (OR: 1.72, 95% CI: 1.54–1.92), cardiovascular (OR: 1.38, 95% CI: 1.23–1.54), coagulation (OR: 1.31, 95% CI: 1.10–1.55), and renal (OR: 1.19, 95% CI: 1.08–1.30). Hepatic SOFA (OR: 1.16, 95% CI: 0.98–1.37) did not reach statistical significance for this outcome (P = .092). Results of regression models with unadjusted odds ratios, goodness-of-fit data, and other included predictor variables are presented in Supplemental Tables 3 and 4.
Discussion
We observed that the coagulation component of SOFA was the strongest predictor of in-hospital mortality, while respiratory SOFA was the strongest predictor of in-hospital mortality or ICU stay ≥3 days. These results demonstrate an association between the elevations of individual SOFA components in sepsis and increased the risk of death, with the greatest odds of death being associated with elevated coagulation or hepatic SOFA and the greatest odds of death or prolonged ICU stay with elevated respiratory SOFA, followed closely by neurologic. Data from this study may inform clinical practice by bringing the attention of clinicians to high-risk organ failure, that if present, would potentially mandate critical care services.
In this study, coagulation SOFA had the greatest predictive ability for death, while the odds ratios for hepatic SOFA were nearly identical. One potential explanation for the increased mortality predicted by coagulopathy and hepatic dysfunction is that certain liver products (hemostasis and fibrinolytic factors, carrier proteins, hormones, and prohormones) are vital for defense against systemic infection. In addition, the coagulation score (platelet count) closely follows the hepatic score (total bilirubin) because it is also a surrogate marker for liver dysfunction; thrombopoetin, which regulates the differentiation of platelets, is produced by hepatocytes such that impaired liver function leads to decreased platelet production.10,11,12,13 Elevated bilirubin causes thrombocytopenia by stimulating apoptosis via mitochondrial-induced p38 and p53 activation as shown by Kumar et al.13 And Ogura et al showed that coagulopathy and organ dysfunction progress with significant mutual correlation in patients with thrombocytopenia.14 The impairment of synthetic function in our cohort with elevated hepatic SOFA is plausible, as elevated bilirubin used in hepatic SOFA is a relatively late finding indicative of more advanced liver pathology. This corresponds with only 12% of patients having an elevated hepatic SOFA score in contrast to other SOFA components that were more frequently elevated. Finally, higher lactate values have been associated with increased severity of sepsis,15,16 and Sterling et al demonstrated that liver dysfunction during sepsis was associated with impaired lactate clearance,16 which may partly explain an increased mortality from sepsis in this population.
Since the composite outcome included prolonged ICU stay, we hypothesize that respiratory score and neurological scores were most predictive because patients who are on mechanical ventilation are likely to have elevations in both neurologic and respiratory SOFA scores and require disposition to the ICU. Mechanical ventilation is also likely to account for the need for an ICU stay of at least 3 days, as these patients are less likely to be downgraded from intensive care early. In addition, intubated patients with sepsis are more critically ill than their nonrespiratory failure counter-parts.17 The trend seen for predictors of in-hospital mortality was also seen for the composite outcome as well with regard to coagulation being more predictive than renal. We hypothesize that the cardiovascular score was higher in the composite outcome secondary to the need for vasopressors which would be administered exclusively in an ICU setting and may lead to longer ICU LOS. Interestingly, the hepatic SOFA was least predictive of the composite outcome, which is difficult to explain from the data. We initially thought that this might be due to higher early mortality and thus shorter ICU stays in patients with elevated hepatic SOFA, but this was not actually the case. It is more likely that the impact of hepatic SOFA on ICU stay was outweighed by organs that require critical care services for organ support, including respiratory, neurologic, cardiovascular, and renal dysfunction, all which require specific treatments that can only be provided in an ICU setting.
Our results help identify individual SOFA component predictors of in-hospital mortality or prolonged ICU stay that may facilitate recognition of a subset of patients with sepsis who are at an increased risk of adverse outcomes. More importantly, the results underscore that individual SOFA components have independent relationships with our outcomes of interest and that not all organ dysfunction has similar predictive ability. This knowledge might help focus clinicians’ attention on the implicated organ systems as indicators of high-risk organ failure in patients with sepsis. For example, it is likely that recognition of thrombocytopenia, and its association with death in ED patients with sepsis is underrecognized.
Although previous literature demonstrates that higher SOFA scores are correlated with increased mortality, to our knowledge, few studies have examined the individual predictive values of the SOFA components.18–20 Knox et al found the GCS score to be most predictive of 30-day mortality in a mixed ICU patient population20 At the same time, other studies refute the accuracy of GCS score when used in clinical practice citing that many times it is calculated incorrectly.21,22
Limitations
This study had several limitations. This was a retrospective, single-center study of patients with sepsis. The retrospective nature of the study has inherent limitations with regard to the accuracy of the sepsis diagnosis, particularly using diagnostic codes. Although this may have been an issue, our admission and discharge diagnosis codes are reviewed by trained medical coders and are routinely adjusted when indicated. Determining the particular elements of care each patient received is difficult in a retrospective study and was beyond the scope of this study. In future studies, we hope to better elucidate particular elements of sepsis care so that we may address inadequacies in treatment. For instance, we did not have individual patient-level data on treatment variables such as fluids, time to antibiotics, and time to vasopressors. By evaluating these variables, we may be able to make more definitive conclusions. Finally, one caveat that must be considered when interpreting the aforementioned results is that the confidence intervals of the individual component SOFA score odds ratios for both the primary and the secondary outcomes are overlapping. This implies that although the odds ratios of each SOFA component were different, we cannot say there is a true statistical difference between individual components in cases where the confidence intervals overlap. In calculating SOFA scores, not all patients had all the laboratory values collected at initial presentation, but we addressed this using multiple imputation for neurologic and hepatic SOFA components. Otherwise, the degree of missingness was low at 3.5% or less for all other SOFA components. We did not account for baseline liver disease in this study population. Because bilirubin does not become elevated until days after hepatic injury, patients in this study with a higher hepatic SOFA score on presentation more likely had baseline liver disease than sepsis-associated hepatic dysfunction. Finally, hepatic SOFA was most strongly associated with the primary outcome of in-hospital death but was also the most missing of all the data. Although there may be concerns with regard to the integrity of the data with this respect, this is likely more due to the fact that hepatic function tests are not routinely measured in patients with sepsis unless there is a specific indication. We believe this was handled properly from the statistical standpoint with multiple imputation.
Conclusion
In conclusion, an elevated coagulation or hepatic SOFA score was most predictive of in-hospital death, while an elevated respiratory or neurologic SOFA score was most predictive of death or ICU stay ≥ 3 days. The type of organ failure in adult ED patients admitted for sepsis may have differential predictive value for the outcomes of in-hospital mortality and ICU length of stay. These results require further external validation.
Supplementary Material
Acknowledgments
Funding
The author(s) received no financial support for the research, authorship, and/or publication of this article.
Footnotes
Declaration of Conflicting Interests
The author(s) declared no potential conflicts of interest with respect to the research, authorship, and/or publication of this article.
Supplemental Material
Supplemental material for this article is available online.
References
- 1.Wang H, Jones A, Donnelly J. Revised national estimates of emergency department visits for sepsis in the United States. Crit Care Med. 2017;45(9):1443–1449. [DOI] [PMC free article] [PubMed] [Google Scholar]
- 2.Hall MJ, Williams SN, DeFrances CJ, Golosinskiy A. Inpatient care for septicemia or sepsis: a challenge for patients and hospitals. NCHS Data Brief. 2011;62:1–8. [PubMed] [Google Scholar]
- 3.Angus DC, Linde-Zwirble WT, Lidicker J, Clermont G, Carcillo J, Pinsky MR. Epidemiology of severe sepsis in the United States: analysis of incidence, outcome, and associated costs of care. Crit Care Med. 2001;29(7):1303–1310. [DOI] [PubMed] [Google Scholar]
- 4.Rhodes A, Evans LE, Alhazzani W, et al. Surviving sepsis campaign: international guidelines for management of sepsis and septic shock 2016. Crit Care Med. 2017;43(3):304–337. [DOI] [PubMed] [Google Scholar]
- 5.Herran-Monge R, Muriel-Bombin A, Garcia-Garcia MM, et al. Epidemiology and changes in mortality of sepsis after the implementation of surviving sepsis campaign guidelines. J Intensive Care Med. 2017. doi: 10.1177/0885066617711882. [DOI] [PubMed] [Google Scholar]
- 6.Dellinger RP, Levy MM, Rhodes A, et al. ; Surviving Sepsis Campaign Guidelines including the Pediatric Subgroup. Surviving sepsis campaign: international guidelines for management of severe sepsis and septic shock 2012. Intensive Care Med. 2013; 41(2):580–637. [DOI] [PubMed] [Google Scholar]
- 7.Singer M, Deutschman CS, Seymour CW, et al. The third international consensus definitions for sepsis and septic shock (Sepsis-3). JAMA. 2016;315(8):801–810. [DOI] [PMC free article] [PubMed] [Google Scholar]
- 8.Jones AE, Trzeciak S, Kline JA. The Sequential Organ Failure Assessment Score for predicting outcome in patients with severe sepsis and evidence of hypoperfusion at the time of emergency department presentation. Crit Care Med. 2009;37(5):1649–1654. [DOI] [PMC free article] [PubMed] [Google Scholar]
- 9.Guirgis FW, Puskarich MA, Smotherman C, et al. Development of a simple sequential organ failure assessment score for risk assessment of emergency department patients with sepsis. J Intensive Care Med. 2017. doi: 10.8850/66617741284. [DOI] [PMC free article] [PubMed] [Google Scholar]
- 10.Kaushansky K Lineage-specific hematopoietic growth factors. N Engl J Med. 2006;354(19):2034–2045. [DOI] [PubMed] [Google Scholar]
- 11.Moreau D, Timsit JF, Vesin A, et al. Platelet count decline: an early prognostic marker in critically ill patients with prolonged ICU stays. Chest. 2007;131(6):1735–1741. [DOI] [PubMed] [Google Scholar]
- 12.Becchi C, Al Malyan M, Fabbri LP, Marsili M, Boddi V, Boncinelli S. Mean platelet volume trend in sepsis: is it a useful parameter? Minerva Anestesiol. 2006;72(9):749–756. [PubMed] [Google Scholar]
- 13.NaveenKumar SK, Thushara RM, Sundaram MS, et al. Unconjugated bilirubin exerts pro-apoptotic effect on platelets via p38-MAPK activation. Sci Rep. 2015;5:15045. [DOI] [PMC free article] [PubMed] [Google Scholar]
- 14.Ogura H, Gando S, Iba T, et al. SIRS-associated coagulopathy and organ dysfunction in critically ill patients with thrombocytopenia. Shock. 2007;28(4):411–417. [DOI] [PubMed] [Google Scholar]
- 15.Herwanto V, Lie KC, Suwarto S, Rumende CM. Role of 6-hour, 12-hour, and 24-hour lactate clearance in mortality of severe sepsis and septic shock patients. Crit Care. 2014; 18(suppl 2):P2. [Google Scholar]
- 16.Sterling SA, Puskarich MA, Jones AE. The effect of liver disease on lactate normalization in severe sepsis and septic shock: a cohort study. Clin Exp Emerg Med. 2015;2(4):197–202. [DOI] [PMC free article] [PubMed] [Google Scholar]
- 17.Javed A, Guirgis FW, Sterling SA, et al. Clinical predictors of early death from sepsis. J Crit Care. 2017;42:30–34. [DOI] [PMC free article] [PubMed] [Google Scholar]
- 18.Antonelli M, Osborn J, Moreno R, et al. Application of SOFA score to trauma patients. Sequential organ failure assessment. Intensive Care Med. 1999;25(4):389–394. [DOI] [PubMed] [Google Scholar]
- 19.Arnold RC, Jones AE, Sherwin R, et al. Multicenter observational study of the development of progressive organ dysfunction and therapeutic interventions in normotensive sepsis patients in the emergency department. Acad Emerg Med. 2013;20(5):433–440. [DOI] [PubMed] [Google Scholar]
- 20.Knox DB, Lanspa MJ, Pratt CM, Kuttler KG, Jones JP, Brown SM. Glasgow coma scale score dominates the association between admission sequential organ failure assessment score and 30-day mortality in a mixed intensive care unit population. J Crit Care. 2014;29(5):780–785. [DOI] [PMC free article] [PubMed] [Google Scholar]
- 21.Tallgren M, Backlund M, Hynninen M. Accuracy of Sequential Organ Failure Assessment (SOFA) scoring in clinical practice. Acta Anaesthesiol Scand. 2009;53(1):39–45. [DOI] [PubMed] [Google Scholar]
- 22.Vasilevskis EE, Pandhaijpande PP, Graves AJ, et al. Validity of a Modified Sequential Organ Failure Assessment Score Using the Richmond Agitation-Sedation Scale. Crit Care Med. 2016;44(1): 138–146. [DOI] [PMC free article] [PubMed] [Google Scholar]
Associated Data
This section collects any data citations, data availability statements, or supplementary materials included in this article.