

Abstract
Background
Timing of dietary intake may play a role in obesity. However, previous studies produced mixed findings possibly due to inconsistent approaches to characterize meal timing and not taking into account chronotype and macronutrients. To address the aforementioned limitations, we have defined meal timing relative to sleep/wake timing, investigated the relationship between meal timing and BMI dependent on chronotype, and examined the associations between obesity and the timing of individual macronutrient intakes.
Methods
BMI, chronotype, and dietary intakes were measured in 872 middle-to-older aged adults by six 24-hour dietary recalls in one year. We defined four time windows of intake relative to sleep timing: morning (within two hours after getting out of bed), night (within two hours before bedtime), and two midday periods in between (split by the midpoint of the waking period).
Results
A higher percent of total daily energy intake consumed during the morning window was associated with lower odds of being overweight or obese (odds ratio (95% confidence intervals), 0.53 (0.31, 0.89)). This association was stronger in people with an earlier chronotype (0.32 (0.16, 0.66)). A higher percent of total daily energy intake consumed during the night window was associated with higher odds of being overweight or obese (1.82 (1.07, 3.08)), particularly in people with a later chronotype (4.94 (1.61, 15.14)). These associations were stronger for the intakes of carbohydrates and protein than for fat intake.
Conclusion
Our study suggests that higher dietary consumption after waking up and lower consumption close to bedtime associate with lower BMI, but the relationship differs by chronotype. Furthermore, the data demonstrate a clear relationship between the timing of carbohydrate and protein intake and obesity. Our findings highlight the importance of considering timing of intake relative to sleep timing when studying the associations of meal timing with obesity and metabolic health.
Keywords: Meal timing, obesity, chronotype, circadian rhythm, sleep, older adults
Introduction
Emerging evidence suggests that timing of food intake is a relevant aspect in nutrition and may play a crucial role in obesity. 1 For example, breakfast skipping, 2,3 late lunch eating 4, and high energy intake at dinner, 5-8 have been all linked to various indicators of adiposity. However, findings are controversial, and meta-analyses indicate certain methodological limitations. 9,10 One of the main limitations has been the lack of a consistent approach to define meal timing. Most studies have focused on conventional meal categories (i.e., breakfast, lunch and dinner) that doesn’t reflect the true eating pattern of many people in different cultures. Furthermore, other studies have used clock time to characterize timing of food intake, which fails to accurately characterize meal timing in the context of the internal circadian timing system. This is important because the circadian clock plays an essential role in energy and nutrient metabolism. 11 In fact, a recent study has demonstrated an association of BMI with the timing of food intake relative to the internal circadian time.12 Importantly, such relationship was not observed when looking at the time of food intake relative to the external clock time. In order to assess the endogenous circadian time, this study measured the dim light melatonin onset (DLMO). This approach requires study participants to remain in dim light conditions for many hours and repeated blood or saliva collections which is not practical for most epidemiological or clinical studies.
A practical approach for approximating circadian time of food intake is measuring the time of food intake relative to the sleep/wake cycle. This approximation is based on the relationship between the internal circadian time and the sleep/wake cycle which is much tighter than that with external clock time. 13 Individual chronotype (e.g., morning vs evening types) which is the preference of timing of various activities including sleep, has been shown to relate to the period (cycle length) of the internal circadian clock 14 and has been found to be a modifier for the relationship between meal timing an obesity. 15
Changing meal timing may be difficult in real life, especially for breakfast and lunch. 16 Nevertheless, to change the distribution of energy or specific macronutrients (lipids, carbohydrates or proteins) along the day, may be more achievable. Therefore, which foods (macronutrients) are most related to obesity when eaten at a specific time is a critical question.
In the current study, in 872 middle-to-older aged adults, we have examined the timing of food intake and the association with obesity. To address the aforementioned limitations in the existing literature, we have: a) defined meal timing relative to individual sleep/wake timing; b) investigated the relationship between meal timing and body-mass index (BMI) dependent on chronotype; and c) examined the associations between obesity and individual macronutrient timing (carbohydrate, protein and fat).
Subjects and Methods
Study population
The Interactive Diet and Activity Tracking in AARP study was designed to evaluate measurement error properties of internet-based and conventional self-reports of diet and physical activity. Details of the study are published online. 17 Briefly, between January, 2012 and December, 2013, an invitation letter was mailed to 38,000 AARP (formerly American Association of Retired Persons) members living in Pittsburgh, Pennsylvania and 4,967 of them provided contact information via the study website. Of those, 186 did not consent to phone screening and 1,266 were excluded due to meeting quota and study closeout. Eventually, a total of 3,515 were screened by phone and at clinic to determine eligibility. Exclusion criteria included having no English speaking or reading abilities, BMI < 18.5 or ≥ 40 kg/m2, no access to high speed internet, limited mobility, a history of diabetes, renal failure, congestive heart failure, or conditions involving disturbances in fluid balance or digestion. People who were on a weight loss diet were also excluded from the study. Based on these criteria, a total of 1,082 people were eligible, gave consent to clinic visits and sample collections, and contributed data to the study. For our analysis, we further excluded people with no available dietary report or missing sleep information, resulting in a final analytic cohort of 872 participants. The study was approved by the National Cancer Institute Special Studies Institutional Review Board.
Dietary recall
We derived information on total energy and macronutrient intakes from the Automated Self-Administered 24-Hour Dietary Assessment Tool (ASA24). 18 The ASA24 is an online platform that asks participants to self-report all foods, beverages and supplements consumed in the previous 24-hour periods from midnight to midnight. Participants reported the time of each eating episode in 15-minute blocks and portion size for each food. During a one-year study period, participants completed six ASA24 recalls, once every two months. In our analytic cohort, 94% participants had at least three recalls and 67% had all six recalls. On average, participants reported dietary intakes on 3.7 (standard deviation, 1.4) weekdays and 1.5 (1.2) weekend days. Energy and macronutrient intakes from individual foods at each eating episode were derived using the USDA Food and Nutrient Database for Dietary Studies (version 4.1).
Body-mass index and covariates
During the one-year period, height and weight were measured at three clinic visits in the 1st, 7th and 12th month. BMI (weight (kg)/height(m)2) was calculated using average weight and height and dichotomized into normal weight (18.5≤BMI<25) and overweight and obese (25≤BMI<40). Participants reported age, sex and race/ethnicity at the first clinic visit. They also wore the ActivPAL 3 physical activity monitor two times during the study year (Month 1 and 6 for half of the participants and Month 6 and 12 for the other half), each time for seven consecutive days. The monitor was attached to the right thigh and the participants were asked to wear the device all day and night and only remove it when showering, bathing and swimming. We used the average total steps per day to measure physical activity levels and the average minutes per day spent in a sitting position to measure sedentary time.
Sleep and chronotype
When participants wore the accelerometer devices, they were also asked to report the times when they got out of bed and went to bed each day, from which we calculated total time in bed and the midpoint of time in bed for weekday and weekend separately. Based on the instruction to accompany the Munich Chronotype Questionnaire,19 we calculated chronotype:
chronotype= Mweekend if TIBweekend <= TIBweekday, and
chronotype= Mweekend-(TIBweekend - TIBweekday)/2 if TIBweekend > TIBweekday,
where Mweekend is the midpoint of time in bed on weekends and TIBweekend and TIBweekday represent total time in bed on weekends and weekdays respectively. We used a median split to define earlier and later chronotypes.
Daily Time windows
On average, only 1.0% of daily energy intake in our study population occurred during the habitual sleep hours, therefore we focused our analysis on waking hours. Based on the reported bedtime and wake up time, we divided the waking period into four time windows for weekdays and weekends separately. The “morning” time window was defined as within two hours after getting out of bed. This time window was chosen to examine the conventional breakfast time (89% of all the breakfasts reported in our study occurred in this time window and 79% eating episodes in this window were reported as breakfast), as previous studies have shown the potential important impact of breakfast on obesity. 1 Next, to parallel this morning window, we defined “night” time window as within two hours before bedtime (in our study, 78% eating episodes in this window were reported as snack). Finally, we divided the remaining time into two equal windows: the “late morning-early afternoon” period was defined as from two hours after getting out of bed to the midpoint of the waking period, and the “late afternoon-early evening” period was defined as from the midpoint of the waking period to two hours before bedtime.
Daily Distribution of dietary intake
We characterized the distribution of energy intake during the waking period by calculating the percent of total daily energy intake consumed during each of the four different time windows. Similarly, we also calculated the percent of total intake during these different time windows, separately for each macronutrient (e.g., carbohydrate, protein and fat) and food components (sugar, fiber, saturated fats, monounsaturated fats, and polyunsaturated fats). We further divided the overall study population into quintiles based on the percentage of energy and macronutrient intake for the four time windows. We used the same quintiles created based on the overall population as independent variables in subgroup analysis.
Statistical analysis
To describe study characteristics, we reported mean and standard deviation for continuous variables, and percentages for categorical variables. We used multiple logistic regression to estimate odds ratios (OR) and 95% confidence intervals (CI) for overweight and obesity, comparing participants in higher quintiles of intake to the lowest quintile. 20 To test for linear trend across quintiles of dietary intake, we modeled categorical variables as continuous by assigning the median value to each quintile. We considered a series of multivariate regression models: The base model was adjusted for basic demographic factors including age (continuous), sex (male, female) and race/ethnicity (Black, White, Other). In a second model, we further adjusted for lifestyle factors as potential confounders, including total time in bed (< 7, 7-8, and 9+ hours), chronotype (continuous), total steps per day (continuous), sedentary time (continuous) and total daily energy intake (continuous). If we would find dietary intake in more than one time window to be significantly associated with overweight/obesity, then we run a model with these time windows included in one model, to test their independent association.
To examine the effect of chronotype on the relationship between the timing of dietary intake and BMI, we conducted subgroup analysis, splitting the analytic sample by the median of chronotype. For analysis of each nutrient, we further adjusted for total daily intake of the respective nutrient. We used p<0.05 as the threshold for statistical significance, and we also conducted sensitivity analysis by using the criteria of false discovery rate <0.2, which led to largely similar results. All analyses were performed using SAS (SAS 9.3; SAS Institute, Cary, North Carolina).
Results
Study characteristics by BMI status are presented in Table 1. Compared to participants with a normal BMI, those with overweight or obesity, on average, reported a later midpoint of time in bed during weekends, a later chronotype, a longer time delay between dinner and bedtime, and a lower level of physical activity determined by the number of steps per day. Overweight/obese participants also reported higher daily intakes of total energy (kcal), and higher intakes (grams) of fat, protein, cholesterol, saturated fat, polyunsaturated fat and monounsaturated fat, while fiber intake was lower than normal-weight participants. We also compared study characteristics by chronotype (Supplementary table 1). We found that when compared to subjects with an earlier chronotype, subjects with a later chronotype in general had a later sleep timing and a later meal schedule for breakfast, lunch and dinner. The later chronotypes also had a lower step count per day and a higher level of sugar consumption. On the other hand the percent of total daily energy intake during the four time windows were largely comparable between the two chronotype groups (Supplementary table 2).
Table 1.
Selected characteristics of 872 study participants by body-mass index in the Interactive Diet and Activity Tracking in AARP Study
| Body-mass index, kg/m2 | p-value | |||
|---|---|---|---|---|
| <25 | 25-<30 | ≥30 | ||
| N | 232 | 367 | 273 | |
| Female, % | 65.5 | 40.1 | 52.8 | <.0001 a |
| White, % | 93.1 | 94.8 | 89 | 0.002 a |
| Age, year, mean (SD) | 63.2 (6.2) | 63.5 (5.7) | 62.4 (5.9) | 0.08 b |
| Time in bed, weekend, hour, mean (SD) | 8.6 (1.2) | 8.5 (1.2) | 8.6 (1.2) | 0.47 b |
| Time in bed, weekday, hour, mean (SD) | 8.1 (1.0) | 8.0 (1.0) | 8.1 (1.1) | 0.72 b |
| Midpoint of time in bed, weekend, hour, mean (SD) | 3.3 (1.0) | 3.5 (0.9) | 3.6 (1.0) | 0.001 b |
| Midpoint of time in bed, weekday, hour, mean (SD) | 3.0 (1.0) | 3.1 (1.0) | 3.2 (1.0) | 0.09 b |
| Chronotype *, hour, mean (SD) | 2.9 (1.0) | 3.1 (1.0) | 3.2 (1.1) | 0.007 b |
| Breakfast time, hour, mean (SD) | 8.0 (1.0) | 8.1 (1.0) | 8.2 (1.0) | 0.06 b |
| Lunch time, hour, mean (SD) | 12.7 (1.3) | 12.7 (1.1) | 12.7 (1.1) | 0.86 b |
| Dinner, hour, mean (SD) | 18.4 (1.0) | 18.4 (0.9) | 18.3 (1.0) | 0.76 b |
| Time between wakeup and breakfast, min, mean (SD) | 48.2 (52.4) | 47.9 (55.4) | 48.2 (56.3) | 1.00 b |
| Time between dinner and bedtime, min, mean (SD) | 273.9 (65.4) | 287.4 (68.9) | 291.7 (75.8) | 0.01 b |
| Steps per day, mean (SD) | 7950.7 (3062.1) | 7330.5 (2852.9) | 6175.9 (2635.5) | <.0001 b |
| Sedentary time, min, mean (SD) | 478.6 (113.8) | 489.3 (119.9) | 501.9 (137.3) | 0.11 b |
| Calorie, kcal/day, mean (SD) | 1988.7 (544.1) | 2196.4 (588.8) | 2163.5 (674.6) | <.0001 c |
| Carbohydrate, g/day, mean (SD) | 238.9 (71.9) | 250.9 (75.4) | 234.9 (78.4) | 0.05 c |
| Total fat, g/day, mean (SD) | 75.2 (27.1) | 87.1 (29.1) | 90.5 (34) | <.0001 c |
| Protein, g/day, mean (SD) | 80.1 (25.3) | 88.7 (25.1) | 92.4 (30.5) | <.0001 c |
| Sugar, g/day, mean (SD) | 106.2 (42.6) | 109.4 (47.5) | 100.7 (44.4) | 0.10 c |
| Fiber, g/day, mean (SD) | 21.3 (8.6) | 20.1 (7.7) | 18.4 (7.2) | 0.003 c |
| Cholesterol, g/day, mean (SD) | 253.2 (122) | 305.2 (133.6) | 352.4 (157.9) | <.0001 c |
| Saturated fat, g/day, mean (SD) | 25.0 (10.3) | 29.1 (10.6) | 30.6 (12.2) | <.0001 c |
| Polyunsaturated fat, g/day, mean (SD) | 17.0 (6.9) | 19.0 (7.4) | 19.2 (7.9) | 0.0007 c |
| Monounsaturated fat, g/day, mean (SD) | 26.9 (10.1) | 31.5 (11.3) | 32.8 (13.1) | <.0001 c |
p-value was derived from Chi-square
p-value was derived from one way ANOVA
p-value was derived from Kruskal-Wallis test
Chronotype is measured as the midpoint of time in bed on weekends (Mweekend), if total time in bed on weekends (TIBweekend) ≤ total time in bed on weekdays (TIBweekday); measured as the Mweekend-(TIBweekend - TIBweekday)/2, if TIBweekend > TIBweekday
Abbreviation: SD, standard deviation; AARP, formerly American Association of Retired Persons
A). Timing of energy intake and BMI status
We first examined the relationship between dietary intake during the four time windows and BMI status (Figure 1, Table 2). We found that participants who reported consuming a higher percent of total daily energy within two hours after waking up (early morning) had lower odds for being overweight or obese (Figure 1A, Table 2). After adjusting for multiple covariates, the highest quintile of percent daily energy intake during the morning time window was associated with ~50% decrease in the odds of being overweight or obese when compared to the lowest quintile (OR Q5 vs Q1 (95% CI), 0.53 (0.31, 0.89), p-for-linear-trend, 0.008). In contrast, a higher percent of total daily energy consumed during the night time window was associated with higher odds of being overweight or obese (Table 2, Figure 1B). Indeed, the participants in the highest quintile were 80% more likely to be overweight or obese when compared to those in the lowest quintile (OR Q5 vs Q1 (95% CI), 1.82 (1.07, 3.08), p-for-linear-trend, 0.02).
Figure 1.
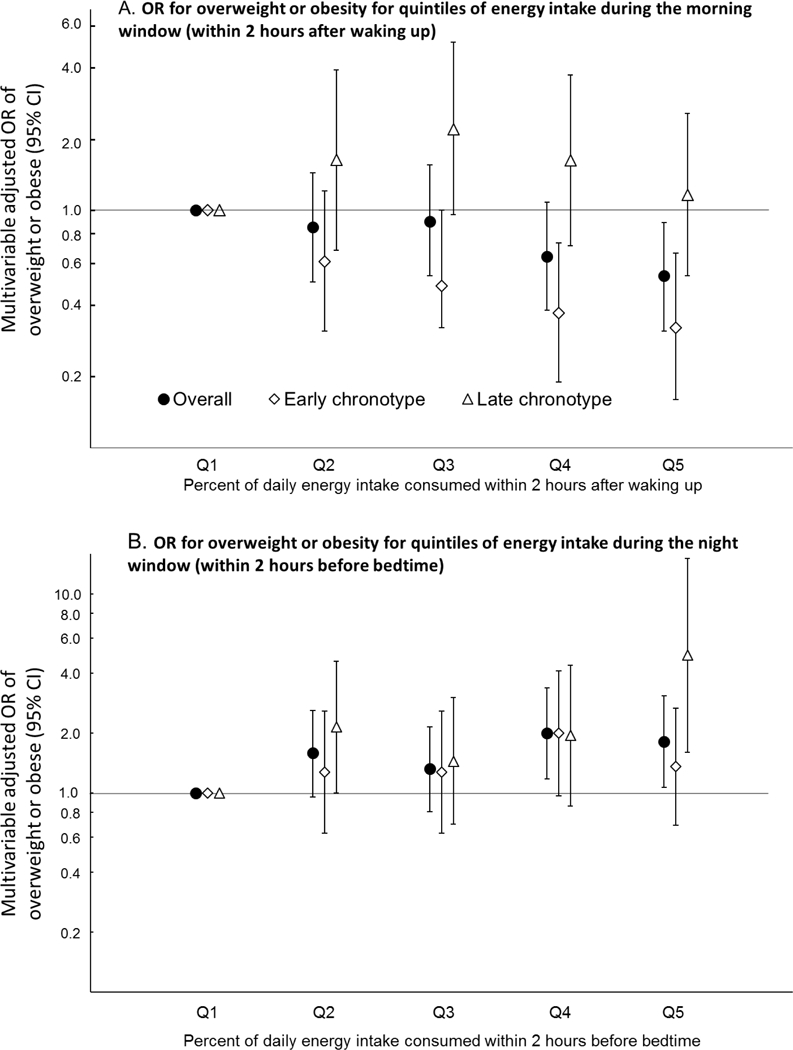
Associations between percent of total energy consumed during the morning window (A) and the night window (B) and the odds of being overweight or obese in the overall study population and as divided according to sleep timing. Earlier chronotype was defined as a chronotype earlier than the median (3:04 AM), while later chronotype was defined as a chronotype later than the median. The model was adjusted for age, sex, race/ethnicity, total time in bed, chronotype, total steps per day, duration of sedentary time and total daily energy intake. All quintiles are based on the overall population. Abbreviations: CI, confidence interval; OR, odds ratio.
Table 2.
Associations between percent of total energy consumed during different time windows and the odds ratios of being overweight or obese.
| Percent of total daily energy intake consumed during different time windows |
Overweight or obese, OR (95% CI) |
|||||
|---|---|---|---|---|---|---|
| Overall population |
Earlier chronotype a |
Later chronotype a |
||||
| Meal timing | Quintile (energy intake) |
Interquartile range |
Model 1 b | Model 2 c | Model 2 c | Model 2 c |
|
Morning (within two hours after getting out of bed) |
1 | (1.4%, 6.4%) | ref | ref | ref | ref |
| 2 | (9.1%, 11.7%) | 0.97 (0.59, 1.60) | 0.85 (0.50, 1.44) | 0.61 (0.31, 1.21) | 1.63 (0.68, 3.90) | |
| 3 | (13.6%, 15.2%) | 1.04 (0.63, 1.71) | 0.90 (0.53, 1.55) | 0.48 (0.23, 1.00) | 2.21 (0.96, 5.10) | |
| 4 | (16.8%, 19.4%) | 0.74 (0.46, 1.20) | 0.64 (0.38, 1.08) | 0.37 (0.19, 0.73) | 1.62 (0.71, 3.72) | |
| 5 | (22.4%, 27.9%) | 0.60 (0.37, 0.98) | 0.53 (0.31, 0.89) | 0.32 (0.16, 0.66) | 1.16 (0.53, 2.55) | |
| p-for-linear-trend | 0.02 | 0.008 | 0.0006 | 0.96 | ||
|
Late morning-early afternoon (from two hours after getting out of bed until midpoint of the waking period) |
1 | (14.8%, 22.2%) | ref | ref | ref | ref |
| 2 | (25.9%, 28.7%) | 0.89 (0.55, 1.44) | 0.78 (0.47, 1.31) | 0.78 (0.38, 1.61) | 0.87 (0.40, 1.88) | |
| 3 | (30.9%, 32.8%) | 0.98 (0.60, 1.59) | 0.88 (0.52, 1.47) | 0.57 (0.28, 1.14) | 1.66 (0.71, 3.89) | |
| 4 | (35.3%, 38.5%) | 0.78 (0.49, 1.26) | 0.67 (0.40, 1.12) | 0.50 (0.25, 1.00) | 1.03 (0.46, 2.28) | |
| 5 | (42.5%, 48.7%) | 1.05 (0.64, 1.71) | 1.07 (0.62, 1.83) | 1.26 (0.59, 2.69) | 0.88 (0.40, 1.94) | |
| p-for-linear-trend | 0.94 | 0.95 | 0.93 | 0.95 | ||
|
Late afternoon-early evening (from midpoint of the waking period until two hours before bedtime) |
1 | (28.1%, 35.8%) | ref | ref | ref | ref |
| 2 | (39.4%, 42.6%) | 0.79 (0.49, 1.26) | 0.70 (0.42, 1.15) | 0.65 (0.34, 1.23) | 0.74 (0.31, 1.75) | |
| 3 | (45.2%, 47.7%) | 0.99 (0.61, 1.60) | 0.90 (0.54, 1.50) | 0.86 (0.44, 1.69) | 0.82 (0.35, 1.91) | |
| 4 | (49.9%, 52.9%) | 0.97 (0.60, 1.58) | 0.93 (0.56, 1.56) | 1.06 (0.55, 2.06) | 0.77 (0.32, 1.83) | |
| 5 | (56.9%, 64.3%) | 1.36 (0.82, 2.25) | 1.29 (0.75, 2.20) | 1.70 (0.81, 3.56) | 0.89 (0.38, 2.08) | |
| p-for-linear-trend | 0.14 | 0.17 | 0.07 | 0.92 | ||
|
Night (within two hours before bedtime) |
1 | (0%, 0%) | ref | ref | ref | ref |
| 2 | (0.8%, 1.9%) | 1.30 (0.82, 2.07) | 1.59 (0.96, 2.61) | 1.28 (0.63, 2.58) | 2.15 (1.00, 4.60) | |
| 3 | (3.4%, 4.9%) | 1.25 (0.79, 1.97) | 1.33 (0.81, 2.16) | 1.28 (0.63, 2.58) | 1.45 (0.70, 3.02) | |
| 4 | (6.7%, 9.2%) | 1.71 (1.05, 2.76) | 2.00 (1.18, 3.38) | 2.00 (0.97, 4.13) | 1.95 (0.86, 4.41) | |
| 5 | (12.2%, 18.1%) | 1.40 (0.88, 2.25) | 1.82 (1.07, 3.08) | 1.36 (0.69, 2.67) | 4.94 (1.61, 15.14) | |
| p-for-linear-trend | 0.07 | 0.02 | 0.24 | 0.01 | ||
Earlier chronotype was defined as a chronotype earlier than the median (3:04 AM), while later chronotype was defined as a chronotype later than the median
Adjusted for age, sex and race/ethnicity
Adjusted for age, sex, race/ethnicity, total time in bed, chronotype, total steps per day, duration of sedentary time and total daily energy intake
Abbreviations: CI, confidence interval; OR, odds ratio of being overweight or obese.
Bolded results are statistically significant.
We conducted additional analyses in which the percent of total energy intake during the morning window and the percent of energy intake during the night window were both included in the model. We observed that mutual adjustment of the two variables in the model had minimal attenuation (<5%) of effect estimates for both time windows, suggesting that the associations between BMI status and intakes in these two time windows were independent of each other.
Finally, we found that the percentage of daily energy intake consumed during the late morning-early afternoon window and the late afternoon-early evening window was not associated with BMI status (Table 2).
B). Chronotype as a modifier for the relationship between meal timing and obesity.
We examined whether the relationship between dietary intake during different time windows and BMI status was modified by chronotype.
Morning.
First, we focused on percent of daily energy consumed in the morning. We found that a higher intake in the morning window was associated with lower odds of being overweight or obese only among people with an earlier (more morning) chronotype (p-for-linear-trend, 0.0006; Figure 1A, Table 2). Indeed, among participants whose chronotype was earlier than the median, the odds of being overweight or obese was 68% lower when comparing the highest quintile of intake to the lowest in this morning window (OR Q5 vs Q1 (95% CI), 0.32 (0.16, 0.66)). In contrast, among participants with a chronotype later than median (more evening type), the odds of being overweight or obese did not significantly differ between the highest and lowest quintile of intake in this morning window (OR Q5 vs Q1 (95% CI), 1.16 (0.53, 2.55), p-for-linear-trend, 0.96).
Night.
Next, we examined whether chronotype also had an impact on the relationship between the percent of energy intake at night and BMI status. We found that the association between a higher intake in the night time window and a higher odds of being overweight or obese was stronger among participants with a later (more evening) chronotype (p-for-linear-trend, 0.01; Figure 1B, Table 2). Indeed, among participants whose chronotype was later than median, the highest quintile of energy intake at night was associated with a ~5-fold increase in the odds of being overweight or obese, when compared to the lowest quintile (OR Q5 vs Q1 (95% CI), 4.94 (1.61, 15.14)). In contrast, no association was observed among people with an earlier (more morning) chronotype (OR Q5 vs Q1 (95% CI), 1.36 (0.69, 2.67)), p-for-linear-trend, 0.24)
C). Timing of macronutrient intake and BMI status
Finally, to determine which of the individual macronutrients, i.e., carbohydrates, fats and proteins, played a more important role in the observed associations, we studied BMI status in relation to the timing of intake of each individual nutrient. We focused our analysis on the morning and night time windows for which we found a significant association between energy intake and BMI status.
Among people with an earlier chronotype, higher intakes of carbohydrate (p-for-linear-trend, <.0001) and protein (p-for-linear-trend, 0.03) in the morning time window was significantly associated with BMI status, while there was no such association for the intake of fat (p-for-linear-trend, 0.47). We found that the highest quintile of the percent of carbohydrate and protein consumed in the morning time window was associated with 80% and 61% decrease in the odds of being overweight or obese, respectively (Table 3). In addition, a higher percent of sugar and fiber intake in this time window was also associated with a substantial decrease in the odds. However, among people with a later chronotypes, BMI status was not associated with the percent of intake in the morning for any of the macronutrients and other food components (data not shown).
Table 3.
Associations a between the percent of total daily intake of each individual nutrient that were consumed within two hours after getting out of bed and the odds ratios of being overweight or obese among people with a chronotype earlier than the median (3:04 AM).
| Percent of total daily intake of each nutrient consumed during the morning window b, c |
|||||||
|---|---|---|---|---|---|---|---|
| Nutrient | Q1 | Q2 | Q3 | Q4 | Q5 |
p-for-linear- trend |
|
| Carbohydrate | IQR | (2.0%, 7.5%) | (12.0%, 14.8%) | (17.4%, 20.0%) | (22.6%, 25.3%) | (29.2%, 36.1%) | |
| OR (95% CI) | ref | 0.58 (0.28, 1.19) | 0.68 (0.32, 1.43) | 0.39 (0.19, 0.80) | 0.20 (0.10, 0.42) | <.0001 | |
| Protein | IQR | (1.0%, 4.5%) | (7.4%, 9.4%) | (11.5%, 13.0%) | (14.8%, 17.5%) | (20.4%, 26.8%) | |
| OR (95% CI) | ref | 0.40 (0.20, 0.82) | 0.42 (0.21, 0.84) | 0.46 (0.22, 0.96) | 0.39 (0.19, 0.81) | 0.03 | |
| Total fat | IQR | (0.3%, 4.0%) | (6.0%, 7.6%) | (9.3%, 11.4%) | (13.6%, 16.1%) | (19.8%, 28.0%) | |
| OR (95% CI) | ref | 0.40 (0.20, 0.82) | 0.73 (0.36, 1.50) | 0.35 (0.17, 0.72) | 0.79 (0.37, 1.69) | 0.47 | |
| Sugar | IQR | (1.5%, 8.2%) | (12.9%, 16.1%) | (19.8%, 23.5%) | (26.2%, 30.3%) | (35.2%, 45.0%) | |
| OR (95% CI) | ref | 0.48 (0.24, 0.96) | 0.78 (0.36, 1.67) | 0.42 (0.20, 0.86) | 0.23 (0.11, 0.49) | 0.0003 | |
| Fiber | IQR | (0%, 5.7%) | (9.6%, 12.8%) | (15.6%, 18.1%) | (22.5%, 24.8%) | (29.4%, 39.4%) | |
| OR (95% CI) | ref | 1.42 (0.68, 2.99) | 0.67 (0.34, 1.34) | 0.77 (0.37, 1.60) | 0.31 (0.15, 0.65) | 0.0008 | |
| Cholesterol | IQR | (0%, 1.0%) | (3.0%, 5.2%) | (7.4%, 10.8%) | (14.2%, 18.2%) | (24.9%, 39.6%) | |
| OR (95% CI) | ref | 0.79 (0.40, 1.53) | 0.72 (0.37, 1.39) | 0.56 (0.28, 1.12) | 0.86 (0.40, 1.84) | 0.35 | |
| Saturated fat | IQR | (0.2%, 3.5%) | (5.9%, 7.8%) | (10.0%, 12.0%) | (14.1%, 17.0%) | (20.9%, 29.2%) | |
| OR (95% CI) | ref | 0.58 (0.30, 1.12) | 0.56 (0.28, 1.11) | 0.71 (0.36, 1.41) | 0.88 (0.43, 1.79) | 0.90 | |
| Monounsaturated fat | IQR | (0.3%, 3.5%) | (5.4%, 7.1%) | (8.5%, 10.5%) | (13.0%, 15.9%) | (19.8%, 27.7%) | |
| OR (95% CI) | ref | 0.46 (0.23, 0.94) | 0.67 (0.33, 1.35) | 0.52 (0.25, 1.07) | 0.65 (0.31, 1.36) | 0.42 | |
| Polyunsaturated fat | IQR | (0.3%, 3.2%) | (5.6%, 7.1%) | (8.9%, 10.9%) | (13.3%, 16.8%) | (20.5%, 28.9%) | |
| OR (95% CI) | ref | 0.80 (0.40, 1.60) | 0.66 (0.33, 1.31) | 0.53 (0.26, 1.06) | 0.46 (0.23, 0.92) | 0.01 | |
Adjusted for age, sex, race/ethnicity, total time in bed, chronotype, total steps per day, duration of sedentary time and total daily energy intake. For each macronutrient, the models was also adjusted for the daily total intake of the macronutrient.
Defined as within two hours after getting out of bed.
All quintiles are based on the overall population
Abbreviations: CI, confidence interval; IQR, interquartile range; OR, odds ratio.
Bolded results are statistically significant.
On the other hand, among people with a later chronotype, the highest quintile of carbohydrate and protein consumed at night was associated with 4.5 fold and 3.7 fold increase in the odds of being overweight or obese, respectively (Table 4). In contrast, percent intake of individual nutrients at night was not associated with BMI status among people with an earlier (more morning) chronotype (data not shown).
Table 4.
Associations a between the percent of total daily intake of each individual nutrient that were consumed within two hours before bedtime and the odds ratios of being overweight or obese among people with a chronotype later than the median (3:04 AM).
| Percent of total daily intake of each nutrient consumed during the night window b, c |
|||||||
|---|---|---|---|---|---|---|---|
| Nutrient | Q1 | Q2 | Q3 | Q4 | Q5 |
p-for-linear- trend |
|
| Carbohydrate | IQR | (0%, 0%) | (0.8%, 2.1%) | (3.7%, 5.4%) | (7.2%, 9.4%) | (12.6%, 18.8%) | |
| OR (95% CI) | ref | 2.16 (1.02, 4.60) | 2.06 (0.93, 4.53) | 2.03 (0.85, 4.81) | 4.48 (1.64, 12.24) | 0.009 | |
| Protein | IQR | (0%, 0%) | (0.2%, 0.8%) | (1.5%, 2.4%) | (3.6%, 5.3%) | (8.1%, 14.3%) | |
| OR (95% CI) | ref | 1.54 (0.71, 3.35) | 1.52 (0.73, 3.16) | 1.56 (0.69, 3.53) | 3.74 (1.33, 10.52) | 0.02 | |
| Total fat | IQR | (0%, 0%) | (0.1%, 1.2%) | (2.6%, 4.4%) | (6.0%, 8.8%) | (12.1%, 19.5%) | |
| OR (95% CI) | ref | 2.43 (1.06, 5.55) | 1.62 (0.75, 3.49) | 1.48 (0.70, 3.15) | 1.85 (0.71, 4.83) | 0.30 | |
| Sugar | IQR | (0%, 0%) | (0.4%, 1.9%) | (3.7%, 5.7%) | (8.2%, 11.1%) | 16.1%, 23.2%) | |
| OR (95% CI) | ref | 1.10 (0.54, 2.23) | 3.38 (1.43, 8.02) | 1.39 (0.62, 3.09) | 3.11 (1.17, 8.22) | 0.02 | |
| Fiber | IQR | (0%, 0%) | (0.4%, 1.1%) | (2.2%, 3.6%) | (5.1%, 7.4%) | (10.0%, 17.4%) | |
| OR (95% CI) | ref | 1.51 (0.68, 3.37) | 1.07 (0.53, 2.16) | 1.39 (0.63, 3.05) | 1.98 (0.76, 5.14) | 0.27 | |
| Cholesterol d | IQR | (0%, 0%) | (0.4%, 1.9%) | (4.9%, 12.3%) | NA | NA | |
| OR (95% CI) | ref | 0.94 (0.51, 1.72) | 2.06 (1.02, 4.15) | NA | NA | 0.06 | |
| Saturated fat | IQR | (0%, 0%) | (0.1%, 1.0%) | (2.4%, 4.2%) | (6.2%, 9.0%) | (12.6%, 20.1%) | |
| OR (95% CI) | ref | 2.05 (0.95, 4.43) | 2.03 (0.93, 4.43) | 1.53 (0.70, 3.34) | 1.55 (0.62, 3.84) | 0.34 | |
| Monounsaturated fat | IQR | (0%, 0%) | (0%, 1.0%) | (2.4%, 4.1%) | (6.0%, 8.7%) | (12.1%, 20.4%) | |
| OR (95% CI) | ref | 2.74 (1.21, 6.23) | 1.62 (0.75, 3.50) | 1.49 (0.69, 3.19) | 2.05 (0.79, 5.33) | 0.31 | |
| Polyunsaturated fat | IQR | (0%, 0%) | (0.1%, 0.7%) | (1.8%, 3.3%) | (5.7%, 8.6%) | (12.3%, 21.1%) | |
| OR (95% CI) | ref | 2.37 (1.07, 5.23) | 1.35 (0.65, 2.80) | 2.89 (1.19, 6.99) | 1.90 (0.79, 4.54) | 0.08 | |
Adjusted for age, sex, race/ethnicity, total time in bed, chronotype, total steps per day, duration of sedentary time and total daily energy intake. For each macronutrient, the models was also adjusted for the daily total intake of the macronutrient.
Defined as within two hours before bedtime.
All quintiles are based on the overall population.
Due to a substantial portion of participants who had no intake of cholesterol during this time window, we divided cholesterol intake in tertiles.
Abbreviations: CI, confidence interval; IQR, interquartile range; OR, odds ratio.
Bolded results are statistically significant.
Discussion
We found that a higher percent of energy intake consumed in the morning, within two hours after waking up, was associated with an ~50% decrease in the odds of being overweight or obese. Furthermore, a higher percent consumed in the night window, within two hours before bedtime, was associated with ~80% increase in the odds of being overweight or obese. Interestingly, the magnitude of both effects depended on chronotype, with morning intake decreasing the odds only in the earlier chronotypes and with the night intake increasing the odds only in the later chronotypes. Furthermore, when analyzing the individual macronutrients separately, an increased carbohydrate intake in the morning was associated with an 80% reduction in the odds for being overweight or obese only in the earlier chronotypes, while this reduction was 60% for protein intake. On the other hand, a higher carbohydrate intake at night was associated with a more than 4-fold increase in the odds for being overweight/obese in the late chronotypes, with a similar increase for protein.
These findings based on food timing relative to the timing of sleep expand beyond the findings from previous investigations studying the relationship between food intake and obesity in the morning window and at night. Multiple cross-sectional and prospective studies have shown that eating breakfast was associated with lower adiposity.1 For example, in the NHANES (1999-2006), young adults (age 20-39) who ate breakfast were 22% less likely to be overweight or obese when compared to those who skipped breakfast. 2 In another study, breakfast consumption was associated with a 13% reduction in the risk of gaining 5 kg or more over 10-year follow up in men (age 46-81). 21 Moreover, in a study of over 6000 middle aged men and women in the United Kingdom, people in the highest quintile of percentage of daily energy consumed at breakfast had the lowest average BMI. 22 While most studies have shown such an association between breakfast intake and decreased likelihood for being obese, some failed to show significance. 9
For the night, the positive association between higher energy intake and obesity has produced mixed results. In a Swedish sample of more than 3000 adults, those who reported habitual eating at night were 62% more likely to be obese. 5 In addition, a study of more than 70,000 Japanese adults reported that eating dinner within 2 hours before bedtime for at least three times per week associates with 36% increase in odds of being obese. 6 Finally, in a small study of 52 American adults, energy intake after 8:00PM was associated with a higher BMI. 23 However, in a systematic review and meta-analysis focusing on large dinner and evening intake and their association with obesity, only four of the ten studies found a significant and positive association. 10
Several limitations exist in previous studies that may partially account for the heterogeneity in their findings. First, as McCrory et al. 9 pointed out, lack of consistent definitions of meal and meal timing may be an important contributor. In the current study, we introduced a practical approach to define meal timing by considering its timing relative to the sleep/wake cycle, as a proxy for circadian time of food intake. Other approaches of defining meal timing, using clock time or meal classification (e.g., breakfast, lunch, dinner) are more influenced by cultural aspects, work/school schedules, and time zones, which may not capture the physiological impact of meal timing on health. Indeed, in a recent study we found that later timing of food intake relative to endogenous circadian phase was associated with higher BMI and adiposity, while no association was found when expressed in clock hours. 12 In this study, circadian food timing was defined as the time interval between eating and the rise of the circadian hormone melatonin under dim light conditions. While this approach provides a precise assessment of the timing of the internal biological clock, it requires repeated sampling across at least 5 hours under dim light conditions which is not feasible in many epidemiologic and clinical studies. In our current study, we observed a wide range for the habitual bedtime (19:30 to 04:40) and the out-of-bed time (06:00 to 12:11) among participants (i.e., spanning more than 6 hours). This suggests that if we had relied on clock time to define meal timing, the same time point may have reflected very different circadian timing for different individuals. Indeed, an analysis in this study population using six 4-hour time windows spanning from midnight to midnight showed no statistically significant association between BMI status and eating in any timeframe (data not shown). Together, these suggest that using direct or proxy markers of circadian time may be a more meaningful way to characterize meal timing.
We have also found that chronotype is a significant modifier of the association between meal timing and obesity. Indeed, we found that the association between higher energy intake in the morning and lower BMI was only observed among earlier chronotypes. Furthermore, the association between higher energy intake at night and higher BMI was stronger among later chronotype. One possible explanation for this observation is that the circadian timing of the sleep episode depends on chronotype,24,25 such that the timing of food intake relative to the sleep episode would represent a different circadian phase in each chronotype. As demonstrated by previous studies, human metabolism vary across the 24-hour period,26 and therefore dietary intakes at different circadian phases may lead to different metabolic outcomes. Our results suggest that the optimal meal timing may differ according individual circadian characteristics, an important factor to be considered by future studies.
The finding of the association between the timing of macronutrient intake and obesity supports the hypothesis that the response to and need for different nutrients varies across the circadian cycle and can have important health consequences. 27 Two previous studies investigated the timing of intake of individual macronutrients in relation to obesity, but their findings were mixed. In one study, a higher intake of protein in the evening was associated with higher BMI, 8 while in the other, consuming a higher amount of carbohydrates and lipids at dinner was associated with overweight and obesity. 15 Moreover, in a recent randomized, cross-over study, the effect of high carbohydrate and low fat intake at night resulted in impaired glucose tolerance in prediabetic individuals. 28 In our study, the intake of carbohydrates and protein in the morning and night time windows appeared to have the strongest effects. The mixed results may be partially explained by the heterogeneity in the assessment of dietary timing in different studies. We encourage more studies to examine the timing of macronutrient intakes and health, as this issue is relevant for the nutrition field and for clinical practice.
Our study has several strengths. First, we collected detailed information on sleep timing, which enabled us to construct eating time windows in reference to sleep as a proxy of the circadian time of food intake. 12,29 Second, we have multiple dietary recalls conducted throughout a year, which allowed us to capture the habitual dietary pattern and reduced potential influence of seasonal fluctuations in meal timing. This study also has several limitations. Sleep timing was self-reported by diaries and not reported on the same day when dietary recalls were completed. Moreover, we did not have information on certain lifestyle and medical factors such as smoking and sleep disorders, and therefore could not control for their possible confounding effects.
In conclusion, our study demonstrates that higher dietary consumption after waking up and lower consumption close to bedtime are associated with lower BMI, but the relationship differs by chronotype. Furthermore, the results show a clear relationship between the timing of carbohydrate and protein intake and obesity. Although our findings may have important public health implications, experimental studies are needed to establish a causal relationship. We encourage future research to examine the effects of meal timing on weight change and risk of obesity by using an experimental design, particularly randomized trials, because findings from such studies could inform dietary guidelines. Based on our findings, future trials should consider designing personalized dietary interventions according to individual characteristics such as chronotypes. Our findings also highlight the importance of considering timing of intake relative to sleep timing (as opposed to merely local clock time) as well as the nutrient composition of meals when studying the effects of meal timing on obesity and metabolic health.
Supplementary Material
Acknowledgement
The authors thank the National Cancer Institute for access to NCI’s data collected by the Interactive Diet and Activity Tracking in AARP (IDATA) Study. The statements contained herein are solely those of the authors and do not represent or imply concurrence or endorsement by NCI.
Sources of support:M.G. was supported in part by The Spanish Government of Investigation, Development and Innovation (SAF2017-84135-R) including FEDER co-funding, and NIH grant R01DK105072 (to M.G.). F.A.J.L.S. was supported in part by NIH grants R01HL094806, R01HL118601, R01DK099512, R01DK102696, and R01DK105072 (to F.A.J.L.S.).
Abbreviations:
- BMI
body mass index
- CI
confidence interval
- IQR
interquartile range
- OR
odds ratio
- SD
standard deviation
Footnotes
Conflict of Interest:
The other authors declare no conflict of interest.
F.A.J.L.S. received speaker fees from Bayer Healthcare, Sentara Healthcare, Philips, Kellogg Company, Vanda Pharmaceuticals, and Pfizer.
References
- 1.St-Onge MP, Ard J, Baskin ML, et al. Meal Timing and Frequency: Implications for Cardiovascular Disease Prevention: A Scientific Statement From the American Heart Association. Circulation. 2017;135(9):e96–e121. [DOI] [PMC free article] [PubMed] [Google Scholar]
- 2.Deshmukh-Taskar P, Nicklas TA, Radcliffe JD, O’Neil CE, Liu Y. The relationship of breakfast skipping and type of breakfast consumed with overweight/obesity, abdominal obesity, other cardiometabolic risk factors and the metabolic syndrome in young adults. The National Health and Nutrition Examination Survey (NHANES): 1999-2006. Public Health Nutr. 2013;16(11):2073–2082. [DOI] [PMC free article] [PubMed] [Google Scholar]
- 3.Horikawa C, Kodama S, Yachi Y, et al. Skipping breakfast and prevalence of overweight and obesity in Asian and Pacific regions: a meta-analysis. Prev Med. 2011;53(4-5):260–267. [DOI] [PubMed] [Google Scholar]
- 4.Garaulet M, Gomez-Abellan P, Alburquerque-Bejar JJ, Lee YC, Ordovas JM, Scheer FA. Timing of food intake predicts weight loss effectiveness. Int J Obes (Lond). 2013;37(4):604–611. [DOI] [PMC free article] [PubMed] [Google Scholar]
- 5.Berg C, Lappas G, Wolk A, et al. Eating patterns and portion size associated with obesity in a Swedish population. Appetite. 2009;52(1):21–26. [DOI] [PubMed] [Google Scholar]
- 6.Kutsuma A, Nakajima K, Suwa K. Potential Association between Breakfast Skipping and Concomitant Late-Night-Dinner Eating with Metabolic Syndrome and Proteinuria in the Japanese Population. Scientifica (Cairo). 2014;2014:253581. [DOI] [PMC free article] [PubMed] [Google Scholar]
- 7.Wang JB, Patterson RE, Ang A, Emond JA, Shetty N, Arab L. Timing of energy intake during the day is associated with the risk of obesity in adults. J Hum Nutr Diet. 2014;27 Suppl 2:255–262. [DOI] [PubMed] [Google Scholar]
- 8.Baron KG, Reid KJ, Horn LV, Zee PC. Contribution of evening macronutrient intake to total caloric intake and body mass index. Appetite. 2013;60(1):246–251. [DOI] [PMC free article] [PubMed] [Google Scholar]
- 9.McCrory MA, Shaw AC, Lee JA. Energy and Nutrient Timing for Weight Control: Does Timing of Ingestion Matter? Endocrinol Metab Clin North Am. 2016;45(3):689–718. [DOI] [PubMed] [Google Scholar]
- 10.Fong M, Caterson ID, Madigan CD. Are large dinners associated with excess weight, and does eating a smaller dinner achieve greater weight loss? A systematic review and meta-analysis. Br J Nutr. 2017;118(8):616–628. [DOI] [PubMed] [Google Scholar]
- 11.Jiang P, Turek FW. Timing of meals: when is as critical as what and how much. Am J Physiol Endocrinol Metab. 2017;312(5):E369–E380. [DOI] [PMC free article] [PubMed] [Google Scholar]
- 12.McHill AW, Phillips AJ, Czeisler CA, et al. Later circadian timing of food intake is associated with increased body fat. Am J Clin Nutr. 2017;106(5):1213–1219. [DOI] [PMC free article] [PubMed] [Google Scholar]
- 13.Lovato N, Micic G, Gradisar M, et al. Can the circadian phase be estimated from self-reported sleep timing in patients with Delayed Sleep Wake Phase Disorder to guide timing of chronobiologic treatment? Chronobiol Int. 2016;33(10):1376–1390. [DOI] [PubMed] [Google Scholar]
- 14.Brown SA, Kunz D, Dumas A, et al. Molecular insights into human daily behavior. Proc Natl Acad Sci U S A. 2008;105(5):1602–1607. [DOI] [PMC free article] [PubMed] [Google Scholar]
- 15.Munoz JSG, Canavate R, Hernandez CM, Cara-Salmeron V, Morante JJH. The association among chronotype, timing of food intake and food preferences depends on body mass status. Eur J Clin Nutr. 2017;71(6):736–742. [DOI] [PubMed] [Google Scholar]
- 16.Lopez-Minguez J, Dashti HS, Madrid-Valero JJ, et al. Heritability of the timing of food intake. Clin Nutr. 2018. [DOI] [PMC free article] [PubMed] [Google Scholar]
- 17.National Cancer Institute Cancer Data Access System. IDATA Homepage. 2016; https://biometry.nci.nih.gov/cdas/idata/. Accessed September 6, 2017.
- 18.National Cancer Institute Division of Cancer Control & Population Sciences. Automated Self-Administered 24-Hour (ASA24®) Dietary Assessment Tool. 2017.
- 19.The Worldwide Experimental Platform. https://www.thewep.org/documentations/mctq/item/mctq-variables. Accessed March 6, 2018.
- 20.Hosmer DW, Lemeshow S. Applied logistic regression. 2nd ed New York: Wiley; 2000. [Google Scholar]
- 21.van der Heijden AA, Hu FB, Rimm EB, van Dam RM. A prospective study of breakfast consumption and weight gain among U.S. men. Obesity (Silver Spring). 2007;15(10):2463–2469. [DOI] [PubMed] [Google Scholar]
- 22.Purslow LR, Sandhu MS, Forouhi N, et al. Energy intake at breakfast and weight change: prospective study of 6,764 middle-aged men and women. Am J Epidemiol. 2008;167(2):188–192. [DOI] [PubMed] [Google Scholar]
- 23.Baron KG, Reid KJ, Kern AS, Zee PC. Role of sleep timing in caloric intake and BMI. Obesity (Silver Spring). 2011;19(7):1374–1381. [DOI] [PubMed] [Google Scholar]
- 24.Duffy JF, Dijk DJ, Hall EF, Czeisler CA. Relationship of endogenous circadian melatonin and temperature rhythms to self-reported preference for morning or evening activity in young and older people. J Investig Med. 1999;47(3):141–150. [PMC free article] [PubMed] [Google Scholar]
- 25.Mongrain V, Lavoie S, Selmaoui B, Paquet J, Dumont M. Phase relationships between sleep-wake cycle and underlying circadian rhythms in Morningness-Eveningness. J Biol Rhythms. 2004;19(3):248–257. [DOI] [PubMed] [Google Scholar]
- 26.Sahar S, Sassone-Corsi P. Regulation of metabolism: the circadian clock dictates the time. Trends Endocrinol Metab. 2012;23(1):1–8. [DOI] [PMC free article] [PubMed] [Google Scholar]
- 27.Asher G, Schibler U. Crosstalk between components of circadian and metabolic cycles in mammals. Cell Metab. 2011;13(2):125–137. [DOI] [PubMed] [Google Scholar]
- 28.Kessler K, Hornemann S, Petzke KJ, et al. The effect of diurnal distribution of carbohydrates and fat on glycaemic control in humans: a randomized controlled trial. Sci Rep. 2017;7:44170. [DOI] [PMC free article] [PubMed] [Google Scholar]
- 29.Shea SA, Hilton MF, Hu K, Scheer FA. Existence of an endogenous circadian blood pressure rhythm in humans that peaks in the evening. Circ Res. 2011;108(8):980–984. [DOI] [PMC free article] [PubMed] [Google Scholar]
Associated Data
This section collects any data citations, data availability statements, or supplementary materials included in this article.