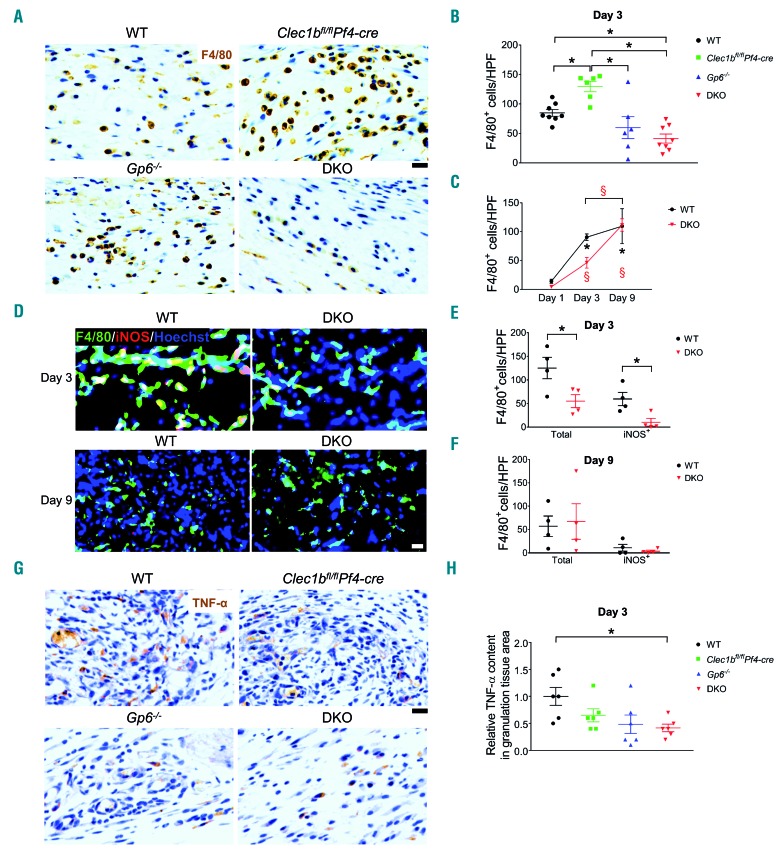
Figure 7.
M1 macrophages and TNF-α level are reduced during the inflammatory phase of wound healing in platelet immunoreceptor tyrosine-based activation motif (ITAM) receptor-deficient mice. (A) Detection of macrophages (F4/80+ cells; brown) in wound at day 3 post injury. (B) Quantification of F4/80+ cells in wound at day 3 post injury (n=6-8). *P<0.05; **P<0.01. (C) Comparison of F4/80+ cells between day 1, day 3, and day 9 post injury in wild-type (WT) and DKO mice. The symbols * and § indicate P<0.05 in WT and DKO mice, compared to the data at day 1 post injury, respectively. The bracket shows P<0.05 for the comparison between day 3 and day 9 post injury in §DKO mice. Sample numbers at days post injury: at day 1, n=5; day 3, n=6-9; day 9, n=10-13, respectively. (D) Immunofluorescence double staining of iNOS (red) and F4/80 (green) in the wound of WT and DKO mice at day 3 (n=4) and day 9 (n=4) post injury. Hoechst counterstains nuclei (blue). (E) Quantification of M1 macrophages (iNOS+F4/80+ cells; yellow) at day 3 post injury (n=4). *P<0.05. (F) Quantification of M1 macrophages (iNOS+F4/80+ cells; yellow) at day 9 post injury (n=4). (G) Immunohistochemistry staining of TNF-α (brown) in the wound at day 3 post injury. (H) Quantification of TNF-α level in granulation tissue area at day 3 post injury (n=6). *P<0.05. Graphs are presented as mean±Standard Error of Mean and analyzed by either Student t-test (E, F) or one-way ANOVA with Bonferroni’s multiple comparison test (B, C, and H). Scale bar = 20 μm.

