

Abstract
Background
Delay in fracture healing is a complex clinical and economic issue for patients and health services.
Objectives
To assess the incremental effectiveness and costs of bone morphogenetic protein (BMP) on fracture healing in acute fractures and nonunions compared with standards of care.
Search methods
We searched The Cochrane Library (2008, Issue 4), MEDLINE, and other major health and health economics databases (to October 2008).
Selection criteria
Randomised controlled trials (RCTs) and full or partial economic evaluations of BMP for fracture healing in skeletally mature adults.
Data collection and analysis
All clinical and economic data were extracted by one author and checked by another.
Main results
Eleven RCTs, all at high risk of bias, and four economic evaluations were included. Apart from one study, the times to fracture healing were comparable between the BMP and control groups. There was some evidence for increased healing rates, without requiring a secondary procedure, of BMP compared with usual care control in acute, mainly open, tibial fractures (risk ratio (RR) 1.19, 95% CI 0.99 to 1.43). The pooled RR for achieving union for nonunited fractures was 1.02 (95% CI 0.90 to 1.15). One study found no difference in union for patients who had corrective osteotomy for radial malunions. Data from three RCTs indicated that fewer secondary procedures were required for acute fracture patients treated with BMP versus controls (RR 0.65, 95% CI 0.50 to 0.83). Adverse events experienced were infection, hardware failure, pain, donor site morbidity, heterotopic bone formation and immunogenic reactions. The evidence on costs for BMP‐2 for acute open tibia fractures is from one large RCT. This indicates that the direct medical costs associated with BMP would generally be higher than treatment with standard care, but this cost difference may decrease as fracture severity increases. Limited evidence suggests that the direct medical costs associated with BMP could be offset by faster healing and reduced time off work for patients with the most severe open tibia fractures.
Authors' conclusions
This review highlights a paucity of data on the use of BMP in fracture healing as well as considerable industry involvement in currently available evidence. There is limited evidence to suggest that BMP may be more effective than controls for acute tibial fracture healing, however, the use of BMP for treating nonunion remains unclear. The limited available economic evidence indicates that BMP treatment for acute open tibial fractures may be more favourable economically when used in patients with the most severe fractures.
Keywords: Adult; Humans; Bone Morphogenetic Protein 2; Bone Morphogenetic Protein 7; Bone Morphogenetic Protein 7/economics; Bone Morphogenetic Protein 7/therapeutic use; Bone Morphogenetic Proteins; Bone Morphogenetic Proteins/economics; Bone Morphogenetic Proteins/therapeutic use; Cost‐Benefit Analysis; Fracture Healing; Fracture Healing/drug effects; Fracture Healing/physiology; Fractures, Bone; Fractures, Bone/drug therapy; Fractures, Bone/economics; Fractures, Malunited; Fractures, Malunited/drug therapy; Fractures, Malunited/economics; Fractures, Ununited; Fractures, Ununited/drug therapy; Fractures, Ununited/economics; Health Care Costs; Radius Fractures; Radius Fractures/drug therapy; Radius Fractures/economics; Randomized Controlled Trials as Topic; Recombinant Proteins; Recombinant Proteins/economics; Recombinant Proteins/therapeutic use; Tibial Fractures; Tibial Fractures/drug therapy; Tibial Fractures/economics; Transforming Growth Factor beta; Transforming Growth Factor beta/economics; Transforming Growth Factor beta/therapeutic use
Intervention to improve fracture healing in adults
Broken bones (fractures) that do not heal or unite quickly or completely can result in significant pain and loss of function. This may affect the person's ability to work and an associated reduction in their quality of life. There is also a considerable economic burden to society associated with delayed union (healing) or nonunion of fractures. The intervention tested in this review is bone morphogenetic protein (BMP). This is produced naturally by the body and it has been shown to play an important role in bone and cartilage formation. The review set out to find whether BMP applied at the fracture site can help to speed up and improve fracture healing.
The review included 11 trials. All were flawed which means that their results may be biased. Four trials involved people with acute fractures of the tibia (shin bone). Evidence from these trials showed that BMP may enhance healing of these fractures, and that people with these fractures when treated with BMP required fewer subsequent procedures. Six trials testing BMP for fractures that had not healed during first course of treatment (nonunions) showed BMP was neither better or worse at healing than bone grafts. One small trial found no difference between BMP and done grafts in people whose bone had been cut so in order to treat a healed but misaligned fracture. Trial participants who received BMP experienced similar adverse effects to those no receiving BMP (infection, hardware failure, heterotopic bone formation and immunogenic reactions). However, patients given BMP instead of bone autografts will have avoided problems associated with extraction of the bone from another site in their body.
The review also included four economic evaluations. Three of these found that the costs associated with using BMP, based on one large trial of acute open tibia fractures, were likely to be higher than standard care treatment without BMP. The difference in costs decreased with increased fracture severity.
Background
Description of the condition
A fracture is a broken bone. Most fractures heal within 20 weeks (Littenberg 1998). The time to fracture union depends on a number of factors, including: severity of injury, presence of an open wound, number of fracture fragments, associated vascular injury, part of the bone fractured and method of fracture treatment (Bhandari 1999; Bhandari 2001; Dervin 1996).
A fracture that does not heal in the time expected, as established by the clinician, is considered a delayed union. The rate of delayed unions varies by fracture severity from 16% to 60% for less severe fractures (Gustilo‐Anderson types I to IIIA) to 43% to 100% for more severe fractures (Gustilo‐Anderson types IIIB and IIIC) (Caudle 1987; Riemer 1995; Sanders 1994). A fracture that demonstrates motion at the bony ends and is not completely healed within six months is considered a nonunion (Limb Centre 2009). Nonunions can lead to significant pain, inhibition of function and decreased personal and professional productivity (i.e. paid and unpaid) (Friedlaender 2004), with the potential for associated reductions in patients' health‐related quality of life. The rate of nonunions has been reported to range from 4% to 10% (Friedlaender 2001; Littenberg 1998). Factors contributing to delayed union or nonunion can include: severe comminution (shattered or splintered bone), open fractures, association with tumour, infection, insufficient immobilisation, inadequate blood supply, poor nutrition or chronic disease (Schoelles 2005).
A fracture is considered open when the bone protrudes through the skin, which increases risk of infection. The estimated incidence of open fractures, based on an epidemiological study conducted from 1988 to 1994 in Edinburgh UK, is 23 per 100,000 population per year. Fifty‐four percent of open fractures involve fractures of the phalangeal (fingers and toes) or tibial (shin bone) diaphysis (shaft) (Court‐Brown 1997). The severity of open fractures are graded using the Gustilo‐Anderson system. Grade I (least severe) is a puncture wound and grade IIIC (most severe) is a large open wound with an arterial injury necessitating vascular repair. A higher grade leads to a higher risk of amputation (Caudle 1987; Riemer 1995; Sanders 1994). In grade IIIB open fractures there can be up to a 50% infection rate (Bhandari 2001). The severity of an open fracture is determined by the energy level of impact, degree of contamination, degree of soft tissue injury, complexity of fracture pattern and vascular injury (Limb Centre 2009). A critically sized defect is a defect in a long bone, the size of which inevitably leads to a non‐union, where the absolute length depends on the bone.
Fractures resulting from injury place an important economic burden on health and social care systems (Donaldson 2008), as well as on individuals and employers. In the USA, long bone fractures are estimated to comprise 10% of all non‐fatal injuries and incur the largest proposition of inpatient expenditures on injuries (Kanakaris 2007;Vyrostek 2004). Treatment of both acute and nonunion fractures can be expensive, with patients treated for long‐bone fracture nonunion typically submitted to frequent hospital admissions and a number of interventions (Dahabreh 2007;Kanakaris 2007).
Description of the intervention
Bone morphogenetic proteins (BMPs) may have an important role in bone and cartilage formation, fracture healing and repair of other musculoskeletal tissues. Part of the transforming growth factor beta (TGF‐ß) superfamily, they are proteins secreted by cells, which serve as signalling agents that influence cell division, matrix synthesis and tissue differentiation. The cloning of the human BMP‐2 sequence led to the ability to manufacture large quantities of recombinant human BMP‐2 (rhBMP‐2) for clinical use (Jones 2006).
There are two BMPs clinically available: BMP‐7 (also known as osteogenic protein‐1 or OP‐1) supplied by Stryker UK, which uses a bovine collagen carrier in granular form (OP‐1 Putty in the US and Osigraft® in the UK), and rhBMP‐2 supplied by Wyeth Research Ltd, which uses a collagen sponge carrier (InFUSE in the US and InductOs in the UK). These collagen carriers allow slow release of the BMP over time.
How the intervention might work
In acute fractures, delayed union and fracture nonunions, it is possible to induce bone at the fracture site to assist healing. Autogenous iliac crest bone graft (AICBG), is considered the current best‐practice graft for bone induction (Szpalski 2005) because it has the three properties required for bone formation; osteogenicity (ability to form bone), osteoconductivity (allow bone to grow along) and osteoinductivity (bring about bone formation). Since the bone is taken from the patient, it is both histocompatible and nonimmunogenic (Arrington 1996). However, there are several disadvantages to using autogenous bone. Because the graft is taken from the patient, there is a limited amount of bone available, and when the patient has had previous bone grafts, the remaining volume of iliac crest bone may not be sufficient to induce bone at the fracture site, thus requiring additional bone to be harvested from other sites, or the use of bone graft substitutes (Jones 2006). Also, since harvesting bone creates a second surgical site, the use of autogenous bone increases operative time and blood loss (Arrington 1996; Dhawan 2002). Morbidity at the donor site has been reported to be common and enduring (Goulet 1997). The most common morbidities are patient donor site pain and dissatisfaction with donor site appearance (Goulet 1997; Robertson 2001). The rates and degrees of donor site pain vary, with 18‐31% of patients still experiencing donor site pain 24 months postoperatively (Goulet 1997; Sasso 2005). Complications associated with AICBG include, but are not limited to; donor defect hernias, vascular injuries, nerve injuries, deep infection hematoma, iliac wing fracture, chronic pain limiting activity, superficial infection, superficial seromas, minor hematomas, dysesthesia and scar unsightliness (Arrington 1996; Banwart 1995).
Allograft bone (bone harvested from another person) is sometimes used as an alternative to AICBG. Allograft bone has osteoconductive and weak osteoinductive properties. Its level of osteoinductivity depends on its preparation method. However, use of allograft bone is associated with an increased rate of infection, greater resorption rate, varying levels of immune response and longer fusion times compared with autograft bone (Vaccaro 2002). Use of demineralised bone matrix (DBM) is a further alternative to use of iliac crest bone as DBM is made from allograft bone and is a composite of collagen, noncollagenous proteins and growth factors. However, due to its extensive processing, it is the least immunogenic of the types of allograft bone (Vaccaro 2002). The morbidities associated with these alternative interventions, and the limited supply of iliac crest bone, have led to the development of bone graft substitutes.
BMPs induce bone through two pathways. They recruit mesenchymal cells from surrounding muscle, bone marrow or blood vessels and either differentiate these cells into osteoblasts to make bone directly or via cartilage cells which subsequently change into bone cells. BMPs also help in bone matrix production and vascularisation. In vivo, multiple BMPs are expressed during bone healing (Samartzis 2005). BMPs in nonunion fractures are applied to stimulate healing where it has not previously been successful, whereas in acute fractures, BMPs are used to accelerate fracture healing and reduce the frequency of secondary interventions (Termaat 2005). BMP is isolated from bovine bone where complementary DNA encoding human BMP sequences are cloned and expressed in mammalian cells to yield large quantities of highly purified recombinant human BMP. In the operating theatre the BMP‐2 is mixed and added to the carrier collagen sponge, and BMP‐7 to the carrier collagen granules; the process taking about 15 minutes.
From an economic perspective, it is possible that a proportion or all of the direct medical costs of fracture treatment using BMP may be offset by reductions in the subsequent direct medical costs associated with complications and/ or secondary interventions and also by earlier return to productive activity. Use of BMP also has the potential to improve patients' health‐related quality of life and function by avoiding donor site pain and dissatisfaction with donor site appearance associated with alternative treatments that involve bone grafts.
Why it is important to do this review
Given the prevalence of acute and nonunion fractures, it is important to establish the effectiveness associated with use of BMP as an adjunct to, or replacement for, current standard treatments. Given the economic impact of acute and nonunion fractures and their treatment, and the need for economic decisions on the added value of adopting BMP in clinical practice, it is also important to critically evaluate and summarise current evidence on the costs (resource use) and estimated cost‐effectiveness associated with use of BMP as an adjunct to, or replacement for, current standard treatments.
Objectives
1. To assess the incremental effectiveness of BMP for fracture healing in skeletally mature adults, compared to current standard treatments. 2. To critically appraise and summarise current evidence on the (incremental) resource use, costs and cost‐effectiveness of BMP for fracture healing in skeletally mature adults, compared with current standard treatments.
Methods
Criteria for considering studies for this review
Types of studies
Randomised controlled trials (RCTs), full economic evaluation studies (cost‐effectiveness analyses, cost‐utility analyses or cost‐benefit analyses) and partial economic evaluations (cost analyses) comparing use of BMP for fracture healing in skeletally mature adults with one or more current standard treatments. Economic evaluations may include, but are not limited to, those conducted alongside randomised controlled trials meeting inclusion criteria for the review of intervention effectiveness.
Types of participants
Skeletally mature adults, aged 16 and older with bone fractures, either acute or nonunion. Studies including individuals with any stated serious co‐morbidity were excluded.
Types of interventions
BMP versus surgery alone
BMP versus surgery with or without bone graft
BMP and bone substitutes versus surgery and bone substitutes
Types of outcome measures
Primary outcomes
Time to union
Union rate
Secondary outcomes
Secondary procedures (any procedures required after initial surgery, specifically those undertaken to promote healing)
Infection
Hardware failure
Clinical response (average change in pain or functional assessment scores such as Short Musculoskeletal Function Assessment)
-
Operative and hospital stay parameters
Operative time
Operative blood loss
Length of postoperative hospital stay
-
Other patient outcomes
Employment status before and after treatment.
Number and time to return to work (for those patients in employment before treatment)
Donor site appearance (average score/change in donor site appearance)
Heterotopic bone formation
Immunogenicity (antibody response to BMP or bovine collagen)
Any adverse effects
Direct medical resource use
Lost or reduced productivity (time off work)
Other non‐medical costs (e.g. patient out‐of‐pocket expenses)
Unit costs associated with direct medical resource use and/or non‐medical resource use
Total direct medical costs
Total productivity costs (time off work)
Total other non‐medical costs
Incremental cost‐effectiveness, cost‐utility or cost benefit
Search methods for identification of studies
Electronic searches
We searched the Cochrane Bone, Joint and Muscle Trauma Group Specialised Register (24 June 2008); the Cochrane Central Register of Controlled Trials, Database of Abstracts of Reviews of Effects, Health Technology Assessment Database, (The Cochrane Library 2008, Issue 4); MEDLINE (1950 to October 2008); EMBASE (1980 to October 2008); NHS Evidence Health Information Resources (28 October 2008); the NHS Economic Evaluation Database (NHS EED) (1992 to July 2008); the European Network of Health Economic Evaluation Databases (EURONHEED) (2000 to July 2008); HEED: Health Economic Evaluations Database (1992 to July 2008); the Science Citation Index (1945 to October 2008) for RCTs and economic evaluations. We also searched the WHO International Clinical Trials Registry (October 2008) and the National Research Register (NRR) Archive (archived Sept 2007, searched October 2008) for ongoing and unpublished studies. No language, date or publication status restrictions were applied.
In MEDLINE, the subject‐specific search strategy was combined with the first two sections of the optimal MEDLINE search strategy for randomised trials (Higgins 2006), and modified for use in other databases. See Appendix 1 for details of search strategies.
Searching other resources
We handsearched the following journals (chosen after electronic searches identified these as publishing the most number of relevant studies):
Clinical Orthopaedics and Related Research from 1995 to February 2006
Journal of Bone Joint Surgery ‐ American Volume from 1995 to March 2006
The following web‐based sources of health economics grey literature were searched on 30 July 2008 using search strategy keywords to identify further potentially eligible economic evaluations:
Agency for Healthcare Research and Quality
Centre for Evidence‐based Purchasing
Euroscan
New York Academy of Medicine Library Grey Literature Reports
Research Papers in Economics
We searched the World Wide Web using Google and Google Scholar on 30 July 2008 using combinations of subject‐specific search terms (seeAppendix 1) and keywords from specialised health economics search filters (Craig 2007) to identify further potentially eligible economic evaluations.
We reviewed reference lists of RCTs, reviews and economic evaluations identified using electronic searches to identify further potentially eligible RCTs and economic evaluations. We contacted relevant industry sources (Wyeth and Stryker) to identify any unpublished studies. Reasonable attempts were made to contact authors of several included studies to request copies of study reports, missing data, additional information and/or unpublished data.
Data collection and analysis
Selection of studies
Three reviewers (KG, IS and FS) independently screened the titles and abstracts of search results for potentially eligible RCTs and economic evaluations. We also filtered the results of searches using specialised electronic search filters configured to identify potential economic evaluations (Craig 2007). We sought full text reports of potentially eligible studies, and where only abstracts were identified we attempted to contact lead authors. Disagreements regarding inclusion were resolved by discussion. Excluded studies were listed with reasons for exclusion.
Data extraction and management
Data were extracted from included RCTs by one reviewer (KG) and checked by another (FS). The data extraction form for RCTs included:
General information: authors, source, title, publication status, year of publication, country, sponsoring and study objectives.
Participants: inclusion and exclusion criteria, total number and number in intervention groups, age, gender, weight, baseline comparability, drop‐outs and reasons for drop‐outs.
Trial characteristics: design, length of follow‐up, randomisation (method), allocation concealment (method) and blinding of assessors.
Interventions: types, dose, carrier and surgical procedure.
Outcomes: outcomes specified above.
Results: intention‐to‐treat analysis and outcome measures.
Data were collected from included economic evaluations by one reviewer (IS) and checked by another (MM). The data extraction form for economic evaluations (seeAppendix 3) was based on the format and guidelines used to produce structured abstracts of full economic evaluations for inclusion in the NHS Economic Evaluation Database (Craig 2007), adapted to reflect specific design features of this review. Economic evaluations were classified by type, using a classification scheme proposed by Drummond (Drummond 2005) (seeFigure 1), and further classified as either an economic evaluation based on a single study or a model‐based economic evaluation. Where necessary, additional information and/or unpublished data were sought from study authors. Secondary analyses of original data sets utilised in these two economic evaluations were conducted by one reviewer (IS).
Figure 1.

Classification scheme for economic evaluations
Assessment of risk of bias in included studies
Risk of bias of each included trial, including one RCT (Govender 2002) providing clinical data utilised in three included economic evaluations (Alt 2006a;Garrison 2007;Jones 2004), was assessed using The Cochrane Collaboration's 'Risk of bias' assessment tool (Higgins 2008). Assessments were conducted by one reviewer (KG) and checked by another (FS). Risk of bias in the study (or studies) providing clinical data utilised in a fourth included economic evaluation (van Engen 2003) was assessed by one reviewer (IS), again using The Cochrane Collaboration's 'Risk of bias' assessment tool. Items assessed were as the listed quality criteria in the protocol: adequate sequence generation; adequate randomisation concealment; blinding of assessors; comparability of baseline characteristics between groups; explicit inclusion and exclusion criteria; intention‐to‐treat analysis of at least the primary outcome; and adequate reporting of drop‐outs.
Assessment of the overall methodological quality of included economic evaluations based on single, empirical studies was informed by application of a recognised checklist based on guidelines for authors and peer reviewers of economic submissions to the British Medical Journal (Drummond 1996) and against the risk of bias tool. Assessment of the overall methodological quality of model‐based economic evaluations was informed by application of a recognised checklist for quality assessment in economic decision‐analytic models (Phillips 2004). Checklists were completed independently by two reviewers (IS and MM) and disagreements were resolved through discussion. Completed checklists for each included economic evaluation are included in Appendix 4.
Measures of treatment effect
Quantitative data (both dichotomous and continuous) reported in individual trials and economic evaluations are presented in the analyses and tables. Dichotomous data for union rate, secondary procedures and hardware failure are presented as risk ratios together with 95% confidence intervals in the analyses.
Studies with multiple treatment groups
For studies with multiple treatment groups, each treatment group was compared separately to the control group where possible. Where this was not possible, the appropriateness of combining multiple treatment groups was assessed using subgroup analysis and, if necessary, inappropriate groups were excluded from analysis.
Unit of analysis issues
Where there were multiple treatment groups in one study, the control group was proportionately split to each group and compared independently.
Dealing with missing data
When necessary, authors were contacted for missing data. Analysis of primary outcome (union rate) was assessed using intention‐to‐treat analysis with any drop‐outs or missing patients treated as union failures.
Assessment of heterogeneity
Statistical heterogeneity was inspected by use of forest plots, chi‐squared tests (with P value < 0.05 representing heterogeneity) and I² tests (30% to 60% is interpreted to represent moderate heterogeneity; 50% to 90% is interpreted to represent substantial heterogeneity; 75% to 100%: considerable heterogeneity). Where significant levels of statistical heterogeneity were identified, possible sources were explored using a sensitivity analysis which excluded various trials from the analysis.
Assessment of reporting biases
There were insufficient trials available to assess for possible publication bias via funnel plots.
Data synthesis
Acute and nonunion fractures were assessed separately due to different healing characteristics (Termaat 2005). Data were summarised statistically where appropriate, subject to availability of data. For meta‐analyses, risk ratios with 95% confidence intervals were calculated for dichotomous outcomes using the random‐effects model. Continuous outcomes were analysed using mean differences with 95% confidence intervals.
Sensitivity analysis
Sensitivity analyses were performed in the nonunion meta‐analysis by exclusion of studies which included patients with bone defects and the meta‐analysis of acute fracture secondary interventions (where McKee 2002 was excluded as it did not report the number of drop‐outs).
Economics issues
All elements of the economics components of this review were conducted according to current guidance on the use of economics methods in the preparation and maintenance of Cochrane reviews (Shemilt 2008). Part of the rationale for presenting economics components of the review in fine detail, with comprehensive appendices, is to profile full implementation of current economics methods guidance, in order to provide a template for others to adapt to manage economics components of other new or updated Cochrane reviews. Therefore, authors of other Cochrane reviews are not necessarily expected to implement the full range of economics methods used and presented in this review (and indeed, this may not be appropriate or feasible for some reviews).
Results of included economic evaluations are summarised in Appendix 2, supplemented by a narrative summary in the main text. In Appendix 2 and in the narrative summary of results, all costs have been adjusted to 2008 International Dollar values using a web‐based conversion tool that is based on implicit price deflators for GDP and Purchasing Power Parities for GDP (Shemilt 2010). All costs presented in Appendix 3 are expressed in the currency and price year used in each included study. Users of this review wishing to adjust costs to another currency and price year should use costs presented in Appendix 3 and not those presented in Appendix 2 or in the main text of this review. Sensitivity analyses were conducted to assess the effect of fracture severity on estimates of resource use, costs and cost‐effectiveness.
Results
Description of studies
Results of the search
Randomised controlled trials
Electronic searches identified 305 records. Screening of records identified 13 potentially eligible studies, for which corresponding papers were retrieved in full text where possible. Of 13 potentially eligible studies, nine RCTs met inclusion criteria. Searches of reference lists of identified studies and contact with industry identified two further eligible RCTs, bringing the total number of included RCTs to 11.
A search of trial registries identified seven, predominantly industrially‐sponsored, trials. Six are listed as ongoing (see the Characteristics of ongoing studies) and one is completed with details given in the Characteristics of studies awaiting classification). In addition, feedback at editorial review resulted in the identification of another two trials (Aro 2010; US Study Group); details of these are found in the Characteristics of studies awaiting classification.
Economic evaluations
Electronic searches identified 15 records. Screening of records identified 11 potentially eligible studies. Corresponding papers and other reporting formats (e.g. posters) were retrieved in full‐text for 10 potentially eligible studies. The full text of the other potentially eligible study (Perry 1997), reported via a poster, could not be retrieved (reasonable attempts were made to obtain a copy by contacting the lead author). While Perry 1997 provided sufficient data regarding the RCT component of the study to warrant its inclusion, it did not report sufficient information regarding the cost analysis component. Of the 10 potentially eligible studies assessed, four economic evaluations met inclusion criteria. Six studies were ineligible; five (Alt 2006b;Kanakaris 2007;Khan 2004;MAS 2005;WSDLI 2003) because they do not report a full or partial economic evaluation (Drummond 2005; Shemilt 2008), and one (Dahabreh 2007) due to concern regarding selection bias. Two authors of included economic evaluations provided additional information and unpublished data: Volker Alt (Alt 2006a) and Fujian Song (Garrison 2007).
Included studies
Randomised controlled trials
Eleven RCTs involving 976 participants are included in this review. Two studies are published only as abstracts (McKee 2002;Perry 1997) and one is a paper written in Chinese (Chen 2000) (data extracted by FS). Four RCTs involve patients with acute tibial fractures, of which two RCTs include patients with open tibial fractures (Govender 2002;McKee 2002), one with both open and closed tibial fractures (Jones 2006) and one with only closed tibial fractures (Maniscalco 2002). Four RCTs include patients with tibial fracture nonunions (Chen 2000;Cook 1999;Friedlaender 2001;Perry 1997). Two trials include patients with critically sized defects (Calori 2006; Geesink 1999); Calori 2006 also included long‐bone nonunion. The remaining study included patients who had undergone corrective osteotomy for symptomatic radial malunion (Ekrol 2008).
Eight studies used BMP‐7 (Calori 2006;Cook 1999;Ekrol 2008;Friedlaender 2001;Geesink 1999; Maniscalco 2002;McKee 2002;Perry 1997). Two studies used BMP‐2 (Govender 2002;Jones 2006) and one study used BMP and natural non‐organic bone (NNB) (Chen 2000). Various surgical treatments were used for different diagnoses (see the Characteristics of included studies).
Six trials compare treatment with BMP with autograft (Chen 2000; Cook 1999; Ekrol 2008; Friedlaender 2001; Jones 2006; Perry 1997). The remaining trials compare BMP with surgery alone or different controls (see the Characteristics of included studies).
Economic evaluations
Four economic evaluation studies are included in this review. Two studies are published as posters (Jones 2004;van Engen 2003), one is published as part of a UK Health Technology Assessment review (Garrison 2007) and one is published in German language (Alt 2006a) (translated into English language by VA). Two studies are full economic evaluations; one is a cost‐effectiveness analysis (van Engen 2003) and one is a cost‐utility analysis (Garrison 2007). Two studies are partial economic evaluations; both cost analyses (Alt 2006a;Jones 2004). Three studies involve patients with acute open tibial fractures (Alt 2006a;Garrison 2007;Jones 2004) and one study involves patients with nonunion tibial fractures (van Engen 2003); fracture severity is not reported.
Three economic evaluations (Alt 2006a;Garrison 2007;Jones 2004) compare treatment with a 1.5 mg/ml dose of BMP‐2 as an adjunct to intramedullary nail fixation (IM) with routine soft tissue management, versus IM with routine soft tissue management alone. All three studies utilise clinical data collected from the same RCT (Govender 2002) to generate estimates of the impact of the compared treatments on resource use (i.e. resource use associated with complications of treatment and secondary/revision surgical procedures) and associated estimates of costs. Therefore, these three studies cannot be viewed as entirely independent of one another, nor of the results of Govender 2002. By extension, estimates of cost‐effectiveness produced by the cost‐utility analysis (Garrison 2007) are not independent of the results of Govender 2002. The other economic evaluation (van Engen 2003) includes three comparisons: BMP‐7 (dosage not specified) as an adjunct to IM with routine soft tissue management compared with autograft as an adjunct to IM with routine soft tissue management (UK); BMP‐7 (dosage not specified) as an adjunct to IM with routine soft tissue management compared with Ilizarov fixation as an adjunct to IM with routine soft tissue management (UK); BMP‐7 (dosage not specified) as an adjunct to IM compared with routine soft tissue management compared with fixation with a nail or plate and routine soft tissue management, with autograft when appropriate (Germany). The source(s) of the clinical data utilised in this study are unclear.
Two economic evaluations are based on single, empirical clinical studies (Alt 2006a;Jones 2004).Two other economic evaluations are model‐based economic evaluations (Garrison 2007;van Engen 2003). Although the former involves patients with acute open tibial fractures (Garrison 2007) whilst the latter involves patients with nonunion tibial fractures (van Engen 2003), these two studies use essentially similar model structures (seeFigure 2 and Figure 3), based on similar theories of the role of the intervention in addressing the medical condition under evaluation, leading to similar structural assumptions. Specifically, both studies use a simple decision tree structure to compare the costs and clinical consequences of experimental and comparator interventions, based on the theory that the interventions will have a differential impact on complications, secondary/ revisional procedures and the time to and/or rate of fracture healing, and therefore on associated direct medical costs. Differences in model structure between these two studies relate primarily to differences in their specification of complications parameters, choice of comparators and the point of intervention in the treatment pathway (i.e. treatment of acute fractures versus treatment of non‐union fractures).
Figure 2.

Garrison 2007: Basic model structure for the model‐based cost utility analysis
Figure 3.

van Engen 2003: Basic model structure for the model‐based cost‐effectiveness analysis (AE = adverse event)
One economic evaluation (Alt 2006a) adopts the analytic perspective of a public health insurance company in Germany (third party payer) and reports results using 2005 German EUR (€) prices; one (Garrison 2007) adopts a UK health care system perspective and reports results using 2006 UK GBP (£) prices; one (Jones 2004) considers two analytic perspectives ‐ a United States hospital (single provider) and a United States insurer (third‐party payer) ‐ and reports results using 2003 USD ($) prices; and one (van Engen 2003) considers a hospital (single provider) perspective in both the UK and Germany and reports results using 2001 UK GBP (£) or 2001 German EUR (€) prices. The time horizons of costs (and effects, if applicable) adopted in these four studies are one year (Alt 2006a;Garrison 2007), two years (Jones 2004) and unclear (van Engen 2003).
The model‐based cost‐utility analysis was conducted to critically appraise, modify and update an unpublished economic model (Abacus 2006) originally sponsored by Medtronic (a medical technology manufacturer and a distributor of rhBMP‐2), for publication as part of a UK Health Technology Assessment report (Garrison 2007). Two co‐authors of this Cochrane review (FS and IS) had direct involvement in developing the revised economic model (this was undertaken independently of the original model's developers and sponsors, using funds provided by the UK National Coordinating Centre for Health Technology Assessment), and along with others (KG, SD, JR, MM and IH) are also co‐authors of the parallel UK Health Technology Assessment report (Garrison 2007). Two co‐authors of this Cochrane review (VA and SD) had direct involvement in conducting one of the included cost analysis studies (Alt 2006a).
Excluded studies
Of the 10 excluded studies, five studies were found not to present a full or partial economic evaluation, one study (Alt 2009) was a revised economic analysis that was judged as unlikely to affect the conclusions of this review and one study (Dahabreh 2007) had compromised methodology. One study (Bilic 2006) was excluded because it included patients younger than 16 years old and another study (Xiao 2007) because it included patients with a serious co‐morbidity, in this case osteoporosis. The final excluded study was a commentary on multi‐centre randomised trials. See the Characteristics of excluded studies for further details.
Risk of bias in included studies
Randomised controlled trials
Although all studies stated they were randomised controlled trials, only Govender 2002 reported the method of randomisation (seeFigure 4 and Figure 5). Based on the randomisation method using a central 24‐hour automated system, the allocation method was deemed acceptable as well. None of the remaining studies reported the allocation method used. Five studies reported that they used at least one independent blinded assessor to read radiographs to determine fracture healing. Six trials did not report adequate details of the inclusion and exclusion criteria used to select patients. Three trials did not use the intention‐to‐treat principle to analyse the final data; however, for the majority of the trials it was unclear whether this principle was used. McKee 2002 did not report the fracture healing rate.
Figure 4.

Methodological quality summary: review authors' judgements about each methodological quality item for each included study.
The review of economics studies based on RCTs has led us to question data presented in at least one of the RCT reports (Govender 2002).
Figure 5.

Methodological quality graph: review authors' judgements about each methodological quality item presented as percentages across all included studies.
The review of economics studies based on RCTs has led us to question data presented in at least one of the RCT reports (Govender 2002).
Economic evaluations
Completed checklists for each included economic evaluation are included in Appendix 4.
The reliability of any full economic evaluation is in part predicated on its use of reliable clinical data, including data on beneficial and adverse effects, complications and secondary interventions (Shemilt 2008). Risk of bias in studies generating clinical data utilised in the two included full economic evaluations (Garrison 2007;van Engen 2003) was therefore assessed using The Cochrane Collaboration's 'Risk of bias' assessment tool. The model‐based cost‐utility analysis (Garrison 2007) utilises clinical data collected exclusively from Govender 2002. However, Govender 2002 includes two BMP intervention groups, with patients receiving a 0.75 mg/mL or 1.5 mg/mL dose of BMP‐2 respectively, and a control group receiving standard care, whilst the model‐based cost‐utility analysis (Garrison 2007) utilises effects data from the intervention group receiving a 1.5 mg/mL dose of BMP‐2 and the control group only (i.e. it excludes the intervention group receiving a 0.75 mg/mL dose of BMP‐2). This decision is attributable to the principal finding of Govender 2002, which suggests that only use of a 1.5 mg/mL dose of BMP‐2 (and not a 0.75 mg/mL dose) demonstrates clinical efficacy, compared with standard care. All aspects of risk of bias in the studies (or study) generating clinical data utilised in the model‐based cost‐effectiveness analysis (van Engen 2003) are unclear, since the source(s) of these data are not reported; the authors state only that "Data on efficacy [of BMP‐7] were obtained from clinical trials and literature".
The overall methodological quality of the two included partial economic evaluations, both cost‐analyses (Alt 2006a;Jones 2004), is reasonable. However, neither cost analysis reports quantities of resource use separately from their unit costs, nor do they report measures of variance or 95% CIs for estimates of mean costs. In the cost analysis in Alt 2006a, these two methodological limitations are attributable to the authors' decision to use randomisation group‐level data in their analysis to estimate mean cost differences between the intervention and control groups. Both of these limitations were overcome by conducting a secondary analysis of individual patient‐level data obtained from Alt 2006a for this review (conducted by IS). Other limitations of the cost analysis reported by Alt 2006a are that: no sensitivity analysis is reported; calculation of direct medical costs does not include the costs of outpatient visits and physical therapy; the analysis assumes that the day of fracture healing corresponds to the day of resumption of work and that all patients were in paid employment before their fracture. Other limitations of the cost analysis reported by Jones 2004 are that: a limited (univariate) sensitivity analysis, including only one variable (% of rhBMP‐2 price reimbursed by payers), is reported; no discounting of costs is reported despite the study's two‐year time horizon; the authors do not acknowledge or address potential variations in treatment costs between patients with acute open tibial fractures of different severities. Like the model‐based cost‐utility analysis (Garrison 2007), both included cost analyses base their estimates of resource use on clinical data collected from the same, single multi‐centre RCT (Govender 2002), but utilise clinical data relating to the intervention group receiving a 1.5 mg/mL dose of BMP‐2 and the control group only (i.e. they do not utilise clinical data relating to the intervention group receiving 0.75 mg/mL dose of BMP‐2). This decision is again attributable to the principal finding of Govender 2002, which suggests that only use of a 1.5 mg/mL dose of BMP‐2 (and not a 0.75 mg/mL dose) demonstrates clinical efficacy, compared with standard care.
The overall methodological quality of the model‐based cost‐utility analysis (Garrison 2007) is good. However, several methodological limitations are worthy of note. First, the authors do not report quantities of resource use separately from their unit costs (quantities of resource use reported in this review are obtained from unpublished data supplied by the study authors). Second, the authors appear to have reported their results selectively in the original study report. Specifically, in the original study report, incremental cost per QALY is reported for all open fracture patients and for patients with Gustilo‐Anderson grade III fractures (i.e. IIIA, IIIB, and IIIC combined), but not separately for patients with Gustilo‐Anderson grade IIIA, IIIB, and IIIC fractures respectively, nor for patients with Gustilo‐Anderson grade II fractures or patients with Gustilo‐Anderson grade I fractures. The same selective reporting of results is found in the original study report with respect to direct medical costs. Third, as discussed by the authors, the analysis is limited by a lack of objective empirical data on health state utility values associated with open tibial fractures. Disutility values used in the analysis are extrapolated from estimates for older women with hip fractures and women with long‐standing vertebral osteoporotic fractures. Whilst the authors attempt to overcome this limitation by assuming disutility values to be 30% smaller than those used in the original industry‐sponsored model on which the study is based, they acknowledge this assumption to be arbitrary. Finally, it is debatable whether use of a time dependent model structure may capture differential utility gain more accurately than the decision tree model structure used in the analysis.
The overall methodological quality of the model‐based cost‐effectiveness analysis (van Engen 2003) is difficult to assess, due to the lack of detail in the report. Several specific methodological and reporting limitations are worthy of note. Estimates of resource use used in the model are based on expert opinion, which may be considered a low quality source of evidence to inform resource use parameters (Cooper 2005). The report does not include any assessment of the quality of data identified for use in the economic model and data modelling methodology is not described in sufficient detail to allow judgement of whether the methods used are based on justifiable statistical and epidemiological techniques. The time horizon of the analysis is not reported. Measures of variance are not reported for mean resource use or cost values and 95% CIs are not reported with respect to estimates of cost‐effectiveness. Incremental analysis is not reported with respect to costs or cost‐effectiveness. The authors do not acknowledge or address potential variations in treatment costs and effects between patients with nonunion tibial fractures of different severities. Whilst the authors state that sensitivity analysis has been performed, with sensitive parameters reported, the methods and results of sensitivity analysis are not reported systematically. In particular it is unclear whether uncertainty is evaluated in all parameters, or in only a few key parameters, and what methods or assumptions are used to determine the ranges over which variables are tested. Finally, it is debatable whether an alternative Markov model structure could have been considered in preference to the decision tree model structure used, to enable modelling of cost‐effectiveness over more than one treatment cycle.
Full model‐based economic evaluations should ideally consider all feasible and practical treatment options that may be used in the study setting (Phillips 2004). In principle it is feasible that other available BMP products could have been included as treatment options in the two model‐based full economic evaluations (Garrison 2007;van Engen 2003).
The quality of the included economic studies requires assessment with vastly different parameters to effectiveness studies. However, the economic evaluations are included as primary studies and therefore appear in the Cochrane risk of bias analyses, but their inclusion in 'Risk of bias' tables is not appropriate due to their use of data from included RCTs. Therefore, this has affected the overall 'Risk of bias' figures (Figure 4 and Figure 5).
Effects of interventions
Primary outcomes
1. Time to union
Five RCTs report data for the time to healing (Calori 2006;Ekrol 2008;Govender 2002;Jones 2006;Maniscalco 2002). However, due to differences in reporting the results could not be pooled (Table 2). Apart from Ekrol 2008, the trials report comparable times to healing between the BMP and control groups. Ekrol 2008 reports significantly faster healing in both control groups using external or internal fixation (P = 0.05 and P = 0.019 respectively). Govender 2002 reports significantly faster healing in the 1.5 mg/mL BMP group (median 145 days) than in the control group (median 184 days).
Table 1.
Time to fracture healing
| Study | Intervention Group | Time to Healing |
| Acute fractures | ||
| Alt 2006a* | BMP | Median 149 days Mean 191 days (95% CI 64 to 375) |
| Control | Median 197 days Mean 224 days (95% CI 56 to 365) | |
| Garrison 2007 | BMP | Gustilo‐Anderson grade IIIC: Mean 33 weeks (95% CI 16 to 49) |
| Gustilo‐Anderson grade IIIB: Mean 33 weeks (95% CI 16 to 49) | ||
| Gustilo‐Anderson grade IIIA: Mean 31 weeks (95% CI 15 to 46) | ||
| Gustilo‐Anderson grade II: Mean 21 weeks (95% CI 11 to 32) | ||
| Gustilo‐Anderson grade I: Mean 26 weeks (95% CI 14 to 41) | ||
| Control | Gustilo‐Anderson grade IIIC: Mean 44 weeks (95% CI 22 to 66) | |
| Gustilo‐Anderson grade IIIB: Mean 44 weeks (95% CI 22 to 66) | ||
| Gustilo‐Anderson grade IIIA: Mean 36 weeks (95% CI 18 to 53) | ||
| Gustilo‐Anderson grade II: Mean 27weeks (95% CI 13 to 40) | ||
| Gustilo‐Anderson grade I: Mean 30 weeks (95% CI 15 to 45) | ||
| Govender 2002 | 0.75 mg/mL BMP | Median 184 days |
| 1.50 mg/mL BMP | Median 145 days | |
| Control | Median 184 days | |
| Jones 2006 | BMP | Median 184 days (95% CI 124 to 295 ) |
| Control | Median 176 days (95% CI 127 to 263 ) | |
| Maniscalco 2002 | BMP | Mean 135 days (range 120 to 165 ) |
| Control | Mean 131 days (range 124 to 164 ) | |
| Nonunion or critical defect | ||
| Calori 2006 | BMP | Mean 8 ± 0.43 months |
| Control | Mean 9 ± 0.49 months | |
| Corrective osteotomy for malunion | ||
| Ekrol 2008 | BMP ‐ external fixation | Mean 13 weeks (range 8 to 18) |
| BMP ‐ internal fixation | Mean 18 weeks (range 4 to 46) | |
| Control ‐ external fixation | Mean 7 weeks (range 4 to 12) | |
| Control ‐ internal fixation | Mean 7 weeks (range 4 to 13) | |
BMP: bone morphogenetic protein CI: confidence interval * : based on secondary analysis of unpublished individual‐level data
The cost analysis conducted by Alt 2006a utilises data on time to healing collected from Govender 2002. However, the median time to fracture healing in the control group reported in this cost analysis (197 days) is longer than the median time to fracture healing in the control group as reported in Govender 2002 (184 days). This apparent discrepancy is explained by the different purposes of these two studies. Govender 2002 has a clinical focus and therefore aims to measure the biologic effect of BMP on time to fracture healing, thus excluding those patients who received a secondary intervention due to a technical failure of the implant. The Alt 2006a cost analysis has a health economics focus and therefore aims to measure the impact of time to fracture healing on productivity losses due to patients' time off work, thus including those patients regardless of whether or not they received a secondary intervention. The model‐based cost‐utility analysis (Garrison 2007) also utilises data on time to healing as reported in Govender 2002, expressed in mean weeks. The cost‐utility analysis reports faster healing time in the 1.5 mg/mL BMP group (mean 26.64 weeks) than in the control group (mean 31.99 weeks).
2. Union rate
Seven of the 11 RCTs report a definition of successful fracture union, of which all include the parameter of bridging bone seen on a certain number of radiographic views (Cook 1999;Ekrol 2008;Friedlaender 2001;Geesink 1999; Govender 2002;Jones 2006;Maniscalco 2002). Three RCTs also include clinical outcomes in their definition of union (Govender 2002;Jones 2006;Maniscalco 2002).
The rate of fracture healing is reported by all RCTs apart from McKee 2002 (Table 3; Table 4). RCTs were grouped as either acute or nonunion fractures for meta‐analysis apart from Ekrol 2008 which was considered to be neither and thus is analysed separately. The two studies with defects were included in the nonunion group (Calori 2006;Geesink 1999).
Table 2.
Acute fractures healed at study endpoint
| Study | BMP group | Control group |
| Govender 2002 0.75 mg/mL | 75/145 (52%) | 33/73 (45%) |
| Govender 2002 1.50 mg/mL | 92/145 (63%) | 33/74 (45%) |
| Jones 2006 | 13/15 (87%) | 10/15 (67%) |
| Maniscalco 2002 | 7/7 (100%) | 7/7 (100%) |
Table 3.
Nonunion fractures healed at study endpoint
| Study | BMP group | Control group |
| Calori 2006 | 15/16 (94%) | 8/13 (62%) |
| Chen 2000 | 30/30 (100%) | 20/20 (100%) |
| Cook 1999 | 12/14 (86%) | 15/16 (94%) |
| Friedlaender 2001 | 39/63 (62%) | 45/61 (74%) |
| Geesink 1999 | 5/6 (83%) | 4/6 (67%) |
| Perry 1997 | 19/20 (95%) | 17/21 (81%) |
Applying the random‐effects model, the risk ratio for achieving union without secondary procedure for acute fractures is 1.19 (95% CI 0.99 to 1.43) (Figure 6). Over half the weight comes from the Govender 2002. In this trial, the 0.75 mg/mL and 1.5 mg/mL concentrations of BMP were each compared to half of the control group. The results suggest, but do not confirm a dose dependent effect. There is moderate heterogeneity between the studies (I² = 32%). In Govender 2002, the 1.50 mg/mL BMP group has significantly more younger patients than both the 0.75 mg/mL and control groups, as well as significantly more patients who received reamed nailing (reamed nailing is where the inside of the bone is drilled out and then the nail inserted). Reamed bone produces bone 'dust', which is a form of bone graft, and may help healing (unreamed nails are just pushed into the bone) (Govender 2002).
Figure 6.

Forest plot of comparison: BMP versus bone graft substitutes, outcome: 1.1 Participants with tibial fracture attaining union without secondary procedure
For nonunions subsequent to long bone fractures, the pooled RR for attaining union is 1.02 (95% CI 0.90 to 1.15) (Figure 7). There is moderate heterogeneity (I² = 39%). This heterogeneity persists on the exclusion of the study available only as an abstract (Perry 1997); and for the two studies including patients with defects (Calori 2006; Geesink 1999).
Figure 7.

Forest plot of comparison: BMP versus bone graft substitutes, outcome: 1.2 Participants with prior nonunion of the long bones attaining union
For patients treated with corrective osteotomy for radial malunions, there was no significant difference in the union rate without secondary procedures between BMP and control groups, RR 0.76 (95% CI 0.53 to 1.09) (Figure 8).
Figure 8.

Forest plot of comparison: BMP versus bone graft substitutes, outcome: 1.3 Participants attaining union without secondary intervention after osteotomy for radial malunion
Three economic evaluations including patients with acute open tibial fractures (Alt 2006a;Garrison 2007;Jones 2004) utilise clinical data on union rate collected from Govender 2002. The source of clinical data on union rate utilised in the economic evaluation including patients with nonunion tibial fractures (van Engen 2003) is unclear (this study reports a lower union rate amongst patients receiving BMP (81%) compared with patients receiving autograft (85%)).
Secondary outcomes
With the exception of the outcome 'secondary procedures', which is presented in the Analyses, results from individual studies for secondary outcomes are presented in Appendix 2.
1. Secondary procedures
Fewer patients with acute fractures who received BMP underwent secondary procedures according to three RCTs (Govender 2002;Jones 2006;McKee 2002): RR 0.65 (95% CI 0.50 to 0.83) (Figure 9). McKee 2002 does not report the number of dropouts and therefore intention‐to‐treat data could not be calculated. Upon excluding this study from the analysis the result is still significant (P = 0.005). The different BMP dose groups were again separately compared to half of the control group in Govender 2002. Again, the results for the higher dose of 1.5 mg/mL were more favourable than those for the 0.75 mg/mL dose, but a test for interaction does not confirm this to be statistically significant.
Figure 9.

Forest plot of comparison: BMP versus bone graft substitutes, outcome: 1.4 Acute fracture: participants requiring secondary procedure to attain union
Two studies in the prior nonunion group found no statistically significant difference between the two groups in the number of secondary interventions (RR 0.41, 95% CI 0.13 to 1.28) (Figure 10). Ekrol 2008 found no difference between the two groups in the number of participants requiring secondary procedure to attain union after corrective osteotomy (Analysis 1.6).
Figure 10.

Forest plot of comparison: BMP versus bone graft substitutes, outcome: 1.5 Participants with nonunion of the tibia or other long bone requiring secondary procedure to attain union
Analysis 1.6.

Comparison 1 BMP versus control (usually surgery alone) or bone graft, Outcome 6 Post corrective osteotomy for radial malunion: participants requiring secondary procedure to attain union.
2. Infection
Five RCTs report patients developing infections (Cook 1999;Ekrol 2008;Friedlaender 2001;Govender 2002;Jones 2006). Two BMP/autograft group patients and one control group patient developed deep infection requiring surgical intervention in Jones 2006. In Cook 1999, one autograft patient developed an infection and failed to heal. Four patients in the external fixation group of the Ekrol 2008 (three in autograft group and one in BMP‐7 group) had superficial pin track infections which cleared with antibiotics. Friedlaender 2001 reported two patients who received OP‐1 and 13 control patients with osteomyelitis of the lower leg, and 14 OP‐1 and 12 control patients with postoperative infection. Twelve (15%) 0.75 mg/mL BMP‐2, 15 (21%) 1.50 mg/mL BMP‐2 and 13 (15%) of control patients with Gustilo‐Anderson types I and II had fracture site infections in Govender 2002. Also in Govender 2002, 19 (29%) 0.75 mg/mL BMP‐2, 15 (24%) 1.50 mg/mL BMP‐2 and 26 (44%) of control patients with Gustilo‐Anderson types IIIA and IIIB had fracture site infection.
It was possible to collect data on numbers and rates of patients developing infections from two economic evaluations of acute fractures (Alt 2006a;Garrison 2007). These data are reported in Appendix 2 (and Appendix 3) but it should be noted they are derived from Govender 2002. Overall infection rates reported in these two economic evaluations are broadly comparable with those reported in Govender 2002. However, it is noted that the authors apply setting‐specific classifications of infection severity in order to enable estimation of the costs of infections based on unit costs applicable to the respective study settings (i.e. setting‐specific unit costs vary by infection severity ‐ seeAppendix 2).
3. Hardware failure
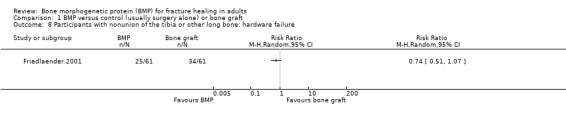
Of the two acute tibia fractures studies that reported hardware failures, there were significantly fewer failures in the BMP groups than the controls (RR 0.64, 95% CI 0.42 to 0.96) (Figure 11). In Jones 2006, two control patients required dynamization of the intramedullary nail due to screw breakage but went on to heal (Jones 2006). The main cause of hardware failure in Govender 2002 was either screw breakage or bending. Notably, there were significantly fewer failures in the 1.5 mg/mL BMP‐2 group (16/145) versus the control group (32/147), P = 0.02. In Friedlaender 2001, 25/61 BMP‐7 patients and 34/61 autograft patients are reported to have had a 'mechanical complication of the internal orthopaedic device' (Analysis 1.8); however, details of the complications are not given. In Ekrol 2008, 10 of the 20 patients receiving internal fixation with a dorsal pi‐plate experienced plate irritation, requiring surgery and plate removal in three BMP‐7 patients and seven bone graft patients.
Figure 11.

Forest plot of comparison: BMP versus bone graft substitutes, outcome: 1.7 Acute fracture: participants with hardware failure
Analysis 1.8.
Comparison 1 BMP versus control (usually surgery alone) or bone graft, Outcome 8 Participants with nonunion of the tibia or other long bone: hardware failure.
In the van Engen 2003 cost‐effectiveness analysis, rates of hardware events are reported as 41% in the BMP‐7 treatment group, 56% in the autograft group and 20% in the Ilizarov fixation group. However, the source(s) of these data are not reported.
4. Clinical response (average change in pain or functional assessment scores such as Short Musculoskeletal Function Assessment)
The severity of pain in patients from both groups is reported by Cook 1999, with one patient experiencing pain when weight bearing, eight with mild pain and 18 with no reported pain. In Ekrol 2008, no significant changes are found in the number of patients experiencing pain from before surgery to the study endpoint in any group. Friedlaender 2001 reports no significant difference in the number of patients experiencing pain at multiple sites in the BMP‐7 group (8/61) compared with the control group (9/61). A significant difference in the pain outcome is found in Govender 2002 between the results for the higher dose 1.5 mg/mL BMP‐2 dose group compared with the control group (P = 0.03). Geesink 1999 reports three patients in the BMP‐7 intervention group experiencing pain, of which two were assessed as mild and one as moderate.
Some data on functional outcomes are reported by six studies (Chen 2000;Cook 1999;Ekrol 2008;Friedlaender 2001;Jones 2006;McKee 2002). Ekrol 2008 report no significant difference in the functional outcomes assessed between the BMP and control groups receiving either internal or external fixation. Both the BMP/autograft group and control group in Jones 2006 show similar improvement in Short Musculoskeletal Function Assessment scores from baseline to the study endpoint. The difference in the number of patients fully weight bearing in McKee 2002 is not significant (reported P = 0.11). Neither is the difference between the treatment groups' respective function scores assessed in Chen 2000. The total number of weight bearing patients in both treatment groups is reported by Cook 1999. There is no significant difference between the two groups in the number of patients fully weight bearing without pain in Friedlaender 2001 (reported P = 0.52).
5. Operative and hospital stay parameters
Operative time
Two RCTs reporting data on operative time found comparable times between treatment groups (Friedlaender 2001; Jones 2006).
One economic evaluation involving patients with nonunion fractures reports data on operative time (van Engen 2003). In the UK, operative time is comparable between the BMP‐7 and autograft groups (90 minutes and 81 minutes), whilst operative time is considerably longer for the Ilizarov fixation group (212 minutes). In Germany, operative time is shorter for the BMP‐7 group compared to the usual care group (47.6 minutes and 77.6 minutes) (usual care consists of fixation with a nail or plate as an adjunct to IM with routine soft tissue management, with autograft if appropriate). The authors state that these data are country‐specific estimates based on the expert opinions of two panels of seven practising orthopaedic surgeons from the UK and seven traumatologists from Germany, collected using a modified Delphi method administered by telephone interviews.
Operative blood loss
Two RCTs report data on operative blood loss (Friedlaender 2001;Jones 2006). In both studies, operative blood loss is significantly lower in the intervention group compared with control: P = 0.05 reported by Friedlaender 2001; and P = 0.01 reported by Jones 2006.
Length of postoperative hospital stay
Two RCTs reporting data on length of postoperative hospital stay found comparable results between treatment groups (Friedlaender 2001;Maniscalco 2002).
One economic evaluation involving patients with nonunion fractures reports data on length of postoperative hospital stay (van Engen 2003). In the UK, length of postoperative hospital stay is comparable between the BMP‐7 group and the autograft group (6.0 days and 6.5 days), whilst length of postoperative hospital stay is considerably longer for the Ilizarov fixation group (13.0 days). In Germany, length of postoperative hospital stay is comparable between the BMP‐7 group and the usual care group (12.9 days and 13.0 days). The authors state that these data are country‐specific estimates based on the expert opinions of two panels of seven practising orthopaedic surgeons from the UK and seven traumatologists from Germany, collected using a modified Delphi method administered by telephone interviews.
6. Other patient outcomes
No RCTs report data on the patients' employment status before or after treatment, numbers of patients returning to work following treatment, or the time to return to work (duration of time off work).
The cost analysis conducted by Alt 2006a includes arbitrary assumptions regarding patients' employment status before and after treatment: that all patients had been in paid employment before treatment and resume work after treatment, and that the day of resumption of work corresponds to the day of fracture healing.
7. Donor site appearance (average score/change in donor site appearance)
Data on donor site appearance are not reported in any included studies.
8. Heterotopic bone formation
Two RCTs report data on heterotopic bone formation (Jones 2006;Maniscalco 2002). Jones 2006 reports one patient in the BMP/autograft group had heterotopic bone formation of a solid tibiofibular synostosis. This was found at 7.5 months postoperatively but did not require removal. One BMP group participant in Maniscalco 2002 had calcification of the tibiofibular ligament .
9. Immunogenicity (antibody response to BMP or bovine collagen)
Four RCTs report responses to antibody testing (Friedlaender 2001;Geesink 1999;Govender 2002;Jones 2006). Govender 2002 finds no association between the presence of BMP‐2 antibodies and clinical outcomes, nor evidence of related adverse events. Likewise, no relationship is found when antibodies to type‐1 bovine collagen are present. No antibodies developed to BMP‐2 are found in patients in Jones 2006. However, one patient in the BMP‐2/allograft group and four patients in the control group are found to have had antibodies to bovine type‐1 collagen. In both Govender 2002 and Jones 2006, no subsequent antibodies to human type‐1 collagen are found in patients with antibodies to bovine type‐1 collagen. Transient levels of BMP‐7 antibodies are detected in 10% of patients in the BMP‐7 group in Friedlaender 2001. Geesink 1999 report no antibodies to BMP‐7 and two responses to collagen with no subsequent clinical effect.
10. Any adverse effects
Three RCTs report additional adverse events not covered by previous outcomes (Ekrol 2008;Friedlaender 2001;Jones 2006). These are reported in Appendix 2.
11. Direct medical resource use
Three economic evaluations, all involving patients with acute open tibial fractures, report the dosage of BMP‐2 used as 1.5 mg/mL per patient (Alt 2006a;Garrison 2007;Jones 2004).
One economic evaluation involving patients with nonunion fractures reports data on operative time and length of postoperative hospital stay (van Engen 2003), as summarised under section 5. 'Operative and hospital stay parameters' above. In two economic evaluations involving patients with acute open tibial fractures (Alt 2006a;Garrison 2007), direct medical resource use associated with operative time and length of postoperative hospital stay are not measured directly, but measures of the costs of these resources are incorporated into the unit costs of primary and secondary surgical procedures.
All other measures of direct medical resource use included in the three economic evaluations involving patients with acute open tibial fractures (Alt 2006a; Garrison 2007; Jones 2004) relate to primary and secondary surgical procedures. Extracted data on the numbers of patients undergoing secondary/revision procedures and/or surgical treatment for complications and/or post‐traumatic and postoperative infections in each treatment group (by fracture severity grade, where available) are included in Appendix 3. Overall, these data concur with the results of Analysis 1.4, which provide some evidence to suggest that fewer acute tibial fracture patients receiving BMP undergo secondary procedures, compared with control group patients. This agreement is not surprising, given that all three economic evaluations involving patients with acute open tibial fractures utilise clinical data collected from Govender 2002.
Analysis 1.4.

Comparison 1 BMP versus control (usually surgery alone) or bone graft, Outcome 4 Acute fracture: participants requiring secondary procedure to attain union.
12. Lost or reduced productivity (time off work)
One economic evaluation, the cost analysis by Alt 2006a, includes time off work incurred by acute open tibial fracture patients following treatment. These results are predicated on arbitrary assumptions made by the study authors that all patients had been in paid employment before treatment and resume work after treatment, and that the day of resumption of work corresponds to the day of fracture healing. A secondary analysis of individual patient‐level data collected from this study (conducted by IS) indicates that, on average (mean), patients receiving BMP‐2 incur 32.4 fewer days off work compared with patients receiving current standard treatment (mean ‐32.4 days per patient (favours intervention), SD = 101.5, 95% CI ‐55.8 to ‐8.9). The difference in time off work between BMP and control patients is largest amongst patients with the most severe (Gustilo‐Anderson grade III B) open tibial fractures (mean ‐44.9 days per patient (favours intervention), SD = 101.5, 95% CI ‐81.1 to ‐8.7), and in general this difference decreases as fracture severity decreases (seeAppendix 3).
13. Other non‐medical costs (e.g. patient out‐of‐pocket expenses)
No included studies report other non‐medical costs.
14. Unit costs associated with direct medical resource use and/or non‐medical resource use
Three economic evaluations involving patients with acute open tibial fractures report the unit cost of a 1.5 mg/mL dose of BMP‐2 (Alt 2006a;Garrison 2007;Jones 2004). The unit cost of a 1.5 mg/mL dose of BMP‐2 is, respectively, $3512 (Alt 2006a), $2903 (Garrison 2007) and $5639 (Jones 2004) (2008 International Dollar prices). These data indicate variation in the acquisition cost of BMP‐2 between countries (Germany, UK and USA respectively). One economic evaluation involving patients with nonunion tibial fractures reports unit costs per patient of unspecified doses of BMP‐7 (van Engen 2003). The unit cost is $5679 per patient in the UK and $5561 per patient in Germany (2008 International Dollar prices).
One economic evaluation (Alt 2006a) reports a unit cost for the average daily sickness payment paid by German public health insurance companies (including fringe benefits that have to be covered) to employed patients absent from work due to incapacity. This is $56.59 (2008 International Dollar prices).
Other unit costs associated with direct medical resource use and non‐medical resource use are tabulated, by study, in Appendix 3. Unit costs applicable to specific items of resource use cannot be compared between studies (other than the unit cost of BMP‐2) due to between‐study differences in the detailed costing methods used.
15. Total direct medical costs
Data on average (mean) total direct medical costs are available from all three economic evaluations involving patients with acute open tibial fractures (Alt 2006a; Garrison 2007; Jones 2004). Based on a secondary analysis of individual patient‐level data collected from the Alt 2006a cost‐analysis, which adopts a German public health insurance (third party payer) perspective, incremental average (mean) one‐year total direct medical costs for all acute open tibial fracture patients (Gustilo‐Anderson grades I, II, IIA and IIIB combined) are $2785 per patient (favours control, SD = 3697, 95% CI 1932 to 3638; 2008 International Dollar prices) (Alt 2006a). In the cost‐utility analysis by Garrison 2007, which is conducted from a UK health care system perspective, incremental average (mean) one‐year total direct medical costs for all acute open tibial fracture patients (Gustilo‐Anderson grades I, II, IIA, IIIB and IIIC combined) are $1710 per patient (favours control), SD = 451, 95% CI 737 to 2475; 2008 International Dollar prices). In the cost analysis conducted by Jones 2004, incremental average (mean) two‐year undiscounted total direct medical costs for all acute open tibial fracture patients (Gustilo‐Anderson grades I, II, IIA and IIIB combined) are $5069 per patient from a US hospital (single provider) perspective (favours control; 2008 International Dollar prices; measure of variance and 95% CI are not reported) and $‐4009 per patient from an insurer (third party payer) perspective (favours intervention; 2008 International Dollar prices; measure of variance and 95% CI are not reported).
Data on average (mean) total direct medical costs by fracture severity grade (Gustilo‐Anderson grade) are available from two economic evaluations involving patients with acute open tibial fractures (Alt 2006a; Garrison 2007). These data are reported, by study, (in the original currency and price year reported in each study) in Appendix 3. These data indicate that, whilst the direct medical costs associated with BMP‐2 treatment consistently exceed those associated with autograft regardless of fracture severity, there is an overall trend that the magnitude of the difference decreases as fracture severity increases.
Data on average (mean) total direct medical costs are also reported in the cost‐effectiveness involving patients with nonunion open tibial fractures, conducted from a hospital (single provider) perspective (van Engen 2003). In the UK, incremental average (mean) one‐year total direct medical costs for all nonunion fracture patients are $‐532 per patient when comparing BMP‐7 treatment with autograft and $‐1714 per patient when comparing BMP‐7 treatment with Ilizarov fixation (favours intervention in both cases; 2008 International Dollar prices; measures of variance and 95% CIs not reported). In Germany, incremental average (mean) one‐year total direct medical costs for all nonunion fracture patients are $1021 per patient when comparing BMP‐7 treatment with current standard treatment (favours control); 2008 International Dollar prices; measure of variance and 95% CI not reported).
16. Total productivity costs (time off work)
One economic evaluation, the cost analysis by Alt 2006a, includes productivity costs incurred by a public health insurance company (third party payer) as a result of sickness payments paid to patients. The authors assume that health insurers provide sickness payments after absence from work of six weeks duration (with payments during the initial period up to six weeks covered by the employer). This reflects current practice in Germany. Based on a secondary analysis of individual patient‐level data collected from this cost‐analysis (conducted by IS), incremental average (mean) productivity costs for all acute open tibial fracture patients (Gustilo‐Anderson grades I, II, IIA and IIIB combined) are $‐1831 per patient (favours intervention), SD = 5746, 95% CI ‐3157 to 505; 2008 International Dollar prices) (Alt 2006a).
17. Total other non‐medical costs
No included studies report other non‐medical costs.
18. Incremental cost‐effectiveness, cost‐utility and/or cost benefit
Incremental cost per QALY results are available from one full economic evaluation: the cost‐utility analysis involving patients with acute open tibial fractures (Garrison 2007). Incremental cost per QALY for all patients with acute open tibial fractures (Gustilo‐Anderson grades I, II, IIIA, IIIB and IIIC) is $32,603 per QALY (95% CI 22842 to 99346; 2008 International Dollar prices). Unpublished data collected from this study show marked incremental cost per QALY differences between acute open tibial fractures of different severities, ranging from $10,004 per QALY for Gustilo‐Anderson grade IIIC fractures (95% CI ‐14,267 to 43,945; 2008 International Dollar prices) to $650,007 per QALY for Gustilo‐Anderson grade I fractures (95% CI 315,948 to 1,323,265; 2008 International Dollar prices). A probabilistic sensitivity analysis conducted by the authors shows that cost per QALY results are sensitive to the price of BMP‐2.
Incremental cost‐effectiveness ratios are available from one full economic evaluation: the cost‐effectiveness analysis involving patients with nonunion tibial fractures conducted by van Engen 2003. In the UK, the incremental cost per healed fracture is $321 per patient when comparing BMP‐7 treatment with autograft and $1160 per patient when comparing BMP‐7 treatment with Ilizarov fixation (favours control; 2008 International Dollar prices; 95% CIs not reported). In Germany, incremental cost per healed fracture is $2314 per patient when comparing BMP‐7 treatment with current standard treatment (favours control); 2008 International Dollar prices; 95% CI not reported).
Discussion
In this review, we have systematically reviewed the available evidence from both randomised controlled trials and economic evaluations evaluating the effectiveness and cost‐effectiveness of bone morphogenetic protein (BMP) for treating acute fractures or fracture nonunion.
Summary of main results
Eleven randomised controlled trials, involving 976 participants, and four economic evaluations, three of which focused on the same trial, are included. Most trials were sponsored and funded by industry.
Randomised controlled trials
Four RCTs involved patients with acute tibial fractures, of which the two larger RCTs included patients with open tibial fractures fixed using intramedullary nailing (Govender 2002;McKee 2002). Four RCTs included patients with tibial fracture nonunions, two trials included patients with critically sized defects, one of which also included long‐bone nonunion. The remaining small study included patients who had undergone corrective osteotomy for symptomatic radial malunion (Ekrol 2008).
Apart from Ekrol 2008, the times to fracture healing were comparable between the BMP and control groups. There are very limited data on the effectiveness of BMP in closed acute fractures.
There is some evidence for increased healing rates, without requiring a secondary procedure, of BMP compared with usual care control in acute, mainly open, tibial fractures (RR 1.19, 95% CI 0.99 to 1.43). Most of the evidence was from one large trial (Govender 2002), of 450 participants, which found increased healing rates of a higher dose of 1.5 mg/mL BMP‐2 compared with a 0.75 mg/mL dose. However, this trial had important confounding resulting from the imbalance in the age of participants (these were younger in the two BMP groups) and that significantly more patients received reamed intramedullary nailing in the higher dose group. To a lesser extent these reservations apply to the favourable findings for secondary procedures for attaining union. Data from three trials showed that fewer secondary procedures were required for acute fracture patients treated with BMP versus controls (RR 0.65, 95% CI 0.50 to 0.83).
There was no evidence of benefit for BMP, compared usually with bone grafts, for achieving union for fracture nonunion (RR 1.02, 95% CI 0.90 to 1.15). This was, however, a heterogenous group of small trials. Notably, although BMP has an angiogenic effect (Vaccaro 2002), selection bias may lead to an apparent lack of effectiveness if a study group includes greater numbers of atrophic nonunions than the control group. This was the case for the largest trial in this group (Friedlaender 2001). Data from two trials in the prior nonunion group found no statistically significant difference between the two groups in the number of secondary interventions (RR 0.41, 95% CI 0.13 to 1.28).
Ekrol 2008 found no difference in union for patients who had corrective osteotomy for radial malunions, but found that the control group healed significantly faster than the BMP group. The authors abandoned use of non‐bridging external fixation when half of the BMP patients experienced osteolysis. Subsequently, the use internal fixation did not lead to any cases of osteolysis, suggesting the inability of the BMP application to provide structural support to the site.
Reported adverse events were infection, hardware failure, pain, donor site pain/complications, heterotopic bone formation and immunogenic reactions. Of the two acute tibia fractures studies reporting hardware failures, there were significantly fewer failures in the BMP groups than the controls (RR 0.64, 95% CI 0.42 to 0.96). The development of ectopic bone was reported in two studies. No further surgery was performed, but the cause and potential implications should be further investigated. The presence of ectopic bone, if excessive, may interfere with limb function and there is concern that the natural osteoblastic control mechanism may be affected by exogenous supra‐physiological doses of BMP. The limited data on donor site problems were mainly on donor site pain. While we found no evidence to suggest treatment with BMP is more effective for patients with nonunions compared with control treatment; it does, however, eliminate the need for bone grafting and thus avoid donor site morbidity. When patients with critically sized defects of the fibula were treated with BMP‐7, investigators report bone induction with no adverse events.
Economic evaluations
Evidence from economic evaluations of BMP‐2 for acute open tibial fractures is limited by the reliance of all the studies on the same source of clinical data collected from one RCT (Govender 2002), which means their results are not independent, and also by the methodological limitations of individual studies. Taking these important limitations into account, there is evidence that direct medical costs associated with treatment with the 1.5 mg/mL dose of BMP‐2 are likely to exceed those associated with current standard treatments but the magnitude of this cost difference is likely to decrease as fracture severity increases. Observed between‐study variations in the magnitude of direct medical cost differences between treatment groups are likely to reflect variations in local prices and in the apportionment of costs, as well as other features of local context including clinical practice, organisation and delivery of care and economies of scale. There is also limited evidence to indicate that a proportion of direct medical costs may be offset by reduced productivity costs associated with faster healing and reduced time off work. Amongst employed patients with the most severe open tibial fractures, the value of reduced productivity costs could exceed the value of direct medical costs, leading to overall cost savings. The latter findings may be of particular interest to third party payers, employers and/or patients who incur financial costs associated with patients' absence from work.
Only one full economic evaluation of BMP treatment for acute open tibial fractures is currently available; a cost‐utility analysis conducted from a UK health care system perspective (Garrison 2007). The overall methodological quality of this study is good. Its results support the view that BMP‐2 treatment is more likely to be considered economically attractive, compared to current standard treatments, when used to treat patients with the most severe acute open tibial fractures (Gustilo‐Anderson grades IIIB and IIIC). Unpublished data from the study also provides some evidence that BMP‐2 treatment may be less likely to be considered economically attractive when used to treat less severe acute open tibial fractures (Gustilo‐Anderson grades I, II and IIIA). Placed in the context of evidence from all currently available economic evaluations, this study also suggests that BMP‐2 treatment may be more likely to be judged economically attractive when its impact on patients' quality of life is considered alongside other treatment effects and costs.
Evidence from one economic evaluation of BMP treatment for nonunion tibial fractures is limited due to the lack of detail in the published report and methodological limitations, including reliance on resource use data sourced using expert opinion (van Engen 2003). The authors of this study concluded that cost‐effectiveness ratios associated with three treatment opinions (BMP‐7, autograft and Ilizarov fixation) were comparable in the UK but favoured usual care (fixation with a nail or plate, with autograft when appropriate) over BMP‐7 in Germany.
Overall completeness and applicability of evidence
The clinical effectiveness of BMP treatment in acute fractures and nonunions is only partially shown. As shown in the Characteristics of ongoing studies and Characteristics of studies awaiting classification, further evidence to inform the use of BMP for fracture healing is pending and will be included in future updates of this review. This includes a trial comparing 1.5 mg/mL rhBMP‐2 versus usual care for 277 patients with open tibial fractures treated with reamed intramedullary nailing (Aro 2010). The use of reaming for all nails in this trial will counter one of the key concerns regarding Govender 2002.
The included studies involved patients with varying diagnoses, including acute tibial fractures, tibial nonunions, critically sized defects and radial malunions. Patients underwent varying surgical treatments and received different forms of BMP (mainly BMP‐7). Most studies reported outcomes of interest, however the comprehensiveness and comparability of reported outcomes was often broad. The definitions of successful healing varied widely between the studies, therefore what one assessor may consider healed may not apply clinically. The different clinical outcomes reported prevented pooling (for example, different function scores assessed). No studies reported outcomes related to donor site appearance and there were limited data on donor site pain. Donor site morbidity is one of the main adverse events associated with autograft and needs to be taken into account when determining the appropriate use of BMP. Results may not be directly applicable to patients with any serious co‐morbidities as any of studies which included them were excluded.
Quality of the evidence
The overall quality of included RCTs is poor. Most have small sample sizes and less than half reported methods of randomisation and allocation. Some failed to use independent blinded assessors or to perform intention‐to‐treat analysis. The largest RCT involving patients with acute fracture (Govender 2002) included only patients with diaphyseal open fractures and therefore the results may not be applicable to patients with metaphyseal tibial fractures. Two of the acute fracture RCTs were funded by industry (Wyeth Research/Genetic Institute and Stryker Biotech Inc) and several authors were listed as salaried employees of the company when these studies were conducted. Reports suggest industry‐sponsored trials are more likely to report results favouring the industry's product (Friedlaender 2004; Lexchin 2006).
Assessing fracture healing radiographically is problematic (Friedlaender 2001). Assessors must decide how many cortices must be bridged for union to be considered healed. This varies from bridging callus in at least one cortex in each plane to three or four cortices. When autograft bone is used, the assessor must distinguish the implanted autograft bone from the new bone. The subjectivity inherent in this process was reflected in the various definitions of union success used in the studies. In clinical practice, union is defined by combined clinical and radiographic findings. Therefore, studies relying on radiographic evidence alone are less applicable to clinical practice. Fracture healing is a continuous process and the quality (strength or stiffness) of any bridging callus cannot be defined on a radiograph. Most surgeons prefer an end point measure of healing based on both clinical and radiographic findings. This means the critical end point is subjective and not easily quantifiable. The definition of fracture healing is therefore open to bias, emphasizing the importance of independent, blinded assessors.
Potential biases in the review process
The review was conducted following criteria in the published protocol. Comprehensive searches were carried out to identify relevant studies. We tried to contact authors of studies with missing data with limited response. Two of the included studies are only available as abstracts, thus limiting the data available. This review, including data collection and analysis, was conducted independently of industry.
Agreements and disagreements with other studies or reviews
Our findings for nonunion were similar to that by the Agency for Healthcare and Quality in 2005 (Schoelles 2005), which concluded that an analysis was needed to show that BMP (along with internal fixation) was not inferior to autogenous bone graft and that additional studies were needed to replicate the results. Trials that aim to show the experimental treatment is at least as efficacious as a control treatment are termed “non‐inferiority trials” (Le Henanff 2006). It is not necessary for BMP to be superior to autologous bone graft, only that it has an equivalent effect and therefore can be used as a safe alternative. However, the available evidence is limited and clinically important differences between the use of BMP and autologous bone graft cannot be persuasively ruled out.
Authors' conclusions
This review highlights the paucity of data on the use of BMP in fracture healing as well as heavy industry involvement in currently available RCTs and economic evaluations. Current evidence is mainly limited to the use of BMP for tibial fracture and nonunion. Data from trials on acute open tibial fractures suggest that BMP may be more effective than controls, usually surgery alone, for fracture healing and for avoiding the need for secondary procedures to attain union. This evidence, however, was dominated by one large trial, which was compromised by an imbalance in the use of reaming for intermedullary nailing that could have contributed to the favourable findings for BMP. The use of BMP for treating tibial fracture nonunions remains unclear. Economic evidence is currently limited with respect to both acute fractures and nonunions, but the available evidence indicates that BMP treatment for acute open tibial fractures may be more likely to be judged favourably, from an economic perspective, when its use is restricted to patients with the most severe fractures and where decision‐makers need to consider the impacts of alternative treatments on patients' productivity and/or health‐related quality of life.
Further well‐designed RCTs and economic evaluations are needed to assess the clinical effectiveness and cost‐effectiveness of BMP for acute fractures of the tibia and, in particular, tibial non‐unions. Further investigation is also required to investigate clinical differences between BMP‐2 and BMP‐7, their relative effectiveness, and whether effectiveness is enhanced if their use is combined. Future economic evaluations of BMP should pay particular attention to potential variations in incremental costs and cost‐effectiveness between patients with fractures of different grades of severity and should also consider the impact of alternative treatments on patients' health‐related quality of life. To inform the latter, studies are needed to establish objective data on patient utility in patient populations with the types of fractures being evaluated. Depending on the primary desision‐maker, future economic evaluations should also consider the impact of alternative treatments on productivity costs and take into account all relevant treatment options. Finally, well‐designed RCTs and economic evaluations of BMP for treating fracture locations other than the tibia are also needed.
Acknowledgements
We would like to thank Mrs Lesley Gillespie, Professor William Gillespie, Dr Helen Handoll, Professor Peter Herbison, Dr Peter Kloen, Mr Luke Vale and Dr Janet Wale for valuable comments and input on versions of this review. We would also like to thank Dr Joanne Elliott, Mrs Lindsey Elstub and Ms Amy Kavanagh for editorial support.
We would also like to thank Dr Joanne Elliott for her help in developing the search strategy and Professor William J Gillespie, Professor Peter Herbison, Dr Janet Wale, Mr Luke Vale, Dr Arpana Verma, Mrs Lindsey Elstub and Dr Helen Handoll for helpful comments and input at the protocol stage.
Appendices
Appendix 1. Search strategies
The Cochrane Library (Wiley InterScience)
#1 ((bone morphogen* or osteogen* or osteoinduct*) NEAR (protein* or factor* or polypeptide* or poly‐peptide*)):ti,ab,kw #2 (BMP or BMP2 or BMP‐2 or BMP7 or BMP‐7):ti,ab,kw #3 (rhBMP or rhBMP2 or rhBMP‐2 or rhBMP7 or rhBMP‐7):ti,ab,kw #4 (rh‐BMP or rh‐BMP2 or rh‐BMP‐2 or rh‐BMP7 or rh‐BMP‐7):ti,ab,kw #5 (rhop1 or rhop‐1):ti,ab,kw #6 (op1 or op‐1):ti,ab,kw #7 MeSH descriptor Bone Morphogenetic Proteins explode all trees #8 (fracture*):ti,ab,kw #9 MeSH descriptor Fractures, Bone explode all trees #10 (nonunion or non‐union):ti,ab,kw #11 (non‐heal*):ti,ab,kw #12 (union):ti,ab,kw #13 (heal or healed or heals or healing):ti,ab,kw #14 (allograft* or autograft*):ti,ab,kw #15 (#1 OR #2 OR #3 OR #4 OR #5 OR #6 OR #7) #16 (#8 OR #9 OR #10 OR #11 OR #12 OR #13 OR #14) #17 (#15 AND #16)
MEDLINE (OVID interface)
1. ((bone morphogen$ or osteogen$ or osteoinduct$) adj (protein$ or factor$ or polypeptide$ or poly‐peptide$)).ti,ab. 2. (BMP or BMP2 or BMP‐2 or BMP7 or BMP‐7).ti,ab. 3. (rhBMP or rhBMP2 or rhBMP‐2 or rhBMP7 or rhBMP‐7).ti,ab. 4. (rh‐BMP or rh‐BMP2 or rh‐BMP‐2 or rh‐BMP7 or rh‐BMP‐7).ti,ab. 5. (rhop1 or rhop‐1).ti,ab. 6. (op1 or op‐1).ti,ab. 7. exp Bone Morphogenetic Proteins/ 8. fracture$.ti,ab. 9. exp Fractures, bone/ 10. (nonunion or non‐union).ti,ab. 11. non‐heal$.ti,ab. 12. union.ti,ab. 13. (heal or healed or heals or healing).ti,ab. 14. (allograft$ or autograft$).ti,ab. 15. (or/1‐7) and (or/8‐14) 16. Randomized controlled trial.pt 17. Controlled clinical trial.pt. 18. Randomized controlled trials/ 19. Random allocation/ 20. Double blind method/ 21. Single blind method/ 22. or/16‐21 23. Animals/ not Humans/ 24. 22 not 23 25. Clinical trial.pt. 26. exp Clinical trials as topic/ 27. (clin$ adj25 trial$).ti,ab. 28. ((singl$ or doubl$ or trebl$ or tripl$) adj25 (blind$ or mask$)).ti,ab. 29. Placebos/ 30. placebo$.ti,ab. 31. random$.ti,ab. 32. Research design/ 33. or/25‐32 34. 33 not 23 35. 34 not 24 36. 24 or 35 37. and/15,36
EMBASE (OVID interface)
1. ((bone morphogen$ or osteogen$ or osteoinduct$) adj (protein$ or factor$ or polypeptide$ or poly‐peptide$)).ti,ab. 2. (BMP or BMP2 or BMP‐2 or BMP7 or BMP‐7).ti,ab. 3. (rhBMP or rhBMP2 or rhBMP‐2 or rhBMP7 or rhBMP‐7).ti,ab. 4. (rh‐BMP or rh‐BMP2 or rh‐BMP‐2 or rh‐BMP7 or rh‐BMP‐7).ti,ab. 5. (rhop1 or rhop‐1).ti,ab. 6. (op1 or op‐1).ti,ab. 7. Bone Morphogenetic Protein/ or Bone Morphogenetic Protein 2/ or Osteogenic Protein 1/ 8. fracture$.ti,ab. 9. exp Fracture/ or Healing Impairment/ or Bone Allograft/ or Autograft/ or Fracture nonunion/ 10. (allograft$ or autograft$).ti,ab 11. (or/1‐7) and (or/8‐10) 12. exp Randomized Controlled trial/ 13. exp Double Blind Procedure/ 14. exp Single Blind Procedure/ 15. exp Crossover Procedure/ 16. Controlled Study/ 17. or/12‐16 18. ((clinical or controlled or comparative or placebo or prospective$ or randomi#ed) adj3 (trial or study).ti,ab 19. ((random$ adj7 (allocat$ or allot$ or assign$ or basis$ or divid$ or order$)).ti,ab 20. ((singl$ or doubl$ or trebl$ or tripl$) adj7 (blind$ or mask$)).ti,ab 21. (cross?over$) or (cross adj1 over$)).ti,ab 22. ((allocat$ or allot$ or assign$ or divid$) adj3 (condition$ or experiment$ or intervention$ or treatment$ or therap$ or control$ or group$)).ti,ab 23. or/18‐22 24. or/17,23 25. limit 24 to human 26. and/11,25
NHS Economic Evaluation Database (Centre for Reviews and Dissemination)
(("bone morphogen*" OR osteogen* OR osteoinduct*) AND (protein* OR factor* OR polypeptide* OR poly‐peptide*) OR (BMP OR BMP2 OR BMP‐2 OR BMP7 OR BMP‐7 OR rhBMP OR rh‐BMP2 OR rh‐BMP‐2 OR rh‐BMP7 OR rh‐BMP‐7)) AND (fracture* OR nonunion OR non‐union OR non‐heal* OR union OR heal OR healed OR heals OR healing OR allograft* OR autograft*)
European Network of Health Economic Evaluation Databases (http://infodoc.inserm.fr/)
bone morphogen* OR osteogen* OR osteoinduct* OR BMP OR BMP2 OR BMP‐2 OR BMP7 OR BMP‐7 OR rhBMP OR rh‐BMP2 OR rh‐BMP‐2 OR rh‐BMP7 OR rh‐BMP‐7
Appendix 2. Secondary outcomes (except secondary procedures)
| Study | Outcome | Results | |
| Acute fractures | |||
| Alt 2006a | Infection | 1.50 mg/mL BMP‐2: 3% (5/145) classified as having infections requiring invasive surgical treatment; 10% (14/145) classified as having infections requiring less invasive surgical treatment; 3% (5/145) classified as having infections requiring outpatient antibiotic treatment only. Control: 3% (5/146) classified as having infections requiring invasive surgical treatment; 10% (15/146) classified as having infections requiring less invasive surgical treatment; 3% (4/146) classified as having infections requiring outpatient antibiotic treatment only. |
|
| Hardware failure | |||
| Clinical response | |||
| Operative | |||
| Other patient outcomes | 1.50 mg/mL BMP‐2: Assumes 100% of patients in paid employment before treatment and resume work after treatment, and that the day of resumption of work corresponds to the day of fracture healing. Control: Assumes 100% of patients in paid employment before treatment and resume work after treatment, and that the day of resumption of work corresponds to the day of fracture healing. |
||
| Donor site appearance | |||
| Heterotropic bone formation | |||
| Immunogecity | |||
| Other adverse effects | |||
| Direct medical resource use | 1.50 mg/mL BMP‐2: 1.5 mg/mL rhBMP‐2 per patient; other direct medical resource use ‐ seeAppendix 3. Control: Other direct medical resource use ‐ seeAppendix 3. |
||
| Lost or reduced productivity (time off work) | 1.50 mg/mL BMP‐2: Mean = 192 days to return to work (SD = 105; 95% CI 64 to 375). Control: Mean = 224 days to return to work (SD = 98; 95% CI 58 to 365). |
||
| Other non‐medical costs | |||
| Unit costs | 1.50 mg/mL BMP‐2: 1.5 mg/mL rhBMP‐2 per patient = $3512 (2008 International Dollar prices); other unit costs ‐ seeAppendix 3. Control: other unit costs ‐ seeAppendix 3. |
||
| Total direct medical costs | 1.50 mg/mL BMP‐2: Mean = $5622 per patient (SD = 3634; 2008 International Dollar prices). Control: Mean = $2837 per patient (SD = 3759; 2008 International Dollar prices). |
||
| Total productivity costs | 1.50 mg/mL BMP‐2: Mean = $8477 per patient (SD = 5953; 2008 International Dollar prices). Control: Mean = $10,308 per patient (SD = 5532; 2008 International Dollar prices). |
||
| Total other non‐medical costs | |||
| Incremental cost‐effectiveness, cost‐utility or cost‐benefit | |||
| Garrison 2007 | Infection | 1.50 mg/mL BMP‐2: 2% (74.8/3329.6) classified as having severe infections; 6% (185.1/3329.6) classified as having intermediate infections; 13% (421.1/3329.6) classified as having less severe infections. Control: 3% (110.9 /3329.6) classified as having severe infections; 10% (322.1 /3329.6) classified as having intermediate infections; 19% (623.8 /3329.6) classified as having less severe infections. |
|
| Hardware failure | |||
| Clinical response | |||
| Operative | |||
| Other patient outcomes | |||
| Donor site appearance | |||
| Heterotropic bone formation | |||
| Immunogecity | |||
| Other adverse effects | |||
| Direct medical resource use | 1.50 mg/mL BMP‐2: 1.5 mg/mL rhBMP‐2 per patient; other direct medical resource use ‐ seeAppendix 3. Control: Other direct medical resource use ‐ seeAppendix 3. |
||
| Lost or reduced productivity (time off work) | |||
| Other non‐medical costs | |||
| Unit costs | 1.50 mg/mL BMP‐2: 1.5 mg/mL rhBMP‐2 per patient = $2903 (2008 International Dollar prices); other direct medical resource use ‐ see Appendix 3 | ||
| Total direct medical costs | 1.50 mg/mL BMP‐2: Mean = $9663 per patient (SD = 1350; 2008 International Dollar prices). Control: Mean = $7953 per patient (SD = 1482; 2008 International Dollar prices). |
||
| Total productivity costs | |||
| Total other non‐medical costs | |||
| Incremental cost‐effectiveness, cost‐utility or cost‐benefit | Incremental cost per QALY (1.50 mg/mL BMP‐2 vs control): $32,603 per QALY (95% CI = 22842 to 99346; 2008 International Dollar prices). | ||
| Govender 2002 | Infection | 0.75 mg/mL BMP‐2:15% (12/80) classed as having Gustilo‐Anderson Types I and II had fracture site infections; 29% (19/65) with Gustilo‐Anderson Types IIIA and IIIB developed fracture site infection. 1.50 mg/mL BMP‐2: 21% (15/70) [n=82?] classed as having Gustilo‐Anderson Types I and II had fracture site infections; 24% (15/63) with Gustilo‐Anderson Types IIIA and IIIB developed fracture site infection. Control:15% (13/88) of patients classed as having Gustilo‐Anderson Types I and II had fracture site infections; 44% (26/59) patients with Gustilo‐Anderson Types IIIA and IIIB developed fracture site infection. |
|
| Hardware failure | 0.75 mg/mL BMP‐2: 25/145. 1.5 mg/mL BMP‐2: 16/145. Control group: 32/147. |
||
| Clinical response | Overall pain: 97 (67%) 0.75 mg/mL BMP, 98 (68%) 1.50 mg/mL BMP, 116 (79%) control. | ||
| Operative | |||
| Other patient outcomes | |||
| Donor site appearance | |||
| Heterotropic bone formation | |||
| Immunogecity | Antibodies to BMP‐2: 3 (2%) 0.75 mg/mL BMP, 9 (6%) 1.50 mg/mL BMP, 1 (1%) control. Antibodies to type‐1 bovine collagen: 22 (15%) 0.75 mg/mL BMP, 29 (20%) 1.50 mg/mL BMP, 9 (6%) control. |
||
| Other adverse effects | |||
| Direct medical resource use | |||
| Lost or reduced productivity (time off work) | |||
| Other non‐medical costs | |||
| Unit costs | |||
| Total direct medical costs | |||
| Total productivity costs | |||
| Total other non‐medical costs | |||
| Incremental cost‐effectiveness, cost‐utility or cost‐benefit | |||
| Jones 2004 | Infection | ||
| Hardware failure | |||
| Clinical response | |||
| Operative | |||
| Other patient outcomes | |||
| Donor site appearance | |||
| Heterotropic bone formation | |||
| Immunogecity | |||
| Other adverse effects | |||
| Direct medical resource use | 1.50 mg/mL BMP‐2: 1.5 mg/mL rhBMP‐2 per patient. Control: N/A. |
||
| Lost or reduced productivity (time off work) | |||
| Other non‐medical costs | |||
| Unit costs | 1.50 mg/mL BMP‐2: 1.5 mg/mL rhBMP‐2 per patient = $5,639 (2008 International Dollar prices). Control: N/A |
||
| Total direct medical costs | 1.50 mg/mL BMP‐2: Mean = $15,805 per patient (2008 International Dollar prices). Control: Mean = $10,736 per patient (2008 International Dollar prices). |
||
| Total productivity costs | |||
| Total other non‐medical costs | |||
| Incremental cost‐effectiveness, cost‐utility or cost‐benefit | |||
| Jones 2006 | Infection | 1.50 mg/mL BMP/ autograft:Three patients developed infection, one superficial and the other two that required surgical intervention, and which failed to unite. Control: One patient developed infection that required surgical intervention, which failed to unite. |
|
| Hardware failure | 1.50 mg/mL BMP/autograft: Two patients with screw breakages requiring dynamization. | ||
| Clinical response | Improvement in Short Muscular functional assessment scores: Function index ‐23.9 BMP, ‐22.2 control. Bother index ‐24.6 BMP, ‐ 20.3 control. 14 of 15 control patients with acute onset iliac crest donor site pain. |
||
| Operative | Mean operative time:150 minutes BMP, 169 minutes control. Mean estimated blood loss: 117 mL BMP, 353 mL control. |
||
| Other patient outcomes | |||
| Donor site appearance | |||
| Heterotropic bone formation | 1 BMP patient with heterotopic bone formation. | ||
| Immunogecity | No patients with antibodies to BMP‐2. 1 BMP patient and 4 control patients with antibodies to bovine type‐1 collagen. |
||
| Other adverse effects | Localised soft tissue swelling: 12 (80%) BMP, 9 (60%) control. Epidermal erythema: 5 (33%) BMP. |
||
| Direct medical resource use | |||
| Lost or reduced productivity (time off work) | |||
| Other non‐medical costs | |||
| Unit costs | |||
| Total direct medical costs | |||
| Total productivity costs | |||
| Total other non‐medical costs | |||
| Incremental cost‐effectiveness, cost‐utility or cost‐benefit | |||
| Maniscalco 2002 | Infection | ||
| Hardware failure | |||
| Clinical response | |||
| Operative | Hospital stay length mean: BMP‐7, 11.7 days (range 5‐21). Control, 12 days (range 5‐26). |
||
| Other patient outcomes | |||
| Donor site appearance | |||
| Heterotropic bone formation | 1 BMP‐7 patient with calcification of the tibio‐fibular ligament and 1 control patient fell one month after fixator removal and refractured bone who was subsequently treated with casting. | ||
| Immunogecity | |||
| Other adverse effects | |||
| Direct medical resource use | |||
| Lost or reduced productivity (time off work) | |||
| Other non‐medical costs | |||
| Unit costs | |||
| Total direct medical costs | |||
| Total productivity costs | |||
| Total other non‐medical costs | |||
| Incremental cost‐effectiveness, cost‐utility or cost‐benefit | |||
| McKee 2002 | Infection | ||
| Hardware failure | |||
| Clinical response | No pain with activity: 80% of BMP and 56% of control groups. Fully weight bearing: 95% of BMP and 84% of control groups. |
||
| Operative | |||
| Other patient outcomes | |||
| Donor site appearance | |||
| Heterotropic bone formation | |||
| Immunogecity | |||
| Other adverse effects | |||
| Direct medical resource use | |||
| Lost or reduced productivity (time off work) | |||
| Other non‐medical costs | |||
| Unit costs | |||
| Total direct medical costs | |||
| Total productivity costs | |||
| Total other non‐medical costs | |||
| Incremental cost‐effectiveness, cost‐utility or cost‐benefit | |||
| Nonunion fractures | |||
| Calori 2006 | Infection | ||
| Hardware failure | |||
| Clinical response | |||
| Operative | |||
| Other patient outcomes | |||
| Donor site appearance | |||
| Heterotropic bone formation | |||
| Immunogecity | |||
| Other adverse effects | |||
| Direct medical resource use | |||
| Lost or reduced productivity (time off work) | |||
| Other non‐medical costs | |||
| Unit costs | |||
| Total direct medical costs | |||
| Total productivity costs | |||
| Total other non‐medical costs | |||
| Incremental cost‐effectiveness, cost‐utility or cost‐benefit | |||
| Chen 2000 | Infection | ||
| Hardware failure | |||
| Clinical response | Johner‐Wruh function score (excellent and good): 75% of BMP group, 80% of autograft group. | ||
| Operative | |||
| Other patient outcomes | |||
| Donor site appearance | |||
| Heterotropic bone formation | |||
| Immunogecity | |||
| Other adverse effects | |||
| Direct medical resource use | |||
| Lost or reduced productivity (time off work) | |||
| Other non‐medical costs | |||
| Unit costs | |||
| Total direct medical costs | |||
| Total productivity costs | |||
| Total other non‐medical costs | |||
| Incremental cost‐effectiveness, cost‐utility or cost‐benefit | |||
|
Cook 1999 |
Infection | Autograft: One patient with infection that failed to heal. | |
| Hardware failure | |||
| Clinical response | Overall, 18 patients without pain, 8 with mild pain and 1 with moderate pain. 25 of the healed nonunions were fully weight bearing. (Both outcomes not separated by intervention group.) |
||
| Operative | |||
| Other patient outcomes | |||
| Donor site appearance | |||
| Heterotropic bone formation | |||
| Immunogecity | |||
| Other adverse effects | |||
| Direct medical resource use | |||
| Lost or reduced productivity (time off work) | |||
| Other non‐medical costs | |||
| Unit costs | |||
| Total direct medical costs | |||
| Total productivity costs | |||
| Total other non‐medical costs | |||
| Incremental cost‐effectiveness, cost‐utility or cost‐benefit | |||
| Friedlaender 2001 | Infection | OP‐1:Two patients with acute or subacute osteomyelitis of the lower leg; 14 patients with postoperative infection; 56 patients with mild pain at the fracture site. Control:Thirteen patients with acute or subacute osteomyelitis of the lower leg; 12 patients with postoperative infection; 55 patients with mild pain at the fracture site. |
|
| Hardware failure | OP‐1: 25/61 (41%). Autograft: 34/61 (56%). |
||
| Clinical response | All patients with pain at donor site (of which 80% judged pain to be mild to moderate); 13% had persistent donor pain 12 months postsurgery. Pain at multiple sites: 8 BMP patients, 9 control patients. Fully weight bearing with less than severe pain at fracture site: 51 (81%) of BMP and 52 (85%) of control patients. |
||
| Operative | Operative time: BMP 169 minutes (range 58 to 420), control 178 minutes (range 58‐420). Hospital stay length: BMP 3.7 days (range 0 to 18), control 4.1 (range 1 to 24). Operative blood loss: BMP 254 mL (range 10 to 1150), control 345 mL (range 35 to 1200). |
||
| Other patient outcomes | |||
| Donor site appearance | |||
| Heterotropic bone formation | |||
| Immunogecity | 5% of OP‐1 patients with antibodies to type‐1 collagen and 10% of OP‐1 patients with antibodies to OP‐1. | ||
| Other adverse effects | Pyrexia: 31 BMP, 28 control. Vomiting: 18 BMP, 19 control. Edema: 5 BMP, 7 control. Lower leg arthralgia: 8 BMP, 5 control. |
||
| Direct medical resource use | |||
| Lost or reduced productivity (time off work) | |||
| Other non‐medical costs | |||
| Unit costs | |||
| Total direct medical costs | |||
| Total productivity costs | |||
| Total other non‐medical costs | |||
| Incremental cost‐effectiveness, cost‐utility or cost‐benefit | |||
| Geesink 1999 | Infection | ||
| Hardware failure | |||
| Clinical response | Three BMP patients experienced pain (two mild, one moderate). | ||
| Operative | |||
| Other patient outcomes | |||
| Donor site appearance | |||
| Heterotropic bone formation | |||
| Immunogecity | Two patients in the collagen treatment group developed antibodies to type‐1 collagen. | ||
| Other adverse effects | |||
| Direct medical resource use | |||
| Lost or reduced productivity (time off work) | |||
| Other non‐medical costs | |||
| Unit costs | |||
| Total direct medical costs | |||
| Total productivity costs | |||
| Total other non‐medical costs | |||
| Incremental cost‐effectiveness, cost‐utility or cost‐benefit | |||
|
Perry 1997 |
Infection | ||
| Hardware failure | |||
| Clinical response | Control group experienced severe but temporary pain at the donor site. | ||
| Operative | |||
| Other patient outcomes | |||
| Donor site appearance | |||
| Heterotropic bone formation | |||
| Immunogecity | |||
| Other adverse effects | |||
| Direct medical resource use | |||
| Lost or reduced productivity (time off work) | |||
| Other non‐medical costs | |||
| Unit costs | |||
| Total direct medical costs | |||
| Total productivity costs | |||
| Total other non‐medical costs | |||
| Incremental cost‐effectiveness, cost‐utility or cost‐benefit | |||
|
van Engen 2003 |
Infection | OP‐1 (BMP‐7): 23% rate of infections of the operation site. Autograft: 20% rate of infections of the operation site. Ilizarov fixation: 4% rate of infections of the operation site. |
|
| Hardware failure | OP‐1 (BMP‐7): 41% rate of hardware events. Autograft: 56% rate of hardware events. Ilizarov fixation: 20% rate of hardware events. |
||
| Clinical response | |||
| Operative | UK: Operative time: OP‐1 (BMP‐7) 90 minutes. UK: Operative time: Autograft 81 minutes. UK: Operative time: Ilizarov fixation 212 minutes. Germany: Operative time: OP‐1 (BMP‐7) 47.6 minutes. Germany: Operative time: Autograft 77.6 minutes. UK: Length of postoperative hospital stay: OP‐1 (BMP‐7) 6.0 days. UK: Length of postoperative hospital stay: Autograft 6.5 days. UK: Length of postoperative hospital stay: Ilizarov fixation 13.0 days. Germany: Length of postoperative hospital stay: OP‐1 (BMP‐7) 12.9 days. Germany: Length of postoperative hospital stay: Autograft 13.0 days. |
||
| Other patient outcomes | |||
| Donor site appearance | |||
| Heterotropic bone formation | |||
| Immunogecity | |||
| Other adverse effects | |||
| Direct medical resource use | See ‘Operative’. | ||
| Lost or reduced productivity (time off work) | |||
| Other non‐medical costs | |||
| Unit costs | OP‐1 (BMP‐7): Unspecified dosage = $5679 per patient in the UK and $5561 per patient in Germany (2008 International Dollar prices); other unit costs ‐ seeAppendix 3. Control: other unit costs ‐ seeAppendix 3. |
||
| Total direct medical costs | UK: OP‐1 (BMP‐7): Mean = $16,302 per patient (2008 International Dollar prices). UK: Autograft: Mean = $16,834 per patient (2008 International Dollar prices). UK: Ilizarov fixation (excluding frame costs): Mean = $18,016 per patient (2008 International Dollar prices). Germany: OP‐1 (BMP‐7): Mean = $19,155 per patient (2008 International Dollar prices). Germany: Autograft: Mean = $18,134 per patient (2008 International Dollar prices). |
||
| Total productivity costs | |||
| Total other non‐medical costs | |||
| Incremental cost‐effectiveness, cost‐utility or cost‐benefit | UK: Incremental cost per healed fracture: OP‐1 (BMP‐7) vs autograft: $321 per patient (2008 International Dollar prices). UK: Incremental cost per healed fracture: OP‐1 (BMP‐7) vs Ilizarov fixation: $1160 per patient (2008 International Dollar prices). Germany: Incremental cost per healed fracture: OP‐1 (BMP‐7) vs autograft: $2314 per patient (2008 International Dollar prices). |
||
| Malunion fractures treated with corrective osteotomy | |||
| Ekrol 2008 | Infection | In external fixation group, three autograft patients and one BMP patient developed superficial pin track infections. | |
| Hardware failure | In internal fixation group; 3/10 OP‐1 patients and 7/10 autograft patients experienced dorsal plate irritation requiring plate removal. | ||
| Clinical response | No significant difference in functionality between BMP and control using internal or external fixation. | ||
| Operative | |||
| Other patient outcomes | |||
| Donor site appearance | |||
| Heterotropic bone formation | |||
| Immunogecity | |||
| Other adverse effects | Two BMP external fixation patients had a dorsal defect and two developed osteolysis. In one control external fixation patient the deformity reoccurred requiring surgery at 20 weeks. | ||
| Direct medical resource use | |||
| Lost or reduced productivity (time off work) | |||
| Other non‐medical costs | |||
| Unit costs | |||
| Total direct medical costs | |||
| Total productivity costs | |||
| Total other non‐medical costs | |||
| Incremental cost‐effectiveness, cost‐utility or cost‐benefit | |||
Appendix 3. Data extracted from included economic evaluations
| Alt 2006a | |
| Country code | Germany |
| Publication language | German |
| Funding source for study | Medtronic (a medical technology manufacturer and a distributor of rhBMP‐2). |
| Other published or unpublished versions of study | Alt V, Donell ST, Chhabra A, Eicher A, Schnettler R. BMP‐2 is a cost‐effective therapy in grade III open tibia fractures ‐ A health‐economic assessment of the use BMP‐2 in open tibia fractures for European healthcare systems [oral paper]. 8th European Federation of National Associations of Orthopaedics and Traumatology (EFORT) Congress; 2007 May 11‐15; Firenze, Italy. |
| Related publications | Govender S, Csimma C, Genant HK, Valentin‐Opran A. Recombinant human bone morphogenetic protein‐2 for treatment of acute open tibial fractures ‐ a prospective, controlled, randomized study of four hundred and fifty patients. Journal of Bone and Joint Surgery ‐ American Volume 2002; 84(12): 2123‐34. |
| Health Technology | Recombinant Bone Morphogenetic Protein‐2 (BMP‐2) for treatment of acute open tibial shaft fractures in skeletally mature adults. |
| Intervention(s) | 1.50 mg/mL rhBMP‐2 delivered by absorbable Type I bovine collagen sponge as an adjunct to intramedullary nail fixation (IM) with routine soft tissue management. |
| Comparator(s) | IM with routine soft tissue management. |
| Fracture type(s) | Acute open tibial shaft (Gustilo‐Anderson types I to IIIA and IIIB). |
| Hypothesis/study question | The objective of the study is to compare the costs associated with use of rhBMP‐2 as an adjunct to IM with routine soft‐tissue management, versus the costs associated with the current standard surgical treatment of open tibial shaft fractures: use of IM with routine soft tissue management alone. The authors hypothesise potential cost savings resulting from the adjunctive use of rhBMP‐2, due to faster fracture healing and reduced revision and infection rates. |
| Economic study type | Cost analysis. |
| Analytic perspective | Public health insurance company in Germany (third‐party payer). |
| Study population | The randomised population in the multi‐centre prospective randomised controlled trial from which the population in this cost analysis is drawn (Govender 2002) comprises 450 skeletally mature adult patients with open tibial shaft fractures of varying severity (Gustilo‐Anderson types I, II, IIIA and IIIB) The study population included in this cost analysis (Alt 2006a) comprises a sub‐group of 291patients drawn from the intention‐to‐treat (ITT) population of the above trial (Intervention group = 145, Comparison group = 146). One patient drawn from the intention‐to‐treat (ITT) population of the trial was excluded from this cost analysis (from the control group). The reason for exclusion of this patient is not stated. |
| Modelling and statistical extrapolation | Assumptions are made and discussed, but the study does not use a formal model. No statistical extrapolation of data is used. |
| Setting | Inpatient care (secondary care). The setting for the cost analysis is Germany. The randomised population in the trial from which the population in this cost analysis is drawn were recruited at 49 centres (hospitals) in 11 countries: Australia, Belgium, Canada, Finland, France, Germany, Israel, Netherlands, Norway, South Africa, United Kingdom (Govender 2002). |
| Dates to which data relate / time horizon of costs and effects | The time horizon for costs is one year. Resource use data were collected prospectively between April 2007 and December 1999 over a one year follow‐up period (Govender 2002). The study uses 2005 Euro (Germany) prices. |
| Clinical and epidemiological data | The clinical data utilised in this cost‐analysis include severity of soft tissue injury, complications (post‐traumatic and post‐operative infections) and revision procedures for delayed fracture healing. Post‐traumatic and post‐operative infections are classified as ‘requiring invasive surgical treatment’ (irrigation and debridement with nail removal with or without application of external fixation plus 8 weeks of antibiotics after discharge), ‘requiring less invasive surgical treatment’ (irrigation and debridement without modification of the implant) or ‘requiring outpatient antibiotic treatment only’. Revision procedures for delayed fracture healing are classified as ‘invasive’ (re‐osteosynthesis by plate or nail; autogenous bone graft; fibula osteotomy) or ‘less invasive’ (e.g. hardware removal for dynamisation of the nail; others not specified). |
| Data sources | All clinical evidence utilised in this cost analysis is derived from a single study (Govender 2002). The authors conduct a sub‐group analysis based on the severity of the soft tissue injury according to Gustilo‐Anderson classification, to estimate cost differences between the experimental and comparator interventions by Gustilo‐Anderson subgroups. Subgroups in the original study are:
The study utilises clinical evidence on time to fracture healing as an estimate of time to return to work and clinical evidence on complications (number and type) and revision procedures (number and type) to estimate ‘downstream’ costs (Govender 2002). Average (mean) time to fracture union per patient (days)**: All open fractures
Gustilo‐Anderson grade III B
Gustilo‐Anderson grade III B and IIIA
Gustilo‐Anderson grade IIIA
Gustilo‐Anderson grade II
Gustilo‐Anderson grade I
|
| Methods used to obtain data | The study derives all its clinical evidence from a single study (Govender 2002). |
| Link between effectiveness and cost data | Not applicable: the study is a cost analysis. Resource use data were collected prospectively within a multi‐centre prospective randomised controlled trial (Govender 2002). |
| Study sample (effectiveness data) | Not applicable: the study is a cost analysis. |
| Study design (effectiveness data) | Not applicable: the study is a cost analysis. |
| Analysis of effectiveness | Not applicable: the study is a cost analysis. |
| Effectiveness results | Not applicable: the study is a cost analysis. |
| Clinical conclusions | Not applicable: the study is a cost analysis. |
| Measure of health benefits used in the economic analysis / methods used to value benefits / Details of subjects from whom valuations were obtained | Not applicable: the study is a cost analysis. |
| Source(s) of unit cost data | Price of rhBMP‐2: Medtronic price list for Germany, 2006* Direct medical costs:
Average sickness payments: German Ministry for Health and Social Security (Bundesministerium für Gesundheit und Soziale Sicherung (BMGS)), 2003 Average costs (i.e. the total cost divided by the number of units provided) per patient are reported in this study. |
| Currency | Euros (€) ‐ Germany |
| Price year | 2005 |
| Direct medical resource use: rhBMP‐2 | 1.50 mg/mL per patient (fixed dosage). |
| Direct medical costs: rhBMP‐2 | €2900 per patient. |
| Direct medical resource use: Operative time (minutes) | Operative time (minutes) is not measured directly in this study. The study is conducted from a health care insurance perspective. German healthcare insurance reimbursement pays one ‘flat rate’ per case to hospitals based on the DRG code of the respective case or procedure*. |
| Direct medical unit costs: Operative time (per minute/ per hour) | Not applicable. Operative time (minutes) is not measured directly in this study.* |
| Direct medical resource use: Length of postoperative hospital stay (days) | Length of postoperative hospital stay (days) is not measured directly in this study. The study was undertaken from a health care insurance perspective. German healthcare insurance reimbursement pays one ‘flat rate’ per case to hospitals based on the DRG code of the respective case or procedure*. |
| Direct medical unit costs: Postoperative hospital stay (per day) | Not applicable: Length of postoperative hospital stay (days) is not measured directly in this study.* |
| Direct medical resource use: Other | 1. Number of revision surgeries: Invasive Re‐osteosynthesis by plate or nail*:
Autogenous bone grafting*:
Fibula osteotomy*:
Less Invasive Hardware removal for dynamisation of the nail*:
Other*:
2. Number of post‐traumatic and postoperative infections Invasive surgical treatment (inc. 8 weeks outpatient antibiotic treatment)*
Less invasive surgical treatment*
Outpatient antibiotic treatment (8 weeks duration)*
Heparin treatment* All patients in both arms of the trial are assumed to receive daily (low‐weight) heparin following initial surgery until day of fracture healing. |
| Direct medical unit costs: Other | 1. Revision surgeries: Invasive*
Less Invasive*
2. Post‐traumatic and post‐operative infections: surgeries Invasive surgical treatment*
Less invasive surgical treatment*
Outpatient antibiotic treatment (8 weeks)*
Heparin treatment*
|
| Average (mean) total direct medical costs** |
All open fractures (cost per patient)
Gustilo‐Anderson grade III B (cost per patient)
Gustilo‐Anderson grade III B and IIIA (cost per patient)
Gustilo‐Anderson grade IIIA (cost per patient)
Gustilo‐Anderson grade II (cost per patient)
Gustilo‐Anderson grade I (cost per patient)
|
| Productivity resource use: Employment status before and after treatment | Study assumes that all patients are employed before and after the injury and that the day of fracture healing corresponds to the day of resumption of work. |
| Productivity resource use: number and/ or time return to work (for those patients in employment before treatment)/ lost or reduced productivity (time off work)** | The exact time of resumption of work is not monitored in the randomised controlled trial which provides the clinical evidence for this cost analysis (Govender 2002). Therefore, calculation of sickness payments assumes that the day of fracture healing corresponds to the day of resumption of work, that all patients were employed before and after the injury and that all patients have public health care insurance. All open fractures
Gustilo‐Anderson grade III B
Gustilo‐Anderson grade III B and IIIA
Gustilo‐Anderson grade IIIA (cost per patient)
Gustilo‐Anderson grade II
Gustilo‐Anderson grade I
|
| Productivity unit costs: lost or reduced productivity (time off work) | €46.73 /day Average daily sickness payment from German public health insurance companies (including fringe benefits that have to be covered by German public health insurance companies). |
| Average (mean) total productivity costs (time off work)** | Assumes health insurers provide sickness payments commencing after absence from work of 6 weeks (initial period up to 6 weeks is covered by the employer). This reflects current practice in Germany*. All open fractures
Gustilo‐Anderson grade III B
Gustilo‐Anderson grade III B and IIIA
Gustilo‐Anderson grade IIIA
Gustilo‐Anderson grade II
Gustilo‐Anderson grade I
|
| Average total non‐medical costs (e.g. patient out‐of‐pocket expenses) | Not measured. |
| Average (mean) total costs** |
All open fractures
Gustilo‐Anderson grade III B
Gustilo‐Anderson grade III B and IIIA
Gustilo‐Anderson grade IIIA
Gustilo‐Anderson grade II
Gustilo‐Anderson grade I
|
| Discount rate used and justification | N/A ‐ discounting is not discussed, but is not appropriate since the time horizon of the study is one year. |
| Explanation if costs and effects are not discounted | N/A ‐ discounting is not discussed, but is not appropriate since the time horizon of the study is one year. |
| Statistical analysis of costs | Mean costs are reported in the original study but standard deviations, standard errors, or confidence intervals are not reported. The lead author of the study supplied the original data set with permission from Medtronic. An author of this review (IS) reviewed the data set and conducted a secondary analysis of resource use and cost data, using individual‐level patient data (reported above). Inspection of the original data set used in this study reveals that estimates of costs (and cost differences between groups) are based on randomisation group‐level data, including use of a weighted group average of case mix index (resource use) as opposed to individual‐level case mix index data (which are available in the original data set). In effect, this precluded calculation of standard errors, standard deviations or confidence intervals in the original analysis. Standard deviations and confidence intervals were calculated in the secondary analysis conducted by IS, which used individual‐level patient data.* |
| Methods used to allow for uncertainty | No sensitivity analysis is reported. |
| Synthesis of costs and benefits | Not applicable ‐ study is a cost analysis. |
| Incremental cost‐effectiveness results | Not applicable ‐ study is a cost analysis. |
| Authors conclusions | The authors’ main conclusions are that “This work shows that net savings can be achieved for Gustilo‐Anderson grade IIIB and [Gustilo‐Anderson grade III B and IIIA] fractures by the use of rhBMP‐2 from the perspective of German public health insurer” and that “the main driver for the savings is avoided sickness payments due to faster fracture healing by rhBMP‐2”. |
| Commentary |
Choice of comparator: Although no explicit justification was provided for the comparator used, the comparator appears to represent standard practice in the authors’ setting in 2005. End‐users of this Cochrane review should decide if the comparator represents current practice in their own setting. Modelling: Not applicable no formal model is used. Validity of estimate of costs: The analysis of costs was performed from the perspective of the insurer (third‐party payer). It appears that, given the perspective adopted, most relevant categories of costs (resource use) have been included in the analysis. Exceptions (not considered) are the costs of outpatient visits and physical therapy. As the analysis did not include these costs, it is possible that the reported cost savings associated with the clinical benefits accruing from the use of rhBMP‐2 are underestimated from an insurers (third‐party payer) perspective. *It is also important to highlight that in the original study, analysis of costs does not utilise individual‐level resource use or cost data directly. This leads to limitations in the reporting of estimates of costs; specifically that measures of variance are not reported for mean values. A further limitation of the original study is that measures of resource use were not reported separately from their unit costs. Other issues: The authors do not compare the principal findings of their study with those from other studies. *The authors do not appear to have reported results selectively. Although their original analysis was based on a sub‐group of the intention‐to‐treat population within the trial utilised as the source of resource use data (Govender 2002), this decision may be attributable to the clinical results of the source trial, which indicate that only the 1.5 mg/mL concentration of rhBMP‐2 and not the 0.75 mg/mL concentration demonstrate clinical efficacy compared to standard care. In general, the authors’ conclusions appear to follow from the data reported in the original study. However, the original study (and the secondary analysis conducted by IS) indicates that incremental one‐year direct medical costs in the BMP‐2 group are not offset by cost savings from reduced one‐year sickness payments amongst patients with less severe fracture types, and this conclusion is not reported in the original study. The numbers of patients by fracture severity within the individual patient‐level data set used in this cost analysis appear to differ from the numbers of patients by fracture severity reported in the BESST study, with respect to Gustilo‐Anderson IIIB (intervention only) and Gustilo‐Anderson II and I (intervention and control). How is this explained? The authors discuss the following limitations of their study:
|
| * Based on additional information and/or original data set supplied by the study authors. ** Based on secondary analysis of the original data set, conducted by IS. | |
| Garrison 2007 | |
| Country code | United Kingdom |
| Publication language | English |
| Funding source for study | UK Health Technology Assessment Programme (Project number 04/34/02). |
| Other published or unpublished versions of study | Abacus International (2006). Economic evaluation model to evaluate cost‐effectiveness of rhBMP‐2 in the treatment of open tibial fractures (unpublished study). Bicester: Abacus International. Development of the original economic model was sponsored by Medtronic. Medtronic is a medical technology manufacturer and a distributor of rhBMP‐2. |
| Related publications | Govender S, Csimma C, Genant HK, Valentin‐Opran A. Recombinant human bone morphogenetic protein‐2 for treatment of open tibial fractures ‐ a prospective, controlled, randomized study of four hundred and fifty patients. Journal of Bone & Joint Surgery ‐ American Volume 2002;84(12):2123‐34. Court‐Brown CM, Cross AT, Hahn DM, Marsh DR, Willett K, Quaba AA, et al. A report by the British Orthopaedic Association/British Association of Plastic Surgeons Working Party on the management of open tibial fractures. September 1997. British Journal of Plastic Surgery 1997;50(8):570‐83. [EMBASE: 1998017257] Salkeld G, Cameron ID, Cumming RG, Easter S, Seymour J, Kurrle SE, et al. Quality of life related to fear of falling and hip fracture in older women: a time trade off study. BMJ 2000;320(7231):341‐6. Hall SE, Criddle RA, Comito TL, Prince RL. A case‐control study of quality of life and functional impairment in women with long‐standing vertebral osteoporotic fracture. Osteoporosis International 1999;9(6):508‐15. Sprague S, Bhandari M. An economic evaluation of early versus delayed operative treatment in patients with closed tibial shaft fractures. Archives of Orthopaedic & Trauma Surgery 2002;122(6):315‐23. |
| Health Technology | Recombinant Bone Morphogenetic Protein‐2 (rhBMP‐2) for treatment of acute open tibial shaft fractures in skeletally mature adults. |
| Intervention(s) | 1.50 mg/mL rhBMP‐2 delivered by absorbable Type I bovine collagen sponge as an adjunct to intramedullary nail fixation (IM) with routine soft tissue management. |
| Comparator(s) | IM with routine soft tissue management. |
| Fracture type(s) | Open tibial shaft (Gustilo‐Anderson grades I, II, IIA, IIIB and IIIC). |
| Hypothesis/study question | The objective of the study is to critically appraise, modify and update an economic evaluation model to compare the incremental cost‐utility of rhBMP‐2 as an adjunct to IM with routine soft‐tissue management, versus the current standard surgical treatment of acute open tibial shaft fractures: use of IM with routine soft tissue management alone, in the UK. |
| Economic study type | Cost‐utility analysis |
| Analytic perspective | United Kingdom healthcare system. |
| Study population | A hypothetical cohort of 3330 skeletally mature adult patients with open‐tibial fractures in the UK, without any other significant co‐morbidities. These acute open tibial fracture patients are further classified into different severity groups, ranging from Gustilo‐Anderson grade I to type IIIC, according to the following distribution profile:
The study population (hypothetical cohort) is estimated based on 1997 burden of disease data provided in a report by the British Orthopaedic Association and British Association of Plastic Surgeons (BOA/BAPS 1997), which estimates an annual incidence of open tibial fractures of 5.53 per 100,000 per year, and the population of the UK in 2005 was 60,209,500. |
| Modelling and statistical extrapolation | A decision‐analytic model (decision tree structure) with a one year time horizon*. The end point of the model is ‘healed fracture (union)’ (a large majority of acute open tibial shaft fractures heal in less than one year*). Health states and transition probabilities are reported in full along with a number of modelling assumptions, for which justifications are provided in full. The model is run using the hypothetical cohort of 3,330 patients (simulations) as the intervention group and then re‐run using the same hypothetical cohort of 3,330 patients (simulations) as the control group. |
| Setting | Inpatient care (secondary care) and subsequent outpatient care (secondary care) in the UK. |
| Dates to which data relate / time horizon of costs and effects | The time horizon for costs and effects is one year* (see ‘Modelling and statistical extrapolation, above). Clinical evidence and resource use data (number of infections, number of secondary interventions and time to fracture healing (union), by grade of fracture severity, are sourced from a multi‐centre randomised controlled trial (Govender 2002), which collected these data prospectively. The model assumes one outpatient visit to a fracture clinic every four weeks before fracture healing (union). The study used 2006 UK prices (UK GBP £). |
| Clinical and epidemiological data | Clinical data utilised in the model include an effectiveness measure: time to healed fracture (union), by grade of fracture severity. Fracture union is defined by the participating clinicians in the original trial based on a combination of clinical findings (pain‐free weight bearing and lack of tenderness at fracture site), plus radiological union (three out of four cortices with bridging callus). Complications include the rate of infections and secondary interventions, both by grade of fracture severity. Secondary interventions are divided into two categories: ‘most invasive’ (bone graft, exchange nailing, plate fixation, fibular osteotomy, bone transport) and ‘less invasive’ (nail dynamisation, internal fixation to brace’). Infections are divided into three categories: ‘less severe’, ‘intermediate’ and ’severe’. Epidemiological data includes the UK population in 2005 and an annual incidence of open tibial fractures of 5.53 per 100,000. |
| Data sources | Clinical evidence and resource use data are obtained from a single study ‐ a prospective multi‐centre randomised controlled trial of the same intervention and comparator in the same patient population (Govender 2002). The authors assume one outpatient visit every four weeks before fracture healing (union). Epidemiological data are obtained from a report by the British Orthopaedic Association and British Association of Plastic Surgeons (BOA/BAPS 1997). Unit cost data are obtained from:
Utilities (disutility values due to fracture nonunion) used in the original ABACUS model (Abacus 2006) were extrapolated from estimates for older women with hip fractures (Salkeld 2000) and women with long‐standing vertebral osteoporotic fractures (Hall 1999). In the current study (Garrison 2007), based on the authors’ assumption that disutility values are likely to be overestimated in the original ABACUS model, and in the absence of alternative objective data, the current study arbitrarily assumes disutility values to be 30% smaller than those used in the original ABACUS model (i.e. a more conservative assumption). (See ‘Measure of health benefits used in the economic analysis’, below, for further details). See related publications for bibliographic details. |
| Methods used to obtain data | See ‘Data sources’, above. |
| Link between effectiveness and cost data | The collection of resource use data was undertaken prospectively on the patient sample in the study which provided the clinical evidence and resource use data used in the model (Govender 2002). |
| Study sample (effectiveness data) | Not applicable: clinical and epidemiological evidence is derived from more than one study (see ‘Data sources’ above). |
| Study design (effectiveness data) | Not applicable: clinical and epidemiological evidence is derived from more than one study (see ‘Data sources’ above). |
| Analysis of effectiveness | Not applicable: clinical and epidemiological evidence is derived from more than one study (see ‘Data sources’ above). |
| Effectiveness results | Not applicable: clinical and epidemiological evidence is derived from more than one study (see ‘Data sources’ above). |
| Clinical conclusions | Not applicable: clinical and epidemiological evidence is derived from more than one study (see ‘Data sources’ above). |
| Measure of health benefits used in the economic analysis / methods used to value benefits / Details of subjects from whom valuations were obtained | The principal measure of health benefits used in the cost‐utility analysis is the quality‐adjusted life year (QALY). Utilities (disutility values due to fracture nonunion) are extrapolated from estimates for older women with hip fractures (Salkeld 2000) and women with long‐standing vertebral osteoporotic fractures (Hall 1999). The study authors state that “Salkeld and colleagues used the time trade‐off technique to estimate the utility associated with hip fracture and fear of falling among older women (aged ≧ 75 years). The baseline utility value (EQ‐50) was 0.77 for interviewed women. They found that a ‘bad’ hip fracture (which results in admission to a nursing home) was valued at 0.05 and a ‘good’ hip fracture (maintaining independent living in the community) 0.31. The disutility value for a ‘good’ hip fracture could be estimated as 0.46 (0.77‐0.31), on which it seems that the disutility value used for Gustilo‐Anderson grade IIIB/C open tibial fracture nonunion in the original ABACUS model was based. Hall and colleagues measured QoL in women with long‐standing vertebral osteoporotic fracture and age‐matched normal women, using the SF‐36. Then SF‐36 scores were transformed to a utility score by the Fryback technique. It was found that the utility score was 0.64 for women with vertebral fracture and 0.72 for controls. The difference in the utility scores between the two groups is 0.08 (0.72‐0.64). However, it is not clear how this estimate has been used to estimate disutility values in the ABACUS model. It is highly questionable whether the results from Salkeld and colleagues’ study of hip fracture and Hall and colleagues’ study of vertebral osteoporotic fracture are generalisable to patients with OTF. We identified a further study of economic evaluation of patients with closed tibial shaft fractures (New Reference). Based on expert opinion, the utility value estimated was 0.9 for returning to normal activities, 0.5 for nonunion, 0.6 for delayed union and 0.5 for experiencing a postoperative complication. This study estimated the utility value based on expert opinion, which was subjective and may not truly reflect patient opinion. Fracture union in the BESTT trial was defined by a combination of pain‐free weight bearing and lack of tenderness at fracture site plus radiological union (three out of four cortices with bridging callus). Hence the QoL of patients may not be much different from normal many weeks before the defined fracture union. For example, a patient with pain‐free weight bearing and lack of tenderness at the fracture site did not meet the criteria for fracture union if radiological union was not achieved. Therefore, the original ABACUS model may has overestimated the disutility values due to delayed union.” In the revised model (Garrison 2007), based on the authors’ assumption that disutility values are likely to be overestimated in the original ABACUS model, and in the absence of alternative objective data, disutility values are arbitrarily assumed be 30% smaller than those used in the original ABACUS model (i.e. a more conservative assumption). The quality‐adjusted life‐years (QALYs) gained by the use of BMP are estimated based on the number of open tibial fracture patients, the additional well‐patient weeks gained per intervention group patient (see table below) and assumed disutility values. Average (mean) number of well‐patient weeks gained per patient
That is, for each open tibial fracture severity category, the QALYs gained are calculated by: QALY = (Ntf × Wpw/52) × Duv Where:
Average (mean) time to fracture union per patient (weeks): All open fractures*
Gustilo‐Anderson grade IIIC:
Gustilo‐Anderson grade IIIB:
Gustilo‐Anderson grade IIIA:
Gustilo‐Anderson grade II:
Gustilo‐Anderson grade I:
|
| Source(s) of unit cost data | Direct medical costs (health service): The most up‐to‐date data available UK national sources are used for each unit cost. Standard treatment of open tibial fracture (IM with routine soft tissue management) by severity type:
rhBMP‐2: 1.50 mg/mL delivered by Inductos absorbable Type I bovine collagen sponge:
Infections:
Secondary interventions: Most invasive:
Less invasive:
Outpatient contacts (cost per outpatient contact):
|
| Currency | UK GBP (£) |
| Price year | 2006 |
| Direct medical resource use: rhBMP‐2 | rhBMP‐2: 1.50 mg/mL delivered by Inductos absorbable Type I bovine collagen sponge, per patient. |
| Direct medical costs: rhBMP‐2 | £1790 per patient |
| Direct medical resource use: Operative time (minutes) | Operative time is not measured directly in this study, but is incorporated into the reference cost for ‘Open Lower Limb Fractures or Dislocations’ (see ‘Sources of unit cost data’, above). Since the same reference cost is used in the model with respect to both the intervention and control groups, it is implicit that the model assumes no difference in operative time (duration of operation) or cost between the intervention and control groups. |
| Direct medical unit costs: Operative time (per minute/ per hour) | Operative time is not measured directly in this study, but is incorporated into the reference cost (code) for ‘Open Lower Limb Fractures or Dislocations’ (see ‘Sources of unit cost data’, above). Since the same reference cost is used in the model with respect to both the intervention and control groups, it is implicit that the model assumes no difference in operative time (duration of operation) or cost between the intervention and control groups. |
| Direct medical resource use: Length of postoperative hospital stay (days) | Length of postoperative hospital stay is not measured directly in this study, but is incorporated into the reference cost (code) for ‘Open Lower Limb Fractures or Dislocations’ (see ‘Sources of unit cost data’, above). Since the same reference cost is used in the model with respect to both the intervention and control groups, it is implicit that the model assumes no difference in length or cost of postoperative hospital stay between the intervention and control groups. |
| Direct medical unit costs: Postoperative hospital stay (per day) |
Length of postoperative hospital stay is not measured directly in this study, but is incorporated into the reference cost (code) for ‘Open Lower Limb Fractures or Dislocations’ (see ‘Sources of unit cost data’, above). Since the same reference cost is used in the model with respect to both the intervention and control groups, it is implicit that the model assumes no difference in length or cost of postoperative hospital stay between the intervention and control groups. |
| Direct medical resource use: Other* | Standard treatment of open tibial fracture (IM with routine soft tissue management) by severity type: All open fractures:
Gustilo‐Anderson grade IIIC:
Gustilo‐Anderson grade IIIB:
Gustilo‐Anderson grade IIIA:
Gustilo‐Anderson grade II:
Gustilo‐Anderson grade I:
Less severe infections: All open fractures:
Gustilo‐Anderson grade IIIC:
Gustilo‐Anderson grade IIIB:
Gustilo‐Anderson grade IIIA:
Gustilo‐Anderson grade II:
Gustilo‐Anderson grade I:
Intermediate infections: All open fractures:
Gustilo‐Anderson grade IIIC:
Gustilo‐Anderson grade IIIB:
Gustilo‐Anderson grade IIIA:
Gustilo‐Anderson grade II:
Gustilo‐Anderson grade I:
Severe infections: All open fractures:
Gustilo‐Anderson grade IIIC:
Gustilo‐Anderson grade IIIB:
Gustilo‐Anderson grade IIIA:
Gustilo‐Anderson grade II:
Gustilo‐Anderson grade I:
Secondary interventions: ‐ Most invasive: Bone Graft: All open fractures:
Gustilo‐Anderson grade IIIC:
Gustilo‐Anderson grade IIIB:
Gustilo‐Anderson grade IIIA:
Gustilo‐Anderson grade II:
Gustilo‐Anderson grade I:
Exchange nailing: All open fractures:
Gustilo‐Anderson grade IIIC:
Gustilo‐Anderson grade IIIB:
Gustilo‐Anderson grade IIIA:
Gustilo‐Anderson grade II:
Gustilo‐Anderson grade I:
Plate fixation: All open fractures:
Gustilo‐Anderson grade IIIC:
Gustilo‐Anderson grade IIIB:
Gustilo‐Anderson grade II:
Fibular osteotomy: All open fractures:
Gustilo‐Anderson grade IIIC:
Gustilo‐Anderson grade IIIB:
Gustilo‐Anderson grade IIIA:
Gustilo‐Anderson grade II:
Gustilo‐Anderson grade I:
Bone Transport: All open fractures:
Gustilo‐Anderson grade IIIC:
Gustilo‐Anderson grade IIIB:
Gustilo‐Anderson grade IIIA:
Gustilo‐Anderson grade II:
Gustilo‐Anderson grade I:
‐ Less invasive: Nail dynamisation: All open fractures:
Gustilo‐Anderson grade IIIB:
Gustilo‐Anderson grade IIIA:
Gustilo‐Anderson grade II:
Gustilo‐Anderson grade I:
Internal fixation to brace: All open fractures:
Gustilo‐Anderson grade IIIC:
Gustilo‐Anderson grade IIIB:
Gustilo‐Anderson grade IIIA:
Gustilo‐Anderson grade II:
Gustilo‐Anderson grade I:
Outpatient contacts: The model assumes one outpatient visit every four weeks before fracture healing (union): All open fractures:
Gustilo‐Anderson grade IIIC:
Gustilo‐Anderson grade IIIB:
Gustilo‐Anderson grade IIIA:
Gustilo‐Anderson grade II:
Gustilo‐Anderson grade I:
|
| Direct medical unit costs: Other | Standard treatment of open tibial fracture (IM with routine soft tissue management) by severity type (includes operative time and postoperative hospital stay):
Infections:
N.B. The model assumed the unit cost for intermediate infections to be the mean unit cost for all infections. In the sensitivity analysis, the unit cost for less severe infections and the unit cost for severe infections were used, respectively, as the minimum and maximum unit cost values of the distribution from which values were drawn (see ‘Methods used to allow for uncertainty’, below). Secondary interventions: ‐ Most invasive:
‐ Less invasive:
Outpatient contacts (cost per outpatient contact):
|
| Average (mean) total direct medical costs | Intervention (rhBMP‐2 with IM and routine soft tissue management) *,**: All open fractures (cost per patient):
Gustilo‐Anderson grade IIIC (cost per patient):
Gustilo‐Anderson grade IIIB (cost per patient):
Gustilo‐Anderson grade IIIB and grade IIIA (cost per patient):
Gustilo‐Anderson grade IIIA (cost per patient):
Gustilo‐Anderson grade II (cost per patient):
Gustilo‐Anderson grade I (cost per patient):
|
| Productivity resource use: Employment status before and after treatment | Not measured. |
| Productivity resource use: number and/ or time return to work (for those patients in employment before treatment)/ lost or reduced productivity (time off work) | Not measured. |
| Productivity unit costs: lost or reduced productivity (time off work) | Not measured. |
| Average (mean) total productivity costs (time off work) | Not measured. |
| Average total non‐medical costs (e.g. patient out‐of‐pocket expenses) | Not measured. |
| Average (mean) total costs | See ‘Average (mean) total direct medical costs’, above. |
| Discount rate used and justification | Discounting is not discussed. However, discounting is not appropriate as the time horizon of the model was one year*. |
| Explanation if costs and effects are not discounted | Discounting is not discussed. However, discounting is not appropriate as the time horizon of the model was one year*. |
| Statistical analysis of costs | Costs are analysed using probabilistic simulations, which allow a range of input values 50% greater or smaller than the point estimates of all resource use, cost and effects parameters. |
| Methods used to allow for uncertainty | The authors perform probabilistic sensitivity analysis to investigate parameter uncertainty. Uncertainty is evaluated in all key cost and effectiveness parameters. Ranges over which variables were tested are determined based on the authors’ own assumptions. Specifically, probabilistic simulations (10,000 Monte Carlo simulations) are generated using a range of input values 50% greater or smaller than the point estimates. Therefore, the variance of the point estimate (mean) of direct medical costs per patient, and the distances between the lower limit of the 95% CI and the mean, and between the mean and the upper limit of the 95% CI, are in part determined by these assumptions. The authors report that: “There is a 35.5% probability that the cost per QALY gained by the use of BMP for open tibial fractures is less than £30,000. The ICER is highly sensitive to the price of rhBMP‐2. If the price of rhBMP‐2 is reduced by about 20% (that is, from £1790 to £1432), the estimated cost per QALY gained will be £21,534, based on the input values used in the modified model.” Structural uncertainty within the model is not investigated. |
| Synthesis of costs and benefits | The study reports cost‐effectiveness results in terms of incremental cost per QALY. |
| Incremental cost‐effectiveness results* | Incremental cost per QALY
The authors state of the sensitivity analysis that: “There is a 35.5% probability that the cost per QALY gained by the use of BMP for [all] open tibial fractures is less than £30,000. The ICER is highly sensitive to the price of rhBMP‐2. If the price of rhBMP‐2 is reduced by about 20% (that is, from £1790 to £1432), the estimated cost per QALY gained will be £21,534, based on the input values used in the modified model.” The authors also report that if the price of rhBMP‐2 were reduced by 40% (from £1790 to £1074), the estimated cost per QALY gained will be £10,465 (95% CI or measure of variance not reported). A secondary sensitivity analysis was conducted for the current Cochrane review using the revised model supplied by the authors**. This shows that:
This secondary sensitivity analysis suggests a further caveat is needed for the authors’ conclusion that “cost‐effectiveness may be improved if BMP is used only for grade III acute open tibial fractures”. Whilst use of BMP for grade IIIC and IIIB acute open tibial fractures is very likely to be cost‐effective, it appears that use of BMP for grade IIIA acute open tibial fractures is less likely to be cost‐effective. |
| Authors conclusions | The authors main conclusions are that the incremental cost‐effectiveness ratio is highly sensitive to the price of rh‐BMP2 and that cost‐effectiveness may be improved if BMP is used only for Gustilo‐Anderson grade III acute open tibial fractures (i.e. for the most severe fractures). |
| Commentary |
Choice of comparator: Although no explicit justification is provided for the comparator used, it would appear to represent standard practice in the authors’ setting in 2006/07. End‐users of this review should decide if the comparator represents current practice in their own setting. Modelling: The structure of the model, including a graphical representation and modelling assumptions is reported. Data sources for all parameters are reported in full. *Although not reported, additional information obtained from the authors indicates the time horizon of the model (costs and effects) is one year (Song, personal communication). The authors investigate uncertainty using a probabilistic sensitivity analysis. Sensitive parameters are reported. Uncertainty is evaluated in all key cost and effectiveness parameters. Structural uncertainty is not assessed. Validity of estimate of costs: Costs are assessed from the perspective of the UK healthcare system. It appears that, given the perspective adopted, all relevant categories of costs (resource use) are included in the analysis. Quantities of resource use are not reported separately from aggregated cost data in the original study. Details of quantities of resource use reported above are extracted from unpublished data provided by the study authors. Unit cost data are reported in full in the original study, separately from aggregated cost data. Other issues: The authors do not compare the principal findings of their study with those from other studies. The authors’ conclusions appear to follow from the data reported in the original study. The authors may have presented their results selectively in the original study. In the original study, incremental average (mean) cost per QALY is reported for all open fractures and for Gustilo‐Anderson grade III fractures (i.e. IIIA, IIIB, and IIIC combined), but not for Gustilo‐Anderson grades IIIA, IIIB, or IIIC fractures separately, nor for Gustilo‐Anderson II or grade I fractures. The same is true with respect to average (mean) direct medical costs per patient. The authors discuss one limitation of the study: that there is currently a lack of objective data on utility (disutility) values associated with open tibial fractures. Whilst the authors attempt to deal with this by assuming more conservative utility values in the revised model compared to those used in the original industry‐sponsored model (which were based on values associated with hip fracture and fear of falling among older women and values associated with long‐standing vertebral osteoporotic fracture in women), the revised assumption is acknowledged by the authors to be arbitrary. |
| * Based on additional information and/or original dataset supplied by the authors. **Based on secondary analysis of the original dataset (conducted by IS). ***Based on the cost effectiveness acceptability curve (CEAC). | |
| Jones 2004 | |
| Country code | United States of America. |
| Publication language | English. |
| Funding source for study | Not stated. |
| Other published or unpublished versions of study | Jones AL. Recombinant human bone morphogenetic protein‐2 in fracture care. Journal of Orthopaedic Trauma 2005;19(10 Suppl):S23‐5. |
| Related publications | Govender S, Csimma C, Genant HK, Valentin‐Opran A, Amit Y, Arbel R, et al. Recombinant human bone morphogenetic protein‐2 for treatment of open tibial fractures ‐ A prospective, controlled, randomized study of four hundred and fifty patients. Journal of Bone & Joint Surgery ‐ American Volume 2002;84(12):2123‐34. |
| Health Technology | Recombinant Bone Morphogenetic Protein‐2 (rhBMP‐2) for treatment of acute open tibial shaft fractures in skeletally mature adults. |
| Intervention(s) | 1.50 mg/mL rhBMP‐2 delivered by absorbable Type I bovine collagen sponge as an adjunct to intramedullary nail fixation (IM) with routine soft tissue management. |
| Comparison(s) | IM with routine soft tissue management. |
| Fracture type(s) | Acute open tibial shaft (Gustilo‐Anderson types I, II, IIIA and IIIB). |
| Hypothesis/study question | The objective of the study is to compare the costs associated with use of rhBMP‐2 as an adjunct to IM with routine soft‐tissue management, versus the costs associated with the current standard surgical treatment of acute open tibial shaft fractures: use of IM with routine soft tissue management alone. |
| Economic study type | Cost analysis. |
| Analytic perspective | The study assesses costs from two perspectives: single provider (hospital ‐ i.e. direct medical costs and revenues for inpatient services) and third‐party payer (insurer ‐ i.e. direct medical costs of the physician and inpatient and outpatient services). |
| Study population | The randomised population in the multi‐centre prospective randomised controlled trial from which the population in this cost analysis was drawn (Govender 2002) comprises 450 skeletally mature adult patients with open tibial shaft fractures of varying severity (Gustilo‐Anderson types I, II, IIIA and IIIB). Exclusion criteria are not reported. The study population included in this cost analysis (Jones 2004) comprises a sub‐group of 292 patients drawn from the intention‐to‐treat (ITT) population of the above trial (Intervention group = 145, Comparison group = 147). |
| Modelling and statistical extrapolation | Trial participants were observed to one year follow‐up but the stated time horizon for the cost analysis is two years. Statistical methods used to extrapolate measures of medical resource use (e.g. numbers of secondary and subsequent interventions) over a two‐year period from the observed measures (one‐year) are not reported. |
| Setting | Inpatient care (secondary care) and subsequent outpatient care (secondary care). The setting for the cost analysis is the United States. The randomised population in the trial from which the population in this cost analysis is drawn (Govender 2002) were recruited at 49 centres (hospitals) in 11 countries: Australia, Belgium, Canada, Finland, France, Germany, Israel, Netherlands, Norway, South Africa, United Kingdom. |
| Dates to which data relate / time horizon of costs and effects | The time horizon for costs (resource use) is two years. Resource use data were collected prospectively between April 2007 and December 1999 (Govender 2002) over a one year follow‐up period. The study uses 2003 prices (USD $). |
| Clinical and epidemiological data | Not applicable: The study derives all clinical evidence used to estimate resource use from a single study (Govender 2002). Resource use data were collected prospectively within this single study: a multi‐centre prospective randomised controlled trial (Govender 2002). |
| Data sources | Not applicable: The study derives all clinical evidence used to estimate resource use data utilised in the cost‐analysis from a single study (Govender 2002). |
| Methods used to obtain data | Not applicable: The study derives all clinical evidence used to estimate resource use data utilised in the cost‐analysis from a single study (Govender 2002). |
| Link between effectiveness and cost data | Not applicable: the study is a cost analysis. Resource use data were collected prospectively within a single study: a multi‐centre prospective randomised controlled trial (Govender 2002). |
| Study sample (effectiveness data) | Not applicable: the study is a cost analysis. Study uses clinical evidence on complications and revision procedures to estimate ‘downstream’ cost‐differences between the experimental and comparator interventions. |
| Study design (effectiveness data) | Not applicable: the study is a cost analysis. However, estimates of resource use are based on clinical data relating to complications and revision procedures, sourced from a randomised controlled trial (Govender 2002). |
| Analysis of effectiveness | Not applicable: the study is a cost analysis. |
| Effectiveness results | Not applicable: the study is a cost analysis. |
| Clinical conclusions | Not applicable: the study is a cost analysis. |
| Measure of benefits used in the economic analysis / methods used to value benefits / Details of subjects from whom valuations were obtained | Not applicable: the study is a cost analysis. |
| Source(s) of unit cost data | The authors state only that unit costs were obtained from national hospital and ambulatory data (United States). Average costs (i.e. the total cost divided by the number of units provided) per patient are reported in this study. |
| Currency | US Dollars ($) |
| Price year | 2003 |
| Direct medical resource use: rhBMP‐2 | 1.50 mg/mL per patient (fixed dosage) |
| Direct medical costs: rhBMP‐2 | $4900 per patient (fixed cost). The source of this unit cost is not reported. |
| Direct medical resource use: Operative time (minutes) | Operative time (minutes) is not reported. |
| Direct medical unit costs: Operative time (per minute/ per hour) | Unit cost of operative time (minutes) is not reported. |
| Direct medical resource use: Length of postoperative hospital stay (days) | Length of postoperative hospital stay (days) is not reported. |
| Direct medical unit costs: Postoperative hospital stay (per day) | Unit cost of length of postoperative hospital stay (days) is not reported. |
| Direct medical resource use: Other | Fracture fixation, wound procedures before and during definitive wound closure, secondary and subsequent interventions, complications and infections. Numbers by treatment group (two year period) are not reported. |
| Direct medical unit costs: Other | Unit costs relating to other direct medical resources are not reported. |
| Average (mean) total direct medical costs |
Single provider (hospital) perspective ‐ inpatient care only; base case (assuming no cost reimbursement for rhBMP‐2); two‐year costs.
Cost offsets associated with:
Insurer (third‐party payer) perspective ‐ inpatient care and outpatient care; base case (assuming no cost reimbursement for rhBMP‐2); two‐year costs:
Cost offsets associated with:
Details of any statistical tests undertaken to assess distributions of individual‐level (per patient) cost data around point estimates are not reported. |
| Productivity resource use: Employment status before and after treatment | Not measured. |
| Productivity resource use: number and/ or time return to work (for those patients in employment before treatment)/ lost or reduced productivity (time off work) | Not measured. |
| Productivity unit costs: lost or reduced productivity (time off work) | Not measured. |
| Average (mean) total productivity costs (time off work) | Not measured. |
| Average (mean) total non‐medical costs (e.g. patient out‐of‐pocket expenses) | Not measured. |
| Average (mean) total costs | See ‘Average (mean) total direct medical costs’, above. |
| Discount rate used and justification | Discounting is not reported or discussed. Discounting is appropriate as the time horizon of the analysis is two years. |
| Explanation if costs and effects are not discounted | Discounting is not reported or discussed. Discounting is appropriate as the time horizon of the analysis is two years. |
| Statistical analysis of costs | Mean costs are reported but no standard errors, standard deviations or confidence intervals are reported. Details of any statistical tests that may have been undertaken to assess distributions of individual‐level (per patient) cost data around point estimates are not reported. |
| Methods used to allow for uncertainty | The authors conduct a one‐way sensitivity analysis using estimated cost data, which involved varying the assumed percentage of up‐front costs of rhBMP‐2 ($4,900) reimbursed by a third‐party payer to three levels: 0% (base case), 50% and 100%: Base case: See ‘Average (mean) total direct medical costs’, above. 50% reimbursement: Single provider (hospital) perspective ‐ inpatient care only; two‐year costs:
Insurer (third‐party payer) perspective ‐ inpatient care and outpatient care; two‐year costs:
100% reimbursement: Single provider (hospital) perspective ‐ inpatient care only; two‐year costs:
Insurer (third‐party payer) perspective ‐ inpatient care and outpatient care; two‐year costs:
No other sensitivity analysis is reported. Details of any statistical tests undertaken to assess distributions of individual‐level (per patient) cost data around point estimates are not reported. |
| Synthesis of costs and benefits | Not applicable ‐ study is a cost analysis. |
| Incremental cost‐effectiveness results | Not applicable ‐ study is a cost analysis. |
| Authors conclusions | The authors conclude that: “The clinical benefits of rhBMP‐2 translate into substantial reductions in medical resource utilization and costs over a 2‐year time horizon. From a payer's perspective, if hospitals are reimbursed for half the cost of rhBMP‐2, then the entire rhBMP‐2 cost will be offset because of fewer downstream clinical events such as SI and infections. For hospitals, lack of rhBMP‐2 reimbursement by payers results in limited cost offsets. When payers' rhBMP‐2 reimbursement policies are more generous (e.g. reimbursement 50% of the rhBMP‐2 cost), considerable cost offsets are achieved by both payers and hospitals. Patients, physicians, payers, and hospitals should consider both the clinical and economic benefits of use of rhBMP‐2 associated with avoiding delayed union or nonunion, infections, and SI. This economic analysis suggests that rhBMP‐2 reimbursement policy is important in determining the economic value of rhBMP‐2 from the payer and hospital perspectives. Favourable economic results can be achieved for both stake‐holders with partial or full reimbursement of the rhBMP‐2 cost.” |
| Commentary |
Choice of comparator: Although no explicit justification is provided for the comparator used, it would appear to represent standard practice in the authors’ setting in 2003. End‐users of this review should decide if the comparator represents current practice in their own setting. Modelling: Not applicable study does not use a formal economic model. Validity of estimate of costs: The analysis of costs is performed from two perspectives: those of the single provider (hospital) and the insurer (third‐party payer). It appears that, given the perspectives adopted, most relevant categories of costs (resource use) are included in the analysis. As the analysis does not include costs borne by employers, the patient and their families (e.g. productivity costs, costs of informal care, other out‐of‐pocket expenses), it is likely that the reported cost savings associated with the clinical benefits accruing from the use of BMP‐2 are underestimated, from a societal perspective. Limitations of reporting estimates of costs are that measures of resource use are not reported separately from their unit costs and measures of variance (e.g. standard deviations, standard errors) are not reported for mean values. Other issues: The authors do not compare their findings with those from other studies. The authors do not acknowledge or address the issue of potential variations in treatment costs between patients with tibial shaft fractures of different severities. The authors do not appear to have reported results selectively. Although this cost analysis is based on a sub‐group of the intention‐to‐treat population within the trial utilised as the source of resource use data, this decision may be attributable to the clinical results of the source trial, which indicate that only the 1.5 mg/mL concentration of rhBMP‐2 and not the 0.75 mg/mL concentration demonstrate clinical efficacy compared to standard care. In general, the authors’ conclusions appear to follow from the data reported. The authors state that “from a payer's perspective, if hospitals are reimbursed for half the cost of rhBMP‐2, then the entire rhBMP‐2 cost will be offset because of fewer downstream clinical events such as SI and infections”. This statement is reasonable based on the data reported. However, an alternative but equally reasonable conclusion would have been that from a third‐party payer perspective (and taking into account cost offsets associated with fewer downstream clinical events), the entire up‐front cost of rhBMP‐2 ($4,900) is offset if hospitals are reimbursed at a rate of 29%, and also that from a single provider (hospital) perspective, (again, taking into account cost offsets associated with fewer downstream clinical events), 9% of the up‐front cost of rhBMP‐2 is offset if hospitals are reimbursed at a rate of 100%. Only a very limited sensitivity analysis is reported, so it is not clear how much confidence we can have in the study conclusions. The authors do not discuss any limitations of their study. |
| van Engen 2003 | |
| Country code | United Kingdom and Germany. |
| Publication language | English. |
| Funding source for study | Not reported. |
| Other published or unpublished versions of study | None. |
| Related publications | Not clear ‐ none reported. The authors state only that “Data on efficacy were obtained from clinical trials and literature”. |
| Health Technology | Osteogenic Protein 1 (OP‐1 ‐ Osigraft® ‐ BMP‐7) for the treatment of nonunion tibial fractures in skeletally mature adults. |
| Intervention(s) | OP‐1 (BMP‐7) as an adjunct to intramedullary nail fixation (IM) with routine soft tissue management. Dose and delivery mechanism are not reported. The authors assume that IM has already been performed as an initial surgery following the injury, prior to diagnosis of nonunion. |
| Comparator(s) | United Kingdom: 1. Autograft (autogenous iliac crest bone graft) as an adjunct to IM with routine soft tissue management. 2. Ilizarov fixation as an adjunct to IM with routine soft tissue management. The authors assume that IM has already been performed as an initial surgery following the injury, prior to diagnosis of nonunion. Germany: Usual care ‐ Fixation with a nail or plate as an adjunct to IM with routine soft tissue management, with autograft (autogenous iliac crest bone graft) if appropriate. The authors assume that IM has already been performed as an initial surgery following the injury, prior to diagnosis of nonunion. |
| Fracture type(s) | Nonunion tibial shaft fractures (range of severity not reported). |
| Hypothesis/study question | The objective of the study is to compare the cost‐effectiveness of OP‐1 (BMP‐7) as an adjunct to IM with routine soft‐tissue management, versus the current standard of surgical treatment of nonunion tibial fractures in the UK and Germany respectively: autograft (autogenous iliac crest bone graft) as an adjunct to IM with routine soft‐tissue management (UK); Ilizarov fixation as an adjunct to IM with routine soft‐tissue management (UK); fixation with a nail or plate, with autograft (autogenous iliac crest bone graft) when appropriate (Germany). |
| Economic study type | Cost‐effectiveness analysis. |
| Analytic perspective | The perspective of the study is a single provider (hospital). |
| Study population | The study population comprises skeletally mature adults treated in a hospital for a tibial nonunion acquired secondary to trauma. The authors state that “These patients were candidates for autograft. In this study a nonunion is defined as a tibial fracture which has not shown radiographic evidence of union for the preceding 9 months after injury. The patient has not undergone surgical intervention nor has he/she shown evidence of healing in the last three months before treatment.” Further details of the main characteristics of the study population are not reported. |
| Modelling and statistical extrapolation | A decision‐analytic model (decision tree structure) based on clinical decisions that could take place at each stage of treatment following diagnosis of a tibial nonunion fracture, according to a panel of experts (orthopaedic surgeons) in each country (UK and Germany). Health states and transition probabilities are presented in full in the paper along with modelling assumptions. The time horizon of the model is not reported; however the authors state that “The model covers one treatment period for the tibial nonunion, with ‘non healing’ as the end point for those patients whose nonunion did not heal after one round of treatment.” |
| Setting | Inpatient care (secondary care) and subsequent outpatient care (secondary care) in the UK and in Germany respectively. |
| Dates to which data relate / time horizon of costs and effects | The time horizon for costs and effects is not reported. Dates of collection of resource use data and beneficial and adverse effects data are not reported. The study used 2001 prices (UK GBP £ and German Euros €). |
| Clinical and epidemiological data | Clinical data includes an effectiveness measure, time to healed fracture (union). The authors state that “In this study a nonunion is defined as a tibial fracture which has not shown radiographic evidence of union for the preceding 9 months after injury. The patient has not undergone surgical intervention nor has he/she shown evidence of healing in the last three months before treatment.” Clinical data relating to four categories of complications are included in the model: osteomyelitis, infection of the operation site, hardware events and (for autograft ‐ AICBG ‐ patients only) donor site morbidity. The authors state that “The treatment plan and distribution of the different adverse events (complications) are independent of nonunion treatment. However, the incidence of an adverse event is dependent on nonunion treatment.” |
| Data sources | The source(s) of the clinical and epidemiological data utilised in the model are not described clearly. The authors state only that: “Data on efficacy were obtained from clinical trials and literature.” Resource use data: The authors state that: “Estimates for health care utilisation for treatment of the tibial nonunion were derived from country‐specific expert panels using a modified Delphi method.” Cost data: The authors state that: “Costs were based on current costing data for UK and German hospitals, including the price to the hospital of medications, procedures, consultations, and the hospital bed cost. Follow‐up outpatient treatment, including physical therapy and consultations were also included. For all resources, 2001 reimbursement rules were applied according to the tariff lists: lists of prices of drugs, consultations, procedures and hospitalisation. In the UK, the unit costs for medications were obtained from the British National Formulary. Procedures, hospitalisations, and consultations were valued, wherever possible, according to the costs reported in the “Unit Costs of Health and Social Care” published by the Personal Social Services Research Unit (PSSRU) at the University of Kent. For the hospitalisation costs, costs per day are reported in the PSSRU. For Germany, the unit costs for medications were obtained from the Rote Liste. Procedures and consultations were valued, wherever possible, according to official Einheitlicher Bewertungsmaßstab (EBM) tariffs published by the Kassenärztliche Bundesvereinigung (KBV). Hospitalisation was valued according to the Statistisches Bundesamt 2000. The price of one treatment with Osigraft® [BMP‐7] was set at £2,720 and £4,400 respectively.” |
| Methods used to obtain data | The source(s) of the clinical and epidemiological data utilised in the model are not described clearly. The authors state only that: “Data on efficacy were obtained from clinical trials and literature”. Resource use data: The authors state that: “Estimates for health care utilisation for treatment of the tibial nonunion were derived from country‐specific expert panels using a modified Delphi method. A panel consisting of seven practising orthopaedic surgeons from the UK and 7 traumatologists from Germany were interviewed. These were one‐on‐one interviews performed by telephone. Disease specific questionnaires were developed to capture health resource utilisation with the use of sample patient profiles representing cases along the alternative clinical pathways of the model.” Unit cost data: the authors state that: “Cost estimates for direct medical care were based on estimating the units of health care utilisation and their respective costs (using the sources described in ‘Data Sources’, above). As such, instead of a single overall charge billed for total health care resource use, individual items of medical resource utilisation are costed, and the net cost is the aggregate of all costed items.” The study reports principal cost and utilisation parameters underlying the model in full. |
| Link between effectiveness and cost data | Not applicable: study does not appear to be based on a single source of clinical evidence. |
| Study sample (effectiveness data) | Not applicable: study does not appear to be based on a single source of clinical evidence. |
| Study design (effectiveness data) | Not applicable: study does not appear to be based on a single source of clinical evidence. |
| Analysis of effectiveness | Not applicable: study does not appear to be based on a single source of clinical evidence. |
| Effectiveness results | Not applicable: study does not appear to be based on a single source of clinical evidence. |
| Clinical conclusions | Not applicable: study does not appear to be based on a single source of clinical evidence. |
| Measure of health benefits used in the economic analysis / methods used to value benefits / Details of subjects from whom valuations were obtained | The principal measure of health benefits used in the cost‐effectiveness analysis is ‘time to healed fracture (union)’. These data are not reported. Rates of healed fractures (unions) included in the UK and German models, by treatment strategy, are as follows: UK
Germany
The study is a cost‐effectiveness analysis, so health benefits are not valued. |
| Source(s) of unit cost data | Direct medical costs (hospital): UK
Germany
For both UK and Germany, the data source(s) for the cost of OP‐1 (BMP‐7) is (are) not specified. Average costs (i.e. the total cost divided by the number of units provided) per patient are reported in this study. |
| Currency | UK: GBP (£) Germany: Euros (€) ‐ Germany |
| Price year | The price year is 2001. |
| Direct medical resource use: rhOP‐1 (BMP‐7) | Dosage per patient not specified (“one treatment”). |
| Direct medical costs: rhOP‐1 (BMP‐7) |
For both UK and Germany, the data source(s) for the cost of OP‐1 (BMP‐7) is (are) not specified. |
| Direct medical resource use: Operative time (minutes) | Standard deviations, standard errors or 95% CIs are not reported. Average (mean) minutes per patient. UK
Germany
|
| Direct medical unit costs: Operative time (per minute/ per hour) |
UK £400 per hour per patient (= £6.67 per min) Germany €103 per hour per patient (= €1.72 per min) |
| Direct medical resource use: Length of postoperative hospital stay (days) | Standard deviations, standard errors or 95% CIs are not reported. Average (mean) days per patient. UK
Germany
|
| Direct medical unit costs: Postoperative hospital stay (per day) |
UK £223 per day per patient Germany €309 per day per patient |
| Direct medical resource use: Other |
Standard deviations, standard errors or 95% CIs are not reported. 1. Personnel: Not reported. 2. Number of consultations during inpatient follow‐up: Not reported. 3. Number of consultations during outpatient follow‐up: Not reported. 4. Number of complications: Osteomyelitis: Not reported. 5. Number of complications: Infection of the operation site: Not reported. 6. Number of complications: Hardware events: Not reported. 7. Number of complications: Donor site morbidity: Not reported. |
| Direct medical unit costs: Other | 1. Personnel: UK: £718 (OP‐1 (BMP‐7)); £948 (Autograft); £2356 (Ilizarov) Germany: €191 (OP‐1 (BMP‐7)); €287 (Usual care) 2. Consultation during inpatient follow‐up: UK: £105 (OP‐1 (BMP‐7)); £116 (Autograft); £222 (Ilizarov) Germany: €104 (OP‐1 (BMP‐7)); €104 (Usual care) 3. Consultation during outpatient follow‐up: UK: £246 (OP‐1 (BMP‐7)); £216 (Autograft); £704 (Ilizarov) Germany: €415 (OP‐1 (BMP‐7)); €415 (Usual care) 4. Complication: Osteomyelitis: UK: £11,102 per patient Germany: €13,392 per patient 5. Complication: Infection of the operation site: UK: £2932 per patient Germany: €6876 per patient 6a. Complication: Hardware event UK: £2651 per patient Germany: €4189 per patient 6b. Complication: Hardware event ‐ Ilizarov UK: £621 per patient Germany: N/A 7. Complication: Donor site morbidity UK: £2241per patient Germany: €4881per patient |
| Average (mean) total direct medical costs | Standard deviations, standard errors or 95% CIs are not reported. Cost per patient. UK
Germany
|
| Productivity resource use: Employment status before and after treatment | Not measured. |
| Productivity resource use: number and/ or time return to work (for those patients in employment before treatment)/ lost or reduced productivity (time off work) | Not measured. |
| Productivity unit costs: lost or reduced productivity (time off work) | Not measured. |
| Average (mean) total productivity costs (time off work) | Not measured. |
| Average total non‐medical costs (e.g. patient out‐of‐pocket expenses) | Not measured. |
| Average (mean) total costs | See ‘Average (mean) total direct medical costs’ (above) |
| Discount rate used and justification | Discounting is not reported or discussed. It is not known whether discounting is appropriate as time horizon of model is not reported. The authors state only that: “The model covers one treatment period for the tibial nonunion, with ‘non‐healing’ as the end point for those patients whose nonunion did not heal after one round of treatment.” |
| Explanation if costs and effects are not discounted | Discounting is not reported or discussed. |
| Statistical analysis of costs | Not reported or discussed. |
| Methods used to allow for uncertainty | The authors performed univariate sensitivity analysis to investigate parameter uncertainty. The authors state that: “These sensitivity analyses were based on the modification of the basic clinical and economic assumptions in the clinical outcome model in order to test the stability of the conclusions of the analysis over a range of assumptions, probability estimates and value judgements.” The authors also state that: “Sensitivity analyses showed that this model is sensitive to the complication rates used” and that: “Parameters influencing cost‐effectiveness included percentage of adverse events and number of days in hospital.” Further details of sensitivity analysis (methods and results) are not reported. |
| Synthesis of costs and benefits | Study reports cost‐effectiveness results in terms of the average (mean) direct medical cost per patient per healed fracture (union) Cost‐effectiveness ratios: UK
Germany
|
| Incremental cost‐effectiveness results | An incremental analysis is not performed. However, incremental results can be calculated from the data reported. Standard deviations, standard errors or confidence intervals cannot be calculated from the data reported. UK
Germany
|
| Authors conclusions | The authors’ main conclusions with respect to the UK are that:
The authors’ main conclusions with respect to Germany are that:
|
| Commentary |
Choice of comparator: Although no explicit justification is provided for the comparator used, it would appear to represent standard practice in the authors’ setting in 2005. End‐users of this review should decide if the comparator represents current practice in their own setting. Modelling: The structure of the model, including a graphical representation, and modelling assumptions, are in general well reported. Data sources for resource use parameters and costs are reported in full. However, the time horizon of the model and the data sources for clinical evidence parameters are not reported. The authors investigate uncertainty in the model parameters using a univariate sensitivity analysis. Sensitive parameters are reported, but the methods and results of the sensitivity analysis are not reported systematically. In particular it is unclear whether uncertainty has been evaluated in all parameters or in only a few key parameters; what methods or rationale have been used to determine the ranges over which variables were tested; and whether structural uncertainty is investigated and, if so, how different structures are tested in the model? Validity of estimate of costs: The analysis of costs is performed from the perspective of a hospital (single provider). It appears that, given the perspective adopted, most relevant categories of costs (resource use) have been included in the analysis. Limitations in the reporting of estimates of costs are that measures of variance (e.g. standard errors) are not reported for mean values. Other issues: The authors did not compare the principal findings of their study with those from other studies. In general, the authors’ conclusions appear to follow from the data reported. The authors do not appear to have presented their results selectively, although they do not always report results from any statistical tests performed. The authors discuss the limitations of the study as follows: “Some of the limitations of this study are worth noting. The first one is typical to decision tree models, which usually do not allow for statistical testing of the differences between comparators. We have tried to address this weakness by using sufficiently wide ranges of values when doing sensitivity analysis. The second one is the use of assumptions in the model. While these assumptions are needed because we could not obtain some of the input data to the model, some of the assumptions may have significant influence to the model results. To fully assess such influences, we have done extensive sensitivity analysis on these assumptions we considered influential to the results. The third limitation pertains to the use of input data from a panel of experts. While this is considered the best and standard means to obtain the best possible estimates in the absence of input data, expert opinions are still subjective and the variation could be large.” |
Appendix 4. Checklists completed to inform assessments of methodological quality of economic evaluations
| Alt 2006a | ||||||||||||
| Item | Yes | No | N/C | N/A | Extract/ comments | |||||||
| Study design. | ||||||||||||
| 1. | The research question is stated. | ✓ | “The purpose of the current work was to calculate potential cost savings by the use of rhBMP‐2 in open tibia fractures by faster fracture healing, reduced revision and infection rates…in Germany” | |||||||||
| 2. | The economic importance of the research question is stated. | ✓ | “Open tibia fractures are still related to a high complication rate. Posttraumatic infections, delayed fracture healing and non‐unions leading to revision…have a tremendous socio‐economic impact… The additional use of rhBMP‐2 in open tibia fractures is not related to additional payments for the hospital in the recent German DRG system. Only a limited number of hospitals can achieve individual agreements with health insurance companies for additional payment for rhBMP‐2 according to…German Hospital Reimbursement regulations. Moreover, each hospital can apply and negotiate for additional reimbursement for rhBMP‐2 for individual cases with health care insurance companies. Due to the significant price of the growth factor reimbursement is in most cases denied by the payers. Health economic data from the US on the use of rhBMP‐2 in anterior lumbar spine fusion in which the growth factor can replace autogenous bone grafting from the iliac crest of the patient focus on the economic impact of rhBMP‐2 from a hospital perspective. In this case, the economic benefit of rhBMP‐2 is seen in the avoidance of costs related to the replacement of the autogenous bone grafting procedure with shorter OR time and reduced OR material use.” | |||||||||
| 3. | The viewpoint(s) of the analysis are clearly stated and justified. | ✓ | “…from the perspective of a public health insurance company…” “As the health insurance companies are the theoretical payers for additional reimbursement of rhBMP‐2 only costs were considered that have to be covered by health insurance companies. This enables a direct comparison between the upfront price of rhBMP‐2 and potential cost savings that can be achieved by this treatment from the perspective of a public German health insurance company.” |
|||||||||
| 4. | The rationale for choosing alternative programmes or interventions compared is stated. | ✓ | Although not explicitly stated, the choice of experimental intervention and comparator appears to reflect current standard practice in the study setting. | |||||||||
| 5. | The alternatives being compared are clearly described. | ✓ | “…local application of rhBMP‐2 on an absorbable collagen sponge serving as carrier that was additionally applied on the fracture site to standard intramedullary fixation in open tibia shaft fractures and soft tissue management compared to intramedullary nailing and soft tissue management alone. Two different rhBMP‐2 concentrations were tested and only the 1.5 mg/ml concentration exhibited statistically significant differences compared to standard of care treatment. Therefore, only the data of the 1.5 mg/ml group were used in the current heath economic evaluation.” | |||||||||
| 6. | The form of economic evaluation used is stated. | ✓ | The authors classify the study as a “cost‐benefit analysis”. However, the study is classified as a cost analysis, based on the Drummond Classification (Drummond 2005) | |||||||||
| 7. | The choice of form of economic evaluation is justified in relation to the questions addressed. | ✓ | See ‘Item 1’ above. The choice of a cost analysis is justified given the objectives of the study. | |||||||||
| Data collection. | ||||||||||||
| 8. | The source(s) of effectiveness estimates used are stated. | ✓ | N/A ‐ study is a cost analysis. However, estimates of resource use are based on clinical data relating to complications and revision procedures, sourced from a randomised controlled trial (Govender 2002). | |||||||||
| 9. | Details of the design and results of effectiveness study are given (if based on a single study). | ✓ | N/A ‐ study is a cost analysis. See item 8, above. | |||||||||
| 10. | Details of the methods of synthesis or meta‐analysis of estimates are given (if based on a synthesis of a number of effectiveness studies). | ✓ | N/A. See item 8, above. | |||||||||
| 11. | The primary outcome measure(s) for the economic evaluation are clearly stated. | ✓ | N/A ‐ study is a cost analysis. | |||||||||
| 12. | Methods to value benefits are stated. | ✓ | N/A ‐ study is a cost analysis. | |||||||||
| 13. | Details of the subjects from whom valuations were obtained were given. | ✓ | N/A ‐ study is a cost analysis. | |||||||||
| 14. | Productivity changes (if included) are reported separately. | ✓ | “Potential savings for grade IIIB open tibia fractures by the use of rhBMP‐2 are €5697 (without costs for rhBMP‐2). Thereof, €3709 (65.1%) are achieved by avoided sickness payments due to faster fracture healing in the rhBMP‐2 group with an average fracture healing time of 228.2 days and 307.6 days in the rhBMP‐2 and in the control group, respectively. The difference of 79.4 days multiplied by average daily sickness payments of €46.73 leads to the savings of €3709.” | |||||||||
| 15. | The relevance of productivity changes to the study question is discussed. | ✓ | “In Germany public health insurers have to provide sickness payments after sickness of 6 weeks which are covered by the employer.” | |||||||||
| 16. | Quantities of resource use are reported separately from their unit costs. | ✓ | Only aggregated cost data are reported. | |||||||||
| 17. | Methods for the estimation of quantities and unit costs are described. | ✓ | See ‘Materials and Methods’ section of the original paper. | |||||||||
| 18. | Currency and price data are recorded. | ✓ | “The…current study is…based on 2005 data”. Currency is recorded in Euros (€) ‐Germany ‐ for all values reported. | |||||||||
| 19. | Details of currency of price adjustments for inflation or currency conversion are given. | ✓ | N/A ‐ no price adjustments for inflation or currency conversion are undertaken. | |||||||||
| 20. | Details of any model used are given. | ✓ | N/A ‐ Assumptions are made and discussed, but study does not use a formal model. | |||||||||
| 21. | The choice of model used and the key parameters on which it is based are justified. | ✓ | N/A ‐ Assumptions are made and discussed, but study does not use a formal model. | |||||||||
| Analysis and interpretation of results | ||||||||||||
| 22. | Time horizon of costs and benefits is stated. | ✓ | “The time horizon of the current study is one year…” | |||||||||
| 23. | The discount rate(s) is stated. | ✓ | N/A ‐ discounting is not discussed, but is not appropriate since the time horizon of the study is one year. | |||||||||
| 24. | The choice of discount rate(s) is justified. | ✓ | N/A ‐ discounting is not discussed, but is not appropriate since the time horizon of the study is one year. | |||||||||
| 25. | An explanation is given if costs and benefits are not discounted. | ✓ | Discounting is not discussed, but is not appropriate since the time horizon of the study is one year. | |||||||||
| 26. | Details of statistical tests and confidence intervals are given for stochastic data. | ✓ | Average (mean) values are reported, but no exploration of uncertainty is reported. | |||||||||
| 27. | The approach to sensitivity analysis is given. | ✓ | N/A ‐ no sensitivity analysis is reported. | |||||||||
| 28. | The choice of variables for sensitivity analysis is justified. | ✓ | N/A ‐ no sensitivity analysis is reported. | |||||||||
| 29. | The ranges over which the variables are varied are justified. | ✓ | N/A ‐ no sensitivity analysis is reported. | |||||||||
| 30. | Relevant alternatives are compared. | ✓ | See items 4 and 5, above. | |||||||||
| 31. | Incremental analysis is reported. | ✓ | Differences in costs between the intervention and control groups are reported. | |||||||||
| 32. | Major outcomes are presented in a disaggregated as well as aggregated form. | ✓ | With respect to costs only. | |||||||||
| 33. | The answer to the study question is given. | ✓ | “This work shows that net savings can be achieved for Gustilo‐Anderson grade IIIB and all grade III open tibia fractures by the use of rhBMP‐2 from the perspective German public health insurers.” | |||||||||
| 34. | Conclusions follow from the data reported. | ✓ | Although the conclusions appear to follow from the data reported, no sensitivity analysis is reported so it is not clear how much confidence we can have in the study conclusions. | |||||||||
| 35. | Conclusions are accompanied by the appropriate caveats. | ✓ | Assumptions made by the authors are discussed with appropriate caveats. | |||||||||
| Jones 2004 | ||||||||||||
| Item | Yes | No | N/C | N/A | Extract/ comments | |||||||
| Study design. | ||||||||||||
| 1. | The research question is stated. | ✓ | “We conducted an economic analysis to evaluate the impact of rhBMP‐2 use on two important financial stake‐holders: the payer and the hospital. We hypothesized that a substantial proportion of the upfront price of rhBMP‐2 would be offset by reductions in SI and other complications that occur after the initial fracture repair.” | |||||||||
| 2. | The economic importance of the research question is stated. | ✓ | “Open tibial shaft fractures result in over 130,000 hospitalizations in the United States annually. Despite advances in surgical techniques, tibial‐shaft fracture repairs are associated with a high rate of delayed union or nonunion (D/NU) with costly secondary interventions (SI) required in about 40% of cases.” | |||||||||
| 3. | The viewpoint(s) of the analysis are clearly stated and justified. | ✓ | “…we conducted an economic analysis to evaluate the impact of rhBMP‐2 use on two important financial stake‐holders: the payer and the hospital.” | |||||||||
| 4. | The rationale for choosing alternative programmes or interventions compared is stated. | ✓ | Although not explicitly stated, the choice of experimental intervention and comparator appears to reflect current standard practice in the study setting. | |||||||||
| 5. | The alternatives being compared are clearly described. | ✓ | “…patients with open tibial shaft fractures who received rhBMP‐2 (1.50 mg/mL) plus intramedullary (IM) nailing (N =145) or IM nailing alone (N =147)…” | |||||||||
| 6. | The form of economic evaluation used is stated. | ✓ | The form of (partial) economic evaluation used ‐ a cost analysis ‐ is not explicitly stated. | |||||||||
| 7. | The choice of form of economic evaluation is justified in relation to the questions addressed. | ✓ | See ‘Item 1’ above. The choice of a cost analysis is justified given the objectives of the study. | |||||||||
| Data collection. | ||||||||||||
| 8. | The source(s) of effectiveness estimates used are stated. | ✓ | N/A ‐ study is a cost analysis. However, estimates of resource use are based on clinical data relating to complications and revision procedures, sourced from a randomised controlled trial (Govender 2002). | |||||||||
| 9. | Details of the design and results of effectiveness study are given (if based on a single study). | ✓ | N/A ‐ study is a cost analysis. See item 8, above. | |||||||||
| 10. | Details of the methods of synthesis or meta‐analysis of estimates are given (if based on a synthesis of a number of effectiveness studies). | ✓ | N/A. See item 8, above. | |||||||||
| 11. | The primary outcome measure(s) for the economic evaluation are clearly stated. | ✓ | N/A ‐ study is a cost analysis. | |||||||||
| 12. | Methods to value benefits are stated. | ✓ | N/A ‐ study is a cost analysis. | |||||||||
| 13. | Details of the subjects from whom valuations were obtained were given. | ✓ | N/A ‐ study is a cost analysis. | |||||||||
| 14. | Productivity changes (if included) are reported separately. | ✓ | N/A ‐ study does not include productivity changes. | |||||||||
| 15. | The relevance of productivity changes to the study question is discussed. | ✓ | N/A ‐ study does not include productivity changes. | |||||||||
| 16. | Quantities of resource use are reported separately from their unit costs. | ✓ | Only aggregated cost data are reported. | |||||||||
| 17. | Methods for the estimation of quantities and unit costs are described. | ✓ | “An economic model was developed based on data from clinical trials published in peer‐reviewed journals and on expert opinion… Medical resources associated with the index fracture repair and subsequent SI and complications over a 2‐year time horizon were identified and assigned costs based on national hospital and ambulatory data.” | |||||||||
| 18. | Currency and price data are recorded. | ✓ | “Costs are reported in 2003 U.S. dollars.” | |||||||||
| 19. | Details of currency of price adjustments for inflation or currency conversion are given. | ✓ | No price adjustments for inflation or currency conversion are reported. However, adjustment for inflation should have been considered as the time horizon of the analysis is two years. | |||||||||
| 20. | Details of any model used are given. | ✓ | N/A ‐ study does not appear to use a formal model. Whilst the authors state that “An economic model was developed…”, it is not clear what this means. | |||||||||
| 21. | The choice of model used and the key parameters on which it is based are justified. | ✓ | N/A ‐ study does not appear to use a formal model. Whilst the authors state that “An economic model was developed…”, it is not clear what this means. | |||||||||
| Analysis and interpretation of results | ||||||||||||
| 22. | Time horizon of costs and benefits is stated. | ✓ | “Medical resources associated with the index fracture repair and subsequent SI and complications over a 2‐year time horizon were identified…” | |||||||||
| 23. | The discount rate(s) is stated. | ✓ | Discounting is not reported or discussed. Discounting is appropriate as the time horizon of the analysis is two years. | |||||||||
| 24. | The choice of discount rate(s) is justified. | ✓ | Discounting is not reported or discussed. Discounting is appropriate as the time horizon of the analysis is two years. | |||||||||
| 25. | An explanation is given if costs and benefits are not discounted. | ✓ | Discounting is not reported or discussed. Discounting is appropriate as the time horizon of the analysis is two years. | |||||||||
| 26. | Details of statistical tests and confidence intervals are given for stochastic data. | ✓ | If the study authors had access to individual‐level trial data, statistical tests could have undertaken. If only average data reported from the trial were available, these data are deterministic, so this item would not apply. However, in the latter case, it is still in principal possible to undertake sensitivity analysis based on reported information regarding the distribution of data around point estimates (e.g. using the upper and lower bounds of a confidence interval. | |||||||||
| 27. | The approach to sensitivity analysis is given. | ✓ | The authors state that: “We allowed the cost of rhBMP‐2 to the payer to vary to simulate different reimbursement policies… Assuming payers reimburse 100% of rhBMP‐2 price; Assuming payers reimburse 50% of rhBMP‐2 price; Assuming payers reimburse 0% of rhBMP‐2 price.” Although this is not described as a sensitivity analysis, it appears that the authors undertake univariate sensitivity analysis using one variable: ‘% of rhBMP‐2 price reimbursed by payers’. | |||||||||
| 28. | The choice of variables for sensitivity analysis is justified. | ✓ | Although the choice of variable for sensitivity analysis is not discussed explicitly, it appears that the choice of this variable (% of rhBMP‐2 price reimbursed by payers) is reasonable. However, other variables could reasonably have been included in sensitivity analysis, such as rhBMP‐2 price,, rates of secondary interventions and infections, healing time etc. | |||||||||
| 29. | The ranges over which the variables are varied are justified. | ✓ | The range over which the ‘% of rhBMP‐2 price reimbursed by payers’ variable is varied is not explicitly justified and appears to be arbitrary, and may be based on potential (as opposed to actual) reimbursement scenarios. | |||||||||
| 30. | Relevant alternatives are compared. | ✓ | See items 4 and 5, above. | |||||||||
| 31. | Incremental analysis is reported. | ✓ | Differences in costs between the intervention and control group are reported. | |||||||||
| 32. | Major outcomes are presented in a disaggregated as well as aggregated form. | ✓ | With respect to costs only. | |||||||||
| 33. | The answer to the study question is given. | ✓ | “From a payer's perspective, if hospitals are reimbursed for half the cost of rhBMP‐2, then the entire rhBMP‐2 cost will be offset because of fewer downstream clinical events such as SI and infections. For hospitals, lack of rhBMP‐2 reimbursement by payers results in limited cost offsets. When payers' rhBMP‐2 reimbursement policies are more generous (e.g. reimbursement 50% of the rhBMP‐2 cost), considerable cost offsets are achieved by both payers and hospitals.” | |||||||||
| 34. | Conclusions follow from the data reported. | ✓ | Although the conclusions appear to follow from the data reported, only a very limited sensitivity analysis is reported, so it is not clear how much confidence we can have in the study conclusions. | |||||||||
| 35. | Conclusions are accompanied by the appropriate caveats. | ✓ | No caveats to conclusions or limitations of the analysis are discussed. | |||||||||
| Garrison 2007 | ||||||||||||
| Item | Dimension of quality | Questions for critical appraisal | Yes | No | N/C | Extract/ comments | ||||||
| Structure | ||||||||||||
| S1 | Statement of decision problem / objective | Is there a clear statement of the decision problem? | ✓ | There is a clear statement of the decision problem prompting the analysis, including details of the medical condition under evaluation, patient groups and treatment pathways. | ||||||||
| Is the objective of the evaluation and model specified and consistent with the stated decision problem? | ✓ | The objective of the revised model is specified and appears to be consistent with the stated decision problem: “…an economic evaluation model…[was developed] to evaluate cost‐effectiveness of rhBMP‐2 in the treatment of [acute] OTFs. For a selected population, the model could be used to estimate the number of annual [acute] OTFs by severity, the cost of adding rhBMP‐2 to standard care, secondary interventions and infections avoided and the net budget impact of using rhBMP‐2 for [acute] OTFs.” |
||||||||||
| Is the primary decision‐maker specified? | ✓ | Although the primary decision maker is not explicitly specified, this study is reported in a UK Health Technology Assessment report prefaced by the following text: “The [UK] Health Technology Assessment programme…produces high quality research information on the costs, effectiveness an broader impact of health technologies for those who use, manage and provide care in the [UK] NHS”. |
||||||||||
| S2 | Statement of scope / perspective | Is the perspective of the model stated clearly? | ✓ | Although not explicitly stated, the analytic perspective adopted for the revised model appears to be that of the UK healthcare system (UK NHS). | ||||||||
| Are the model inputs consistent with the stated perspective? | ✓ | See item S2, immediately above. | ||||||||||
| Has the scope of the model been stated and justified? | ✓ | The description of the scope of the revised model includes statements of the technologies involved and the population and the setting studied but does not include an explicit statement of the perspective of analysis, nor an explicit statement of the time horizon to which the model relates. | ||||||||||
| Are the outcomes of the model consistent with the perspective, scope and overall objective of the model? | ✓ | It appears that, overall, the outcomes of the revised model are consistent with the analytic perspective adopted and its overall objective. | ||||||||||
| S3 | Rationale for structure | Is the structure of the model consistent with a coherent theory of the health condition under evaluation? | ✓ | It appears that the structure of the revised model is consistent with a coherent theory of the health condition under evaluation. | ||||||||
| Are the sources of data used to develop the structure of the model specified? | ✓ | Sources of data and expertise used to develop the revised model structure are not explicitly described. | ||||||||||
| Are the causal relationships described by the model structure justified appropriately? | ✓ | Whilst no explicit justifications are provided for the causal relationships described by the revised model structure, there is no evidence to contraindicate the modelled relationships. The model appears to have good (clinical) face validity. | ||||||||||
| S4 | Structural assumptions | Are the structural assumptions transparent and justified? | ✓ | Structural assumptions underlying the revised model appear transparent and justified. | ||||||||
| Are the structural assumptions reasonable given the overall objective, perspective and scope of the model? | ✓ | Assumed relationships between parameters appear to be realistic and logical, and to reflect available data and routine medical practice in the UK. | ||||||||||
| S5 | Strategies / comparators | Is there a clear definition of the options under evaluation? | ✓ | rhBMP‐2 as an adjunct to IM with routine soft‐tissue management, versus the current standard surgical treatment of acute open tibial shaft fractures: use of IM with routine soft tissue management alone. | ||||||||
| Have all feasible and practical options been evaluated? | ✓ | It is in principal feasible to include other available BMP products as treatment options, but is not clear from the study report whether this was possible in practice. | ||||||||||
| Is there justification for the exclusion of feasible options? | ✓ | See S5, immediately above. | ||||||||||
| S6 | Model type | Is the chosen model type appropriate given the decision problem and specified causal relationships within the model? | ✓ | It is debatable whether a time dependent model structure may capture differential utility gain more accurately than the decision tree structure used. | ||||||||
| S7 | Time horizon | Is the time horizon of the model sufficient to reflect all important differences between options? | ✓ | The time horizon of the revised model is not explicitly stated. However the clinical end point of the model is fracture union, which typically occurs within a time period of less than one year. The likely time horizon of the model is therefore likely to be sufficient to encapsulate all major clinical and economic outcomes, and to reflect important clinical and economic differences between treatment options. | ||||||||
| Are the time horizon of the model, the duration of treatment and the duration of treatment effect described and justified? | ✓ | The time horizon of the model, the duration of treatment and the duration of treatment effect are not described specifically or justified. | ||||||||||
| S8 | Disease states / pathways | Do the disease states (state transition model) or the pathways (decision tree model) reflect the underlying biological process of the disease in question and the impact of interventions? | ✓ | Treatment pathways appear to reflect the underlying biological processes of the medical condition and the impact of interventions. | ||||||||
| S9 | Cycle length | Is the cycle length defined and justified in terms of the natural history of disease? | N/A ‐ model is not a discrete time state transition model. | |||||||||
| Data | ||||||||||||
| D1 | Data identification | Are the data identification methods transparent and appropriate given the objectives of the model? | ✓ | Methods for identifying data used to populate the revised model are described in full and appear appropriate given the objectives of the model. Although clinical outcomes and resource utilisation data (e.g. complications, secondary interventions) are sourced from a randomised controlled trial whose samples are drawn from populations located outside the jurisdiction of interest, this trial incorporates direct comparison between comparator therapies and measures final outcomes of interest, and is likely to represent the best relevant single study source for these data that was available when the study was conducted. | ||||||||
| Where choices have been made between data sources, are these justified appropriately? | ✓ | See pages 51‐52 of the original study. | ||||||||||
| Has particular attention been paid to identifying data for the important parameters in the model? | ✓ | The results of the revised model are particularly sensitive to the price of rhBMP‐2. However, the source of this item of data is a personal communication with the product manufacturer. Although it is not clear from the information reported whether or not this constitutes a reasonable level of attention paid to identifying this item of data, the impact of varying the price of rhBMP‐2 on results is investigated using a sensitivity analysis. | ||||||||||
| Has the quality of the data been assessed appropriately? | ✓ | There appears to be adequate discussion of the quality and limitations of most types of data used in the revised model. | ||||||||||
| Where expert opinion has been used, are the methods described and justified? | N/A ‐ no expert opinion is used to inform ranges of values of parameters included in the revised model. | |||||||||||
| D2 | Data modelling | Is the data modelling methodology based on justifiable statistical and epidemiological techniques? | ✓ | Data modelling methodology appears to be based on justifiable statistical and epidemiological techniques. | ||||||||
| D2a | Baseline data | Is the choice of baseline data described and justified? | ✓ | Baseline probabilities relate to the control group of the BESTT trial (Govender 2002), applied to the UK population. No justification is presented and there is no available evidence to suggest whether or not the baseline probabilities used are applicable to the UK population. | ||||||||
| Are transition probabilities calculated appropriately? | ✓ | Transition probabilities appear to have been calculated appropriately | ||||||||||
| Has a half‐cycle correction been applied to both cost and outcome? | N/A ‐ model is not a discrete time state transition model. | |||||||||||
| If not, has this omission been justified? | N/A ‐ model is not a discrete time state transition model. | |||||||||||
| D2b | Treatment effects | If relative treatment effects have been derived from trial data, have they been synthesised using appropriate techniques? | N/A ‐ relative treatment effects are based on data derived from a single study. | |||||||||
| Have the methods and assumptions used to extrapolate short‐term results to final outcomes been documented and justified? | N/A ‐ study does not include extrapolation of short‐term results to final outcomes. | |||||||||||
| Have alternative assumptions used to extrapolate short‐term results to final outcomes been explored through sensitivity analysis? | N/A ‐ study does not include extrapolation of short‐term results to final outcomes. | |||||||||||
| Have assumptions regarding the continuing effect of treatment once treatment is complete been documented and justified? | N/A ‐ study does not make assumptions regarding the continuing effect of treatment once treatment is complete. | |||||||||||
| Have alternative assumptions regarding the continuing effect of treatment once treatment is complete been explored through sensitivity analysis? | N/A ‐ study does not make assumptions regarding the continuing effect of treatment once treatment is complete. | |||||||||||
| D2c | Costs | Are the costs incorporated into the model justified? | ✓ | All unit cost data incorporated into the revised model appear to be sourced from the most recent available national published cost calculations, based on reliable administrative databases for the jurisdiction of interest. Costing methods appear to accord with guidelines for costing within economic evaluation. | ||||||||
| Has the source for all costs been described? | ✓ | Sources of all unit cost data are described in full. | ||||||||||
| Have discount rates been described and justified given the target decision‐maker? | N/A ‐ discounting is not appropriate given the likely time horizon of the revised model. | |||||||||||
| D2d | Quality of life weights (utilities) | Are the utilities incorporated into the model appropriate? | ✓ | The study includes detailed discussion of limitations of utility values incorporated into the revised model; namely the questionable generalisability of utility values derived from studies of hip fracture in older women and vertebral osteoporotic fracture are generalisable to patients with acute open tibial fractures. | ||||||||
| Is the source for the utility weights referenced? | ✓ | See pages 51‐52 of the original study. | ||||||||||
| Are the methods of derivation for the utility weights justified? | ✓ | Justification is provided for the methods of utility weights incorporated into the revised model: “Since the disutility values might be much overestimated in the original ABACUS model but there is no alternative objective data, we arbitrarily assumed the values to be 30% smaller.” Given the limitations of sources of utility values incorporated into the original model, and the lack of alternative objective data, the strategy adopted for the revised model, which (arbitrarily) assumes utility values to be 30% lower than those used in the original model, appears reasonable, albeit arbitrary. |
||||||||||
| D3 | Data incorporation | Have all data incorporated into the model been described and referenced in sufficient detail? | ✓ | See pages 48‐52 of the original study. | ||||||||
| Has the use of mutually inconsistent data been justified (i.e. are assumptions and choices appropriate)? | N/A ‐ the model does not appear to incorporate any mutually inconsistent data. | |||||||||||
| Is the process of data incorporation transparent? | ✓ | Data have been incorporated into the model as distributions to inform a probabilistic analysis. The process of data incorporation is described in full: “Uncertainty and probabilistic simulation: A range of values for important input parameters were estimated for probabilistic simulations by the [original] model. The model parameters that were randomly investigated included severity distribution of OTFs, infection rate, secondary intervention rates/types, time to fracture union, disutility values and unit costs of interventions and clinical outcomes. In probabilistic simulations, the range (95% CIs) of input parameters are 50% smaller or greater than the point estimates. Then input values were randomly sampled from a gamma or beta distribution to obtain random estimates for cost‐effectiveness outcomes. The random simulations were repeated many times to generate a large number of random estimates, and the simulation results were used to calculate average estimates and corresponding CIs. For estimating the incremental cost‐effectiveness ratio (ICER), a cost‐effectiveness acceptability curve (CEAC) can be created using the results of simulations.” |
||||||||||
| If data have been incorporated as distributions, has the choice of distribution for each parameter been described and justified? | ✓ | The choice of distribution for each parameter is not described in full. The authors state only that: “…input values were randomly sampled from a gamma or beta distribution to obtain random estimates for cost‐effectiveness outcomes.” |
||||||||||
| If data have been incorporated as distributions, is it clear that second order uncertainty is reflected? | ✓ | See item D3, immediately above. | ||||||||||
| D4 | Assessment of uncertainty | Have the four principal types of uncertainty (D4a ‐ D4d below) been addressed? | ✓ | ‐ | ||||||||
| If not, has the omission of particular forms of uncertainty been justified? | ✓ | The authors do not discuss these omissions. | ||||||||||
| D4a | Methodological | Have methodological uncertainties been addressed by running alternative versions of the model with different methodological assumptions? | ✓ | Methodological uncertainty is not addressed within this study. | ||||||||
| D4b | Structural | Is there evidence that structural uncertainties have been addressed via sensitivity analysis? | ✓ | Structural uncertainty is not addressed within this study. |
||||||||
| D4c | Heterogeneity | Has heterogeneity been dealt with by running the model separately for different subgroups? | ✓ | Heterogeneity between patient subgroups is addressed by running the model separately for patients with different grades of fracture severity. | ||||||||
| D4d | Parameter | Are the methods of assessment of parameter uncertainty appropriate? | ✓ | “Parameter uncertainty is addressed using probabilistic simulations. The model parameters investigated include severity distribution of acute OTFs, infection rate, secondary intervention rates/types, time to fracture union, disutility values and unit costs of interventions and clinical outcomes. The range (95% CIs) of input parameters are 50% smaller or greater than the point estimates. Input values are randomly sampled from a gamma or beta distribution to obtain random estimates for cost‐effectiveness outcomes. The random simulations are repeated 10,000 times to generate a large number of random estimates, and the simulation results are used to calculate average estimates and corresponding CIs.” In addition, a further sensitivity analysis was conducted whereby two additional iterations of the model (10,000 simulations) were run with the price of rhBMP‐2 reduced by 20% and 40% respectively. | ||||||||
| If data are incorporated as point estimates, are the ranges used for sensitivity analysis stated clearly and justified? | ✓ | See D4d, immediately above. | ||||||||||
| Consistency | ||||||||||||
| C1 | Internal consistency | Is there evidence that the mathematical logic of the model has been tested thoroughly before use? | ✓ | It is not clear whether the mathematical logic of the revised model has been tested thoroughly before use. | ||||||||
| C2 | External consistency | Are any counterintuitive results from the model explained and justified? | N/A ‐ there do not appear to be any counterintuitive results. | |||||||||
| If the model has been calibrated against independent data, have any differences been explained and justified? | N/A ‐ the revised model is not calibrated against independent data. | |||||||||||
| Have the results of the model been compared with those of previous models and any differences in results explained? | ✓ | The principal results of the revised model are compared with the results of the original ABACUS model. Differences in results are explained by changes in input values for individual parameters (e.g. UK population, unit costs) and differences in assumptions used in the revised model (in general, more conservative assumptions were used). | ||||||||||
| van Engen 2003 | ||||||||||||
| Item | Dimension of quality | Questions for critical appraisal | Yes | No | N/C | Extract/ comments | ||||||
| Structure | ||||||||||||
| S1 | Statement of decision problem / objective | Is there a clear statement of the decision problem? | ✓ | There is a clear statement of the decision problem prompting the analysis, including details of the medical condition under evaluation, patient group and treatment pathways. | ||||||||
| Is the objective of the evaluation and model specified and consistent with the stated decision problem? | ✓ | The objective of the model is specified and appears to be consistent with the stated decision problem: “…to assess…the total cost of care and cost‐effectiveness…of Osigraft® [versus] comparators (autograft or the Ilizarov fixation technique in the UK, and fixation with a nail or plate with, when appropriate, an autograft in Germany)…for the treatment of tibial non‐union [fractures]”. |
||||||||||
| Is the primary decision‐maker specified? | ✓ | The primary decision‐maker is not specified. | ||||||||||
| S2 | Statement of scope / perspective | Is the perspective of the model stated clearly? | ✓ | “A cost‐effectiveness analysis based on decision‐analytic [modelling] techniques was conducted from a hospital perspective…”. | ||||||||
| Are the model inputs consistent with the stated perspective? | ✓ | Model inputs appear consistent with the stated perspective. | ||||||||||
| Has the scope of the model been stated and justified? | ✓ | The description of the scope of the model includes explicit statements of the perspective of analysis, the technologies involved and the population and setting studied, but does not include an explicit statement of the time horizon to which the model relates. | ||||||||||
| Are the outcomes of the model consistent with the perspective, scope and overall objective of the model? | ✓ | It appears that overall, the outcomes of the model are consistent with the analytic perspective adopted and the overall objectives of the model. | ||||||||||
| S3 | Rationale for structure | Is the structure of the model consistent with a coherent theory of the health condition under evaluation? | ✓ | The structure of the model appears to be consistent with a coherent theory of the health condition under evaluation. | ||||||||
| Are the sources of data used to develop the structure of the model specified? | ✓ | The structure of the model is based on expert opinion: “The decision tree was built based on clinical decisions that could take place in each situation according to our panel of 7 orthopaedic surgeons in each country [UK and Germany]”. |
||||||||||
| Are the causal relationships described by the model structure justified appropriately? | ✓ | Whilst no explicit justifications are provided for the causal relationships described by the model structure, there is no evidence to contraindicate the modelled relationships and the model appears to have good (clinical) face validity, based on expert opinion. | ||||||||||
| S4 | Structural assumptions | Are the structural assumptions transparent and justified? | ✓ | Structural assumptions underlying the revised model appear transparent and justified. | ||||||||
| Are the structural assumptions reasonable given the overall objective, perspective and scope of the model? | ✓ | Assumed relationships between parameters appear to be realistic and logical, and to reflect routine medical practice in the UK and Germany. | ||||||||||
| S5 | Strategies / comparators | Is there a clear definition of the options under evaluation? | ✓ | “[The experimental intervention is a]…bone growth stimulator osteogenic protein 1 (Osigraft®) ‐ a human morphogenic protein that initiates bone formation through the induction of cellular differentiation in mesenchymal cells, [for the treatment of tibial non‐union fractures]. Currently, the published standard therapies for tibial non‐unions include the use of autograft bone…to fill the gap of the non‐union combined with plating, nailing or external fixation, or Ilizarov‐based fixation techniques.” | ||||||||
| Have all feasible and practical options been evaluated? | ✓ | It is in principal feasible to include other available BMP products as treatment options, but is not clear from the study report whether this was possible in practice. | ||||||||||
| Is there justification for the exclusion of feasible options? | ✓ | See S5, immediately above. | ||||||||||
| S6 | Model type | Is the chosen model type appropriate given the decision problem and specified causal relationships within the model? | ✓ | It is debatable whether an alternative Markov model structure could have been considered for use in preference to the decision tree model to enable modelling of cost‐effectiveness over more than one treatment round (cycle). | ||||||||
| S7 | Time horizon | Is the time horizon of the model sufficient to reflect all important differences between options? | ✓ | The time horizon of the model is not explicitly stated. However the authors state that: “The model…covers one treatment period for the tibial non‐union, with ‘non healing’ as the end point for those patients whose non‐union did not heal after one round of treatment.” | ||||||||
| Are the time horizon of the model, the duration of treatment and the duration of treatment effect described and justified? | ✓ | The time horizon of the model, the duration of treatment and the duration of treatment effect are not described specifically or justified. | ||||||||||
| S8 | Disease states / pathways | Do the disease states (state transition model) or the pathways (decision tree model) reflect the underlying biological process of the disease in question and the impact of interventions? | ✓ | Clinical event pathways appear to reflect the underlying biological processes of the medical condition and the impact of interventions. | ||||||||
| S9 | Cycle length | Is the cycle length defined and justified in terms of the natural history of disease? | N/A ‐ model is not a discrete time state transition model. | |||||||||
| Data | ||||||||||||
| D1 | Data identification | Are the data identification methods transparent and appropriate given the objectives of the model? | ✓ | The authors state that: “Data on efficacy were obtained from clinical trials and literature”. It is therefore unclear whether the data identified are appropriate given the objectives of the model. Data on resource utilisation was based on expert opinion. Methods used to elicit expert opinion (a modified Delphi method) and the composition of expert panels (7 orthopaedic surgeons in each country ‐ UK and Germany) are described briefly. Methods for identifying cost data are described in full and appear appropriate given the objectives of the model. |
||||||||
| Where choices have been made between data sources, are these justified appropriately? | ✓ | It is not clear whether or not any choices have been made between alternative data sources. | ||||||||||
| Has particular attention been paid to identifying data for the important parameters in the model? | ✓ | It is not clear whether particular attention been paid to identifying data for the important parameters in the model | ||||||||||
| Has the quality of the data been assessed appropriately? | ✓ | There is no evaluative description of the quality of data identified for use in the model. However, whilst the quality of cost data appears high (a mix of cost calculations based on reliable administrative databases or data sources conducted for the specific study and recently published (national) cost calculations based on reliable databases; both for the jurisdictions of interest), the quality of clinical outcomes (effects) data is not clear due to poor quality reporting. The quality of resource utilisation data based on expert opinion is generally considered low, compared to other potential sources to inform resource use parameters. | ||||||||||
| Where expert opinion has been used, are the methods described and justified? | ✓ | Methods used to elicit expert opinion (a modified Delphi method) and the composition of expert panels (7 orthopaedic surgeons in each country ‐ UK and Germany) are described, but are not justified explicitly by the authors. | ||||||||||
| D2 | Data modelling | Is the data modelling methodology based on justifiable statistical and epidemiological techniques? | ✓ | Data modelling methodology is not described in sufficient detail to allow judgement. | ||||||||
| D2a | Baseline data | Is the choice of baseline data described and justified? | ✓ | Choice of baseline data is not described or justified. | ||||||||
| Are transition probabilities calculated appropriately? | ✓ | Methods used to calculate transition probabilities are not described. | ||||||||||
| Has a half‐cycle correction been applied to both cost and outcome? | N/A ‐ model is not a discrete time state transition model. | |||||||||||
| If not, has this omission been justified? | N/A ‐ model is not a discrete time state transition model. | |||||||||||
| D2b | Treatment effects | If relative treatment effects have been derived from trial data, have they been synthesised using appropriate techniques? | ✓ | The source(s) of data on which estimates of relative treatment effect are based (nor synthesis methods, if used) are not adequately described to allow judgement. | ||||||||
| Have the methods and assumptions used to extrapolate short‐term results to final outcomes been documented and justified? | N/A ‐ study does not include extrapolation of short‐term results to final outcomes. | |||||||||||
| Have alternative assumptions used to extrapolate short‐term results to final outcomes been explored through sensitivity analysis? | N/A ‐ study does not include extrapolation of short‐term results to final outcomes. | |||||||||||
| Have assumptions regarding the continuing effect of treatment once treatment is complete been documented and justified? | N/A ‐ study does not make assumptions regarding the continuing effect of treatment once treatment is complete. | |||||||||||
| Have alternative assumptions regarding the continuing effect of treatment once treatment is complete been explored through sensitivity analysis? | N/A ‐ study does not make assumptions regarding the continuing effect of treatment once treatment is complete. | |||||||||||
| D2c | Costs | Are the costs incorporated into the model justified? | ✓ | Overall, costing methods appear to accord with guidelines for costing within economic evaluation. | ||||||||
| Has the source for all costs been described? | ✓ | Sources of all unit cost data are described in full. | ||||||||||
| Have discount rates been described and justified given the target decision‐maker? | N/A ‐ discounting is not appropriate given the likely time horizon of the model. | |||||||||||
| D2d | Quality of life weights (utilities) | Are the utilities incorporated into the model appropriate? | N/A ‐ study is classified as a cost‐effectiveness analysis and does not incorporate utilities data. | |||||||||
| Is the source for the utility weights referenced? | N/A ‐ study is classified as a cost‐effectiveness analysis and does not incorporate utilities data. | |||||||||||
| Are the methods of derivation for the utility weights justified? | N/A ‐ study is classified as a cost‐effectiveness analysis and does not incorporate utilities data. | |||||||||||
| D3 | Data incorporation | Have all data incorporated into the model been described and referenced in sufficient detail? | ✓ | Data on clinical outcomes (effects) are not described or referenced. The authors state only that: “Data on efficacy were obtained from clinical trials and literature”. | ||||||||
| Has the use of mutually inconsistent data been justified (i.e. are assumptions and choices appropriate)? | ✓ | Data on clinical outcomes (effects) are not described or referenced. The authors state only that: “Data on efficacy were obtained from clinical trials and literature”. | ||||||||||
| Is the process of data incorporation transparent? | ✓ | Whilst it appears that data has been incorporated into the model as point estimates, it is not clear how this process is undertaken. | ||||||||||
| If data have been incorporated as distributions, has the choice of distribution for each parameter been described and justified? | N/A ‐ It appears no data have been incorporated into the model as distributions. | |||||||||||
| If data have been incorporated as distributions, is it clear that second order uncertainty is reflected? | N/A ‐ It appears no data have been incorporated into the model as distributions. | |||||||||||
| D4 | Assessment of uncertainty | Have the four principal types of uncertainty (D4a ‐ D4d below) been addressed? | ✓ | ‐ | ||||||||
| If not, has the omission of particular forms of uncertainty been justified? | ✓ | The omission of particular forms of uncertainty is not justified by the authors. | ||||||||||
| D4a | Methodological | Have methodological uncertainties been addressed by running alternative versions of the model with different methodological assumptions? | ✓ | Although discussed, methodological uncertainty does not appear to have been addressed by running alternative versions of the model with different methodological assumptions. | ||||||||
| D4b | Structural | Is there evidence that structural uncertainties have been addressed via sensitivity analysis? | ✓ | Structural uncertainty does not appear to have been addressed within this study. | ||||||||
| D4c | Heterogeneity | Has heterogeneity been dealt with by running the model separately for different subgroups? | ✓ | Although the model is run separately for UK and German populations, the study does not address potential heterogeneity amongst subgroups of patients with different grades of severity of fractures. | ||||||||
| D4d | Parameter | Are the methods of assessment of parameter uncertainty appropriate? | ✓ | Methods used to assess parameter uncertainty are not sufficiently well‐described to allow judgement. The authors state that: “To test the stability of the model’s results, sensitivity analyses were performed. These sensitivity analyses were based on the modification of the basic clinical and economic assumptions in the clinical outcome model in order to test the stability of the conclusions of the analysis over a range of assumptions, probability estimates and value judgements. If the preferred strategy remained stable over the entire range of plausible values for a given parameter, then the model is insensitive to values within the range of that parameter.” |
||||||||
| If data are incorporated as point estimates, are the ranges used for sensitivity analysis stated clearly and justified? | ✓ | See item D4d, immediately above. | ||||||||||
| Consistency | ||||||||||||
| C1 | Internal consistency | Is there evidence that the mathematical logic of the model has been tested thoroughly before use? | ✓ | There is no evidence that the mathematical logic of the model has been tested thoroughly before use. | ||||||||
| C2 | External consistency | Are any counterintuitive results from the model explained and justified? | N/A ‐ there do not appear to be any counterintuitive results. | |||||||||
| If the model has been calibrated against independent data, have any differences been explained and justified? | N/A ‐ the revised model is not calibrated against independent data. | |||||||||||
| Have the results of the model been compared with those of previous models and any differences in results explained? | ✓ | Whilst the results of the model are not compared with those of previous models, the authors state that: “No studies comparing both clinical outcomes and costs of the different treatment options for tibial non‐unions have been performed to date.” It is therefore likely that there were (are) no results of previous models available with which to compare the results of this model. | ||||||||||
Data and analyses
Comparison 1.
BMP versus control (usually surgery alone) or bone graft
Analysis 1.1.

Comparison 1 BMP versus control (usually surgery alone) or bone graft, Outcome 1 Participants with acute tibial fracture attaining union without secondary procedure.
Analysis 1.2.

Comparison 1 BMP versus control (usually surgery alone) or bone graft, Outcome 2 Participants with prior nonunion of the long bones attaining union.
Analysis 1.3.

Comparison 1 BMP versus control (usually surgery alone) or bone graft, Outcome 3 Participants attaining union without secondary intervention after osteotomy for radial malunion.
Analysis 1.5.

Comparison 1 BMP versus control (usually surgery alone) or bone graft, Outcome 5 Participants with nonunion of the tibia or other long bone requiring secondary procedure to attain union.
Analysis 1.7.

Comparison 1 BMP versus control (usually surgery alone) or bone graft, Outcome 7 Acute fracture: participants with hardware failure.
History
Protocol first published: Issue 1, 2008 Review first published: Issue 6, 2010
| Date | Event | Description |
|---|---|---|
| 8 July 2008 | Amended | Converted to new review format |
Differences between protocol and review
None known.
Characteristics of studies
Characteristics of included studies [ordered by study ID]
| Methods | Cost analysis, based on a single empirical study (Govender 2002). | |
| Participants | Jurisdiction: Germany. Analytic perspective: Public health insurance company (third‐party payer). Time horizon: One year. Diagnosis: Acute open tibial shaft fractures with main diaphyseal component. 1.5 mg/mL BMP, with intramedullary nail fixation and routine soft tissue management: 145 patients, 75 with recent tobacco use. Intramedullary nail fixation and routine soft tissue management: 146 patients, 66 with recent tobacco use. |
|
| Interventions | All patients had intramedullary nail fixation with routine soft tissue management, with intervention group receiving 1.50 mg/mL rhBMP‐2 delivered by absorbable Type I bovine collagen sponge as an adjunct. | |
| Outcomes | Total direct medical costs per patient. Total productivity costs (time off work) per patient. Total costs per patient. |
|
| Notes | Funded by Medtronic (a medical technology manufacturer and a distributor of rhBMP‐2). | |
| Methods | Randomised controlled trial | |
| Participants | Location: Italy Number of participants: 29 Diagnosis: Non‐reactive post‐traumatic long bone non‐union or critical size bone defect. rhOP‐1: 16 patients, 47.4±2.56 mean (SD) age, 15.2±2.46 months mean (SD) duration of nonunion, 2.5±0.57 (SD) mean number of previous surgeries. Platelet Rich Plasma (PRP): 13 patients, 35.3±1.76 (SD) mean age, 18.8±3.02 (SD) mean duration of nonunion, 2.6±0.66(SD) mean number of previous surgeries. |
|
| Interventions | Bone fixated with intramedullary nail, plate or external fixator with either: 1. rhBMP‐7: 3.5g in 1g collagen per vial (max. 2 vials) 2. Platelet Rich Plasma (PRP): 10 or 20 ml of platelet gel added to graft |
|
| Outcomes | Radiographic healing described in terms of callus presence, type of callus/bone repair, callus staging. Clinical healing described in terms of pain at rest or weight bearing, functionality, walking, muscular trophism. Time to radiographic and clinical healing. Failures. Re‐interventions performed. All at 9 month preliminary follow‐up point. |
|
| Notes | Funding source not reported. | |
| Risk of bias | ||
| Bias | Authors' judgement | Support for judgement |
| Adequate sequence generation? | Unclear risk | Not reported |
| Allocation concealment? | Unclear risk | Not reported |
| Blinding? All outcomes | Unclear risk | Not reported |
| Baseline comparability? | Unclear risk | Not enough details were reported. |
| Explicit inclusion/exclusion criteria? | Low risk | Detailed criteria were reported. |
| Intention‐to‐treat analysis? | Unclear risk | Only preliminary results as study had not ended. |
| Adequate reporting of drop‐outs? | Unclear risk | No drop outs as study had not ended at time of publication. |
| Methods | Randomised controlled trial | |
| Participants | Location: China Number of participants: 80 Diagnosis: Nonunion tibia fracture 80 patients with a mean age of 35 (range 25‐50), 58 males, 22 females. |
|
| Interventions | 1. 30 received natural non‐organic bone (NNB)/BMP 2. 20 received autograft bone 3. 30 received another surgical management not described. (Main surgical procedure not described either). |
|
| Outcomes | Healing at 6 months. Johner‐Wruh function score. |
|
| Notes | Funded by local government. | |
| Risk of bias | ||
| Bias | Authors' judgement | Support for judgement |
| Adequate sequence generation? | Unclear risk | Not reported |
| Allocation concealment? | High risk | |
| Blinding? All outcomes | High risk | |
| Baseline comparability? | Unclear risk | Not enough details reported. |
| Explicit inclusion/exclusion criteria? | Low risk | |
| Intention‐to‐treat analysis? | Unclear risk | Did not report the use of intention‐to‐treat analysis. |
| Adequate reporting of drop‐outs? | Unclear risk | Final number of patients at the study endpoint were not reported. |
| Methods | Randomised controlled trial | |
| Participants | Location: USA Number of participants: 30 Diagnosis: Tibial non‐union 23 males, 7 females with mean time from injury of 27.2 months (minimum 9 months). 20 patients had previous surgery. |
|
| Interventions | All patients were treated with reamed intramedullary rods and either: 1. BMP‐7 on a collagen type 1 carrier (14) 2. autogenous iliac bone crest (16) |
|
| Outcomes | Radiographic healing defined as bridging with new bone across at least 3 of 4 cortices. Weight bearing ability and pain. |
|
| Notes | Funded by Creative BioMolecule Inc and Stryker Biotech | |
| Risk of bias | ||
| Bias | Authors' judgement | Support for judgement |
| Adequate sequence generation? | Unclear risk | Quote: "The randomized prospective clinical evaluation." |
| Allocation concealment? | Unclear risk | Not reported |
| Blinding? All outcomes | Unclear risk | Unclear |
| Baseline comparability? | Unclear risk | No specific treatment group data were reported. |
| Explicit inclusion/exclusion criteria? | High risk | No details apart from diagnosis. |
| Intention‐to‐treat analysis? | High risk | No statistical analysis reported. |
| Adequate reporting of drop‐outs? | Low risk | No drop outs. |
| Methods | Randomised controlled trial | |
| Participants | Location: UK Number of participants: 30 Diagnosis: Symptomatic malunion of the distal radius requiring corrective osteotomy. rhBMP‐7: non‐bridging external fixation had mean age of 58 (range 41‐81), 3 males, 1 female, mean time to osteotomy was 42 weeks (range 26‐57). internal fixation had mean age of 62 (range 35‐78), 0 males, 10 females, mean time to osteotomy was 33 weeks (range 15‐57). Autogenous bone graft: non‐bridging external fixation had mean age of 61 (range 25‐79), 5 males, 1 female, mean time to osteotomy was 47 weeks (range 5‐164 weeks). Internal fixation had mean age of 57 (range 49‐68), 3 males, 7 females, mean time to osteotomy was 52 weeks (range 15‐86). |
|
| Interventions | All patients underwent corrective osteotomies of the distal radius with either: 1. rhBMP‐7 2. autogenous bone graft |
|
| Outcomes | Time to healing. Functional outcomes including; pain, activities of daily life, grip strength, pronation, supination, flexion, extension, ulnar deviation, radial deviation. |
|
| Notes | Funding source not reported. | |
| Risk of bias | ||
| Bias | Authors' judgement | Support for judgement |
| Adequate sequence generation? | Unclear risk | Not reported |
| Allocation concealment? | Unclear risk | Not reported |
| Blinding? All outcomes | Low risk | Quote: "An independent radiologist blinded to the treatment allocation assessed healing." |
| Baseline comparability? | Low risk | Reported characteristics were comparable at baseline, apart from all males receiving bone graft who underwent internal fixation. |
| Explicit inclusion/exclusion criteria? | High risk | Limited details were reported regarding inclusion and exclusion. |
| Intention‐to‐treat analysis? | Low risk | |
| Adequate reporting of drop‐outs? | Low risk | No dropouts. |
| Methods | Randomised controlled trial | |
| Participants | Location: USA Number of participants: 122 (124 nonunions) Diagnosis: Tibial nonunion BMP‐7: Mean age 38±16, 42 males, 21 females, mean weight 171±47 lbs, 26 atrophic nonunions, 47 tobacco users. Autograft: Mean age 31±11, 47 males, 14 females, mean weight 187±40, 15 atrophic nonunions, 35 tobacco users. |
|
| Interventions | All patients received intramedullary rod insertion with either: 1. rhBMP‐7 in a type 1 collagen carrier. Dose based on fracture gap present after debridement (max 3.5 g). 2. fresh autograft bone. |
|
| Outcomes | Weight bearing at 9 months either with less than severe pain at fracture site or not, radiographic bridging in at least 1 view or at least 3 views, no surgical re‐treatment, physician satisfaction, operative length, hospital stay length, operative blood loss, degree of donor site pain, adverse events, antibody production to BMP‐7 and type collagen. | |
| Notes | Funded by Stryker Biotech. Significantly more atrophic nonunions in BMP‐7 group. |
|
| Risk of bias | ||
| Bias | Authors' judgement | Support for judgement |
| Adequate sequence generation? | Unclear risk | Not reported |
| Allocation concealment? | Unclear risk | Not reported |
| Blinding? All outcomes | Low risk | Quote: "A panel of three musculoskeletal radiologists, blinded to treatment and time following surgical procedure, independently assessed". |
| Baseline comparability? | Unclear risk | Apart from significantly more patients in the OP‐1 group with atrophic nonunions than control group. |
| Explicit inclusion/exclusion criteria? | Low risk | Clearly described. |
| Intention‐to‐treat analysis? | High risk | Not performed. |
| Adequate reporting of drop‐outs? | Low risk | No dropouts |
| Methods | Model‐based cost‐utility analysis, based on data on effects and resource use collected from a single empirical study (Govender 2002), supplemented by data on utilities collected from two other utilities studies, data on baseline population risk collected from a single epidemiological study and data on unit costs collected from published UK national sources. | |
| Participants | Jurisdiction: United Kingdom. Analytic perspective: United Kingdom health care system. Time horizon: One year. Diagnosis: Acute open tibial shaft fractures with main diaphyseal component. 1.5 mg/mL BMP, with intramedullary nail fixation and routine soft tissue management: 3330 patients (hypothetical cohort) Intramedullary nail fixation and routine soft tissue management: 3330 patients (hypothetical cohort) |
|
| Interventions | All patients had intramedullary nail fixation with routine soft tissue management, with intervention group receiving 1.50 mg/mL rhBMP‐2 delivered by absorbable Type I bovine collagen sponge as an adjunct. | |
| Outcomes | Total direct medical costs per patient. Incremental cost per QALY. Net cost impact in the United Kingdom. |
|
| Notes | Funded by UK Health Technology Assessment Programme (Project number 04/34/02). | |
| Methods | Randomised controlled trial | |
| Participants | Location: Netherlands Number of participants: 24 Diagnosis: Critically sized fibular defect. Mean age 50 (range 25‐73), ratio of 1.2 males to 1 female |
|
| Interventions | All patients received proximal tibial osteotomies with either: 1. 2.5 mg rhBMP‐7 and 1 g purified insoluble bovine bone type 1 collagen 2. 2.0 mL demineralised particulate bone with glycerol 3. 1g purified insoluble bovine type 1 collagen 4. no treatment |
|
| Outcomes | Radiologic evaluation categorised as 'bridging', 'bone formation' or 'no bone formation'. Bone mineral density was evaluated by Dual Energy X‐Ray absorptiometry. Clinical evaluation including Hospital for Special Surgery Knee score, pain at site assessment and patient satisfaction. Antibodies to BMP‐7 or bovine type 1 collagen with a reaction defined as fourfold increase in Ab titres. |
|
| Notes | Funded by Stryker Biotech | |
| Risk of bias | ||
| Bias | Authors' judgement | Support for judgement |
| Adequate sequence generation? | Unclear risk | Quote: "Patients were assigned to one of four groups." |
| Allocation concealment? | Unclear risk | Not reported |
| Blinding? All outcomes | Low risk | Quote: "Evaluated blindly by two orthopaedic surgeons independently." |
| Baseline comparability? | Low risk | |
| Explicit inclusion/exclusion criteria? | High risk | Quote: "Complied with the criteria of the study". |
| Intention‐to‐treat analysis? | High risk | |
| Adequate reporting of drop‐outs? | High risk | Quote: "Three patients each missed one follow‐up appointment, one at one week after surgery and two at one year, although they were not known to be experiencing problems related to treatment". |
| Methods | Randomised controlled trial | |
| Participants | Location: Australia, Belgium, Canada, United Kingdom, Finland, France, Germany, Israel, Netherlands, Norway and South Africa Number of participants: 450 Diagnosis: Acute open fractures with main diaphyseal component. 0.75 mg/mL BMP: Mean age 37 (range 17‐78), 120 males, 31 females, 73 with recent tobacco use. 1.5 mg/mL BMP: Mean age 33 (range 18‐77), 126 males, 23 females, 75 with recent tobacco use. Surgery alone: Mean age 37 (17‐87), 118 males, 32 females, 66 with recent tobacco use. |
|
| Interventions | All patients had intramedullary nail fixation and routine soft tissue management with two of three groups receiving either: 1. absorbable collage sponge with 0.75 mg/mL rhBMP‐2 2. absorbable collagen sponge with 1.50 mg/mL rhBMP‐2 3. control group: surgery alone Significantly more patients received reamed nailing in group 2 (33% versus 41% versus 27% of followed‐up patients) |
|
| Outcomes | Requirement of secondary intervention due to delayed union or nonunion within 12 months. Time to secondary intervention and degree of invasiveness of secondary intervention. Effect of wound severity on need for secondary intervention. Effect of smoking on need for secondary intervention. Fracture healing, defined as healed when 2 of 3 radiologists reported cortical bridging and/or disappearance of the fracture lines on at least 3 of 4 cortices on anteroposterior and lateral radiographs and full weight bearing and lack of tenderness at the fracture site of palpation. Performance or recommendation of secondary intervention was considered failure. Adverse events, infection and antibody assays to rhBMP‐2, bovine type 1 collagen and human type 1 collagen. |
|
| Notes | Funded by Wyeth Research/ Genetics Institute | |
| Risk of bias | ||
| Bias | Authors' judgement | Support for judgement |
| Adequate sequence generation? | Low risk | Quote: "On the basis of a prospectively define, stratified, blocked randomization schedule, treatments were assigned with use of a central, twenty‐four‐hour, automated system". |
| Allocation concealment? | Low risk | Adequate based on randomisation method. |
| Blinding? All outcomes | Low risk | Quote: "blinded, independent radiographic assessments". |
| Baseline comparability? | High risk | Patient characteristics were comparable apart from the 1.5 mg/mL BMP group had a significantly greater number of younger patients than the 0.75 mg/mL and control groups. |
| Explicit inclusion/exclusion criteria? | High risk | |
| Intention‐to‐treat analysis? | Low risk | Patients analysed in group randomised to, regardless of treatment. |
| Adequate reporting of drop‐outs? | Low risk | Number of dropouts and reasons given. |
| Methods | Cost analysis, based on a single empirical study (Govender 2002). | |
| Participants | Jurisdiction: United States of America. Analytic perspective: 1. Hospital (single provider); 2. Insurer (third‐party payer). Time horizon: Two years. Diagnosis: Acute open tibial shaft fractures with main diaphyseal component. 1.5 mg/mL BMP, with intramedullary nail fixation and routine soft tissue management: 145 patients, 75 with recent tobacco use. Intramedullary nail fixation and routine soft tissue management: 147 patients, 66 with recent tobacco use. |
|
| Interventions | All patients had intramedullary nail fixation with routine soft tissue management, with intervention group receiving 1.50 mg/mL rhBMP‐2 delivered by absorbable Type I bovine collagen sponge as an adjunct. | |
| Outcomes | Total direct medical costs. | |
| Notes | Funding source not stated. | |
| Methods | Randomised controlled trial | |
| Participants | Location: USA Number of participants: 30 Diagnosis: Diaphyseal tibial fractures with cortical defects rhBMP‐2: Mean age 36 (range18‐51), 14 males, 1 female, 6 used tobacco within 1 month of the surgery. Autogenous iliac crest bone graft: Mean age 38 (range 18‐71), 13 males, 2 females, 4 used tobacco within 1 month of the surgery. |
|
| Interventions | All patients underwent staged reconstruction of the tibial defect with either: 1. 1.5 mg/mL rhBMP‐2 (12 mg total dose) on type 1 collagen sponge with allograft bone 2. autogenous iliac crest bone graft |
|
| Outcomes | Clinical and radiographic healing, surgical morbidity, health related quality of life, number of secondary interventions, operative length, blood loss during surgery, adverse events. | |
| Notes | Funded by Wyeth Research | |
| Risk of bias | ||
| Bias | Authors' judgement | Support for judgement |
| Adequate sequence generation? | Unclear risk | Only indication is use of term 'randomized'. |
| Allocation concealment? | Unclear risk | Not reported |
| Blinding? All outcomes | Low risk | Quote: "A blinded independent musculoskeletal radiologist performed separate assessment of outcomes at the end of the trial." |
| Baseline comparability? | Low risk | Patients were comparable. |
| Explicit inclusion/exclusion criteria? | Low risk | Clearly described. |
| Intention‐to‐treat analysis? | Low risk | Quote: "All data were analyzed on an intent‐to‐treat basis (i.e., patient data were included in the treatment group and stratum to which the patient had been randomly assigned)." |
| Adequate reporting of drop‐outs? | Unclear risk | Quote: "Six patients were lost to follow‐up before completion of the full twelve‐month follow‐up period but after fracture‐healing had been established. |
| Methods | Randomised controlled trial | |
| Participants | Location: Italy Number of participants: 14 Diagnosis: Closed tibial fracture OP‐1: Mean age 47 (range 26‐68), 6 males, 1 female. Control: Mean age 40 (range 21‐53), 7 males, 0 females. |
|
| Interventions | 1. All patients had monolateral external fixation treatment; BMP‐7 applied to the fracture site after the external fixator was applied (7). 2. Control (7) |
|
| Outcomes | Fracture union, defined as presence of callus bridging the fracture site on antero‐posterior and lateral radiographs and clinically by the absence of pain and motion at the fracture site. Toxicity outcomes from blood and urine tests. |
|
| Notes | Funding source not reported. | |
| Risk of bias | ||
| Bias | Authors' judgement | Support for judgement |
| Adequate sequence generation? | Unclear risk | Not reported. |
| Allocation concealment? | Unclear risk | Not reported. |
| Blinding? All outcomes | High risk | No assessors were blinded. |
| Baseline comparability? | Unclear risk | Not reported. |
| Explicit inclusion/exclusion criteria? | Unclear risk | Not reported. |
| Intention‐to‐treat analysis? | Unclear risk | Not reported. |
| Adequate reporting of drop‐outs? | Low risk | No dropouts. |
| Methods | Randomised controlled trial | |
| Participants | Location: Not reported Number of participants: 124 Diagnosis: Open tibial shaft fractures amenable to intramedullary nailing. No further patient characteristics reported. |
|
| Interventions | 1. rhBMP‐7 and intramedullary (IM) nailing 2. IM nailing alone |
|
| Outcomes | Pain on weight bearing, pain with activity, adverse events, number of secondary interventions | |
| Notes | Funding source not reported. Abstract only. |
|
| Risk of bias | ||
| Bias | Authors' judgement | Support for judgement |
| Adequate sequence generation? | Unclear risk | Not reported. |
| Allocation concealment? | Unclear risk | Not reported. |
| Blinding? All outcomes | Unclear risk | Not reported. |
| Baseline comparability? | Unclear risk | No details given. |
| Explicit inclusion/exclusion criteria? | High risk | No details given. |
| Intention‐to‐treat analysis? | Unclear risk | Not reported. |
| Adequate reporting of drop‐outs? | Low risk | No dropouts. |
| Methods | Randomised controlled trial with a cost analysis | |
| Participants | Location: Not reported Number of participants: 41 Diagnosis: Nonunions amenable to intramedullary (IM) nailing. |
|
| Interventions | 1. intramedullary nailing 1. BMP‐7 2. autograft |
|
| Outcomes | Consolidation of nonunion, operative length, hospital stay length, complications, autograph pain and treatment cost. | |
| Notes | Funding source not reported. Abstract (poster) only. The lack of information on which cost (resource use) components are included in estimates of 'cost of treatment' severely limits the value of these data and is the main reason the we excluded the cost analysis component of this study from the review. |
|
| Risk of bias | ||
| Bias | Authors' judgement | Support for judgement |
| Adequate sequence generation? | Unclear risk | Not reported. |
| Allocation concealment? | Unclear risk | Not reported. |
| Blinding? All outcomes | Unclear risk | Not reported. |
| Baseline comparability? | Unclear risk | No gender or age data provided. Quote: "duration of nonunion, number of prior surgeries and smoking history were similar in OP‐1 and autograft groups". |
| Explicit inclusion/exclusion criteria? | High risk | Not reported. |
| Intention‐to‐treat analysis? | Unclear risk | Not reported. |
| Adequate reporting of drop‐outs? | Low risk | No dropouts reported. |
| Methods | Model‐based cost‐effectiveness analysis (source of clinical data not stated). | |
| Participants | Jurisdiction: 1. United Kingdom; 2. Germany. Analytic perspective: Hospital (single provider). Time horizon: Not stated. Diagnosis: Nonunion tibial shaft fracture acquired secondary to trauma. UK: OP‐1 (BMP‐7) (dosage not stated) with intramedullary nail fixation and routine soft tissue management: No details of participants reported. UK: Autograft (autogenous iliac crest bone graft) with intramedullary nail fixation and routine soft tissue management: No details of participants reported. UK: Ilizarov fixation with intramedullary nail fixation and routine soft‐tissue management: No details of participants reported. Germany: OP‐1 (BMP‐7) (dosage not stated) with intramedullary nail fixation and routine soft tissue management: No details of participants reported. Germany: Intramedullary nail fixation and routine soft tissue management, with autograft (autogenous iliac crest bone graft) if appropriate: No details of participants reported. |
|
| Interventions | UK: Patients received either OP‐1 (BMP‐7) (dosage not stated) as an adjunct to intramedullary nail fixation and routine soft tissue management (treatment), or Autograft (autogenous iliac crest bone graft) as an adjunct to IM with routine soft‐tissue management (Control 1), or Ilizarov fixation as an adjunct to IM with routine soft‐tissue management (Control 2). Germany: Patients received either OP‐1 (BMP‐7) (dosage not stated) as an adjunct to intramedullary nail fixation and routine soft tissue management (treatment), or intramedullary nail fixation and routine soft tissue management, with autograft (autogenous iliac crest bone graft) if appropriate. |
|
| Outcomes | Total direct medical costs per patient. Incremental cost per healed fracture. |
|
| Notes | Funding source not stated. | |
Characteristics of excluded studies [ordered by study ID]
| Study | Reason for exclusion |
|---|---|
| Alt 2006b | Study is not a full or partial economic evaluation ‐ no quantitative analysis reported. |
| Alt 2009 | The emphasis of the revised analysis is on the difference between countries, focusing on grade III only as the patient group for which use of BMP‐2 is most likely to be judged favourably from an economic point of view, and that its inclusion would be unlikely to significantly affect the conclusions of the economics component of this first version of the review. |
| Bilic 2006 | Study includes patients younger than 16 years old. |
| Csimma 2005 | Just a commentary on conducting multi‐centre trials that refers to Govender 2002. |
| Dahabreh 2007 | Concern regarding selection bias ‐ study is an economic analysis which compares costs of treatment prior to use of BMP with costs of treatment after use of BMP in the same sample of patients. |
| Kanakaris 2007 | Study is not a full or partial economic evaluation ‐ no original analysis reported. |
| Khan 2004 | Study is not a full or partial economic evaluation. |
| MAS 2005 | Study is not a full or partial economic evaluation. |
| WSDLI 2003 | Study is not a full or partial economic evaluation ‐ no original analysis reported. |
| Xiao 2007 | Patients had a serious co‐morbidity: osteoporosis. |
Characteristics of studies awaiting assessment [ordered by study ID]
| Methods | Randomised single‐blind trial, stratified by fracture severity |
| Participants | 277 patients with open tibial fractures |
| Interventions | Standard of care plus an absorbable collagen sponge implant containing rhBMP‐2 1.5 mg/mL (total 12.0 mg) versus standard of care. Standard of care was reamed intramedullary nail fixation and routine soft‐tissue management. |
| Outcomes | Fracture healing, secondary procedures, adverse events including infection |
| Notes | Trial dates or funding not detailed. |
| Methods | Randomised controlled trial. |
| Participants | 60 patients with open tibial fractures |
| Interventions | All patients had intramedullary nail fixation and routine soft tissue management with two of three groups receiving either: 1. absorbable collage sponge with 0.75 mg/mL rhBMP‐2 2. absorbable collagen sponge with 1.50 mg/mL rhBMP‐2 3. control group: surgery alone |
| Outcomes | These will have included: Requirement of secondary intervention due to delayed union or nonunion within 12 months. Time to secondary intervention and degree of invasiveness of secondary intervention. Infection. |
| Notes | Study was conducted at 10 centres in USA. It used the same study methods / design as Govender 2002. An analysis including a subgroup of participants from this trial and Govender 2002 was published in Swiontkowski 2006. Communication from Prof Swiontkowski confirmed that this trial was sponsored by Wyeth and has never been published independently as it was underpowered for the pre‐determined endpoints. |
| Methods | Treatment, randomised, double‐blind, active control, parallel assignment, safety study |
| Participants | Estimated 367 patients with closed diaphyseal tibial fractures |
| Interventions | Single injection of rhBMP‐2/CPM versus standard of care |
| Outcomes | Primary outcome measures: The primary objective of this study is to assess whether a single dose of rhBMP‐2/CPM administered in combination with the SOC accelerates fracture union and return to normal function as indicated on radiographs and functional evaluations. [Time frame: efficacy will be demonstrated if there is a greater than or equal to 4 week reduction in time to fracture union and time to FWB without pain between either of the active treatment groups and the SOC control group ] [Designated as safety issue: No] Secondary outcome measures: Demonstrate safety of rhBMP‐2/CPM administration; demonstrate earlier return to function; assess feasibility of rhBMP‐2CPM administration. Subject enrolment 12 months [Time frame: 12 months] [Designated as safety issue: Yes] |
| Notes | Start date: November 2006. The trial was terminated. The last patients to be followed for safety reasons were at Norwich, UK. A final report is expected by the end of 2010. |
Characteristics of ongoing studies [ordered by study ID]
| Trial name or title | rhBMP‐2 versus autograft in critical size tibial defects |
| Methods | Randomized, single blind (outcomes assessor), parallel assignment, safety/efficacy study |
| Participants | Estimated 50 patients with open tibia fracture with bone defect |
| Interventions | recombinant human bone morphogenetic protein 2 (rhBMP‐2) versus autogenous iliac crest bone graft |
| Outcomes | Primary outcome measures: Fracture healing (union) at 12 months Secondary outcome measures: Wound healing and infection [Time frame: The patients in both groups will be evaluated at 2 weeks, 6 weeks, 12 weeks, 18 weeks, 6 months and 12 months] Cost‐effectiveness evaluation [Time frame: 12 months post op] |
| Starting date | March 2009 |
| Contact information | Contact: Lisa Cannada, MD Contact: Mark Zocchi |
| Notes |
| Trial name or title | A randomised controlled cost study of infuse BMP 2 vs iliac crest autograft for non union of long bone fractures |
| Methods | Randomised, single blind (participant), active control, parallel assignment, safety/efficacy study |
| Participants | Estimated 80 patients with nonunion diaphyseal fractures |
| Interventions | Infuse bone morphogenic protein (BMP) 2 versus iliac crest autograft |
| Outcomes | Primary outcome measures: cost analysis based on length of hospital stay, allograft, blood products and costs associated with complications and/ or re‐admission. [Time Frame: 2 years] Secondary outcome measures: Secondary efficacy end points will be the radiographic assessment of healing (RUST scale), the clinical assessment of weight‐bearing status at 6 months post treatment, and the incidence of additional surgical/medical interventions to promote healing. [Time frame: 2 years] |
| Starting date | March 2009 |
| Contact information | Dr. Ross Leighton |
| Notes |
| Trial name or title | A prospective randomised controlled trial on the use of bone morphogenetic 7 (BMP‐7) (OP‐1®) and demineralized bone matrix in tibial non‐union |
| Methods | Prospective, randomised partially‐blinded study |
| Participants | Estimated 30 patients with non‐union of diaphyseal tibial fracture |
| Interventions | BMP‐7 in adjunct to fresh frozen allograft versus allograft together with demineralised bone matrix |
| Outcomes | Primary outcome measures: X‐ray evaluation [Time frame: After 9 months] [Designated as safety issue: No] Change in VAS and LEFS scores [Time frame: After 9 months] [Designated as safety issue: Yes] Secondary outcome measures: Time of incapacity to work [Time frame: Until ability to work ] [Designated as safety issue: No] Change in SF‐36 [Time Frame: After 4 years] [Designated as safety issue: No] Total socio‐economic cost estimation [Time frame: After 4 years] [ Designated as safety issue: No] Repeated surgery (minor and major) [Time frame: After 4 years ] [Designated as safety issue: Yes] (Surgical) complications [Time frame: After 4 years] [Designated as safety issue: Yes] Ability to bear weight (% of body weight) [Time frame: After 4 years] |
| Starting date | October 2007 |
| Contact information | Stefan Desmyter, MD stefandesmyter@yahoo.com |
| Notes |
| Trial name or title | A phase 2, multicenter, single‐blind, randomised, stratifies, standard‐of‐care controlled, feasibility and safety study of rh‐BMP‐2/CPM as an adjuvant therapy for fractures of the proximal femur. |
| Methods | Randomised controlled trial |
| Participants | 108 patients with proximal femur fractures |
| Interventions | rhBMP‐2 and CPM versus standard of care |
| Outcomes | To demonstrate the safety of administering rhBMP‐2/CPM (either 1mg/ml or 2mg/ml) as an adjunct to internal fixation in subjects with fractures of the proximal femur. The key safety outcome is the incidence of secondary fracture displacement among subjects treated with rh‐BMP‐2/CPM and those receiving standard surgical treatment (internal fixation) alone. To establish a satisfactory method of administering rhBMP‐2/CPM to implement in a phase 3 efficacy trial in this clinical indication. To estimate the success and failure rates associated with key fracture outcomes. |
| Starting date | 21/03/2007 |
| Contact information | Mr AD Patel Consultant Orthopaedic Surgeon Institute of Orthopaedics Norfolk and Norwich University Hospital NHS Trust Colney Lane Norwich NR4 7UY Telephone: 01603 286711 Fax: 01603 287140 E‐mail: AD.Patel@nnuh.nhs.uk |
| Notes |
| Trial name or title | A study of rhBMP‐2/CPM in closed fractures of the humerus |
| Methods | Treatment, randomised, double blind (participant, investigator), active control, parallel assignment, safety/efficacy study |
| Participants | 139 patients with closed humeral fractures |
| Interventions | A: Experimental 1.0 mg/mL rhBMP‐2/CPM + SOC B: Experimental 2.0 mg/mL rhBMP‐2/CPM + SOC C: Active comparator buffer/CPM + SOC D Standard of care alone (SOC) |
| Outcomes | The primary efficacy variable in this study is radiographic union. [Time frame: Fracture union is assessed at 4, 6, 8, 10, 12, 16, 26 and 52 week visits. The goal of acceleration of fracture union will be met if median time to radiographic fracture union is decreased by 4 weeks in an active treatment arm compared to SOC alone.] |
| Starting date | November 2006 |
| Contact information | Principle investigator: Trial manager for Brazil, xavierl@wyeth.com Principle investigator: Trial manager for Mexico, gomezzlj@wyeth.com |
| Notes |
| Trial name or title | Study evaluating rhBMP‐2/CPM in closed distal radius fractures |
| Methods | Treatment, randomised, double‐blind, placebo control, single group assignment, safety study |
| Participants | Estimated 40 patients with closed distal radius fractures |
| Interventions | rhBMP‐2/CPM versus standard of care control |
| Outcomes | Primary outcome measures: Determine the safety of administering rhBMP‐2/CPM to subjects with distal radius fractures that require surgical fixation. Secondary outcome measures: Feasibility of the test article injection procedure and localization of the test article relative to the distal radius fracture site. |
| Starting date | September 2005 |
| Contact information | Principal investigator: Trial Manager for Finland, MedInfoNord@wyeth.com |
| Notes |
Contributions of authors
KRG and IS were involved in all aspects of the review. JJR and FS were involved in designing the review as well as data collection and data analysis. MM commented on drafts and assisted with review of economics material. IH provided assistance in data interpretation and VA provided general advice on the review.
Sources of support
Internal sources
University of East Anglia, UK.
External sources
National Coordinating Centre for Health Technology Assessment, UK.
Declarations of interest
Simon Donell is currently involved in two clinical trials of BMP‐2 for Wyeth. Two co‐authors of this Cochrane review (FS and IS) had direct involvement in developing the revised economic model (this was undertaken independently of the original model's developers and sponsors, using funds provided by the UK National Coordinating Centre for Health Technology Assessment), and along with others (KG, SD, JR, MM and IH) are also co‐authors of the parallel UK Health Technology Assessment report (Garrison 2007). Two co‐authors of this Cochrane review (VA and SD) had direct involvement in conducting one of the included cost analysis studies (Alt 2006a). VA is an external consultant for Medtronic. Since completing this Cochrane review, four co‐authors (KG, SD, IS and FS) have provided research consultancy to Medtronic on the efficacy, safety costs and cost‐effectiveness of BMP2 in spinal fusion.
New
References
References to studies included in this review
- Alt V, Donell ST, Chhabra A, Eicher A, Schnettler R. BMP‐2 is a cost‐effective therapy in grade III open tibia fractures ‐ A health‐economic assessment of the use BMP‐2 in open tibia fractures for European healthcare systems [oral paper]. 8th European Federation of National Associations of Orthopaedics and Traumatology (EFORT) Congress; 2007 May 11‐15; Firenze, Italy. ; Alt V, Eicher A, Bitschnau A, Schnettler R. Cost‐benefit analysis of the use of rhBMP‐2 in open tibial fractures: savings from a health insurer's perspective. [Kosten‐Nutzen‐Betrachtungdes Einsatzes vonrhBMP‐2 bei offenenTibiafrakturenNettoeinsparungenaus Krankenkassensicht erzielbar]. Unfallchirurg 2006;109(6):463‐70. [MEDLINE: ] [DOI] [PubMed] [Google Scholar]
- Calori GM, D'Avino M, Tagliabue L, Albisetti W, d'Imporzano M, Peretti G. An ongoing research for evaluation of treatment with BMPs or AGFs in long bone non‐union: protocol description and preliminary results. Injury 2006;37(Suppl 3):S43‐50. [MEDLINE: ] [DOI] [PubMed] [Google Scholar]
- Chen G, Yang JZ, Xu HM, Wang M. The application of NNB/BMP complex in the treatment of ununited‐tibia fracture. Orthopedic Journal of China 2000;7:758‐61. [Google Scholar]
- Cook SD. Preclinical and clinical evaluation of osteogenic protein‐1 (BMP‐7) in bony sites. Orthopedics 1999;22(7):669‐71. [MEDLINE: ] [PubMed] [Google Scholar]
- Ekrol I, Hajducka C, Court‐Brown C, McQueen MM. A comparison of RhBMP‐7 (OP‐1) and autogenous graft for metaphyseal defects after osteotomy of the distal radius. Injury 2008;39(Suppl 2):S73‐82. [MEDLINE: ] [DOI] [PubMed] [Google Scholar]
- Duncan M. OP device vs. bone autograft for the treatment of tibial nonunions. http://clinicaltrials.gov/show/NCT00679328 (accessed March 11 2010). ; Friedlaender GE, Perry CR, Cole JD, Cook SD, Cierny G, Muschler GF, et al. Osteogenic protein‐1 (bone morphogenetic protein‐7) in the treatment of tibial nonunions. Journal of Bone & Joint Surgery ‐ American Volume 2001;83 Suppl 1(Pt 2):S151‐8. [MEDLINE: ] [PMC free article] [PubMed] [Google Scholar]
- Garrison KR, Donell S, Ryder J, Shemilt I, Mugford M, Harvey I, et al. Clinical and cost‐effectiveness of bone morphogenetic proteins in the non‐healing of fractures and spinal fusion: a systematic review. Health Technology Assessment 2007;11(30):1‐150. [MEDLINE: ] [DOI] [PubMed] [Google Scholar]
- Geesink RG, Hoefnagels NH, Bulstra SK. Osteogenic activity of OP‐1 bone morphogenetic protein (BMP‐7) in a human fibular defect. Journal of Bone & Joint Surgery ‐ British Volume 1999;81(4):710‐18. [MEDLINE: ] [DOI] [PubMed] [Google Scholar]
- Govender S, Csimma C, Genant HK, Valentin‐Opran A, Amit Y, Arbel R, et al. Recombinant human bone morphogenetic protein‐2 for treatment of open tibial fractures ‐ A prospective, controlled, randomized study of four hundred and fifty patients. Journal of Bone & Joint Surgery ‐ American Volume 2002;84(12):2123‐34. [MEDLINE: ] [DOI] [PubMed] [Google Scholar]; Swiotkowski MF, Aro HT, Donell S, Esterhai JL, Goulet J, Jones A, et al. Recombinant human bone morphogenetic protein‐2 in open tibial fractures. A subgroup analysis of data combined from two prospective randomized studies. Journal of Bone & Joint Surgery ‐ American Volume 2006;88(6):1258‐65. [DOI] [PubMed] [Google Scholar]
- Jones AL. Recombinant human bone morphogenetic protein‐2 in fracture care. Journal of Orthopaedic Trauma 2005;19(Suppl 10):S23‐5. [DOI] [PubMed] [Google Scholar]; Jones AL, Swiontkowski MF, Polly DW, Duff SB, Ackerman SJ. Use of rhBMP‐2 in the treatment of open tibial shaft fractures: Do improved clinical outcomes outweigh the additional expense of rhBMP‐2 [poster]. Proceedings of the 20th Annual Meeting of the Orthopaedic Trauma Association; 2004 Oct 8‐10; Hollywood (FL). Available from www.hwbf.org/ota/am/ota04/otapo/OTP04015.htm (accessed 09 December 2009).
- Jones AL, Bucholz RW, Bosse MJ, Mirza SK, Lyon TR, Webb LX, et al. Recombinant human BMP‐2 and allograft compared with autogenous bone graft for reconstruction of diaphyseal tibial fractures with cortical defects. A randomized, controlled trial. Journal of Bone and Joint Surgery ‐ American Volume 2006;88(7):1431‐41. [MEDLINE: ] [DOI] [PubMed] [Google Scholar]
- Maniscalco P, Gambera D, Bertone C, Rivera F, Crainz E, Urgelli S. Healing of fresh tibial fractures with OP‐1. A preliminary report. Acta Bio‐Medica de l Ateneo Parmense 2002;73(1‐2):27‐33. [MEDLINE: ] [PubMed] [Google Scholar]
- McKee MD, Schemitsch EH, Waddell JP, Kreder HJ, Stephen DJG, Leighton RK, et al. The effect of human recombinant bone morphogenic protein (rhBMP‐7) on the healing of open tibial shaft fractures: results of a multi‐center, prospective, randomized clinical trial [abstract]. Proceedings of the 18th Annual Meeting of the Orthopaedic Trauma Association; 2002 Oct 11‐13; Toronto (ON). Available from www.hwbf.org/ota/am/ota02/otapa/OTA02745.htm (accessed 09 December 2009).
- Perry CR, Cole D, Perry M, Cierny G. Osteogenic protein (OP‐1) vs autograft in the management of tibial non‐unions [poster]. Proceedings of the 13th Annual Meeting of the Orthopaedic Trauma Association; 1997 Oct 17‐19; Louisville (KY). Available from www.hwbf.org/ota/am/ota97/otapo/OTP97064.htm. Louisville, Kentucky, (accessed 09 December 2009).
- Engen AK, Vinken A, Andrew G. The cost‐effectiveness of Osigraft (Osteogenic Protein 1) in the treatment of tibial non‐unions in the UK and Germany [poster]. 6th European Federation of National Associations of Orthopaedics and Traumatology (EFORT) Congress; 2003 June 4‐10; Helsinki (FI).
References to studies excluded from this review
- Alt V, Heissel A. Economic considerations for the use of recombinant human bone morphogenetic protein‐2 in open tibial fractures in Europe: the German model. Current Medical Research & Opinion 2006;22(Suppl 1):S19‐S22. [MEDLINE: ] [DOI] [PubMed] [Google Scholar]
- Alt V, Donell ST, Chhabra A, Bentley A, Eicher A, Schnettler R. A health economic analysis of the use of rhBMP‐2 in Gustilo‐Anderson grade III open tibial fractures for the UK, Germany, and France. Injury 2009;40(12):1269‐75. [DOI] [PubMed] [Google Scholar]
- Bilic R, Simic P, Jelic M, Stern‐Padovan R, Dodig D, Meerdervoort HP, et al. Osteogenic protein‐1 (BMP‐7) accelerates healing of scaphoid non‐union with proximal pole sclerosis. International Orthopaedics 2006;30(2):128‐34. [MEDLINE: ] [DOI] [PMC free article] [PubMed] [Google Scholar]
- Csimma C, Swiontkowski MF. Large clinical trials in musculoskeletal trauma: are they possible? Lessons learned from the international study of the use of rhBMP‐2 in open tibial fractures. Journal of Bone & Joint Surgery ‐ American Volume 2005;87(1):218‐22. [MEDLINE: ] [DOI] [PubMed] [Google Scholar]
- Dahabreh Z, Dimitriou R, Giannoudis PV. Health economics: a cost analysis of treatment of persistent fracture non‐unions using bone morphogenetic protein‐7. Injury 2007;38(3):371‐7. [MEDLINE: ] [DOI] [PubMed] [Google Scholar]
- Kanakaris NK, Giannoudis PV. The health economics of the treatment of long‐bone non‐unions. Injury 2007;38(Suppl 2):S77‐S84. [MEDLINE: ] [DOI] [PubMed] [Google Scholar]
- Khan SN, Lane JM. The use of recombinant human bone morphogenetic protein‐2 (rhBMP‐2) in orthopaedic applications. Expert Opinion on Biological Therapy 2004;4(5):741‐8. [MEDLINE: ] [DOI] [PubMed] [Google Scholar]
- Medical Advisory Secretariat (MAS). Osteogenic protein‐1 for long bone nonunion: an evidence‐based analysis. Ontario Health Technology Assessment Series 2005;5(6):1‐57. [PMC free article] [PubMed] [Google Scholar]
- Washington State Department of Labor and Industries (WSDLI). Bone morphogenic proteins (BMP) for long bone fractures and for use in spinal fusion procedures. Washington: Department of Labor and Industries, Office of the Medical Director, 2003. Available from www.lni.wa.gov/ClaimsIns/Files/OMD/BmpTa092903.pdf (accessed 09 December 2009). [Google Scholar]
- Xiao R‐C, Li NN, Tang ZH, Jiang YC, Li Q, Liu Y, et al. Bone morphogenetic protein vs iliac bone graft substitute with internal fixation in the treatment of osteoporotic intertrochanteric fracture. Journal of Clinical Rehabilitative Tissue Engineering Research 2007;11(21):4077‐80. [EMBASE: 2007338140] [Google Scholar]
References to studies awaiting assessment
- Aro HT, Govender S, Patel AD, Raschke M, Hernigou P, Golden JD, et al. Recombinant human bone morphogenetic protein‐2 and reamed intramedullary nailing of tibia fracture (abstract). American Academy of Orthopaedic Surgeons Annual Meeting; Mar 09‐12; 2010, New Orleans (LA). http://www3.aaos.org/education/anmeet/anmt2010/podium/podium.cfm?Pevent=380 (accessed 15 May 2010).
- Swiontkowski MF. personal communication May 5 2010. ; Swiontkowski MF, Aro HT, Donell S, Esterhai JL, Goulet J, Jones A, et al. Recombinant human bone morphogenetic protein‐2 in open tibial fractures. A subgroup analysis of data combined from two prospective randomized studies. Journal of Bone & Joint Surgery ‐ American Volume 2006;88(6):1258‐65. [DOI] [PubMed] [Google Scholar]
- Wyeth. A Phase 2/3 Multicenter, Controlled Trial of rhBMP‐2/CPM in Tibial Fractures. http://clinicaltrials.gov/show/NCT00387686 16 March 2010.
References to ongoing studies
- Cannada L. rhBMP‐2 versus autograft in critical size tibial defects. http://clinicaltrials.gov/show/NCT00853489 (accessed 11 March 2010).
- Leighton R. A randomized controlled cost study of infuse BMP 2 vs iliac crest autograft for non union of long bone fractures. http://clinicaltrials.gov/show/NCT00856479 (accessed 11 March 2010).
- Verdonk R. A prospective randomized controlled trial on the use of Bone Morphogenetic 7 (BMP‐7) (OP‐1®) and demineralized bone matrix in tibial non‐union. http://clinicaltrials.gov/show/NCT00551941 (accessed 16 March 2010).
- Patel AD. A phase 2, multicenter, single‐blind, randomized, stratified, standard‐of‐care controlled, feasibility and safety study of rh‐BMP‐2/CPM as an adjuvant therapy for fractures of the proximal femur. https://portal.nihr.ac.uk/Profiles/NRR.aspx?Publication_ID=N0547192966 (accessed 09 December 2009). ; Wyeth. Feasibility and safety study of rhBMP‐2/CPM for fractures of the proximal femur. http://clinicaltrials.gov/show/NCT00384358 (accessed 16 March 2010).
- Wyeth. A study of rhBMP‐2/CPM in closed fractures of the humerus. http://clinicaltrials.gov/show/NCT00384852 (accessed 16 March 2010).
- Wyeth. Study evaluating rhBMP‐2/CPM in closed distal radius fractures. http://clinicaltrials.gov/show/NCT00161629 (accessed 16 March 2010).
Additional references
- Abacus International ‐ Specialist Health Economics Consultancy. Economic evaluation model to evaluate cost‐effectiveness of rhBMP‐2 in the treatment of open tibial fractures (as supplied 2006). Data on file. Bicester (Ox): Abacus International.
- Arrington ED, Smith WJ, Chambers HG, Bucknell AL, Davino NA. Complications of iliac crest bone graft harvesting. Clinical Orthopaedics & Related Research 1996;(329):300‐9. [MEDLINE: ] [DOI] [PubMed] [Google Scholar]
- Banwart J, Asher M, Hassanein R. Iliac crest bone graft harvest donor site morbidity: A statistical evaluation. Spine 1995;20(9):1055‐60. [MEDLINE: ] [DOI] [PubMed] [Google Scholar]
- Bhandari M, Adili A, Leone J, Lachowski RJ, Kwok DC. Early versus delayed operative management of closed tibial fractures. Clinical Orthopaedics & Related Research 1999;(368):230‐9. [MEDLINE: ] [PubMed] [Google Scholar]
- Bhandari M, Guyatt GH, Swiontkowski MF, Schemitsch EH. Treatment of open fractures of the shaft of the tibia. Journal of Bone & Joint Surgery ‐ British Volume 2001;83(1):62‐8. [MEDLINE: ] [DOI] [PubMed] [Google Scholar]
- Caudle RJ, Stern PJ. Severe open fractures of the tibia. Journal of Bone & Joint Surgery ‐ American Volume 1987;69(6):801‐7. [MEDLINE: ] [PubMed] [Google Scholar]
- Cooper N, Coyle D, Abrams K, Mugford M, Sutton A. Use of evidence in decision models: an appraisal of health technology assessments in the UK since 1997. Journal of Health Services Research and Policy 2005;10(4):245‐50. [MEDLINE: ] [DOI] [PubMed] [Google Scholar]
- Court‐Brown CM, Cross AT, Hahn DM, Marsh DR, Willett K, Quaba AA, et al. A report by the British Orthopaedic Association/British Association of Plastic Surgeons Working Party on the management of open tibial fractures. September 1997. British Journal of Plastic Surgery1997; Vol. 50, issue 8:570‐83. [EMBASE: 1998017257]
- Craig D, Rice S. CRD Report 6: NHS Economic Evaluation Database Handbook (3rd Edition). CRD Report 6: NHS Economic Evaluation Database Handbook. 3rd Edition. York, UK: Centre for Reviews and Dissemination, University of York, 2007:1‐110. [Google Scholar]
- Dahabreh Z, Dimitriou R, Giannoudis PV. Health economics: a cost analysis of treatment of persistent fracture non‐unions using bone morphogenetic protein‐7. Injury 2007;38(3):371‐7. [MEDLINE: ] [DOI] [PubMed] [Google Scholar]
- Dervin GF. Skeletal fixation of grade IIIB tibial fractures: The potential of metaanalysis. Clinical Orthopaedics & Related Research 1996;(332):10‐5. [MEDLINE: ] [DOI] [PubMed] [Google Scholar]
- Dhawan A, Kuklo TR, Bronfman E, Polly DW Jr. Analysis of iliac crest bone graft process measures (Abstract). Scoliosis Research Society (SRS) Annual Meeting. Seattle, WA, 2002. [Google Scholar]
- Donaldson LJ, Reckless IP, Scholes S, Mindell JS, Shelton NJ. The epidemiology of fractures in England. Journal of Epidemiology & Community Health 2008;62:174‐80. [MEDLINE: ] [DOI] [PubMed] [Google Scholar]
- Drummond MF, Jefferson TO. Guidelines for authors and peer reviewers of economic submissions to the BMJ. The BMJ Economic Evaluation Working Party. BMJ 1996;313(7052):275‐83. [MEDLINE: ] [DOI] [PMC free article] [PubMed] [Google Scholar]
- Drummond MF, Sculpher MJ, Torrance GW, O'Brien BJ, Stoddart GL. Methods for the Economic Evaluation of Health Care Programmes. 3rd Edition. Oxford, UK: Oxford University Press, 2005:11. [Google Scholar]
- Friedlaender GE, Perry CR, Cole JD, Cook SD, Cierny G, Muschler GF, et al. Osteogenic protein‐1 (bone morphogenetic protein‐7) in the treatment of tibial nonunions. The Journal of Bone & Joint Surgery ‐ American Volume 2001;83‐A Suppl 1(Pt 2):S151‐8. [MEDLINE: ] [PMC free article] [PubMed] [Google Scholar]
- Friedlaender GE. Osteogenic protein‐1 in treatment of tibial nonunions: current status. Surgical Technology International 2004;13:249‐52. [MEDLINE: ] [PubMed] [Google Scholar]
- Goulet JA, Senunas LE, DeSilva GL, Greenfield ML. Autogenous iliac crest bone graft: Complications and functional assessment. Clinical Orthopaedics & Related Research 1997;(339):76‐81. [MEDLINE: ] [DOI] [PubMed] [Google Scholar]
- Hall SE, Criddle RA, Comito LT, Prince RL. A case‐control study of quality of life and functional impairment in women with long‐standing vertebral osteoporotic fracture. Osteoporosis International 1999;9(6):508‐15. [MEDLINE: ] [DOI] [PubMed] [Google Scholar]
- Higgins JPT, Green S (editors). Appendix 5b: Highly sensitive search strategies for identifying reports of randomized controlled trials in MEDLINE. In: Cochrane Handbook for Systematic Reviews of Interventions Version 4.2.6 (updated September 2006). The Cochrane Collaboration, 2006. Available from www.cochrane.org/resources/handbook/Handbook4.2.6Sep2006.pdf.
- Higgins JPT, Altman DG (editors). Chapter 8: Assessing risk of bias in included studies. In: Higgins JPT, Green S (editors). Cochrane Handbook for Systematic Reviews of Interventions Version 5.0.1 [updated September 2008]. The Cochrane Collaboration, 2008. Available from www.cochrane‐handbook.org.
- Jones AL, Bucholz RW, Bosse MJ, Mirza SK, Lyon TR, Webb LX, et al. Recombinant human BMP‐2 and allograft compared with autogenous bone graft for reconstruction of diaphyseal tibial fractures with cortical defects. A randomized, controlled trial. Journal of Bone & Joint Surgery ‐ American Volume 2006;88(7):1431‐41. [MEDLINE: ] [DOI] [PubMed] [Google Scholar]
- Kanakaris NK, Giannoudis PV. The health economics of the treatment of long‐bone non‐unions. Injury 2007;38(Suppl 2):S77‐84. [MEDLINE: ] [DOI] [PubMed] [Google Scholar]
- Henanff A, Giraudeau B, Baron G, Ravaud P. Quality of reporting of noninferiority and equivalence randomized trials. JAMA 2006;295(10):1172‐4. [DOI] [PubMed] [Google Scholar]
- Lexchin J, Bero L, Djulbegovic B, Clark O. Pharmaceutical industry sponsorship and research outcome and quality: systematic review. BMJ 2003;326(7400):1167‐70. [MEDLINE: ] [DOI] [PMC free article] [PubMed] [Google Scholar]
- Limb Centre ‐ The Institute for Lower Extremity Reconstruction. Open fractures and trauma. www.limbcenter.com/disorders/index.asp (accessed 09 December 2009).
- Littenberg B, Weinstein LP, McCarren M, Mead T, Swiontkowski MF, Rudicel SA, et al. Closed fractures of the tibial shaft: a meta‐analysis of three methods of treatment. Journal of Bone & Joint Surgery ‐ American Volume 1998;80(2):174‐83. [MEDLINE: ] [DOI] [PubMed] [Google Scholar]
- Phillips Z, Ginnelly L, Sculpher M, Claxton K, Golder S, Riemsma R, et al. Review of guidelines for good practice in decision‐analytic modelling in health technology assessment. Health Technology Assessment 2004;8(36):iii‐iv, ix‐xi, 1‐158. [MEDLINE: ] [DOI] [PubMed] [Google Scholar]
- Riemer BL, DiChristina DG, Cooper A, Savig S, Butterfield SL, Burke CJ 3rd, et al. Nonreamed nailing of tibial diaphyseal fractures in blunt polytrauma patients. Journal of Orthopaedic Trauma 1995;9(1):66‐75. [MEDLINE: ] [DOI] [PubMed] [Google Scholar]
- Robertson PA, Wray AC. Natural history of posterior iliac crest bone graft donation for spinal surgery: a prospective analysis of morbidity. Spine 2001;26(13):1473‐6. [MEDLINE: ] [DOI] [PubMed] [Google Scholar]
- Salkeld G, Cameron ID, Cumming RG, Easter S, Seymour J, Kurrle SE, et al. Quality of life related to fear of falling and hip fracture in older women: a time trade off study. BMJ 2000;320(7231):341‐6. [MEDLINE: ] [DOI] [PMC free article] [PubMed] [Google Scholar]
- Samartzis D, Khanna N, Shen FH, An HS. Update on bone morphogenetic proteins and their application in spine surgery. Journal of the American College of Surgeons 2005;200(2):236‐48. [MEDLINE: ] [DOI] [PubMed] [Google Scholar]
- Sanders R, Jersinovich I, Anglen J, DiPasquale T, Herscovici D Jr. The treatment of open tibial shaft fractures using an interlocked intramedullary nail without reaming. Journal of Orthopaedic Trauma 1994;8(6):504‐10. [MEDLINE: ] [PubMed] [Google Scholar]
- Sasso RC, LeHuec JC, Shaffrey C, Spine Interbody Research Group. Iliac crest bone graft donor site pain after anterior lumbar interbody fusion: a prospective patient satisfaction outcome assessment.. Journal of Spinal Disorders & Techniques 2005;18 Suppl:S77‐S81. [MEDLINE: ] [DOI] [PubMed] [Google Scholar]
- Schoelles K, Snyder D, Kaczmarek J, Kuserk E, Erinoff E, Turkelson C, et al. The role of bone growth stimulating devices and orthobiologics in healing nonunion fractures. AHRQ Technology Assessment Program. Rockville, Maryland, 2005. [PubMed]
- Shemilt I, Mugford M, Byford S, Drummond M, Eisenstein E, Knapp M, et al. Chapter 15: Incorporating economics evidence. Higgins JPT, Green S (editors), Cochrane Handbook for Systematic Reviews of Interventions Version 5.0.1 [updated September 2008]. The Cochrane Collaboration, 2008. Available from www.cochrane‐handbook.org.
- Shemilt I, Thomas J, Morciano M. A new web‐based tool for adjusting costs to a specific target currency and price year. Evidence and Policy 2010;6(1):51‐9. [Google Scholar]
- Swiontkowski MF, Aro HT, Donell S, Esterhai JL, Goulet J, Jones A, et al. Recombinant human bone morphogenetic protein‐2 in open tibial fractures. A subgroup analysis of data combined from two prospective randomized studies. Journal of Bone & Joint Surgery ‐ American Volume 2006;88(6):1258‐1265. [DOI] [PubMed] [Google Scholar]
- Szpalski M, Gunzburg R. Recombinant human bone morphogenetic protein‐2: a novel osteoinductive alternative to autogenous bone graft?. Acta Orthopaedica Belgica 2005;71(2):133‐48. [MEDLINE: ] [PubMed] [Google Scholar]
- Termaat MF, Boer FC, Bakker FC, Patka P, Haarman HJ. Bone morphogenetic proteins. Development and clinical efficacy in the treatment of fractures and bone defects. Journal of Bone and Joint Surgery ‐ American Volume 2005;87(6):1367‐78. [MEDLINE: ] [DOI] [PubMed] [Google Scholar]
- Vaccaro AR, Chiba K, Heller JG, Patel TCh, Thalgott JS, Truumees E, et al. Bone grafting alternatives in spinal surgery. Spine Journal: Official Journal of the North American Spine Society 2002;2(3):206‐15. [MEDLINE: ] [DOI] [PubMed] [Google Scholar]
- Vyrostek SB, Annest JL, Ryan GW. Surveillance for fatal and nonfatal injuries ‐ United States, 2001. Morbidity & Mortality Weekly Report. Surveillance Summaries 2004;53(7):1‐57. [MEDLINE: ] [PubMed] [Google Scholar]
References to other published versions of this review
- Garrison KR, Donell S, Ryder J, Shemilt I, Mugford M, Harvey I, et al. Clinical effectiveness and cost‐effectiveness of bone morphogenetic proteins in the non‐healing of fractures and spinal fusion: a systematic review. Health Technology Assessment 2007;11(30):1‐150. Available from www.hta.ac.uk/project/1481.asp. [MEDLINE: ] [DOI] [PubMed] [Google Scholar]