

Abstract
Background
Angiotensin receptor blockers (ARBs) are widely prescribed for hypertension so it is essential to determine and compare their effects on blood pressure (BP), heart rate and withdrawals due to adverse effects (WDAE).
Objectives
To quantify the dose‐related systolic and/or diastolic BP lowering efficacy of ARBs versus placebo in the treatment of primary hypertension.
Search methods
We searched CENTRAL (The Cochrane Library 2007, Issue 1), MEDLINE (1966 to February 2007), EMBASE (1988 to February 2007) and reference lists of articles.
Selection criteria
Double‐blind, randomized, controlled trials evaluating the BP lowering efficacy of fixed‐dose monotherapy with an ARB compared with placebo for a duration of 3 to 12 weeks in patients with primary hypertension.
Data collection and analysis
Two authors independently assessed trial quality and extracted data. We contacted study authors for additional information. WDAE information was collected from the trials.
Main results
Forty six RCTs evaluated the dose‐related trough BP lowering efficacy of 9 ARBs in 13 451 participants with a baseline BP of 156/101 mm Hg. The data do not suggest that any one ARB is better or worse at lowering BP. A dose of 1/8 or 1/4 of the manufacturers’ maximum recommended daily dose (Max) achieved a BP lowering effect that was 60 to 70% of the BP lowering effect of Max. A dose of 1/2 Max achieved a BP lowering effect that was 80% of Max. ARB doses above Max did not significantly lower BP more than Max. Due to evidence of publication bias, the largest trials provide the best estimate of the trough BP lowering efficacy for ARBs as a class of drugs: ‐8 mm Hg for SBP and ‐5 mm Hg for DBP. ARBs reduced BP measured 1 to 12 hours after the dose by about 12/7 mm Hg.
Authors' conclusions
The evidence from this review suggests that there are no clinically meaningful BP lowering differences between available ARBs. The BP lowering effect of ARBs is modest and similar to ACE inhibitors as a class; the magnitude of average trough BP lowering for ARBs at maximum recommended doses and above is ‐8/‐5 mmHg. Furthermore, 60 to 70% of this trough BP lowering effect occurs with recommended starting doses. The review did not provide a good estimate of the incidence of harms associated with ARBs because of the short duration of the trials and the lack of reporting of adverse effects in many of the trials.
Keywords: Humans, Angiotensin II Type 1 Receptor Blockers, Angiotensin II Type 1 Receptor Blockers/therapeutic use, Antihypertensive Agents, Antihypertensive Agents/therapeutic use, Hypertension, Hypertension/drug therapy, Randomized Controlled Trials as Topic
Plain language summary
Angiotensin receptor blockers for the treatment of high blood pressure
A class of drugs called angiotensin receptor blockers (ARBs) is commonly used to lower high blood pressure. This class includes drugs such as losartan (brand name: Cozaar), candesartan (Atacand), eprosartan (Teveten), irbesartan (Avapro), telmisartan (Micardis) and valsartan (Diovan). We asked how much this class of drugs lowers blood pressure and whether there is a difference between individual drugs within the class. The available scientific literature was searched to find all trials that had assessed these questions.
We found 46 trials that randomly assigned participants to take either an ARB or an inert substance (placebo). These trials evaluated the BP lowering ability of 9 different ARBs in 13 451 participants altogether. The trials followed participants for only 7 weeks (though people are typically expected to take anti‐hypertension drugs for the rest of their lives). The blood pressure lowering effect was modest. There was an 8‐point reduction in the upper number that signifies the systolic pressure and a 5‐point reduction in the lower number that signifies the diastolic pressure. Most of the blood pressure lowering effect (about 70%) can be achieved with the lowest recommended dose of the drugs. No ARB appears to be any better or worse than others in terms of blood pressure lowering ability.
Almost all of the trials in this review were funded by companies that make ARBs and serious adverse effects were not reported by the authors of half of these trials. This could mean that the drug companies are withholding unfavorable findings related to their drugs. Due to incomplete reporting of the number of participants who dropped out of the trials due to adverse drug reactions, as well as the short duration of these trials, this review could not provide a good estimate of the harms associated with this class of drugs. Prescribing the least expensive ARBs in lower doses will lead to substantial cost savings, and possibly a reduction in dose‐related adverse events.
Background
Angiotensin receptor blockers are widely used as pharmacological agents for the treatment of hypertension. Hypertension is an important health problem and it is associated with an increased risk of death, stroke, and heart disease. Considerable scientific evidence shows that blood pressure reduction with different drug treatments reduces death, stroke, and heart disease. However, evidence also suggests the blood pressure lowering effect of antihypertensive agents may not always parallel with reductions in mortality or cardiovascular morbidity. In other words, blood pressure lowering does not always explain better health outcomes. Other factors may contribute to the reductions in mortality and vascular morbidity with antihypertensive drugs. Such factors may be independent of the blood pressure lowering effect of the drug, or the mechanism by which these drugs lower blood pressure. Nevertheless, blood pressure reduction remains an important factor. One of the main difficulties of managing a patient with hypertension using angiotensin receptor blockers is deciding which dose should be prescribed. This decision should be made primarily on the basis of the best available evidence of effectiveness. Despite over 10 years of research evidence and clinical use of angiotensin receptor blockers, the dose‐related blood pressure lowering effect of this anti‐hypertensive drug class is still not known.
A systematic review of the dose‐related blood pressure lowering efficacy of angiotensin receptor blockers has not been previously performed. The aims of this systematic review are: 1) to quantify the dose‐related blood pressure lowering efficacy of angiotensin receptor blockers in patients with primary hypertension; and 2) to establish dose equivalencies of different drugs within the angiotensin receptor blocker class. The information derived from this review should facilitate future reviews of head‐to‐head comparisons with other drug classes and assist clinicians in choosing optimal doses of angiotensin receptor blockers.
Objectives
Primary objective:
To quantify the dose‐related systolic and/or diastolic blood pressure lowering efficacy of angiotensin receptor blockers versus placebo in patients with primary hypertension.
Secondary objectives:
To determine the effects of angiotensin receptor blockers on variability of blood pressure.
To determine the effects of angiotensin receptor blockers on pulse pressure.
To quantify the dose‐related effect of angiotensin receptor blockers on heart rate.
To quantify the dose‐related effect of angiotensin receptor blockers on withdrawals due to adverse effects.
Methods
Criteria for considering studies for this review
Types of studies
Included studies must be randomized controlled trials (RCTs) and their design must meet the following criteria:
double‐blind
random allocation to ARB group(s) and parallel placebo group
duration of follow‐up of at least three weeks
office blood pressure measurements at baseline (following washout) and at one or more time points between 3 and 12 weeks post‐treatment
Types of participants
Participants must have an office baseline blood pressure of at least 140 mm Hg systolic and/or a diastolic blood pressure of at least 90 mm Hg. Patients must not have creatinine levels greater than 1.5 times the normal level, thereby excluding patients with secondary hypertension due to renal failure. Participants who were taking medications that affect blood pressure other than the study medications were excluded. Participants were not restricted by age, gender, baseline risk or any other co‐morbid conditions.
Types of interventions
Monotherapy with any angiotensin receptor blocker, including candesartan, eprosartan, irbesartan, losartan, olmesartan, tasosartan, telmisartan, valsartan, and KT3‐671.
Trials in which titration to a higher dose based on blood pressure response were not eligible if the titration occurred before 3 weeks of treatment because dose‐response relationships cannot be analyzed if patients within each randomized group are taking different doses. However, trials in which a response‐dependent titration took place during or after the 3‐12 week interval were eligible if pre‐titration data were given. For forced titration trials, data from the lowest dose were extracted, provided this dose was given for a 3 to 12 week period.
Types of outcome measures
Primary:
Change from baseline in trough and/or peak systolic and diastolic blood pressure at 3 to 12 weeks, compared with placebo. If blood pressure measurements were available at more than one time within the accepted window, the weighted means of blood pressures taken in the 3 to 12 week range were used.
Secondary:
Standard deviation of the change in blood pressure compared with placebo.
Change in standard deviation of blood pressure compared with placebo.
Change in pulse pressure compared with placebo.
Change in heart rate compared with placebo.
Number of patient withdrawals due to adverse effects compared with placebo.
Search methods for identification of studies
To identify randomized, double‐blind, placebo‐controlled trials of angiotensin receptor blockers, Cochrane Central Register of Controlled Trials (The Cochrane Library 2007, Issue 1), Medline (1966 to February 2007), EMBASE (1988 to February 2007), and bibliographic citations were searched. Previously published meta‐analyses on dose‐response of ARBs, as well as narrative reviews, were used to help identify references to trials. No language restrictions were applied.
A modified, expanded version of the standard search strategy of the hypertension review group was used to identify the relevant articles (Heran 2002).
MEDLINE
1. randomized controlled trial.pt 2. randomized controlled trial$.mp 3. controlled clinical trial.pt 4. controlled clinical trial$.mp 5. random allocation.mp 6. exp double‐blind method/ 7. double‐blind.mp 8. exp single‐blind method/ 9. single‐blind.mp 10. or/1‐9 11. ANIMALS.sh. not HUMAN.sh. 12.10 not 11 13. clinical trial.pt 14. clinical trial$.mp 15. exp clinical trials/ 16. (clin$ adj25 trial$).mp 17. ((singl$ or doubl$ or tripl$ or trebl$) adj25 (blind$ or mask$)).mp 18. random$.mp 19. exp research design/ 20. research design.mp 21. or/13‐20 22. 21 not 11 23. 22 not 12 24. comparative stud$.mp 25. exp evaluation studies/ 26. evaluation stud$.mp 27. follow‐up stud$.mp 28. prospective stud$.mp 29. (control$ or prospectiv$ or volunteer$).mp 30. or/24‐29 31. 30 not 11 32. 31 not (12 or 23) 33. 12 and 23 and 32 34. exp angiotensin II type I receptor blockers/ 35. angiotensin receptor blocker$.mp. 36. angiotensin II receptor blocker$.mp. 37. angiotensin receptor antagonist$.mp. 38. angiotensin II receptor antagonist$.mp. 39. candesartan.mp. 40. eprosartan.mp. 41. irbesartan.mp. 42. exp losartan/ 43. losartan.mp. 44. olmesartan.mp. 45. tasosartan.mp. 46. telmisartan.mp 47. valsartan.mp 48. KT3‐671.mp. 49. or/34‐48 50. exp hypertension/ 51. hypertension.mp. 52. exp blood pressure/ 53. blood pressure.mp. 54. or/50‐53 55. 49 and 54 56. 33 and 55 57. placebo$.mp. 58. 56 and 57
EMBASE
1. randomi?ed controlled trial$.mp. 2. exp controlled clinical trials/ 3. controlled clinical trial$.mp. 4. exp random allocation/ 5. random allocation.mp. 6. double‐blind.mp. 7. single‐blind.mp. 8. or/1‐7 9. exp animal/ 10. 8 not 9 11. exp clinical trials/ 12. clinical trial$.mp. 13. (clin$ adj25 trial$).mp. 14. ((singl$ or doubl$ or trebl$ or tripl$) adj25 (blind$ or mask$)).mp. 15. random$.mp. 16. exp research design/ 17. research design.mp. 18. or/11‐17 19. 18 not 9 20. 19 not 10 21. exp comparative study/ 22. comparative stud$.mp. 23. exp evaluation studies/ 24. evaluation stud$.mp. 25. exp follow up studies/ 26. follow up stud$.mp. 27. prospective stud$.mp. 28. (control$ or prospectiv$ or volunteer$).mp. 29. or/21‐28 30. 29 not 9 31. 30 not (10 or 20) 32. 10 and 20 and 31 33. exp angiotensin II type 1 receptor blockers/ 34. angiotensin receptor blocker$.mp. 35. angiotensin II receptor blocker$.mp. 36. angiotensin receptor antagonist$.mp. 37. angiotensin II receptor antagonist$.mp. 38. candesartan.mp. 39. eprosartan.mp. 40. irbesartan.mp. 41. losartan.mp. 42. olmesartan.mp. 43. tasosartan.mp. 44. telmisartan.mp 45. valsartan.mp 46. KT3‐671.mp. 47. or/33‐46 48. exp hypertension/ 49. hypertension.mp. 50. exp blood pressure/ 51. blood pressure.mp. 52. or/48‐51 53. 47 and 52 54. 32 and 53 55. placebo$.mp. 56. 54 and 55
Data collection and analysis
Study Selection
The databases listed above were searched using the updated search strategy to identify citations with potential relevance. The initial screen of these abstracts excluded articles whose titles and/or abstracts were clearly irrelevant. The full text of remaining articles were then retrieved (and translated into English where required) to assess whether or not the trials met the prespecified inclusion criteria. The bibliographies of pertinent articles, reviews and texts were searched for additional citations. Two independent reviewers assessed the eligibility of the trials using a trial selection form. A third reviewer resolved discrepancies. Trials with more than one publication were counted only once.
Data Extraction
Data were extracted independently by two reviewers using a standard form and then cross‐checked. If data were presented numerically (in tables or text) and graphically (in figures), the numeric data were preferred because of possible measurement error when estimating from graphs. All numeric calculations and extractions from graphs or figures were confirmed by a second reviewer.
The position of the patient during blood pressure measurement may affect the blood pressure lowering effect. However, in order not to lose valuable data, if only one position was reported, data from that position were extracted. When blood pressure measurement data are available in more than one position, data was extracted in accordance with the following order of preference: 1) sitting; 2) standing; and 3) supine.
In the case of missing information in the included studies, investigators were contacted (by email, letter and/or fax) to obtain the missing information. In the case of missing values for standard deviation of the change in blood pressure or heart rate, the standard deviation was imputed based on the information in the same trial or from other trials using the same dose. The following hierarchy (listed from high to low preference) was used to impute standard deviation values:
1) Pooled standard deviation calculated either from the t‐statistic corresponding to an exact p‐value reported or from the 95% confidence interval of the mean difference between treatment group and placebo. 2) Standard deviation of change in blood pressure/heart rate from a different position than that of the blood pressure data/heart rate used. 3) Standard deviation of blood pressure/heart rate at the end of treatment. 4) Standard deviation of blood pressure/heart rate at the end of treatment measured from a different position than that of the blood pressure/heart rate data used. 5) Standard deviation of blood pressure/heart rate at baseline (except if this measure was used for entry criteria). 4) Weighted mean standard deviation of change in blood pressure/heart rate from other trials using the same class of drug (at any dose).
Quality Assessment
The quality of all included trials was assessed by two independent reviewers using the following two approaches:
1. The Cochrane approach to assessment of allocation concealment:
Grade A: Adequate
Centralized (central office unaware of subject characteristics) or pharmacy‐controlled randomization; pre‐numbered or coded identical containers that are administered serially to patients; on‐site computer system with allocations kept in a locked computer file that can be accessed only after patients enter; sequentially numbered, sealed, opaque envelopes.
Grade B: Unclear
Allocation concealment is not reported, or despite a description that reports adequate concealment (the use of a list, table or sealed envelopes), there are other features that lead the reviewer to be suspicious.
Grade C: Inadequate
Consists of the following methods: alternation; use of case record numbers, dates of birth or date at which the patient is invited to participate in the study; any procedure that is transparent before allocation, such as an open list of random numbers.
Grade D: Allocation concealment not used
Allocation concealment was not used to assess validity.
2. A 5‐point scoring system described by Jadad 1996 and summarised as follows:
Was the study described as randomised? (1=yes; 0=no)
Was the study described as double‐blind? (1=yes; 0=no)
Was there a description of withdrawals and dropouts? (1=yes; 0=no)
Was the method of randomisation well described and appropriate? (1=yes; 0=no)
Was the method of double blinding well described and appropriate? (1=yes; 0=no)
Deduct 1 point if methods for randomisation were inappropriate.
Deduct 1 point if methods for blinding were inappropriate.
A score of 0‐2 reflects low quality, a score of 3‐4 indicates moderate quality and a score of 5 represents a high quality study.
Data analysis and statistical considerations
Data synthesis and analyses was done using the Cochrane Review Manager software, RevMan 4.2.8.
Data for changes from baseline in blood pressure and heart rate were combined using a weighted mean difference method. The withdrawals due to adverse effects were analyzed using relative risk, risk difference, and number needed to harm.
When possible, subgroup analyses were used to examine the results for specific categories of participants. Possible subgroup analyses included:
Race: Black, white, other.
Age: Adults (18‐69 years), older people (70 years and older).
Baseline severity of hypertension: Mild, moderate, severe.
The robustness of the results was tested using several sensitivity analyses, including:
Trials of high quality versus poor quality.
Trials that are industry‐sponsored versus non‐industry sponsored.
Trials that assess drug as primary drug of investigation versus trials that assess drug as comparator.
Trials with blood pressure data measured in the sitting position versus other measurement positions.
Trials with published standard deviations of blood pressure change versus imputed standard deviations.
Direct and indirect comparisons
When possible, direct and indirect comparisons of effect sizes between doses were performed for each ARB drug. In the direct method, only trials that randomized participants to different doses were included in the analysis. In the indirect method, an "adjusted indirect comparison" and the associated standard error were calculated using the method described by Bucher 1997 and Song 2003.
A p value less than 0.05 (p < 0.05) was considered statistically significant for all comparisons. If there was statistically significant heterogeneity associated with an effect estimate, a random effects model was applied. This model provides a more conservative statistical comparison of the difference between ARB treatment and placebo because a confidence interval around the effect estimate is wider than a confidence interval around a fixed effect estimate. If a statistically significant difference was still present using the random effects model, the fixed effect pooled estimate and confidence interval were used as the best estimate because of the tendency of smaller trials, which are more susceptible to publication bias, to be overweighted with a random effects analysis.
Results
Description of studies
Search findings
The search strategy identified 1069 citations, of which only 46 (4.3%) trials met the inclusion criteria and had extractable data to evaluate the dose‐related blood pressure lowering efficacy of 9 ARBs (Figure 1).
1.
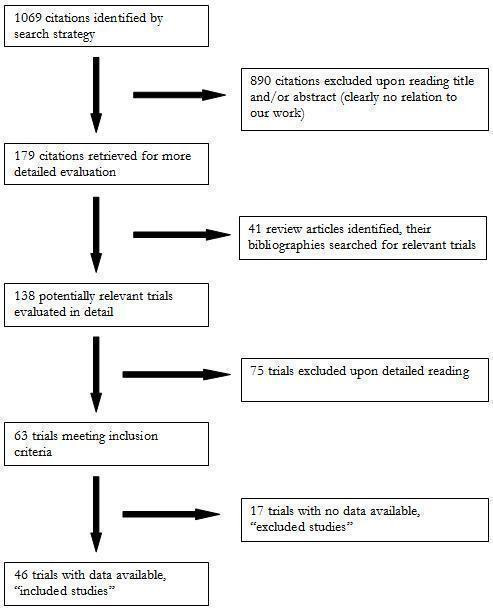
QUOROM flow diagram
Each included study is summarized in the "Characteristics of included studies". Seventy five studies were excluded because they did not meet the pre‐specified inclusion criteria. An additional 17 trials met the inclusion criteria but did not have extractable and therefore were excluded. The reasons for exclusion are detailed in the "Characteristic of excluded studies". All 46 included studies were published in English. Forty‐one (89%) of the included studies were industry‐sponsored while the remaining 5 (11%) did not report the source of funding. Six duplicate publications of 3 included trials were identified. Thirty four (74%) of the included studies randomized patients to fixed‐dose monotherapy during double‐blind treatment, 2 (4%) were forced‐titration studies and 10 (22%) were titration to BP response at pre‐specified intervals during the double‐blind treatment phase. Only the pre‐titration BP data were used in the analysis of the latter 10 studies.
Trials evaluating the antihypertensive efficacy of ARB monotherapy using office blood pressure measurements were first published in 1995 (Figure 2). There was an increase in the number of published studies through the 1990s, peaking at 10 trials published in 1998. After 1998, the number of trials published each year declined.
2.
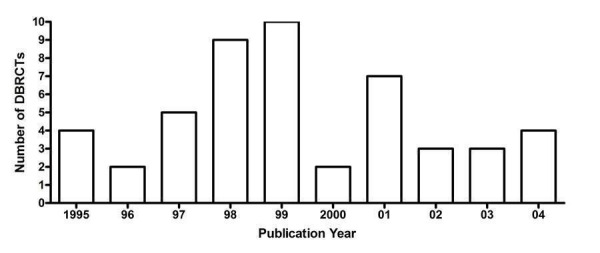
Number of included studies according to publication year
Figure 3 and Table 1 demonstrate that there is sufficient RCT evidence for the various ARBs to generate dose‐response curves for systolic and diastolic BP reduction as well as accomplish the secondary goals of this review. These studies investigate most ARBs over a dose range that is wider than what is recommended by the manufacturers. Losartan is the most extensively studied ARB with 12 published studies investigating the antihypertensive efficacy of daily doses ranging from 10 to 150 mg daily (Figure 3).
3.
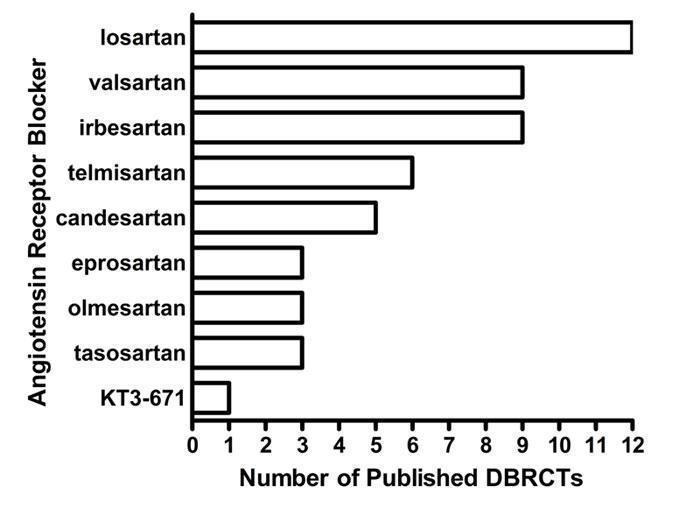
Number of included studies according to ARB
1. Overview of the 46 included studies investigating ARBs as monotherapy.
| ARB | Dose range (mg/day) | Number of studies | ARB patients (n) | Placebo patients (n) | Mean duration (wks) | Mean age (yrs) | Baseline BP (mm Hg) | Baseline PP (mm Hg) |
| Candesartan | 2 ‐ 32 | 5 | 762 | 280 | 7.3 | 55.1 | 158.4/101.7 | 56.7 |
| Eprosartan | 600 ‐ 1200 | 3 | 393 | 295 | 6.0 | 60.5 | 158.4/100.6 | 57.8 |
| Irbesartan | 37.5 ‐ 300 | 9 | 1239 | 652 | 8.5 | 54.5 | 152.5/100.6 | 51.9 |
| Losartan | 10 ‐ 150 | 12 | 2134 | 1287 | 7.4 | 54.9 | 156.5/101.1 | 55.4 |
| Olmesartan | 5 ‐ 80 | 3 | 446 | 155 | 8.0 | 52.6 | 152.6/101.0 | 51.6 |
| Tasosartan | 10 ‐ 50 | 3 | 315 | 257 | 7.4 | 52.8 | 151.5/100.7 | 50.8 |
| Telmisartan | 20 ‐ 160 | 6 | 1578 | 502 | 6.9 | 57.1 | 157.9/101.3 | 56.6 |
| Valsartan | 10 ‐ 320 | 9 | 2012 | 947 | 7.3 | 54.0 | 155.7/101.2 | 54.5 |
| KT3‐671 | 40 ‐ 160 | 1 | 149 | 48 | 4.0 | 53.5 | 160.2/101.9 | 58.3 |
| TOTAL | 46 | 9028 | 4423 | 7.4 | 55.0 | 155.6/101.0 | 54.6 |
Characteristics of excluded studies
Seventeen studies that met the inclusion criteria were excluded from this review. One of the main reasons for exclusion was failure to report adequate blood pressure data. Crossover trials that did not report pre‐crossover data, as well as parallel group trials with a forced titration schedule and trials in which patients were titrated to a pre‐specified blood pressure response were also excluded if pre‐titration data was not reported. Reasons for excluding each trial are listed in the "Characteristics of excluded studies" table.
Overview of included studies
Baseline characteristics of the 46 included studies are provided in Table 1. A total of 13 451 participants with a mean age of 55.0 years and baseline BP of 155.6/101.0 mm Hg were treated for a mean duration of 7.4 weeks. In most cases, the number of patients treated with an ARB was larger than the number of placebo‐treated patients because many of the included studies have multiple treatment arms comparing different doses of an ARB and, in some trials, comparing different ARBs with a single placebo arm.
Imputation of missing variance data
Standard deviation of blood pressure change
Thirty (65%) of the included studies reported the standard deviation of the change in blood pressure. These values were used to calculate weighted mean estimates of the standard deviation of the change in SBP and DBP for the ARB and placebo groups. One trial (Farsang 2001) reported SD of BP change values that were not within 3 standard deviations of the calculated weighted mean estimate. This trial's outlier SD value was excluded from the calculation and the weighted mean estimate was adjusted accordingly. The weighted mean standard deviations of the change in SBP and DBP are 13.20 (SD 2.1) mm Hg and 7.8 (SD 1.7) mm Hg for the ARB group, respectively. For the placebo group, the standard deviation of the change was 12.40 (SD 3.8) mm Hg for SBP and 7.6 (SD 2.3) mm Hg for DBP. There was no statistically significant difference between the ARB and placebo groups for SD of SBP change, nor SD of DBP change. These values were used according to the imputation hierarchy for trials that did not report SD of BP change.
Sixteen (35%) of the included studies had SD of BP change value imputed. Of these studies, 1 trial was imputed using endpoint SD, 5 (11%) were imputed using baseline SD for SBP, 14 (30%) were imputed using the weighted mean SD of SBP change from other trials, and 12 (26%), were imputed using the weighted mean SD of DBP change from other trials.
Risk of bias in included studies
The Jadad and Cochrane scales were used in this review to assess the quality of the included studies. Forty four (95.7%) of the included trials did not report allocation concealment, while the remaining two (4.3%) trials reported an adequate method of concealment. The Jadad score for each included study is provided in the 'Notes' section of the "Characteristics of included studies" table. Using the Jadad quality score, 39 (84.8%) of the included studies were of good quality, 2 (5.1%) were of excellent quality, and 5 (10.9%) studies were of poor quality. Removing the studies that were considered poor according to the Jadad method did not alter the results of the meta‐analysis. Rather, the Jadad score was not very useful for assessing the quality of trials included in this review because its scoring criteria were similar to two of the criteria for inclusion of studies in our systematic review; the studies had to be randomized and double‐blind. Thus all included studies would score at least 2 on the Jadad scale. Furthermore, it was clear to us that the Jadad and Cochrane quality assessment scales were not evaluating the methodological quality of the trials but instead the quality of reporting in the published studies.
The accuracy of blood pressure measurement is the most crucial factor in the included studies, but this is not considered in the Jadad and Cochrane quality assessment scales. The quality of the blood pressure results in the included trials appeared to be independent of the quality of reporting of the methodology.
Effects of interventions
Dose‐ranging BP lowering efficacy of individual ARBs
Summarized below are the dose‐related trough blood pressure lowering efficacy estimates of each of the 9 ARBs that were administered once daily in the included studies. The weighted mean placebo effect across all trials was ‐2.3 (95% CI ‐2.8, ‐1.8; range ‐13.4 to 3.2) mm Hg and ‐3.3 (95% CI ‐3.6 ‐ 3.0; range ‐7.7 to ‐0.4) mm Hg for SBP and DBP, respectively. Therefore, to determine the magnitude of the BP lowering efficacy of each ARB, a weighted mean difference from placebo (ARB effect size minus placebo effect size) with a 95% confidence interval (in parentheses) was calculated.
Dose‐ranging BP lowering efficacy of candesartan
Five of the included trials assessed the BP lowering efficacy of candesartan over the dose range of 2 to 32 mg/day (Figure 4). Four trials reported the funding source and all were sponsored by the manufacturer of candesartan. Candesartan 2 mg/day did not show a statistically significant difference from placebo. Compared with placebo, the 12 mg/day dose also did not significantly reduce BP but only one trial contributed to this efficacy estimate. However, doses immediately below and above 12 mg/day had sufficient trial evidence and they were significantly different than placebo.
4.
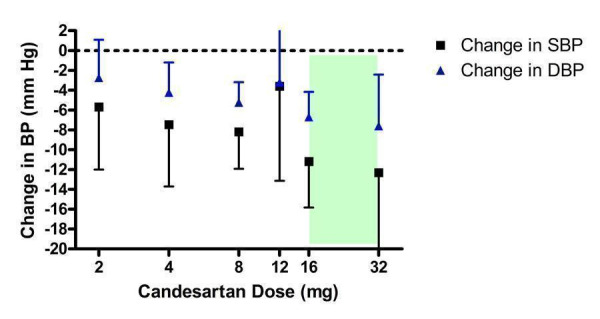
Log‐dose curve of candesartan 2 ‐ 32 mg/day (Shaded area represents manufacturer's recommended dose range)
One trial in the 8 mg/day group (Farsang 2001) had an exaggerated effect size of ‐14.30/‐9.50 mm Hg. This trial reported an extremely small standard deviation of the blood pressure change value in the placebo group but not for the candesartan group ‐ a pattern that is inconsistent with all other trials included in this systematic review. A possible explanation for this is that blinding was compromised in the trial. The results of this suspicious trial were therefore excluded from the effect estimate.
The lowest effective dose was 4 mg/day, less than the manufacturer's recommended starting dose, and there was no statistically significant difference in effect sizes between doses in the 4 to 32 mg/day range using indirect comparisons. The best estimate of the near maximal BP lowering efficacy of candesartan 4 to 32 mg/day is ‐8.93 (95% CI ‐11.37, ‐6.50) mm Hg for SBP and ‐5.59 (95% CI ‐6.95, ‐4.22) mm Hg for DBP.
Dose‐ranging BP lowering efficacy of eprosartan
The manufacturer sponsored all four included trials that evaluated eprosartan (Figure 5). Nearly all the trial evidence assessed the recommended starting dose of 600 mg/day and no trials investigated the BP lowering efficacy of the maximum recommended dose (800 mg/day). Only one trial reported efficacy data for 1200 mg/day, which did not demonstrate a statistically significant reduction in BP compared with placebo. However, this is likely due to the wide confidence intervals associated with the effect size estimate.
5.
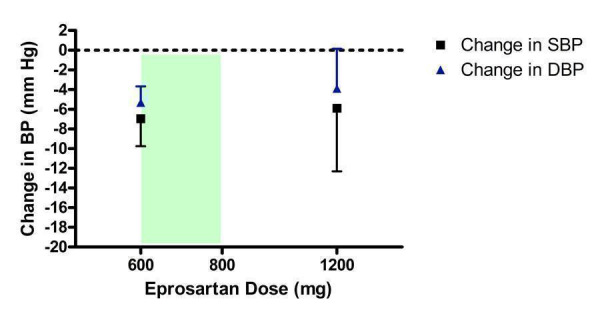
Log dose‐response curve of eprosartan 600 ‐ 1200 mg/day (Shaded area represents manufacturer's recommended dose range)
Based on the available trial evidence, 600 mg/day significantly reduces BP compared with placebo but not enough doses were tested to determine whether 600 mg/day is the lowest effective dose or whether it achieves near maximal BP lowering efficacy. Thus the true near maximal BP lowering efficacy of eprosartan cannot be estimated and a meaningful dose‐response curve cannot be constructed. The best estimate of the near maximal BP lowering effect of eprosartan, 600 to 1200 mg/day, is ‐6.79 (95% CI ‐9.35, ‐4.22) mm Hg for SBP and ‐5.12 (95% CI ‐6.64, ‐3.60) mm Hg for DBP.
Dose‐ranging BP lowering efficacy of irbesartan
Nine of the included studies assessed irbesartan, encompassing a dose range of 37.5 to 300 mg/day (Figure 6). Eight studies were funded by the manufacturer of irbesartan and one trial (Gradman 2005) studied irbesartan as a comparator against the renin inhibitor, aliskiren. All doses except 37.5 and 50 mg/day exhibited a statistically significant reduction in BP compared with placebo. Using indirect comparisons, there was no statistically significant difference between any of the doses tested. The lowest effective dose was 75 mg/day, which is half of the manufacturer's recommended starting dose.
6.
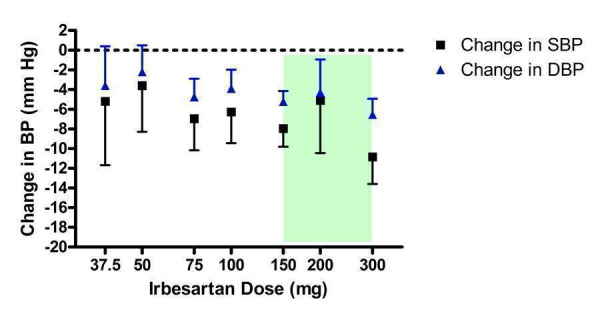
Log dose‐response curve of irbesartan 37.5 ‐ 300 mg/day (Shaded area represents manufacturer's recommended dose range)
In the 150 mg/day group, there was statistically significant heterogeneity in change in DBP (Chi2 = 12.02, p = 0.03, I2 = 58.4%). The random effects model still demonstrated a statistically significant difference from placebo. The heterogeneity was resolved, but the overall DBP effect estimate was not affected, by removing one trial (Benetos 2000) that reported a larger reduction in DBP (‐10.2 mm Hg) than the other trials in the 150 mg/day group (weighted mean: ‐5.01 mm Hg). A possible explanation for the exaggerated effect estimate could be the higher baseline DBP level (107 mm Hg) versus the other trials (weighted mean: 100 mm Hg). Also, an oscillometric device was utilized in Benetos 2000 to measure BP in the supine position whereas sitting BP was measured with a mercury sphygmomanometer in the other trials.
The best estimate of the near maximal BP lowering efficacy occurring at 75 to 300 mg/day is ‐7.91 (95% CI ‐9.16, ‐6.67) mm Hg for SBP and ‐5.09 (95% CI ‐5.82, ‐4.36) mm Hg for DBP.
Dose‐ranging BP lowering efficacy of losartan
Twelve of the included trials assessed losartan over a dose range of 10 to 150 mg/day (Figure 7). Losartan at 10 and 25 mg/day did not statistically significantly lower BP compared with placebo. The lowest effective dose was 50 mg/day, the manufacturer's recommended starting dose. The 50 mg/day dose was also the lowest dose with near maximal BP lowering efficacy since indirect comparison of the results for 50, 100 and 150 mg/day doses showed no statistical difference in BP lowering effect.
7.
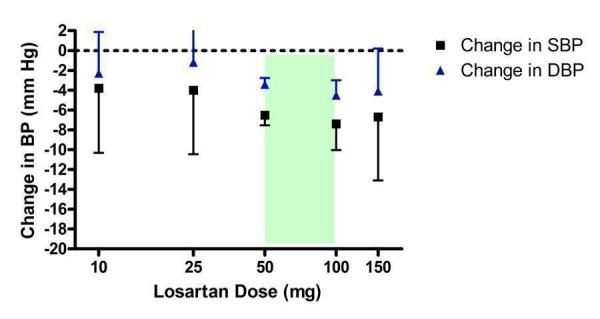
Log dose‐response curve of losartan 10 ‐ 150 mg/day (Shaded area represents manufacturer's recommended dose range)
There was statistically significant heterogeneity in the 50 mg/day estimate of DBP reduction (Chi2 = 19.93, p = 0.02, I2 = 54.8%) but the random effects model still showed a statistically significant reduction in DBP compared with placebo. Since the heterogeneity could not be explained by differences in baseline demographics of the patients between trials, another possible explanation could be the source of funding. Losartan was the only ARB used as an active comparator in trials as frequently as it was the primary drug of investigation. Five trials (Flack 2001; Gradman 1995; Ikeda 1997; Schoenberger 1995; Weber 1995) were sponsored by the manufacturer of losartan and four trials (Andersson 1998; Hedner 1999; Mallion 1999; White 2002) were funded by other manufacturers who compared losartan against their drugs. Sensitivity analyses of the funding source did not change the results; the heterogeneity was still statistically significant when analyzing each group of trials and the DBP effect size of ‐3.3 mm Hg versus placebo was unchanged.
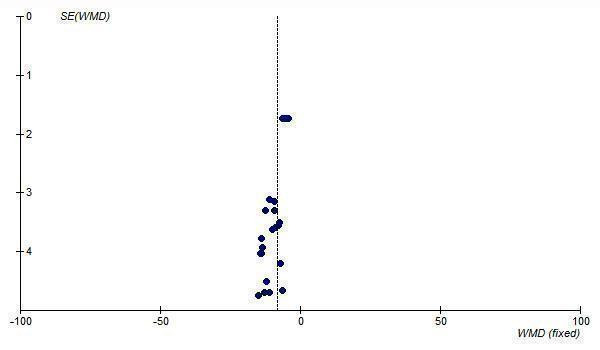
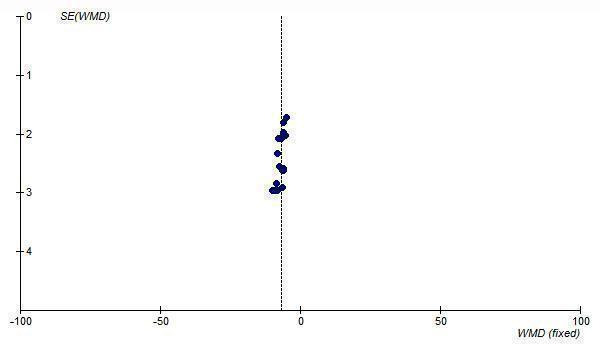
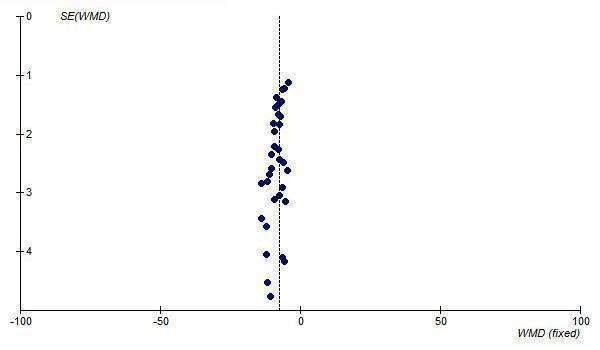
The best estimate of the near maximal BP lowering efficacy of losartan at 50 to 150 mg/day is ‐6.64 (95% CI ‐7.59, ‐5.68) mm Hg for SBP and ‐3.59 (95% CI ‐4.17, ‐3.00) mm Hg for DBP. Funnel plots of the trials at losartan 50 mg/day and above suggest that publication bias is likely since there is an absence of small trials with results to the right of the line for SBP (Figure 8) and DBP (Figure 9). Thus, the best estimate of the near maximal BP lowering efficacy of losartan is likely an overestimate of the true effect size.
8.
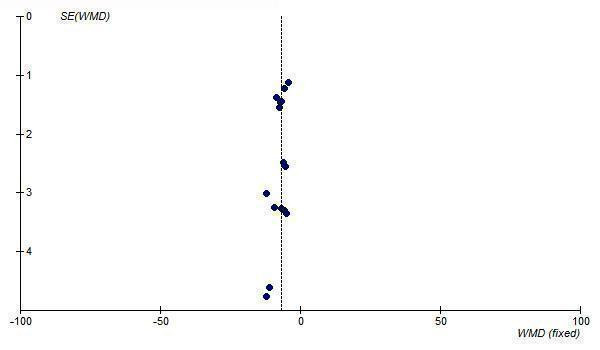
Funnel plot of standard error against effect estimate of change in SBP for losartan 50 to 150 mg/day
9.
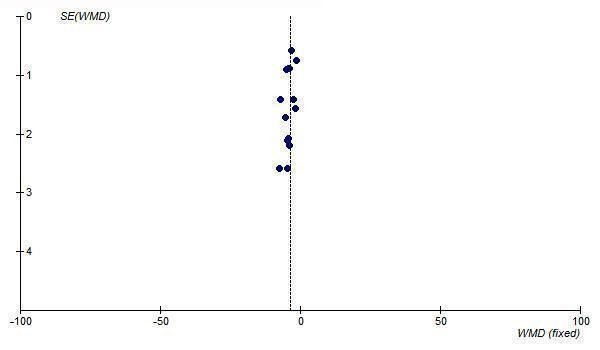
Funnel plot of standard error against effect estimate of change in DBP for losartan 50 to 150 mg/day
Dose‐ranging BP lowering efficacy of olmesartan
Two of the included trials (Chrysant 2003; Chrysant 2004) evaluated the SBP and DBP lowering efficacy of olmesartan 10 to 40 mg/day and one additional trial (Neutel 2002) reported the change in DBP only at 5, 20 and 80 mg/day (Figure 10). All three trials were sponsored by the manufacturer of olmesartan.
10.
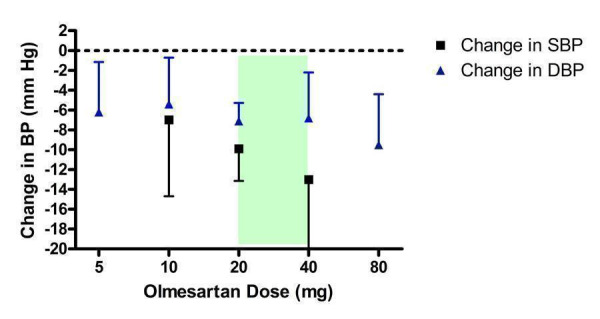
Log dose‐response curve of olmesartan 5 ‐ 80 mg/day (Shaded area represents manufacturer's recommended dose range)
All doses resulted in statistically significant reductions in DBP compared with placebo. For SBP, only the 20 and 40 mg/day doses significantly reduced SBP over placebo. Based on the available evidence, the lowest effective dose for SBP and DBP was 20 mg/day. The lowest effective dose may be achieved at 10 mg/day but there are not enough SBP data available to demonstrate this, as reflected by the wide confidence limits.
It was unclear if the 20 to 80 mg/day dose range reflects the plateau of the dose‐response curve because there were few studies at each dose above 20 mg/day. Thus, the true near maximal BP lowering efficacy cannot be estimated. An estimate using the available trial data at 20 to 40 mg/day is ‐10.39 (95% CI ‐13.36, ‐7.42) mm Hg for SBP and ‐7.31 (95% CI ‐8.92, ‐4.40) mm Hg for DBP.
Dose‐ranging BP lowering efficacy of tasosartan
Tasosartan was never marketed in North America after evidence of hepatotoxicity so dosing information is not available. Three of the included studies assessed tasosartan 10 to 50 mg/day (Figure 11). The 10 mg/day group did not have a statistically significant difference from placebo. The lowest effective dose was 25 mg/day. The 30 mg/day dose did not demonstrate a statistically significant difference compared with placebo but this is likely due to the paucity of data.
11.
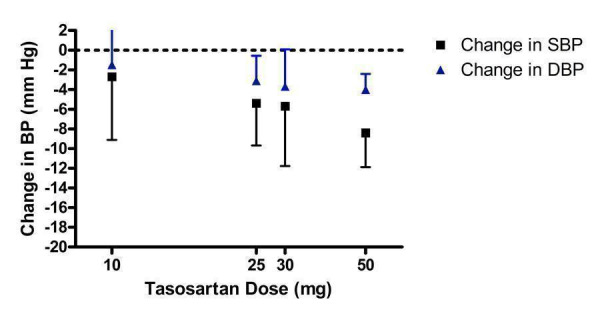
Log dose‐response curve of tasosartan 10 ‐ 50 mg/day
There was no statistically significant difference between 25 and 50 mg/day for SBP and DBP lowering efficacy. The best estimate of the near maximal BP lowering efficacy for 25 to 50 mg/day is ‐6.95 (95% CI ‐9.42, ‐4.48) mm Hg for SBP and ‐3.74 (95% CI ‐5.01, ‐2.47) mm Hg for DBP.
Dose‐ranging BP lowering efficacy of telmisartan
The BP lowering efficacy of telmisartan was assessed by 6 included trials (Figure 12). Five trials were sponsored by the manufacturer of telmisartan and one trial (Mallion 1999) did not report the source of funding. The manufacturer only recommends a single dose of 80 mg/day in healthy patients (a starting dose of 40 mg is recommended in patients with hepatic impairment) and if additional BP reduction is required, they recommend a thiazide diuretic be added (e‐CPS). Based on the available evidence, the lowest effective dose was achieved at 20 mg/day.
12.
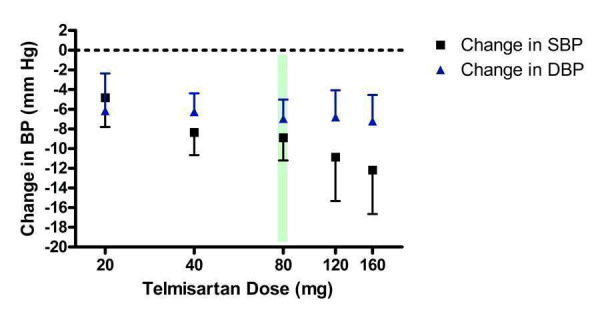
Log dose‐response curve of telmisartan 20 ‐ 160 mg/day (Shaded area represents manufacturer's recommended dose)
Although all doses resulted in a statistically significant difference from placebo, there was no statistically significant difference between any of the doses assessed using indirect comparisons. The best estimate of the near maximal BP lowering efficacy of telmisartan across all doses (20 to 160 mg/day) is ‐8.38 (95% CI ‐9.69, ‐7.07) mm Hg for SBP and ‐6.69 (95% CI ‐7.74, ‐5.64) mm Hg for DBP.
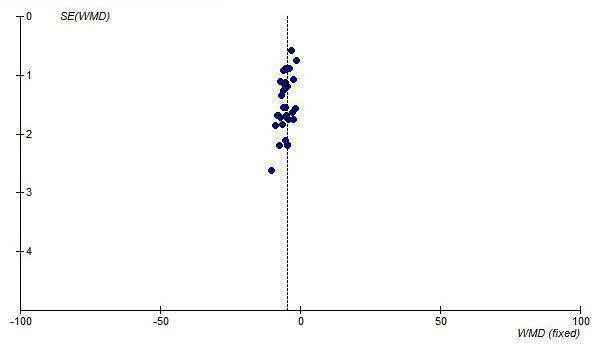
A funnel plot of standard error versus effect size for all telmisartan doses demonstrates asymmetry, with an absence of smaller trials with effects to the right of the line (Figure 13; Figure 14). This suggests the presence of publication bias and the estimate of the BP lowering efficacy of telmisartan is likely an overestimate of the true effect size.
13.
Funnel plot of standard error against effect estimate of change in SBP for telmisartan 20 to 160 mg/day
14.
Funnel plot of standard error against effect estimate of change in DBP for telmisartan 20 to 160 mg/day
Dose‐ranging BP lowering efficacy of valsartan
Nine of the included trials assessed valsartan, encompassing a dose range of 10 mg/day to 320 mg/day (Figure 15). Eight trials were funded by the manufacturer and one trial (Fogari 2001) did not report the source of funding. Valsartan at 10 and 40 mg/day did not statistically significantly lower BP compared with placebo. However, there is much uncertainty in the 40 mg/day efficacy estimate since it is based on one small trial, as reflected by the wide confidence limits.
15.
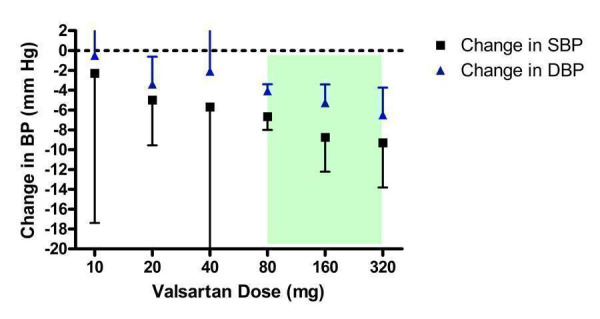
Log dose‐response curve of valsartan 10 ‐ 320 mg/day (Shaded area represents manufacturer's recommended dose range)
Valsartan 20 mg/day is the lowest effective dose. Using indirect comparisons, there was a statistically significant difference in effect sizes between 20 and 80 mg/day. Thus the lowest dose with near maximal BP lowering efficacy is 80 mg/day, the manufacturer's recommended starting dose. The weighted mean efficacy estimate of the maximum recommended dose of 160 mg/day and 320 mg/day did not result in a statistically significant difference from 80 mg/day, using indirect comparisons. Based on the available evidence, the best estimate of the near maximal BP lowering efficacy for valsartan at 80 to 320 mg/day is ‐7.10 (95% CI ‐8.30, ‐5.90) mm Hg for SBP and ‐4.34 (95% CI ‐4.96, ‐3.72) mm Hg for DBP.
Dose‐ranging BP lowering efficacy of KT3‐671
Only 1 trial (Patterson 2003) assessed KT3‐671, an experimental drug manufactured in Japan, and for this reason there is much uncertainty in the results, reflected by the wide confidence limits for all doses studied (Figure 16). Based on the available evidence, the overall best estimate of the BP lowering efficacy of KT3‐671 40 ‐ 160 mg/day is ‐6.05 (95% CI ‐10.38, ‐1.73) mm Hg and ‐2.71 (95% CI ‐4.92, ‐0.50) mm Hg for SBP and DBP, respectively.
16.
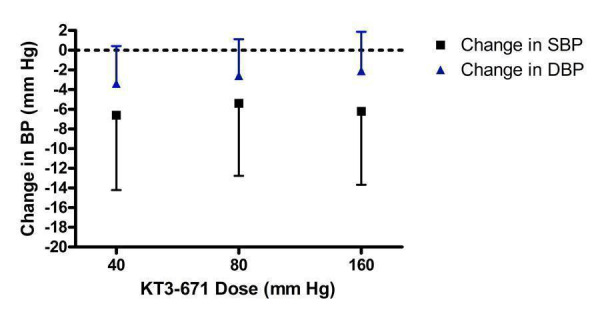
Log dose‐response curve of KT3‐671 40 ‐ 160 mg/day
Summary of blood pressure lowering efficacy of ARBs
Table 2 provides an overview of the lowest effective dose, the lowest dose with near maximal blood pressure lowering and the near maximal blood pressure lowering effect of each ARB studied in this review. The lowest effective dose is defined as the lowest dose for which there is a statistically significant difference from placebo. The lowest dose with near maximal blood pressure lowering efficacy is defined as the dose that demonstrates a statistically significantly greater response than doses below it, but does not exhibit a statistically significant difference in effect size compared with higher doses. If there was any discrepancy between SBP and DBP, SBP was used to make the dose determination.
2. Summary of the blood pressure lowering efficacy of ARBs.
| ARB | Lowest effective dose (mg/day) | Lowest dose with near maximal BP lowering (mg/day) | Near maximal trough SBP lowering (mm Hg), 95% CI | Near maximal trough DBP lowering (mm Hg), 95% CI |
| candesartan | 4 | 4 | ‐8.93 (‐11.37, ‐6.50) | ‐4.92 (‐6.47, ‐3.36) |
| eprosartan | 600 | 600 | ‐6.79 (‐9.35, ‐4.22) | ‐5.43 (‐6.47, ‐4.40) |
| irbesartan | 75 | 75 | ‐5.58 (‐7.84, ‐3.32) | ‐3.50 (‐4.40, ‐2.60) |
| losartan | 50 | 50 | ‐8.66 (‐10.48, ‐6.84) | ‐4.80 (‐5.81, ‐3.79) |
| olmesartan | 20 | 20 | ‐10.39 (‐13.36, ‐7.42) | ‐7.31 (‐8.92, ‐4.40) |
| tasosartan | 25 | 25 | ‐9.30 (‐14.83, ‐3.78) | ‐5.76 (‐9.44, ‐2.07) |
| telmisartan | 20 | 40 | ‐8.00 (‐10.14, ‐5.85) | ‐4.76 (‐5.92, ‐3.60) |
| valsartan | 20 | 80 | ‐8.45 (‐11.99, ‐4.91) | ‐4.38 (‐6.29, ‐2.46) |
| KT3‐671 | Not estimable | Not estimable | ‐7.09 (‐9.56, ‐4.61) | ‐5.02 (‐6.22, ‐3.82) |
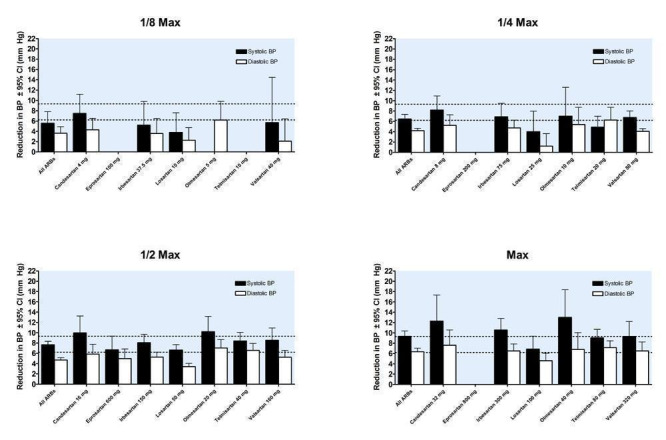
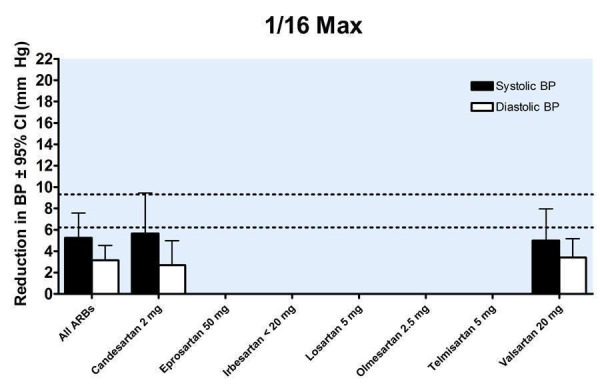
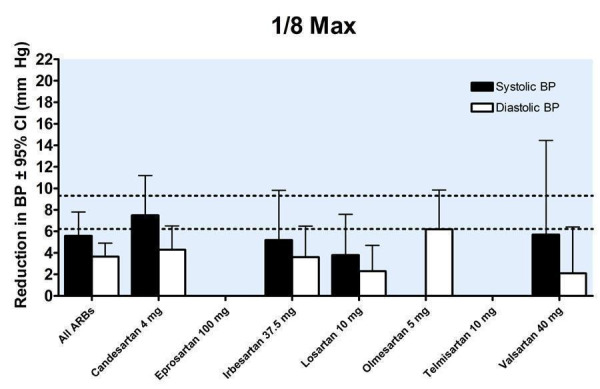
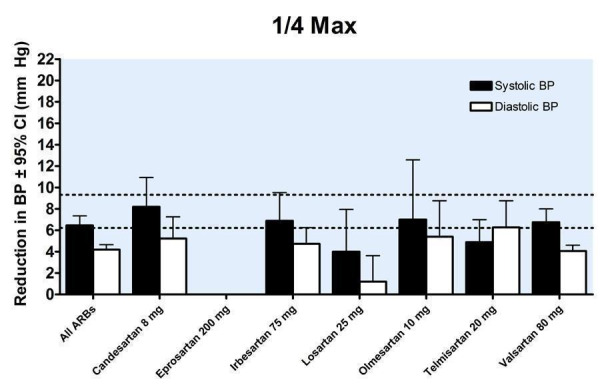
Trough blood pressure data were pooled for the ARBs by categorizing individual doses as proportions of the manufacturers' maximum recommended daily dose (Max), ranging from 1/16 Max to 2 Max (Figure 17, 1/8 Max to Max; Figure 18, 1/16 Max; Figure 19, 1/8 Max; Figure 20, 1/4 Max; Figure 21, 1/2 Max; Figure 22, Max; Figure 23, 1.5 Max; Figure 24, 2 Max).
17.
Blood pressure lowering efficacy of ARBs according to proportions of Max
18.
Blood pressure lowering efficacy of ARBs according to proportions of Max
19.
Blood pressure lowering efficacy of ARBs according to proportions of Max
20.
Blood pressure lowering efficacy of ARBs according to proportions of Max
21.
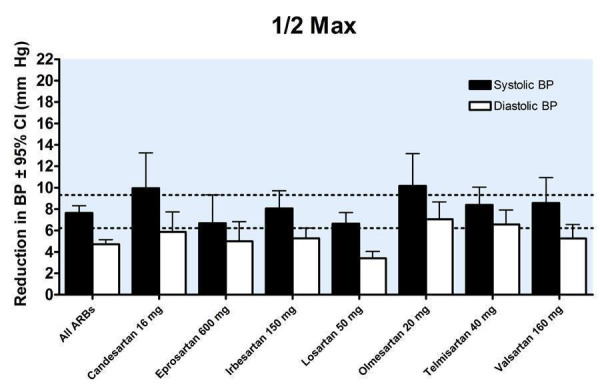
Blood pressure lowering efficacy of ARBs according to proportions of Max
22.
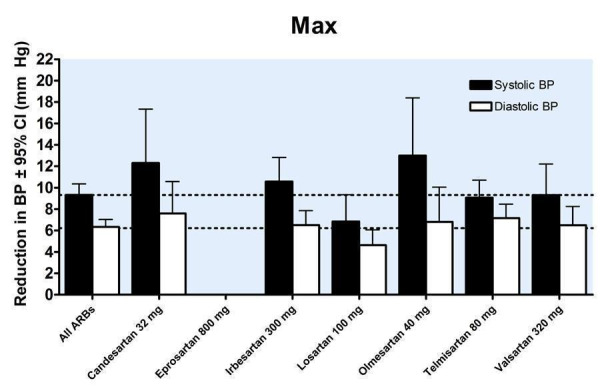
Blood pressure lowering efficacy of ARBs according to proportions of Max
23.
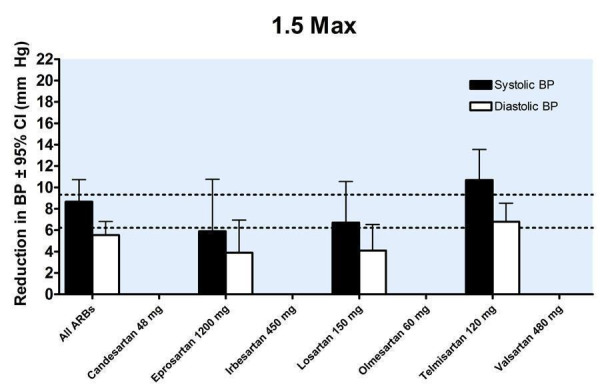
Blood pressure lowering efficacy of ARBs according to proportions of Max
24.
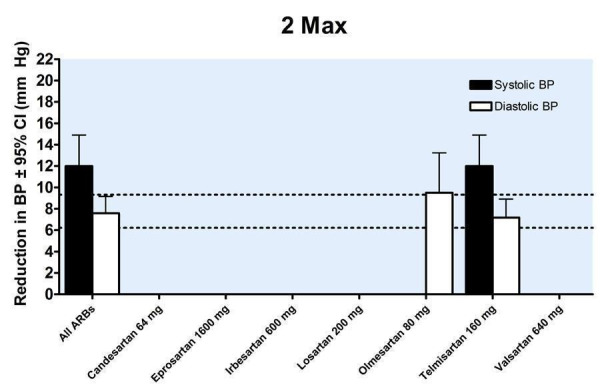
Blood pressure lowering efficacy of ARBs according to proportions of Max
A dose‐response exists, with a statistically significant difference between 1/2 Max and Max. There was no statistically significant difference in blood pressure lowering between Max and higher doses (Figure 25). As a class, the best estimate of the near maximal blood pressure lowering for ARBs is ‐9.31 (95% CI ‐10.25, ‐8.37) mm Hg for SBP and ‐6.22 (95% CI ‐6.82, ‐5.62) mm Hg for DBP (Figure 26).
25.
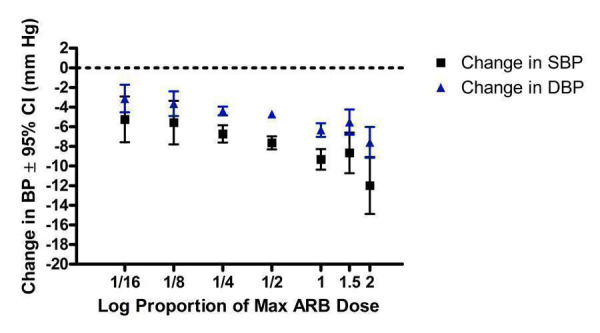
Log dose‐response curve of ARBs according to proportions of Max
26.
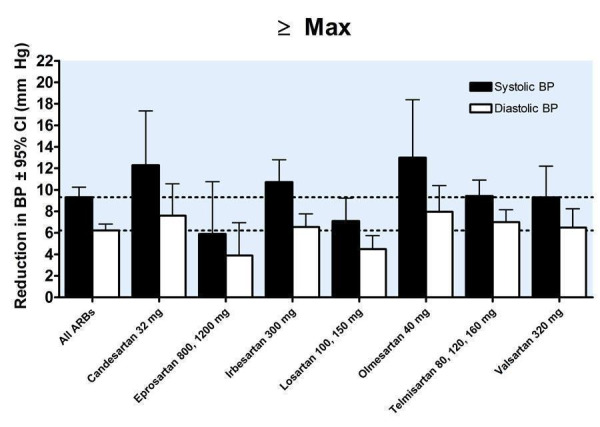
Near maximal blood pressure lowering efficacy of ARBs
Analysis of publication bias
Funnel Plots
In order to test for the possibility of publication bias in the ARB review funnel plots were created of the trough SBP and DBP lowering effects of all doses of maximum recommended and higher. The funnel plots of the maximal SBP and DBP lowering efficacy of ARBs (i.e. at Max and above) suggest asymmetry, which appears to be due to an absence of smaller, negative‐result trials (Figure 27; Figure 28). However, there are not very many trials at Max and higher doses to adequately assess whether publication bias is likely.
27.
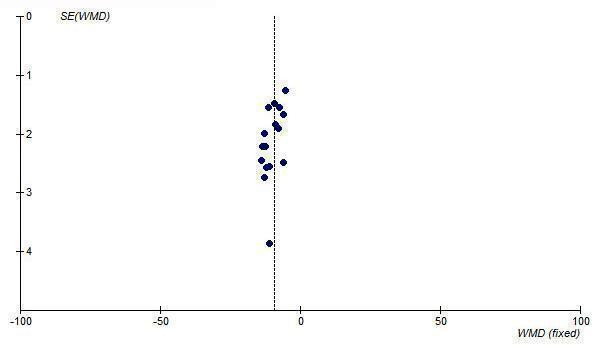
Funnel plot of near maximal change in trough SBP for ARBs at Max and higher doses
28.
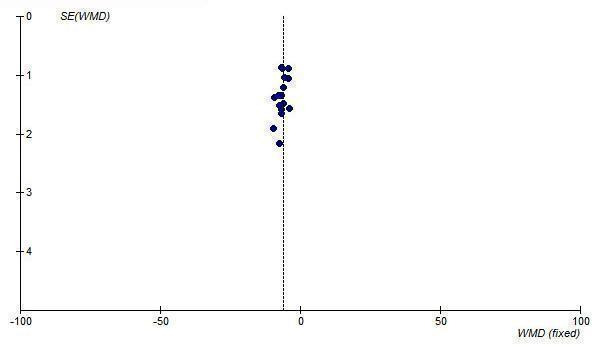
Funnel plot of near maximal change in trough DBP for ARBs at Max and higher doses
Since most of the available efficacy data for ARBs are at 1/2 Max, the funnel plots of this dosage level were also analyzed and they also demonstrate asymmetry, with an absence of negative‐result trials of small to medium size (Figure 29; Figure 30).
29.
Funnel plot of near maximal change in trough SBP for ARBs at 1/2 Max
30.
Funnel plot of near maximal change in trough DBP for ARBs at 1/2 Max
Tertile analysis based on trial size
In order to further test the possibility of publication bias, a post‐hoc tertile analysis of ARB trials was performed to determine if the trial size had an impact on the magnitude of reported BP lowering. Trials that reported trough BP at Max and above were divided into tertiles according to the sample size in the active treatment arms. The lowest, middle and highest tertiles represented the smallest, medium‐sized and largest trials, respectively. Using the indirect method, the mean effect size of the largest trials (highest tertile) was compared with that of the smallest trials (lowest tertile).
In this case, there were statistically significant differences in the magnitude of SBP (p = 0.02) and DBP (p = 0.03) reduction between the largest (n=110‐528 patients) and smallest (n=20‐57 patients) trials. The smallest trials reported 2.1/1.3 mm Hg greater mean reduction in SBP (p = 0.02)/DBP (p = 0.03) versus the largest trials (Figure 31).
31.
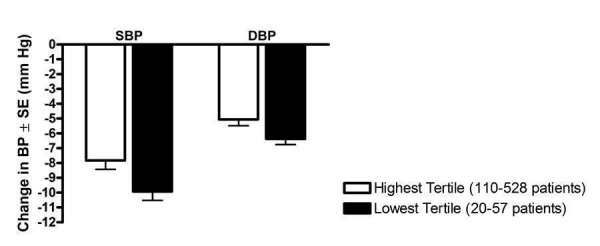
Post‐hoc tertile analysis of the effect of trial size on reported trough BP lowering
Tertile analysis based on publication year
Another possible source of bias in this review is that introduced because the patients chosen for the trial were already known to respond well to ARBs. If this were occurring, it was hypothesized that there would be little possibility for this to happen in the earliest published trials and that it would be more likely to occur in later published trials when use of the class was more common. A post‐hoc tertile analysis was done to determine the effect of the year of publication of trials on the BP lowering effect. The mean effect size of the latest tertile (2002‐2005) was compared with that of the earliest tertile (1995‐1998) using the indirect method and there was no statistically significant difference for SBP (p=0.8) or DBP (p=1.0) between the tertiles.
Blood pressure variability
Systolic versus diastolic blood pressure variability
The variability of blood pressure at both baseline and endpoint was reported for 7 (15%) of the included trials. In Table 3, the number of observations represents the number of active treatment arms in these 7 trials. Forty (87%) of the studies had diastolic hypertension entry criteria, 3 (6.5%) trials had systo‐diastolic hypertension entry criteria (Klingbeil 2002; Mallion 1999; McGill 2001), and 3 (6.5%) trials had isolated systolic hypertension entry criteria (Cushman 2002; Manolis 2004; Punzi 2004).
3. Variability of SBP and DBP at end of treatment.
| ARB | Placebo | ||
| SBP | Weighted mean SD | 16.9 | 16.0 |
| SD of weighted mean SD | 3.8 | 2.2 | |
| Weighted mean SBP | 147.3 | 156.3 | |
| Weighted mean coefficient of variation (CV) | 11.5 | 10.3 | |
| SD of weighted mean CV | 2.4 | 1.6 | |
| Number of observations | 10 | 6 | |
| DBP | Weighted mean SD | 8.1 | 7.8 |
| SD of weighted mean SD | 1.7 | 1.6 | |
| Weighted mean DBP | 92.9 | 98.0 | |
| Weighted mean coefficient of variation (CV) | 8.7 | 8.0 | |
| SD of weighted mean CV | 1.9 | 1.8 | |
| Number of observations | 10 | 6 | |
| t‐test | SD of SBP vs SD of DBP | p < 0.0001 | p < 0.0001 |
| t‐test | CV SBP vs CV DBP | p = 0.0070 | p = 0.0055 |
The weighted mean standard deviations for SBP and DBP were compared in order to determine whether SBP varies to the same degree as DBP. For both the ARB and placebo groups, the absolute variability of SBP is statistically significantly greater than that of DBP (Table 3). The coefficient of variation in SBP was also significantly greater than the coefficient of variation in DBP for both the ARB and placebo groups.
ARBs versus placebo
As shown in Table 3, the weighted mean endpoint SD of SBP was 16.9 mm Hg for the ARB group and 16.0 mm Hg for the placebo group (p = 0.6). The weighted mean SD of DBP was 8.1 mm Hg for the ARB group and 7.8 mm Hg for the placebo group (p = 0.7). There was no statistically significant difference in endpoint blood pressure variability between the ARB and placebo groups.
The effect of blood pressure entry criteria on variability
The included trials were categorized according to blood pressure entry criteria used: 1) diastolic hypertension; 2) systolic hypertension; and 3) systo‐diastolic hypertension. The weighted mean baseline standard deviations of these three trial categories were compared in order to determine the effect of blood pressure entry criteria on BP variability at baseline (Table 4).
4. Baseline standard deviations of BP according to entry criteria.
| Trials with DBP entry criteria only | Trials with SBP entry criteria only | Trials with SBP and/or DBP entry criteria | ||
| Number of trials | 27 | 3 | 3 | |
| SBP | Weighted mean SD at baseline (mm Hg) | 14.2 | 9.2 | 13.0 |
| SD of weighted mean SD (mm Hg) | 1.8 | 1.7 | 2.3 | |
| Number of observations | 76 | 8 | 8 | |
| DBP | Weighted mean SD at baseline (mm Hg) | 4.7 | 4.6 | 5.2 |
| SD of weighted mean SD (mm Hg) | 1.1 | 0.7 | 0.4 | |
| Number of observations | 78 | 8 | 8 |
Trials with systolic hypertension entry criteria had statistically significantly lower baseline SBP variability than trials with trials with entry criteria based on elevated DBP alone (p < 0.0001) or both elevated SBP and DBP (p = 0.002). There was no statistically significant difference between all categories for variability in DBP at baseline.
Baseline versus endpoint
Table 5 shows the comparisons of standard deviations of blood pressure at baseline and endpoint for trials with DBP entry criteria. The variability of SBP at endpoint was statistically significantly higher than at baseline for both the ARB and placebo groups. The DBP variability at endpoint was also significantly higher than at baseline in both groups.
5. SD of BP at baseline vs endpoint in trials with DBP entry criteria.
| ARB | Placebo | ||
| Weighted mean SD of SBP | At baseline (SD) | 13.5 (2.2) | 13.2 (1.5) |
| At endpoint (SD) | 16.9 (3.8) | 16.0 (2.2) | |
| t‐test | baseline vs endpoint | p = 0.03 | p = 0.03 |
| Weighted mean SD of DBP | At baseline (SD) | 5.4 (1.6) | 4.9 (1.3) |
| At endpoint (SD) | 8.1 (1.7) | 7.8 (1.6) | |
| t‐test | baseline vs endpoint | p = 0.002 | p = 0.006 |
Dose‐ranging peak blood pressure lowering efficacy
Four of the included trials reported the blood pressure lowering efficacy of ARBs at peak. The data were pooled for all trials by categorizing the individual doses as proportions of Max, encompassing a dose range of 1/4 to 1.5 Max (Figure 32). All doses exhibited a statistically significant reduction in peak SBP and DBP compared with placebo. Indirect comparisons showed no statistically significant difference in the effect sizes between the doses. Thus, pooling the results of all the doses provides an estimate of the peak blood pressure lowering effect of ARBs, ‐11.58 (95% CI ‐13.52, ‐9.63) mm Hg for SBP and ‐6.53 (95% CI ‐7.78, ‐5.28) mm Hg for DBP.
32.
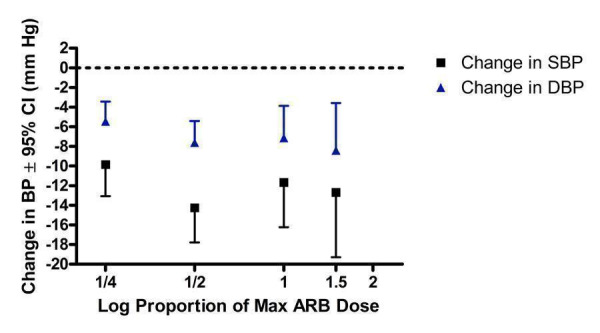
Log dose‐response curve of peak blood pressure lowering efficacy of ARBs according to proportions of Max
Dose‐ranging effect on pulse pressure
Pulse pressure was not reported as an outcome in any of the included trials. For each trial that reported both SBP and DBP outcomes, the change in pulse pressure from baseline was computed by subtracting the change in DBP from the change in SBP. An estimate of the placebo effect was calculated by pooling all trials that provided data. For ARBs, the available data were pooled and categorized according to a proportion of the manufacturer's maximum recommended daily dose (Max). A weighted mean and associated standard deviation of the change in pulse pressure was calculated for each dose proportion (Table 6).
6. Change in pulse pressure according to proportions of Max.
| Proportion of recommended maximum dose (Max) | Number of studies | Weighted mean change from baseline in pulse pressure (95% CI) | |
| ARBs | 1/8 Max | 5 | ‐1.1 (‐3.1, 0.9) |
| 1/4 Max | 18 | ‐2.1 (‐3.0, ‐1.1) | |
| 1/2 Max | 27 | ‐2.0 (‐2.6, ‐1.4) | |
| Max | 13 | ‐2.5 (‐3.6, ‐1.5) | |
| 1.5 Max | 5 | ‐1.1 (‐2.2, 0.1) | |
| 2 Max | 3 | ‐2.9 (‐6.2, 0.4) | |
| Max and above | 33 | ‐2.3 (‐2.9, ‐1.7) | |
| Placebo | 34 | 1.1 (0.8, 1.5) |
There was a statistically significant 1 mm Hg increase in pulse pressure with placebo treatment. The 1/8 Max, 1.5 Max and 2 Max groups did not have a significant effect on change in pulse pressure, but this is likely due to the limited data available at these doses. However, at 1/4 Max, 1/2 Max and Max statistically significant reductions in pulse pressure were demonstrated. For ARBs at doses that achieved near maximal BP lowering efficacy (Max and above), a statistically significant reduction of pulse pressure of 3.4 (95% CI 2.7, 4.1) as compared to placebo was present.
Dose‐ranging effect on heart rate
Only five of the 46 included trials (11%) provided dose‐related heart rate data (Fogari 2001, Gradman 1999, Hanefeld 2001, Neutel 1998, Smith 2000). All trials reported changes in heart rate at trough. Due to the lack of evidence for each ARB, the available data have been pooled and presented according to proportions of the manufacturers' maximum recommended daily dose (Max), ranging from 1/4 Max to 2 Max. Based on the limited data available, none of the doses showed a statistically significant change in heart rate compared with placebo (Figure 33).
33.
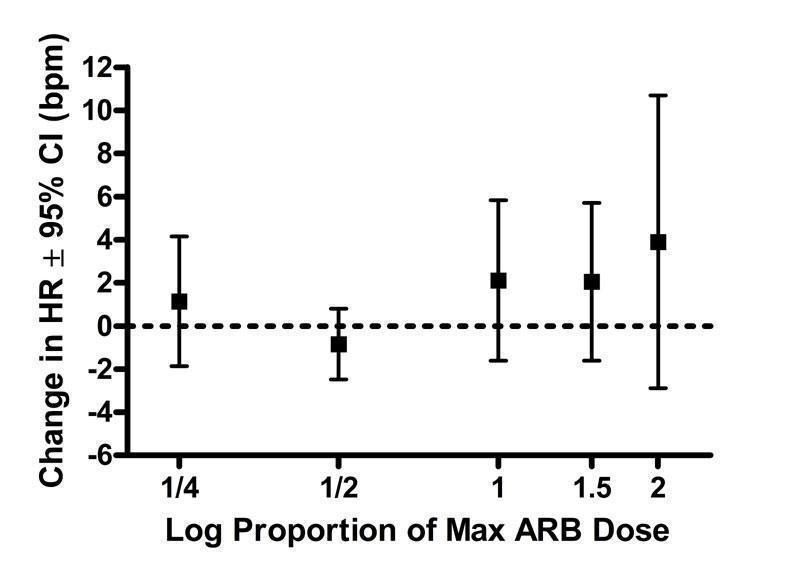
Log dose‐response curve assessing the effect of ARBs on heart rate
Dose‐ranging effect on withdrawals due to adverse effects
An analysis of withdrawals due to adverse effects (WDAE) during 3 to 12 weeks of treatment with ARBs was only reported in 26 (57%) of the included trials (Figure 34). There were insufficient data to evaluate the dose‐related effect of the individual ARBs on withdrawals due to adverse effects. Thus the tolerability data were pooled across ARBs according to proportions of Max to evaluate a possible dose‐response relationship.
34.
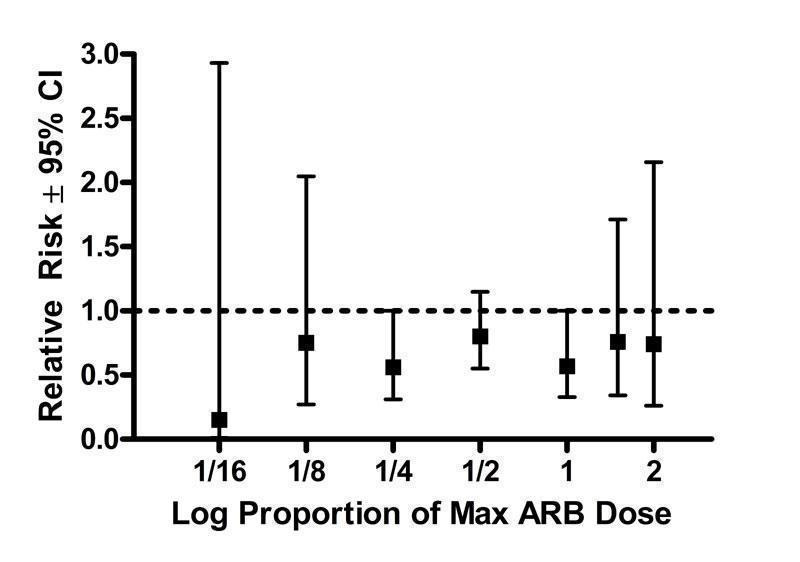
Log dose‐response curve assessing the effect of ARBs on withdrawals due to adverse effects
There is no heterogeneity in any of the dosage groups and none of the doses showed a statistically significant difference from placebo. Based on the available evidence, there is no evidence of a dose‐response relationship as an increase in the daily dose from 1/16 to 2 Max does not result in increased WDAE. In fact, when all doses are pooled, there is a statistically significant reduction in WDAE compared with placebo [RR 0.68 (95% CI 0.54, 0.87)]. Even the higher doses at which near maximal BP lowering efficacy is achieved (Max dose and above), patients in the ARB group had a statistically significant reduction in WDAE [RR 0.64(95% CI 0.43, 0.97)].
Dose‐ranging effect on total withdrawals
Analysis of withdrawals for any reason during the double‐blind treatment period was based on 13 (28%) of the 46 included trials. Compared with placebo, the 1/4 Max, 1/2 Max and Max dose groups showed a statistically significant reduction in total withdrawals (Figure 35). Only one trial provided data for each of the other dose groups, as reflected by the wide confidence intervals. Thus, due to limited power, these other doses showed no statistically significant difference from placebo. With all the doses pooled, there is a statistically significant relative risk of 0.63 (95% CI 0.53, 0.76), as compared to placebo.
35.
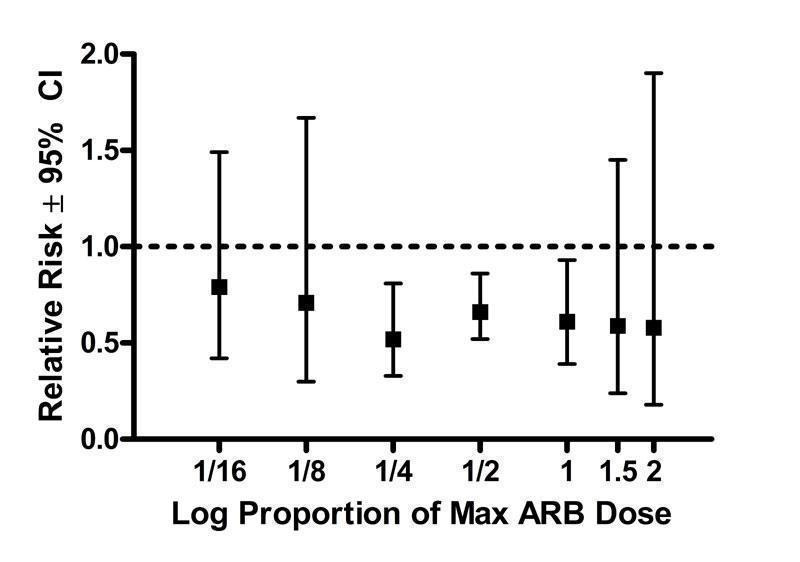
Log dose‐response curve assessing the effect of ARBs on total withdrawals
Discussion
In this systematic review, 46 trials with a mean duration of 7 weeks met the pre‐specified inclusion criteria and reported data on 13 451 participants (9028 treated with ARBs and 4423 treated placebo) with a mean age of 55 years, mean baseline blood pressure of 156/101 mm Hg and a mean pulse pressure of 55 mm Hg.
Is there a difference in the magnitude of BP lowering effect between individual drugs in the ARB class?
This review provides a reasonable amount of data to assess the trough BP lowering effect of 9 different ARBs. When the different ARBs are compared, there is a similarity in their BP lowering effects at trough. When the best estimate of the near maximal BP lowering efficacy of these 9 drugs is compared, they range from ‐6/‐3 mm Hg to ‐10/‐7 mm Hg. For many of the drugs, there are insufficient data for a full range of doses. Therefore it remains possible that there could be differences between some of the drugs. However, the data are most consistent with the near maximum BP lowering effect of each of the drugs being the same. It would require head‐to‐head trials of different ARBs at equivalent BP lowering doses to assess whether or not there are differences in the BP lowering efficacy between different drugs. This review provides useful dose‐response information for estimating equivalent doses and thus designing trials to compare different ARBs.
What is the dose‐related blood pressure lowering effect of ARBs as a class?
Assuming that there are no major differences in BP lowering efficacy between the drugs and the fact that the BP lowering effects of the different ARBs were similar, this suggests that pooling of the data was appropriate for the 7 of 9 drugs that had manufacturers' recommended dosage information available. Data were pooled for the 7 ARBs by categorizing individual doses as proportions of the manufacturers' maximum recommended daily dose (Max). It is recognized that this approach has its limitations but it provided a non‐arbitrary method for pooling the drugs. When this pooling was done, the ARBs, as a class, demonstrated a dose‐response relationship. A dose of 1/16 Max achieved greater than 50% of the BP lowering effect of the maximum recommended dose. A dose of 1/8 or 1/4 Max achieved a BP lowering effect that was 60 to 70% of the BP lowering effect of the maximum recommended dose. A dose of 1/2 Max achieved a BP lowering effect that was 80% of the maximum recommended dose.
Since the BP lowering effect of doses above maximum recommended doses was not significantly different than that of the maximum recommended dose, it was felt to be reasonable to combine the effects of maximum recommended doses and higher to provide a reasonable estimate of the near maximal trough blood pressure lowering efficacy for the ARBs as a class of drugs. This was ‐9 mm Hg for SBP and ‐6 mm Hg for DBP. This was accompanied by an average reduction in trough pulse pressure of 3 mm Hg. This is quite a modest effect and is likely considerably less than most clinicians would estimate can be achieved with the drugs. However, this effect is at trough and is obtained after subtracting the placebo effect which averaged ‐2/‐3 mm Hg. Furthermore, most doctors do not measure BP in their patients at trough. In this review we had much less data for the effect of ARBs 1 to 12 hours after the dose. However, the available data suggest that the BP lowering effect is modestly greater 1 to 12 hours after the dose than at trough, ‐11.6/‐6.5 mm Hg.
For each ARB, do the manufacturer's dosage recommendations coincide with the findings of this systematic review?
Assuming that the manufacturer's starting dose should approximate the lowest effective BP lowering dose, Table 7 shows that, based on this systematic review, the defined lowest effective dose for only 3 ARBs is in agreement with the manufacturer's recommended starting dose. For the other 4 ARBs, the defined lowest effective dose occurred at 1/4 of the recommended starting dose.
7. Comparison of manufacturers' dosage recommendations and findings of this review.
| ARB | Lowest effective dose (mg/day) | Manufacturer's recommended starting dose (mg/day) | Lowest dose with near maximal BP lowering (mg/day) | Manufacturer's recommended maximum dose (mg/day) |
| candesartan | 4 | 16 | 4 | 32 |
| eprosartan | 600 | 600 | 600 | 800 |
| irbesartan | 75 | 150 | 75 | 300 |
| losartan | 50 | 50 | 50 | 100 |
| olmesartan | 20 | 20 | 20 | 40 |
| telmisartan | 20 | 80 | 40 | 80 |
| valsartan | 20 | 80 | 80 | 320 |
For 6 of the 7 ARBs the lowest dose with near maximal BP lowering was achieved at 1/4 to 1/2 of the manufacturer's recommended maximum daily dose. Most of the blood pressure lowering with eprosartan was achieved at 75% of the recommended maximum dose. This may seem inconsistent with our decision to estimate the near maximal trough blood pressure lowering efficacy using the maximum recommended doses and above, but for each ARB there were insufficient data available at the higher doses to detect differences in blood pressure lowering between the lowest dose with near maximal blood pressure lowering efficacy and higher doses. However, when analyzed as a class (by categorizing the individual ARBs according to proportions of the manufacturer's maximum recommended dose), the lowest dose with near maximal blood pressure lowering efficacy was the maximum recommended dose.
What is the effect of ARBs on BP variability?
To determine the effect of ARBs on blood pressure variability the endpoint standard deviations of the ARB group were compared with the placebo group. This analysis showed that ARBs do not change blood pressure variability.
It appears that the blood pressure that was used as entry criteria into a trial affected blood pressure variability. Trials with systolic hypertension entry criteria had a lower baseline SBP variability than trials with entry criteria based on elevated DBP alone, or both elevated SBP and DBP. Likewise, in the trials with DBP entry criteria, the baseline variability of DBP was lower than at endpoint in both the ARB and placebo groups. This demonstrates that the entry criteria artificially lowers the variability of the BP measurements. Entry criteria artificially lower the magnitude of baseline variability because the normal distribution of the measurement is truncated and also because patients with DBP levels that are just below the cut‐off for the trial are raised to allow the patient to be enrolled into the trial. This enrollment bias is probably present in most BP trials.
An unexpected finding was lower baseline SBP standard deviation than at endpoint in both the ARB group and placebo group. This might be explained by the limited data as only 6 (13%) trials with DBP entry criteria reported endpoint SD. Furthermore, since placebo is highly unlikely to affect variability, it is more likely some artifact leading to decreased standard deviation at baseline rather than ARBs are causing an increased in BP variability. Further investigation of head‐to‐head trials, crossover trials and 24‐hour blood pressure monitoring studies will be needed to test this possibility.
The average estimates of the blood pressure variability in this review can be used as a means for evaluating the reliability of the data in trials. Based on the baseline variabilities in the treatment and placebo groups in trials with entry criteria based on elevated DBP alone, the average variability of SBP is 14.2 (SD 1.8) mm Hg. The average estimate of the variability of DBP cannot be determined from the reported values in our systematic review because 82% of the trials had DBP entry criteria. Instead, the average of the endpoint values in these trials, 8.1 (SD 1.7) mm Hg, is a reasonable estimate of the DBP variability. These average values of resting blood pressure variability include both inter‐ and intra‐individual variability.
Is there evidence of a dose‐response relationship for heart rate?
There is reasonable likelihood of selective reporting bias of resting heart rate since only about 10% of the trials reported data for this outcome. Based on the few trials for which data were available, ARBs did not have a significant effect on resting heart rate.
Is there evidence of a dose‐response relationship for withdrawals due to adverse effects?
There were not enough data to construct a meaningful dose‐response relationship for individual ARBs and when combined there still were insufficient data at higher doses to determine a dose‐related effect on WDAE. The available data demonstrate that for all doses ARBs resulted in a reduction in WDAE compared with placebo [RR 0.68 (95% CI 0.54, 0.87)]. However, only about half the trials reported the number of withdrawals due to adverse effects, so this finding has a high risk of selective reporting bias. A description of the type and severity of the adverse effects that led to premature withdrawal was rarely reported. Therefore, further information about the tolerability and safety of ARB treatment should be gathered from sources other than published reports of short‐term efficacy trials, such as longer term randomized trials, non‐randomized trials or post‐marketing surveillance studies.
Limitations of the review
Many trials required imputation of the standard deviations of the blood pressure change because they did not report these values. However, our average estimates of the blood pressure lowering effect of these drugs were insensitive to the imputation strategy used.
One of the main limitations of this review is that not all the trials assessing the efficacy of ARBs have been published. We know that because many of the doses that have been approved by regulators are not included in this review. For example, eprosartan has been approved for a dose range of 600 to 800 mg in Canada and the USA. We only found data for the effect of 600 mg of eprosartan and we know that trials must have been completed and provided to the regulators for the 800 mg dose. Another indication that not all the efficacy trials have been published is the disparity between the manufacturers' recommendations and the results of our review (Table 7). For all ARB drugs, the manufacturers' maximum dose recommendations are higher than our evidence would suggest. It is likely that the manufacturers are basing their recommendations on more complete (i.e. published and unpublished) trial evidence.
The use of maximum recommended dose by the manufacturer as a way of trying to compare equivalent doses of the drugs is imperfect but served our purposes in this review. When this review is updated and we get more data on the dose response for each drug it may be possible to estimate the ED‐50 of each of the available drugs and thus use that criterion to combine the equieffective doses of the different ARBs..
What are the potential sources of bias?
Sequence generation, allocation concealment
Details of the methods for generation of the sequence of allocations or allocation concealment were reported in only 2 of the 46 (4.4%) included studies. Nearly all the trial publications simply reported that the trial was "randomized" but did not provide any details about the randomization method or the method of allocation concealment. Given the fact that many investigators use the term "randomized" when it is not justified, such vague reporting is insufficient for determining whether or not the allocation sequence was properly randomized and adequately concealed. Authors should report their methods of sequence generation and allocation concealment clearly in order to assess the risk of bias in these studies.
Blinding bias
Nearly all the trial publications simply reported that the trial was "double‐blind" but did not provide any details about the blinding methods. Only 8 (17.4%) trials described the blinding method as "double dummy" or using a "matched" placebo. The potential for loss of blinding is unlikely because ARBs are not known to have any characteristic side effects. However, the success of blinding in patients or investigators was not assessed in any of the included trials.
Attrition bias
It is unlikely that attrition bias would have had an impact on the systematic review since 90 to 100 percent of patients randomized to fixed‐dose monotherapy in each trial completed the double‐blind treatment period.
Selective reporting bias
This would not affect the blood pressure measurements as these were the primary outcome of most of these trials. As mentioned above, there is a potential for selective reporting bias for heart rate and withdrawals due to adverse effects.
Other potential sources of bias
A potential source of bias that we became aware of in working on this review is patient selection bias. One of the exclusion criteria reported in nearly all trials was participants with a known hypersensitivity to ACE inhibitors. This suggests that investigators have knowledge of each participant's prior experience with this older drug class with a similar mechanism of action. They thus could have potentially selected for patients who have responded favorably to ACE inhibitors or ARBs in terms of BP lowering. If this was occurring to any degree, it may lead to an exaggerated BP lowering response as compared to a totally unselected group of patients. However, it was not possible to prove selection bias as none of the included trials described the details of patient recruitment.
Publication Bias
Yet another source of bias that may skew the results of systematic reviews is publication bias, which results from the selective publication of trials with positive results. This review was evaluated for the existence of publication bias since it only included and appraised published trial evidence. In the absence of bias, the funnel plot should resemble a symmetrical inverted funnel since the precision in the estimation of the true blood pressure lowering decreases as the study size decreases. Thus small studies will scatter more widely at the bottom of the graph (Cochrane Handbook). The most common way to investigate whether a review is subject to publication bias is to examine for funnel plot asymmetry as smaller studies with null results may remain unpublished. Publication bias was detected for the ARB drug class as funnel plot asymmetry was observed. Examination of the funnel plots showed a paucity of small‐ to medium‐sized studies with null results. Therefore, the magnitude of the blood pressure lowering efficacy of this class of drugs is likely an overestimate of the true effect.
A post‐hoc tertile analysis was conducted for the class of ARB drugs to evaluate the extent of the impact publication bias had on the overall effect estimate of blood pressure lowering and, if possible, adjust for this bias. The studies were divided into three groups according to sample size in order to compare the mean effect estimates between the largest trials (highest tertile) and smallest trials (lowest tertile). The results of this analysis corroborated the asymmetry observed in the funnel plots by demonstrating a statistically significantly greater estimate of the blood pressure lowering efficacy of ARBs in the smallest trials than in the largest trials (‐9.9/‐6.4 mm Hg vs ‐7.8/‐5.1 mm Hg, respectively). In this case, the largest trials are probably providing the best estimate of the true BP lowering effect of ARBs ‐8/5 mm Hg.
The results of the ARB review underscore the need for all studies, regardless of the findings, to be published and accessible for secondary analysis. Trial registration is recognized as one important way to improve transparency in research and knowledge sharing. In recent years, regulatory bodies around the world, led by the World Health Organization (WHO), have set standards for trial registration and reporting and are urging research institutions and companies to register all medical studies that test treatments on humans (WHO‐ICTRP). Initiatives such as the WHO's International Clinical Trials Registry Platform will help improve transparency and will allow the ability to identify trials that have been registered but not published.
Authors' conclusions
Implications for practice.
Specific findings of the review
The review provides data on the dose‐related blood pressure lowering efficacy of 9 different ARBs at trough. The best estimate of the blood pressure lowering efficacy of these 9 drugs ranges from ‐6/‐3 mm Hg to ‐10/‐7 mm Hg. The data do not suggest that any one ARB is better or worse than any other at lowering blood pressure when used at maximal recommended doses.
A dose‐response relationship for the blood pressure lowering effect of the ARBs was evident. A dose of 1/16 of the maximum recommended daily dose achieved greater than 50% of the blood pressure lowering effect of the maximum recommended dose. A dose of 1/8 or 1/4 of the maximum recommended daily achieved a blood pressure lowering effect that was 60 to 70% of the blood pressure lowering effect of the maximum recommended dose. A dose of 1/2 of the maximum recommended dose achieved a blood pressure lowering effect that was 80% of the maximum recommended dose.
ARB doses above the maximum recommended dose did not significantly lower blood pressure more than the maximum recommended dose.
Combining the effects of maximum recommended doses and higher gives an estimate of the resting trough blood pressure lowering efficacy for ARBs as a class of drugs of ‐9 mm Hg for SBP and ‐6 mm Hg for DBP.
Funnel plots and a tertile analysis provided evidence for publication bias leading to an overestimate of the true effect. Using a tertile analysis, the best estimate of the true blood pressure lowering effect was ‐8/‐5 mm Hg.
ARBs reduced blood pressure measured 1 to 12 hours after the dose by about 12/7 mm Hg.
ARBs reduced trough pulse pressure by about 3 mm Hg.
ARBs did not significantly affect blood pressure variability or heart rate.
All doses of ARBs combined resulted in a reduction in WDAE compared with placebo; however, this finding has a high risk of selective reporting bias and patient selection bias.
Implications of these findings
This systematic review provides the best available published evidence about the dose‐related blood pressure lowering efficacy of ARBs for the treatment of primary hypertension. These findings have the potential to change prescribing behavior and drug funding policies around the world. The evidence from this review suggests that there are no clinically meaningful differences between available ARBs for lowering blood pressure. Thus, substantial cost savings can be achieved by prescribing the least expensive ARB.
The major limitation of this review is that it is limited to published trials and it is evident that a lot of trials that manufacturers would have needed to gain marketing approval have not been published. Thus, in addition to the evidence of publication bias and the revised downward estimate of near maximal blood pressure lowering effect, there remains a further risk for publication bias based on manufacturers controlling what trials are published or not. It is also estimated that there is a high risk of patient selection bias that could have led to overestimation of the blood pressure lowering effect. For these reasons, the magnitude of blood pressure lowering found is this review is probably an overestimate of the true effect. This observation makes it even more surprising that the estimates of trough and peak blood pressure lowering effects of the ARBs are modest at best and lower than commonly believed can be achieved by this class of drugs. In addition, the review demonstrates that 60 to 70% of the blood pressure lowering effect occurs with recommended starting doses and that 80% is achieved with half the manufacturer’s maximum recommended daily dose. If physicians prescribing ARBs were aware of this evidence, they would prescribe lower doses leading to substantial cost savings, and possibly leading to a reduction in dose‐related adverse events.
The finding in this systematic review that there is a reduction in withdrawals due to adverse effects with an ARB as compared to placebo is surprising and unlikely to be true. This finding is limited by the short duration of these trials and is at high risk of selective publication bias, selective reporting bias and patient selection bias in these trials. It is therefore unlikely that this reflects the true effect of ARBs on withdrawals due to adverse effects, which would need to be studied using different trial designs.
Implications for research.
It is likely that all trials completed on the blood pressure lowering effect of ARBs are not published. It should be mandatory that all clinical trials be registered and the results of these trials be published in full detail.
Full dose‐response data for doses within the recommended dose range and beyond the recommended dose range are needed to properly analyze the dose response relationship for each ARB.
Trials should be designed to measure BP data for peak effects as well as trough effects.
All trials should report withdrawals due to adverse effects and serious adverse effects.
What's new
| Date | Event | Description |
|---|---|---|
| 18 June 2009 | Amended | In the plain language summary, the correct brand names for irbesartan and losartan were entered. |
History
Protocol first published: Issue 3, 2002 Review first published: Issue 4, 2008
| Date | Event | Description |
|---|---|---|
| 18 February 2009 | Amended | Plain language summary was edited to improve readability. |
Acknowledgements
The authors would like to acknowledge the assistance provided by Mr. Stephen Adams who retrieved the papers for this review.
Data and analyses
Comparison 1. Candesartan vs Placebo.
| Outcome or subgroup title | No. of studies | No. of participants | Statistical method | Effect size |
|---|---|---|---|---|
| 1 Change in trough SBP | 5 | Mean Difference (IV, Fixed, 95% CI) | Subtotals only | |
| 1.1 2 mg | 2 | 118 | Mean Difference (IV, Fixed, 95% CI) | ‐5.69 [‐11.99, 0.62] |
| 1.2 4 mg | 2 | 123 | Mean Difference (IV, Fixed, 95% CI) | ‐7.46 [‐13.70, ‐1.22] |
| 1.3 8 mg | 5 | 452 | Mean Difference (IV, Fixed, 95% CI) | ‐10.61 [‐13.51, ‐7.71] |
| 1.4 12 mg | 1 | 47 | Mean Difference (IV, Fixed, 95% CI) | ‐3.60 [‐13.14, 5.94] |
| 1.5 16 mg | 3 | 233 | Mean Difference (IV, Fixed, 95% CI) | ‐11.19 [‐15.83, ‐6.54] |
| 1.6 32 mg (Max Dose) | 1 | 69 | Mean Difference (IV, Fixed, 95% CI) | ‐12.30 [‐20.95, ‐3.65] |
| 2 Change in trough DBP | 5 | Mean Difference (IV, Fixed, 95% CI) | Subtotals only | |
| 2.1 2 mg | 2 | 118 | Mean Difference (IV, Fixed, 95% CI) | ‐2.74 [‐6.55, 1.07] |
| 2.2 4 mg | 2 | 121 | Mean Difference (IV, Fixed, 95% CI) | ‐4.23 [‐8.07, ‐0.38] |
| 2.3 8 mg | 5 | 453 | Mean Difference (IV, Fixed, 95% CI) | ‐7.07 [‐8.60, ‐5.54] |
| 2.4 12 mg | 1 | 47 | Mean Difference (IV, Fixed, 95% CI) | ‐3.20 [‐9.01, 2.61] |
| 2.5 16 mg | 3 | 233 | Mean Difference (IV, Fixed, 95% CI) | ‐6.69 [‐9.21, ‐4.17] |
| 2.6 32 mg (Max Dose) | 1 | 69 | Mean Difference (IV, Fixed, 95% CI) | ‐7.6 [‐12.77, ‐2.43] |
1.1. Analysis.

Comparison 1 Candesartan vs Placebo, Outcome 1 Change in trough SBP.
1.2. Analysis.

Comparison 1 Candesartan vs Placebo, Outcome 2 Change in trough DBP.
Comparison 2. Eprosartan vs Placebo.
| Outcome or subgroup title | No. of studies | No. of participants | Statistical method | Effect size |
|---|---|---|---|---|
| 1 Change in trough SBP | 3 | Mean Difference (IV, Fixed, 95% CI) | Subtotals only | |
| 1.1 600 mg | 3 | 602 | Mean Difference (IV, Fixed, 95% CI) | ‐6.96 [‐9.76, ‐4.16] |
| 1.2 800 mg (Max Dose) | 0 | 0 | Mean Difference (IV, Fixed, 95% CI) | 0.0 [0.0, 0.0] |
| 1.3 1200 mg | 1 | 86 | Mean Difference (IV, Fixed, 95% CI) | ‐5.90 [‐12.31, 0.51] |
| 2 Change in trough DBP | 3 | Mean Difference (IV, Fixed, 95% CI) | Subtotals only | |
| 2.1 600 mg | 3 | 399 | Mean Difference (IV, Fixed, 95% CI) | ‐5.32 [‐6.96, ‐3.68] |
| 2.2 800 mg (Max Dose) | 0 | 0 | Mean Difference (IV, Fixed, 95% CI) | 0.0 [0.0, 0.0] |
| 2.3 1200 mg | 1 | 85 | Mean Difference (IV, Fixed, 95% CI) | ‐3.90 [‐7.94, 0.14] |
2.1. Analysis.

Comparison 2 Eprosartan vs Placebo, Outcome 1 Change in trough SBP.
2.2. Analysis.

Comparison 2 Eprosartan vs Placebo, Outcome 2 Change in trough DBP.
Comparison 3. Irbesartan vs Placebo.
| Outcome or subgroup title | No. of studies | No. of participants | Statistical method | Effect size |
|---|---|---|---|---|
| 1 Change in trough SBP | 9 | Mean Difference (IV, Fixed, 95% CI) | Subtotals only | |
| 1.1 37.5 mg | 1 | 53 | Mean Difference (IV, Fixed, 95% CI) | ‐5.2 [‐11.68, 1.28] |
| 1.2 50 mg | 1 | 114 | Mean Difference (IV, Fixed, 95% CI) | ‐3.60 [‐8.29, 1.09] |
| 1.3 75 mg | 2 | 226 | Mean Difference (IV, Fixed, 95% CI) | ‐6.95 [‐10.16, ‐3.74] |
| 1.4 100 mg | 3 | 262 | Mean Difference (IV, Fixed, 95% CI) | ‐6.28 [‐9.45, ‐3.12] |
| 1.5 150 mg | 6 | 776 | Mean Difference (IV, Fixed, 95% CI) | ‐7.96 [‐9.81, ‐6.11] |
| 1.6 200 mg | 1 | 99 | Mean Difference (IV, Fixed, 95% CI) | ‐5.1 [‐10.46, 0.26] |
| 1.7 300 mg (Max Dose) | 3 | 361 | Mean Difference (IV, Fixed, 95% CI) | ‐10.85 [‐13.59, ‐8.11] |
| 2 Change in trough DBP | 9 | Mean Difference (IV, Fixed, 95% CI) | Subtotals only | |
| 2.1 37.5 mg | 1 | 53 | Mean Difference (IV, Fixed, 95% CI) | ‐3.60 [‐7.60, 0.40] |
| 2.2 50 mg | 1 | 114 | Mean Difference (IV, Fixed, 95% CI) | ‐2.2 [‐4.89, 0.49] |
| 2.3 75 mg | 2 | 225 | Mean Difference (IV, Fixed, 95% CI) | ‐4.75 [‐6.60, ‐2.90] |
| 2.4 100 mg | 3 | 262 | Mean Difference (IV, Fixed, 95% CI) | ‐3.91 [‐5.83, ‐1.99] |
| 2.5 150 mg | 6 | 777 | Mean Difference (IV, Fixed, 95% CI) | ‐5.23 [‐6.31, ‐4.16] |
| 2.6 200 mg | 1 | 100 | Mean Difference (IV, Fixed, 95% CI) | ‐4.30 [‐7.65, ‐0.95] |
| 2.7 300 mg (Max Dose) | 3 | 360 | Mean Difference (IV, Fixed, 95% CI) | ‐6.56 [‐8.19, ‐4.94] |
3.1. Analysis.

Comparison 3 Irbesartan vs Placebo, Outcome 1 Change in trough SBP.
3.2. Analysis.

Comparison 3 Irbesartan vs Placebo, Outcome 2 Change in trough DBP.
Comparison 4. Losartan vs Placebo.
| Outcome or subgroup title | No. of studies | No. of participants | Statistical method | Effect size |
|---|---|---|---|---|
| 1 Change in trough SBP | 12 | Mean Difference (IV, Fixed, 95% CI) | Subtotals only | |
| 1.1 10 mg | 1 | 95 | Mean Difference (IV, Fixed, 95% CI) | ‐3.8 [‐10.33, 2.73] |
| 1.2 25 mg | 1 | 98 | Mean Difference (IV, Fixed, 95% CI) | ‐4.0 [‐10.46, 2.46] |
| 1.3 50 mg | 11 | 2711 | Mean Difference (IV, Fixed, 95% CI) | ‐6.52 [‐7.55, ‐5.48] |
| 1.4 100 mg (Max Dose) | 3 | 417 | Mean Difference (IV, Fixed, 95% CI) | ‐7.40 [‐10.04, ‐4.76] |
| 1.5 150 mg | 1 | 100 | Mean Difference (IV, Fixed, 95% CI) | ‐6.70 [‐13.10, ‐0.30] |
| 2 Change in trough DBP | 11 | Mean Difference (IV, Fixed, 95% CI) | Subtotals only | |
| 2.1 10 mg | 1 | 96 | Mean Difference (IV, Fixed, 95% CI) | ‐2.30 [‐6.47, 1.87] |
| 2.2 25 mg | 1 | 97 | Mean Difference (IV, Fixed, 95% CI) | ‐1.20 [‐5.50, 3.10] |
| 2.3 50 mg | 10 | 2409 | Mean Difference (IV, Fixed, 95% CI) | ‐3.41 [‐4.05, ‐2.77] |
| 2.4 100 mg (Max Dose) | 3 | 418 | Mean Difference (IV, Fixed, 95% CI) | ‐4.51 [‐6.02, ‐2.99] |
| 2.5 150 mg | 1 | 99 | Mean Difference (IV, Fixed, 95% CI) | ‐4.1 [‐8.40, 0.20] |
4.1. Analysis.

Comparison 4 Losartan vs Placebo, Outcome 1 Change in trough SBP.
4.2. Analysis.

Comparison 4 Losartan vs Placebo, Outcome 2 Change in trough DBP.
Comparison 5. Olmesartan vs Placebo.
| Outcome or subgroup title | No. of studies | No. of participants | Statistical method | Effect size |
|---|---|---|---|---|
| 1 Change in trough SBP | 2 | Mean Difference (IV, Fixed, 95% CI) | Subtotals only | |
| 1.1 10 mg | 1 | 53 | Mean Difference (IV, Fixed, 95% CI) | ‐7.0 [‐14.70, 0.70] |
| 1.2 20 mg | 2 | 303 | Mean Difference (IV, Fixed, 95% CI) | ‐9.91 [‐13.15, ‐6.68] |
| 1.3 40 mg (Max Dose) | 1 | 59 | Mean Difference (IV, Fixed, 95% CI) | ‐11.00 [‐20.55, ‐5.45] |
| 2 Change in trough DBP | 3 | Mean Difference (IV, Fixed, 95% CI) | Subtotals only | |
| 2.1 5 mg | 1 | 61 | Mean Difference (IV, Fixed, 95% CI) | ‐6.20 [‐11.24, ‐1.16] |
| 2.2 10 mg | 1 | 53 | Mean Difference (IV, Fixed, 95% CI) | ‐5.40 [‐10.07, ‐0.73] |
| 2.3 20 mg | 3 | 364 | Mean Difference (IV, Fixed, 95% CI) | ‐7.11 [‐8.94, ‐5.28] |
| 2.4 40 mg (Max Dose) | 1 | 59 | Mean Difference (IV, Fixed, 95% CI) | ‐6.8 [‐11.39, ‐2.21] |
| 2.5 80 mg | 1 | 64 | Mean Difference (IV, Fixed, 95% CI) | ‐9.5 [‐14.60, ‐4.40] |
5.1. Analysis.

Comparison 5 Olmesartan vs Placebo, Outcome 1 Change in trough SBP.
5.2. Analysis.

Comparison 5 Olmesartan vs Placebo, Outcome 2 Change in trough DBP.
Comparison 6. Tasosartan vs Placebo.
| Outcome or subgroup title | No. of studies | No. of participants | Statistical method | Effect size |
|---|---|---|---|---|
| 1 Change in trough SBP | 3 | Mean Difference (IV, Fixed, 95% CI) | Subtotals only | |
| 1.1 10 mg | 1 | 85 | Mean Difference (IV, Fixed, 95% CI) | ‐2.70 [‐9.12, 3.72] |
| 1.2 25 mg | 1 | 142 | Mean Difference (IV, Fixed, 95% CI) | ‐5.4 [‐9.68, ‐1.12] |
| 1.3 30 mg | 1 | 83 | Mean Difference (IV, Fixed, 95% CI) | ‐5.70 [‐11.78, 0.38] |
| 1.4 50 mg | 1 | 262 | Mean Difference (IV, Fixed, 95% CI) | ‐8.40 [‐11.89, ‐4.91] |
| 2 Change in trough DBP | 3 | Mean Difference (IV, Fixed, 95% CI) | Subtotals only | |
| 2.1 10 mg | 1 | 85 | Mean Difference (IV, Fixed, 95% CI) | ‐1.50 [‐5.62, 2.62] |
| 2.2 25 mg | 1 | 142 | Mean Difference (IV, Fixed, 95% CI) | ‐3.1 [‐5.63, ‐0.57] |
| 2.3 30 mg | 1 | 83 | Mean Difference (IV, Fixed, 95% CI) | ‐3.7 [‐7.47, 0.07] |
| 2.4 50 mg | 1 | 262 | Mean Difference (IV, Fixed, 95% CI) | ‐2.00 [‐5.59, ‐2.41] |
6.1. Analysis.

Comparison 6 Tasosartan vs Placebo, Outcome 1 Change in trough SBP.
6.2. Analysis.

Comparison 6 Tasosartan vs Placebo, Outcome 2 Change in trough DBP.
Comparison 7. Telmisartan vs Placebo.
| Outcome or subgroup title | No. of studies | No. of participants | Statistical method | Effect size |
|---|---|---|---|---|
| 1 Change in trough SBP | 6 | Mean Difference (IV, Fixed, 95% CI) | Subtotals only | |
| 1.1 20 mg | 3 | 374 | Mean Difference (IV, Fixed, 95% CI) | ‐4.83 [‐7.81, ‐1.86] |
| 1.2 40 mg | 6 | 658 | Mean Difference (IV, Fixed, 95% CI) | ‐8.34 [‐10.66, ‐6.01] |
| 1.3 80 mg (Max Dose) | 6 | 651 | Mean Difference (IV, Fixed, 95% CI) | ‐8.89 [‐11.21, ‐6.57] |
| 1.4 120 mg | 3 | 201 | Mean Difference (IV, Fixed, 95% CI) | ‐10.87 [‐15.34, ‐6.40] |
| 1.5 160 mg | 3 | 196 | Mean Difference (IV, Fixed, 95% CI) | ‐12.18 [‐16.65, ‐7.72] |
| 2 Change in trough DBP | 5 | Mean Difference (IV, Fixed, 95% CI) | Subtotals only | |
| 2.1 20 mg | 2 | 97 | Mean Difference (IV, Fixed, 95% CI) | ‐6.16 [‐9.95, ‐2.38] |
| 2.2 40 mg | 5 | 379 | Mean Difference (IV, Fixed, 95% CI) | ‐6.26 [‐8.14, ‐4.38] |
| 2.3 80 mg (Max Dose) | 5 | 373 | Mean Difference (IV, Fixed, 95% CI) | ‐6.95 [‐8.86, ‐5.05] |
| 2.4 120 mg | 3 | 201 | Mean Difference (IV, Fixed, 95% CI) | ‐6.80 [‐9.52, ‐4.09] |
| 2.5 160 mg | 3 | 196 | Mean Difference (IV, Fixed, 95% CI) | ‐7.21 [‐9.87, ‐4.54] |
7.1. Analysis.

Comparison 7 Telmisartan vs Placebo, Outcome 1 Change in trough SBP.
7.2. Analysis.

Comparison 7 Telmisartan vs Placebo, Outcome 2 Change in trough DBP.
Comparison 8. Valsartan vs Placebo.
| Outcome or subgroup title | No. of studies | No. of participants | Statistical method | Effect size |
|---|---|---|---|---|
| 1 Change in trough SBP | 9 | Mean Difference (IV, Fixed, 95% CI) | Subtotals only | |
| 1.1 10 mg | 1 | 31 | Mean Difference (IV, Fixed, 95% CI) | ‐2.3 [‐17.39, 12.79] |
| 1.2 20 mg | 1 | 176 | Mean Difference (IV, Fixed, 95% CI) | ‐5.0 [‐9.56, ‐0.44] |
| 1.3 40 mg | 1 | 30 | Mean Difference (IV, Fixed, 95% CI) | ‐5.7 [‐20.78, 9.38] |
| 1.4 80 mg | 9 | 2177 | Mean Difference (IV, Fixed, 95% CI) | ‐6.67 [‐6.00, ‐5.34] |
| 1.5 160 mg | 3 | 358 | Mean Difference (IV, Fixed, 95% CI) | ‐8.75 [‐12.22, ‐5.28] |
| 1.6 320 mg (Max Dose) | 1 | 187 | Mean Difference (IV, Fixed, 95% CI) | ‐9.30 [‐13.82, ‐4.78] |
| 2 Change in trough DBP | 9 | Mean Difference (IV, Fixed, 95% CI) | Subtotals only | |
| 2.1 10 mg | 1 | 31 | Mean Difference (IV, Fixed, 95% CI) | ‐0.5 [‐7.31, 6.31] |
| 2.2 20 mg | 1 | 176 | Mean Difference (IV, Fixed, 95% CI) | ‐3.40 [‐6.17, ‐0.63] |
| 2.3 40 mg | 1 | 30 | Mean Difference (IV, Fixed, 95% CI) | ‐2.10 [‐8.94, 4.74] |
| 2.4 80 mg | 9 | 2176 | Mean Difference (IV, Fixed, 95% CI) | ‐4.08 [‐4.76, ‐3.40] |
| 2.5 160 mg | 3 | 359 | Mean Difference (IV, Fixed, 95% CI) | ‐5.26 [‐7.10, ‐3.41] |
| 2.6 320 mg (Max Dose) | 1 | 187 | Mean Difference (IV, Fixed, 95% CI) | ‐6.5 [‐9.25, ‐3.75] |
8.1. Analysis.

Comparison 8 Valsartan vs Placebo, Outcome 1 Change in trough SBP.
8.2. Analysis.

Comparison 8 Valsartan vs Placebo, Outcome 2 Change in trough DBP.
Comparison 9. KT3‐671 vs Placebo.
| Outcome or subgroup title | No. of studies | No. of participants | Statistical method | Effect size |
|---|---|---|---|---|
| 1 Change in trough SBP | 1 | Mean Difference (IV, Fixed, 95% CI) | Subtotals only | |
| 1.1 40 mg | 1 | 66 | Mean Difference (IV, Fixed, 95% CI) | ‐6.60 [‐14.21, 1.01] |
| 1.2 80 mg | 1 | 67 | Mean Difference (IV, Fixed, 95% CI) | ‐5.40 [‐12.77, 1.97] |
| 1.3 160 mg | 1 | 64 | Mean Difference (IV, Fixed, 95% CI) | ‐6.2 [‐13.68, 1.28] |
| 2 Change in trough DBP | 1 | Mean Difference (IV, Fixed, 95% CI) | Subtotals only | |
| 2.1 40 mg | 1 | 66 | Mean Difference (IV, Fixed, 95% CI) | ‐3.4 [‐7.22, 0.42] |
| 2.2 80 mg | 1 | 67 | Mean Difference (IV, Fixed, 95% CI) | ‐2.6 [‐6.31, 1.11] |
| 2.3 160 mg | 1 | 64 | Mean Difference (IV, Fixed, 95% CI) | ‐2.1 [‐6.07, 1.87] |
9.1. Analysis.

Comparison 9 KT3‐671 vs Placebo, Outcome 1 Change in trough SBP.
9.2. Analysis.

Comparison 9 KT3‐671 vs Placebo, Outcome 2 Change in trough DBP.
Comparison 10. 1/16 Max Dose vs Placebo.
| Outcome or subgroup title | No. of studies | No. of participants | Statistical method | Effect size |
|---|---|---|---|---|
| 1 Change in trough SBP | 3 | 487 | Mean Difference (IV, Fixed, 95% CI) | ‐5.25 [‐7.58, ‐2.91] |
| 1.1 Candesartan 2 mg | 2 | 199 | Mean Difference (IV, Fixed, 95% CI) | ‐5.66 [‐9.45, ‐1.86] |
| 1.2 Valsartan 20 mg | 1 | 288 | Mean Difference (IV, Fixed, 95% CI) | ‐5.0 [‐7.96, ‐2.04] |
| 2 Change in trough DBP | 3 | 487 | Mean Difference (IV, Fixed, 95% CI) | ‐3.14 [‐4.54, ‐1.73] |
| 2.1 Candesartan 2 mg | 2 | 199 | Mean Difference (IV, Fixed, 95% CI) | ‐2.70 [‐4.98, ‐0.42] |
| 2.2 Valsartan 20 mg | 1 | 288 | Mean Difference (IV, Fixed, 95% CI) | ‐3.40 [‐5.18, ‐1.62] |
10.1. Analysis.

Comparison 10 1/16 Max Dose vs Placebo, Outcome 1 Change in trough SBP.
10.2. Analysis.

Comparison 10 1/16 Max Dose vs Placebo, Outcome 2 Change in trough DBP.
Comparison 11. 1/8 Max Dose vs Placebo.
| Outcome or subgroup title | No. of studies | No. of participants | Statistical method | Effect size |
|---|---|---|---|---|
| 1 Change in trough SBP | 5 | 488 | Mean Difference (IV, Fixed, 95% CI) | ‐5.58 [‐7.80, ‐3.36] |
| 1.1 Candesartan 4 mg | 2 | 203 | Mean Difference (IV, Fixed, 95% CI) | ‐7.50 [‐11.19, ‐3.81] |
| 1.2 Irbesartan 37.5 mg | 1 | 78 | Mean Difference (IV, Fixed, 95% CI) | ‐5.2 [‐9.82, ‐0.58] |
| 1.3 Losartan 10 mg | 1 | 158 | Mean Difference (IV, Fixed, 95% CI) | ‐3.8 [‐7.59, ‐0.01] |
| 1.4 Valsartan 40 mg | 1 | 49 | Mean Difference (IV, Fixed, 95% CI) | ‐5.70 [‐14.46, 3.06] |
| 2 Change in trough DBP | 6 | 581 | Mean Difference (IV, Fixed, 95% CI) | ‐3.65 [‐4.91, ‐2.39] |
| 2.1 Candesartan 4 mg | 2 | 203 | Mean Difference (IV, Fixed, 95% CI) | ‐4.30 [‐6.51, ‐2.09] |
| 2.2 Irbesartan 37.5 mg | 1 | 78 | Mean Difference (IV, Fixed, 95% CI) | ‐3.60 [‐6.49, ‐0.71] |
| 2.3 Losartan 10 mg | 1 | 158 | Mean Difference (IV, Fixed, 95% CI) | ‐2.30 [‐4.70, 0.10] |
| 2.4 Olmesartan 5 mg | 1 | 93 | Mean Difference (IV, Fixed, 95% CI) | ‐6.20 [‐9.84, ‐2.56] |
| 2.5 Valsartan 40 mg | 1 | 49 | Mean Difference (IV, Fixed, 95% CI) | ‐2.10 [‐6.41, 2.21] |
11.1. Analysis.

Comparison 11 1/8 Max Dose vs Placebo, Outcome 1 Change in trough SBP.
11.2. Analysis.

Comparison 11 1/8 Max Dose vs Placebo, Outcome 2 Change in trough DBP.
Comparison 12. 1/4 Max Dose vs Placebo.
| Outcome or subgroup title | No. of studies | No. of participants | Statistical method | Effect size |
|---|---|---|---|---|
| 1 Change in trough SBP | 20 | 4043 | Mean Difference (IV, Fixed, 95% CI) | ‐6.74 [‐7.62, ‐5.85] |
| 1.1 Candesartan 8 mg | 5 | 557 | Mean Difference (IV, Fixed, 95% CI) | ‐9.93 [‐12.36, ‐7.51] |
| 1.2 Irbesartan 75 mg | 2 | 300 | Mean Difference (IV, Fixed, 95% CI) | ‐6.89 [‐9.52, ‐4.27] |
| 1.3 Losartan 25 mg | 1 | 160 | Mean Difference (IV, Fixed, 95% CI) | ‐4.0 [‐7.96, ‐0.04] |
| 1.4 Olmesartan 10 mg | 1 | 81 | Mean Difference (IV, Fixed, 95% CI) | ‐7.0 [‐12.59, ‐1.41] |
| 1.5 Telmisartan 20 mg | 3 | 606 | Mean Difference (IV, Fixed, 95% CI) | ‐4.89 [‐6.99, ‐2.78] |
| 1.6 Valsartan 80 mg | 9 | 2339 | Mean Difference (IV, Fixed, 95% CI) | ‐6.76 [‐8.00, ‐5.52] |
| 2 Change in trough DBP | 19 | 3626 | Mean Difference (IV, Fixed, 95% CI) | ‐4.40 [‐4.85, ‐3.95] |
| 2.1 Candesartan 8 mg | 5 | 556 | Mean Difference (IV, Fixed, 95% CI) | ‐6.42 [‐7.75, ‐5.09] |
| 2.2 Irbesartan 75 mg | 2 | 300 | Mean Difference (IV, Fixed, 95% CI) | ‐4.74 [‐6.25, ‐3.24] |
| 2.3 Losartan 25 mg | 1 | 160 | Mean Difference (IV, Fixed, 95% CI) | ‐1.20 [‐3.63, 1.23] |
| 2.4 Olmesartan 10 mg | 1 | 81 | Mean Difference (IV, Fixed, 95% CI) | ‐5.40 [‐8.76, ‐2.04] |
| 2.5 Telmisartan 20 mg | 2 | 189 | Mean Difference (IV, Fixed, 95% CI) | ‐6.27 [‐8.76, ‐3.78] |
| 2.6 Valsartan 80 mg | 9 | 2340 | Mean Difference (IV, Fixed, 95% CI) | ‐4.07 [‐4.60, ‐3.53] |
12.1. Analysis.

Comparison 12 1/4 Max Dose vs Placebo, Outcome 1 Change in trough SBP.
12.2. Analysis.

Comparison 12 1/4 Max Dose vs Placebo, Outcome 2 Change in trough DBP.
Comparison 13. 1/2 Max Dose vs Placebo.
| Outcome or subgroup title | No. of studies | No. of participants | Statistical method | Effect size |
|---|---|---|---|---|
| 1 Change in trough SBP | 31 | 6411 | Mean Difference (IV, Fixed, 95% CI) | ‐7.64 [‐8.31, ‐6.97] |
| 1.1 Candesartan 16 mg | 3 | 315 | Mean Difference (IV, Fixed, 95% CI) | ‐9.95 [‐13.25, ‐6.65] |
| 1.2 Eprosartan 600 mg | 3 | 635 | Mean Difference (IV, Fixed, 95% CI) | ‐6.69 [‐9.33, ‐4.05] |
| 1.3 Irbesartan 150 mg | 6 | 908 | Mean Difference (IV, Fixed, 95% CI) | ‐8.06 [‐9.71, ‐6.40] |
| 1.4 Losartan 50 mg | 11 | 2711 | Mean Difference (IV, Fixed, 95% CI) | ‐6.64 [‐7.67, ‐5.61] |
| 1.5 Olmesartan 20 mg | 2 | 331 | Mean Difference (IV, Fixed, 95% CI) | ‐10.18 [‐13.18, ‐7.18] |
| 1.6 Telmisartan 40 mg | 6 | 976 | Mean Difference (IV, Fixed, 95% CI) | ‐8.39 [‐10.04, ‐6.73] |
| 1.7 Valsartan 160 mg | 3 | 535 | Mean Difference (IV, Fixed, 95% CI) | ‐8.56 [‐10.94, ‐6.18] |
| 2 Change in trough DBP | 30 | 5577 | Mean Difference (IV, Fixed, 95% CI) | ‐4.73 [‐5.14, ‐4.31] |
| 2.1 Candesartan 16 mg | 3 | 315 | Mean Difference (IV, Fixed, 95% CI) | ‐5.86 [‐7.73, ‐3.99] |
| 2.2 Eprosartan 600 mg | 3 | 431 | Mean Difference (IV, Fixed, 95% CI) | ‐5.07 [‐6.63, ‐3.51] |
| 2.3 Irbesartan 150 mg | 6 | 907 | Mean Difference (IV, Fixed, 95% CI) | ‐5.27 [‐6.23, ‐4.30] |
| 2.4 Losartan 50 mg | 10 | 2410 | Mean Difference (IV, Fixed, 95% CI) | ‐3.41 [‐4.04, ‐2.77] |
| 2.5 Olmesartan 20 mg | 3 | 424 | Mean Difference (IV, Fixed, 95% CI) | ‐7.05 [‐8.67, ‐5.43] |
| 2.6 Telmisartan 40 mg | 5 | 555 | Mean Difference (IV, Fixed, 95% CI) | ‐6.57 [‐7.91, ‐5.24] |
| 2.7 Valsartan 160 mg | 3 | 535 | Mean Difference (IV, Fixed, 95% CI) | ‐5.25 [‐6.55, ‐3.94] |
13.1. Analysis.

Comparison 13 1/2 Max Dose vs Placebo, Outcome 1 Change in trough SBP.
13.2. Analysis.

Comparison 13 1/2 Max Dose vs Placebo, Outcome 2 Change in trough DBP.
Comparison 14. Max Dose vs Placebo.
| Outcome or subgroup title | No. of studies | No. of participants | Statistical method | Effect size |
|---|---|---|---|---|
| 1 Change in trough SBP | 14 | 2360 | Mean Difference (IV, Fixed, 95% CI) | ‐9.32 [‐10.36, ‐8.28] |
| 1.1 Candesartan 32 mg | 1 | 120 | Mean Difference (IV, Fixed, 95% CI) | ‐12.30 [‐17.34, ‐7.26] |
| 1.2 Irbesartan 300 mg | 3 | 435 | Mean Difference (IV, Fixed, 95% CI) | ‐10.57 [‐12.82, ‐8.32] |
| 1.3 Losartan 100 mg | 3 | 425 | Mean Difference (IV, Fixed, 95% CI) | ‐6.84 [‐9.35, ‐4.32] |
| 1.4 Olmesartan 40 mg | 1 | 87 | Mean Difference (IV, Fixed, 95% CI) | ‐11.00 [‐18.38, ‐7.62] |
| 1.5 Telmisartan 80 mg | 6 | 995 | Mean Difference (IV, Fixed, 95% CI) | ‐9.07 [‐10.69, ‐7.44] |
| 1.6 Valsartan 320 mg | 1 | 298 | Mean Difference (IV, Fixed, 95% CI) | ‐9.30 [‐12.21, ‐6.39] |
| 2 Change in trough DBP | 13 | 1942 | Mean Difference (IV, Fixed, 95% CI) | ‐6.33 [‐7.02, ‐5.65] |
| 2.1 Candesartan 32 mg | 1 | 120 | Mean Difference (IV, Fixed, 95% CI) | ‐7.6 [‐10.57, ‐4.63] |
| 2.2 Irbesartan 300 mg | 3 | 435 | Mean Difference (IV, Fixed, 95% CI) | ‐6.51 [‐7.86, ‐5.16] |
| 2.3 Losartan 100 mg | 3 | 425 | Mean Difference (IV, Fixed, 95% CI) | ‐4.62 [‐6.06, ‐3.18] |
| 2.4 Olmesartan 40 mg | 1 | 87 | Mean Difference (IV, Fixed, 95% CI) | ‐6.80 [‐10.04, ‐3.56] |
| 2.5 Telmisartan 80 mg | 5 | 577 | Mean Difference (IV, Fixed, 95% CI) | ‐7.16 [‐8.46, ‐5.86] |
| 2.6 Valsartan 320 mg | 1 | 298 | Mean Difference (IV, Fixed, 95% CI) | ‐6.5 [‐8.25, ‐4.75] |
14.1. Analysis.

Comparison 14 Max Dose vs Placebo, Outcome 1 Change in trough SBP.
14.2. Analysis.

Comparison 14 Max Dose vs Placebo, Outcome 2 Change in trough DBP.
Comparison 15. 1.5 Max Dose vs Placebo.
| Outcome or subgroup title | No. of studies | No. of participants | Statistical method | Effect size |
|---|---|---|---|---|
| 1 Change in trough SBP | 5 | 601 | Mean Difference (IV, Fixed, 95% CI) | ‐8.66 [‐10.73, ‐6.58] |
| 1.1 Eprosartan 1200 mg | 1 | 118 | Mean Difference (IV, Fixed, 95% CI) | ‐5.9 [‐10.76, ‐1.04] |
| 1.2 Losartan 150 mg | 1 | 162 | Mean Difference (IV, Fixed, 95% CI) | ‐6.7 [‐10.55, ‐2.85] |
| 1.3 Telmisartan 120 mg | 3 | 321 | Mean Difference (IV, Fixed, 95% CI) | ‐10.69 [‐13.54, ‐7.83] |
| 2 Change in trough DBP | 5 | 601 | Mean Difference (IV, Fixed, 95% CI) | ‐5.53 [‐6.81, ‐4.24] |
| 2.1 Eprosartan 1200 mg | 1 | 118 | Mean Difference (IV, Fixed, 95% CI) | ‐3.90 [‐6.95, ‐0.85] |
| 2.2 Losartan 150 mg | 1 | 162 | Mean Difference (IV, Fixed, 95% CI) | ‐4.1 [‐6.53, ‐1.67] |
| 2.3 Telmisartan 120 mg | 3 | 321 | Mean Difference (IV, Fixed, 95% CI) | ‐6.79 [‐8.53, ‐5.05] |
15.1. Analysis.

Comparison 15 1.5 Max Dose vs Placebo, Outcome 1 Change in trough SBP.
15.2. Analysis.

Comparison 15 1.5 Max Dose vs Placebo, Outcome 2 Change in trough DBP.
Comparison 16. 2 Max Dose vs Placebo.
| Outcome or subgroup title | No. of studies | No. of participants | Statistical method | Effect size |
|---|---|---|---|---|
| 1 Change in trough SBP | 3 | 343 | Mean Difference (IV, Fixed, 95% CI) | ‐11.99 [‐14.90, ‐9.08] |
| 1.1 Telmisartan 160 mg | 3 | 343 | Mean Difference (IV, Fixed, 95% CI) | ‐11.99 [‐14.90, ‐9.08] |
| 2 Change in trough DBP | 4 | 439 | Mean Difference (IV, Fixed, 95% CI) | ‐7.59 [‐9.16, ‐6.03] |
| 2.1 Olmesartan 80 mg | 1 | 96 | Mean Difference (IV, Fixed, 95% CI) | ‐9.5 [‐13.23, ‐5.77] |
| 2.2 Telmisartan 160 mg | 3 | 343 | Mean Difference (IV, Fixed, 95% CI) | ‐7.18 [‐8.91, ‐5.45] |
16.1. Analysis.

Comparison 16 2 Max Dose vs Placebo, Outcome 1 Change in trough SBP.
16.2. Analysis.

Comparison 16 2 Max Dose vs Placebo, Outcome 2 Change in trough DBP.
Comparison 17. Max and Higher Doses vs Placebo.
| Outcome or subgroup title | No. of studies | No. of participants | Statistical method | Effect size |
|---|---|---|---|---|
| 1 Change in trough SBP | 15 | 3008 | Mean Difference (IV, Fixed, 95% CI) | ‐9.31 [‐10.25, ‐8.37] |
| 1.1 Candesartan 32 mg | 1 | 120 | Mean Difference (IV, Fixed, 95% CI) | ‐12.30 [‐17.34, ‐7.26] |
| 1.2 Eprosartan 800, 1200 mg | 1 | 118 | Mean Difference (IV, Fixed, 95% CI) | ‐5.9 [‐10.76, ‐1.04] |
| 1.3 Irbesartan 300 mg | 3 | 504 | Mean Difference (IV, Fixed, 95% CI) | ‐10.73 [‐12.80, ‐8.66] |
| 1.4 Losartan 100, 150 mg | 3 | 578 | Mean Difference (IV, Fixed, 95% CI) | ‐7.09 [‐9.23, ‐4.95] |
| 1.5 Olmesartan 40 mg | 1 | 87 | Mean Difference (IV, Fixed, 95% CI) | ‐11.00 [‐18.38, ‐7.62] |
| 1.6 Telmisartan 80, 120, 160 mg | 6 | 1303 | Mean Difference (IV, Fixed, 95% CI) | ‐9.42 [‐10.92, ‐7.92] |
| 1.7 Valsartan 320 mg | 1 | 298 | Mean Difference (IV, Fixed, 95% CI) | ‐9.30 [‐12.21, ‐6.39] |
| 2 Change in trough DBP | 15 | 2653 | Mean Difference (IV, Fixed, 95% CI) | ‐6.22 [‐6.82, ‐5.62] |
| 2.1 Candesartan 32 mg | 1 | 120 | Mean Difference (IV, Fixed, 95% CI) | ‐7.6 [‐10.57, ‐4.63] |
| 2.2 Eprosartan 800, 1200 mg | 1 | 118 | Mean Difference (IV, Fixed, 95% CI) | ‐3.90 [‐6.95, ‐0.85] |
| 2.3 Irbesartan 300 mg | 3 | 504 | Mean Difference (IV, Fixed, 95% CI) | ‐6.54 [‐7.77, ‐5.31] |
| 2.4 Losartan 100, 150 mg | 3 | 578 | Mean Difference (IV, Fixed, 95% CI) | ‐4.49 [‐5.75, ‐3.23] |
| 2.5 Olmesartan 40, 80 mg | 2 | 183 | Mean Difference (IV, Fixed, 95% CI) | ‐7.96 [‐10.40, ‐5.52] |
| 2.6 Telmisartan 80, 120, 160 mg | 5 | 852 | Mean Difference (IV, Fixed, 95% CI) | ‐7.00 [‐8.16, ‐5.85] |
| 2.7 Valsartan 320 mg | 1 | 298 | Mean Difference (IV, Fixed, 95% CI) | ‐6.5 [‐8.25, ‐4.75] |
17.1. Analysis.

Comparison 17 Max and Higher Doses vs Placebo, Outcome 1 Change in trough SBP.
17.2. Analysis.

Comparison 17 Max and Higher Doses vs Placebo, Outcome 2 Change in trough DBP.
Comparison 18. ARBs vs Placebo.
| Outcome or subgroup title | No. of studies | No. of participants | Statistical method | Effect size |
|---|---|---|---|---|
| 1 Change in peak SBP [1/4 Max and Higher Doses Only] | 4 | 1092 | Mean Difference (IV, Fixed, 95% CI) | ‐11.58 [‐13.52, ‐9.63] |
| 1.1 1/4 Max Dose | 4 | 420 | Mean Difference (IV, Fixed, 95% CI) | ‐9.47 [‐12.43, ‐6.51] |
| 1.2 1/2 Max Dose | 3 | 382 | Mean Difference (IV, Fixed, 95% CI) | ‐14.25 [‐17.80, ‐10.69] |
| 1.3 Max Dose | 2 | 194 | Mean Difference (IV, Fixed, 95% CI) | ‐11.66 [‐16.24, ‐7.09] |
| 1.4 1.5 Max Dose | 1 | 96 | Mean Difference (IV, Fixed, 95% CI) | ‐12.7 [‐19.30, ‐6.10] |
| 2 Change in peak DBP [1/4 Max and Higher Doses Only] | 4 | 1092 | Mean Difference (IV, Fixed, 95% CI) | ‐6.53 [‐7.78, ‐5.28] |
| 2.1 1/4 Max Dose | 4 | 421 | Mean Difference (IV, Fixed, 95% CI) | ‐5.29 [‐7.14, ‐3.45] |
| 2.2 1/2 Max Dose | 3 | 381 | Mean Difference (IV, Fixed, 95% CI) | ‐7.61 [‐9.81, ‐5.42] |
| 2.3 Max Dose | 2 | 194 | Mean Difference (IV, Fixed, 95% CI) | ‐7.14 [‐10.40, ‐3.87] |
| 2.4 1.5 Max Dose | 1 | 96 | Mean Difference (IV, Fixed, 95% CI) | ‐8.40 [‐13.22, ‐3.58] |
| 3 Change in peak SBP [All Doses] | 4 | Mean Difference (IV, Fixed, 95% CI) | Subtotals only | |
| 3.1 1/8 Max Dose | 2 | 201 | Mean Difference (IV, Fixed, 95% CI) | ‐5.93 [‐10.10, ‐1.76] |
| 3.2 1/4 Max Dose | 4 | 385 | Mean Difference (IV, Fixed, 95% CI) | ‐9.85 [‐13.07, ‐6.63] |
| 3.3 1/2 Max Dose | 3 | 382 | Mean Difference (IV, Fixed, 95% CI) | ‐14.25 [‐17.80, ‐10.69] |
| 3.4 Max Dose | 2 | 194 | Mean Difference (IV, Fixed, 95% CI) | ‐11.66 [‐16.24, ‐7.09] |
| 3.5 1.5 Max Dose | 1 | 96 | Mean Difference (IV, Fixed, 95% CI) | ‐12.7 [‐19.30, ‐6.10] |
| 4 Change in peak DBP [All Doses] | 4 | Mean Difference (IV, Fixed, 95% CI) | Subtotals only | |
| 4.1 1/8 Max Dose | 2 | 201 | Mean Difference (IV, Fixed, 95% CI) | ‐3.78 [‐6.47, ‐1.09] |
| 4.2 1/4 Max Dose | 4 | 386 | Mean Difference (IV, Fixed, 95% CI) | ‐5.46 [‐7.48, ‐3.45] |
| 4.3 1/2 Max Dose | 3 | 381 | Mean Difference (IV, Fixed, 95% CI) | ‐7.61 [‐9.81, ‐5.42] |
| 4.4 Max Dose | 2 | 194 | Mean Difference (IV, Fixed, 95% CI) | ‐7.14 [‐10.40, ‐3.87] |
| 4.5 1.5 Max Dose | 1 | 96 | Mean Difference (IV, Fixed, 95% CI) | ‐8.40 [‐13.22, ‐3.58] |
| 5 Change in trough heart rate | 5 | Mean Difference (IV, Fixed, 95% CI) | Subtotals only | |
| 5.1 1/4 Max Dose | 3 | 240 | Mean Difference (IV, Fixed, 95% CI) | 1.14 [‐1.87, 4.15] |
| 5.2 1/2 Max Dose | 4 | 423 | Mean Difference (IV, Fixed, 95% CI) | ‐0.84 [‐2.48, 0.80] |
| 5.3 Max Dose | 2 | 108 | Mean Difference (IV, Fixed, 95% CI) | 2.11 [‐1.61, 5.83] |
| 5.4 1.5 Max Dose | 2 | 109 | Mean Difference (IV, Fixed, 95% CI) | 2.05 [‐1.61, 5.70] |
| 5.5 2 Max Dose | 1 | 53 | Mean Difference (IV, Fixed, 95% CI) | 3.9 [‐2.88, 10.68] |
| 6 Total withdrawals due to adverse effects | 26 | 9585 | Risk Ratio (M‐H, Fixed, 95% CI) | 0.68 [0.54, 0.87] |
| 6.1 1/16 Max Dose | 1 | 123 | Risk Ratio (M‐H, Fixed, 95% CI) | 0.15 [0.01, 2.93] |
| 6.2 1/8 Max Dose | 4 | 514 | Risk Ratio (M‐H, Fixed, 95% CI) | 0.75 [0.27, 2.05] |
| 6.3 1/4 Max Dose | 12 | 2107 | Risk Ratio (M‐H, Fixed, 95% CI) | 0.56 [0.31, 1.00] |
| 6.4 1/2 Max Dose | 22 | 4091 | Risk Ratio (M‐H, Fixed, 95% CI) | 0.80 [0.55, 1.15] |
| 6.5 Max Dose | 11 | 1884 | Risk Ratio (M‐H, Fixed, 95% CI) | 0.57 [0.33, 1.00] |
| 6.6 1.5 Max Dose | 5 | 624 | Risk Ratio (M‐H, Fixed, 95% CI) | 0.76 [0.34, 1.71] |
| 6.7 2 Max Dose | 2 | 242 | Risk Ratio (M‐H, Fixed, 95% CI) | 0.74 [0.26, 2.16] |
| 7 Total withdrawals | 14 | 5096 | Risk Ratio (M‐H, Fixed, 95% CI) | 0.63 [0.53, 0.75] |
| 7.1 1/16 Max Dose | 1 | 288 | Risk Ratio (M‐H, Fixed, 95% CI) | 0.79 [0.42, 1.49] |
| 7.2 1/8 Max Dose | 1 | 158 | Risk Ratio (M‐H, Fixed, 95% CI) | 0.71 [0.30, 1.67] |
| 7.3 1/4 Max Dose | 6 | 1186 | Risk Ratio (M‐H, Fixed, 95% CI) | 0.48 [0.32, 0.72] |
| 7.4 1/2 Max Dose | 11 | 2151 | Risk Ratio (M‐H, Fixed, 95% CI) | 0.69 [0.54, 0.87] |
| 7.5 Max Dose | 4 | 1000 | Risk Ratio (M‐H, Fixed, 95% CI) | 0.61 [0.39, 0.93] |
| 7.6 1.5 Max Dose | 1 | 162 | Risk Ratio (M‐H, Fixed, 95% CI) | 0.59 [0.24, 1.45] |
| 7.7 2 Max Dose | 1 | 151 | Risk Ratio (M‐H, Fixed, 95% CI) | 0.58 [0.18, 1.90] |
18.1. Analysis.

Comparison 18 ARBs vs Placebo, Outcome 1 Change in peak SBP [1/4 Max and Higher Doses Only].
18.2. Analysis.

Comparison 18 ARBs vs Placebo, Outcome 2 Change in peak DBP [1/4 Max and Higher Doses Only].
18.3. Analysis.

Comparison 18 ARBs vs Placebo, Outcome 3 Change in peak SBP [All Doses].
18.4. Analysis.

Comparison 18 ARBs vs Placebo, Outcome 4 Change in peak DBP [All Doses].
18.5. Analysis.

Comparison 18 ARBs vs Placebo, Outcome 5 Change in trough heart rate.
18.6. Analysis.

Comparison 18 ARBs vs Placebo, Outcome 6 Total withdrawals due to adverse effects.
18.7. Analysis.

Comparison 18 ARBs vs Placebo, Outcome 7 Total withdrawals.
Characteristics of studies
Characteristics of included studies [ordered by study ID]
Andersson 1998.
| Methods | 4‐week single‐blind placebo run‐in; inclusion criteria= mean sitting DBP 95‐114 mm Hg after 2 and 4 weeks' placebo run‐in; 8‐week double‐blind treatment | |
| Participants | Candesartan 8 mg: n=82(47 males,35 females); mean age=60(11) years; baseline sitting SBP=169(14) mm Hg, DBP=102(5) mm Hg; Candesartan 16 mg: n=84(56 males,28 females); mean age=59(10) years; baseline sitting SBP=168(15) mm Hg, DBP=103(5) mm Hg; Losartan 50 mg: n=83(47 males,36 females); mean age=59(9) years; baseline sitting SBP=168(16) mm Hg, DBP=104(5) mm Hg; Placebo: n=85(38 males,47 females); mean age=60(10) years; baseline sitting SBP=170(14) mm Hg, DBP=103(5) mm Hg | |
| Interventions | Candesartan 8 mg once daily; Candesartan 16 mg once daily; Losartan 50 mg once daily; Placebo; take in the morning | |
| Outcomes | Trough sitting SBP/DBP using fully automatic device (Omron HEM‐705CP); Peak sitting SBP/DBP using fully automatic device (Omron HEM‐705CP); WDAE | |
| Notes | BP change and SD of change not reported, endpoint BP and SD reported, baseline SD reported; imputed endpoint SD for SD of change; BP data from Table II, p. 55; Jadad score=4; funding source= Astra Hassle AB, Sweden | |
| Risk of bias | ||
| Bias | Authors' judgement | Support for judgement |
| Allocation concealment? | Unclear risk | B ‐ Unclear |
Benetos 2000.
| Methods | 2‐week washout; 2‐week placebo run‐in; inclusion criteria= mean supine DBP 100‐114 mm Hg after run‐in; 8‐week double‐blind treatment | |
| Participants | Irbesartan 150 mg: n=28(22 males,6 females); mean age=49(5.3) years; baseline supine SBP=170.9(16.1) mm Hg, DBP=106.7(6.4) mm Hg; Placebo: n=27(18 males,9 females); mean age=54(5.2) years; baseline supine SBP=164.2(14.5) mm Hg, DBP=103.5(3.0) mm Hg | |
| Interventions | Irbesartan 150 mg once daily; Placebo; taken at 8 AM | |
| Outcomes | Mean change from baseline in trough supine SBP/DBP using Dinamap 845 oscillometric recorder; WDAE | |
| Notes | BP change and SE of change reported, endpoint BP and SD not reported, baseline SD reported; calculated SD from N and SE; BP data from Table 1, p. 11; Jadad score=3; funding source= INSERM and Sanofi Research | |
| Risk of bias | ||
| Bias | Authors' judgement | Support for judgement |
| Allocation concealment? | Unclear risk | B ‐ Unclear |
Benz 1998.
| Methods | 2‐week washout; 2‐ to 4‐week placebo run‐in; inclusion criteria= mean sitting DBP 95‐115 mm Hg and a difference between enrolment and randomisation not > 10 mm Hg; 8‐week double‐blind treatment | |
| Participants | Valsartan 80 mg: n=99(63 males, 36 females); mean age=52(10.2) years: baseline sitting SBP=153.7(14.4) mm Hg, DBP=101.5(4.9) mm Hg; Valsartan 160 mg: n=99(61 males, 38 females); mean age=52(10.5) years: baseline sitting SBP=153.5(15.1) mm Hg, DBP=101.5(4.8) mm Hg; Placebo: n=94(58 males, 36 females); mean age=52(10.4) years: baseline sitting SBP=152.7(17.1) mm Hg, DBP=101.4(5.0) mm Hg | |
| Interventions | Valsartan 80 mg once daily; Valsartan 160 mg once daily; Placebo; taken in the morning | |
| Outcomes | Mean change from baseline in trough sitting SBP/DBP using mercury sphygmomanometer | |
| Notes | Placebo‐corrected BP change reported, SD of change not reported, endpoint BP and SD not reported, baseline SD reported; imputed baseline SBP SD for SBP SD of change; imputed overall trial mean DBP SD of change; BP data from Table 2, p. 864; Jadad score=3; funding source= Novartis Pharma | |
| Risk of bias | ||
| Bias | Authors' judgement | Support for judgement |
| Allocation concealment? | Unclear risk | B ‐ Unclear |
Black 1997.
| Methods | 2‐ to 4‐week placebo run‐in; inclusion criteria=sitting DBP 95‐115 mm Hg and SBP < 180 mm Hg after run‐in; 12‐week total double‐blind treatment, 4‐week double‐blind treatment at initial fixed dose, non‐responders were up‐titrated after 4 weeks | |
| Participants | Valsartan 80 mg: n=364(144 males,220 females); mean age=53.5(11.1) years; baseline sitting SBP=153.9(14.9) mm Hg, DBP=101.0(4.5) mm Hg; Placebo: n=183(113 males,70 females); mean age=54.0(11.8) years; baseline sitting SBP=154.0(15.0) mm Hg, DBP=101.3(4.6) mm Hg | |
| Interventions | Valsartan 80 mg once daily; Placebo; administered at approximately 8 AM | |
| Outcomes | Least mean square change from baseline in trough sitting SBP/DBP using mercury sphygmomanometer | |
| Notes | Used week 4 BP data only; BP change reported, SD of change not reported, endpoint BP and SD not reported; imputed SBP SD of change from baseline SBP SD of change, imputed overall trial mean DBP SD of change; SBP data from Figure 1, p. 487, DBP data from text, p. 485; Jadad score=2; funding source= Ciba‐Geigy | |
| Risk of bias | ||
| Bias | Authors' judgement | Support for judgement |
| Allocation concealment? | Unclear risk | B ‐ Unclear |
Chrysant 2003.
| Methods | 4‐week single‐blind placebo run‐in; inclusion criteria= mean sitting DBP 100‐115 mm Hg at both week 3 and week 4 run‐in visits, with a difference of 10 mm Hg or less between two visit means; 8‐week double‐blind treatment | |
| Participants | Olmesartan 20 mg: n=188(116 males, 72 females); mean age=51.7 years; baseline sitting SBP=154.9 mm Hg, DBP=104.0 mm Hg; Placebo: n=66(44 males,22 females); mean age=52.0 years; baseline sitting SBP=154.2 mm Hg, DBP=103.3 mm Hg | |
| Interventions | Olmesartan 20 mg once daily; Placebo; taken at 8 AM (± 1.5 h) | |
| Outcomes | Mean change from baseline in trough sitting SBP/DBP; WDAE | |
| Notes | BP change reported, SD of change not reported, endpoint BP and SD not reported, baseline SD not reported; imputed overall trial mean SBP/DBP SD of change; BP data from Table 3, p. 429; BP measurement device not reported; Jadad score=3; funding source= Sankyo Pharma | |
| Risk of bias | ||
| Bias | Authors' judgement | Support for judgement |
| Allocation concealment? | Unclear risk | B ‐ Unclear |
Chrysant 2004.
| Methods | 4‐week single‐blind placebo run‐in; inclusion criteria= mean sitting DBP 100‐115 mm Hg at both week 3 and week 4 run‐in visits, with at least 4 days between the two visits and a difference of 7 mm Hg or less between two DBP measurements; 8‐week double‐blind treatment | |
| Participants | Olmesartan 10 mg: n=39(24 males,15 females); mean age=49.9(10.9) years; baseline sitting SBP=153.6 mm Hg, DBP=104.1 mm Hg; Olmesartan 20 mg: n=41(21 males,20 females); mean age=54.1(9.9) years; baseline sitting SBP=154.6 mm Hg, DBP=103.2 mm Hg; Olmesartan 40 mg: n=45(28 males,17 females); mean age=54.4(11.2) years; baseline sitting SBP=152.9 mm Hg, DBP=102.6 mm Hg; Placebo: n=42(27 males,15 females); mean age=54.0(9.9) years; baseline sitting SBP=152.1 mm Hg, DBP=103.4 mm Hg | |
| Interventions | Olmesartan 10 mg once daily; Olmesartan 20 mg once daily; Olmesartan 40 mg once daily; Placebo; taken in the morning with breakfast | |
| Outcomes | Trough sitting SBP/DBP | |
| Notes | BP and SD of change not reported, endpoint BP reported, endpoint SD not reported, baseline SD not reported; imputed overall trial mean SBP/DBP SD of change; BP data from Table 2, p. 256; BP measurement device not reported; Jadad score=2; funding source= Sankyo Pharma | |
| Risk of bias | ||
| Bias | Authors' judgement | Support for judgement |
| Allocation concealment? | Unclear risk | B ‐ Unclear |
Cushman 2002.
| Methods | 2‐ to 4‐week placebo run‐in; inclusion criteria= patients with isolated systolic hypertension, defined as mean trough sitting SBP 140‐200 mm Hg and mean trough sitting DBP 70‐89 mm Hg; 12‐week total double‐blind treatment, 4‐week double‐blind treatment at initial fixed dose of losartan monotherapy (week 0‐4), non‐responders titrated to losartan 50 mg/HCTZ 12.5 mg combination after 4 weeks | |
| Participants | Losartan 50 mg: n=157(71 males,86 females); mean age=66.9(9.7) years; baseline sitting SBP=165.3(12.1) mm Hg, DBP=83.6(5.4) mm Hg, HR=73.5(8.7) bpm; Placebo: n=151(72 males,79 females); mean age=66.7(9.5) years; baseline sitting SBP=166.1(12.1) mm Hg, DBP=84.4(5.6) mm Hg, HR=73.7(8.3) bpm | |
| Interventions | Losartan 50 mg once daily; Placebo; taken between 6 AM and 10 AM | |
| Outcomes | Mean change from baseline in trough sitting SBP using mercury sphygmomanometer | |
| Notes | Used week 4 SBP data only; BP change reported, SD of change not reported, endpoint BP and SD not reported, baseline SD reported but not appropriate; imputed overall trial mean SBP SD of change; BP data from text, p. 105; WDAE reported at endpoint but not at week 4; Jadad score=3; funding source= Merck & Co. | |
| Risk of bias | ||
| Bias | Authors' judgement | Support for judgement |
| Allocation concealment? | Unclear risk | B ‐ Unclear |
Farsang 2001.
| Methods | 4‐week single‐blind placebo run‐in; inclusion criteria= mean sitting DBP 95‐114 mm Hg after 2 and 4 weeks' placebo run‐in; 8‐week double‐blind treatment | |
| Participants | Candesartan 8 mg: n=85(63 males,22 females); mean age=51(11) years: baseline sitting SBP=161.8(14.1) mm Hg, DBP=102.1(4.6) mm Hg; standing SBP=159.0(18.4) mm Hg, DBP=104.1(9.8) mm Hg; Placebo: n=83(54 males,29 females); mean age=52(10) years; baseline sitting SBP=161.5(16.3) mm Hg, DBP=102.1(5.2) mm Hg; standing SBP=157.5(18.7) mm Hg, DBP=102.5(8.9) mm Hg | |
| Interventions | Candesartan 8 mg once daily; Placebo; take in the morning | |
| Outcomes | Mean change from baseline in trough sitting SBP/DBP using fully automatic device (Omron HEM‐705CP); Mean change from baseline in trough standing SBP/DBP using fully automatic device (Omron HEM‐705CP); WDAE | |
| Notes | BP change and 95% CI of change reported, endpoint BP and SD not reported, baseline SD reported; 95% CI of change values are not appropriate; imputed baseline SBP SD for SBP SD of change, imputed overall trial mean DBP SD of change; BP data from Figure 1a, p. 20; Jadad score=5; funding source= Astra Hassle AB | |
| Risk of bias | ||
| Bias | Authors' judgement | Support for judgement |
| Allocation concealment? | Low risk | A ‐ Adequate |
Feldman 1997.
| Methods | 2‐ to 4‐week washout; 10‐29 day single‐blind placebo run‐in; inclusion criteria= mean sitting DBP 95‐114 mm Hg after run‐in; 9‐week double‐blind treatment, patients received tasosartan 25 mg initially, this dose was titrated to 50 mg at end of week 3 and to 100 mg at end of week 6 until efficacy was achieved (defined as mean trough sitting DBP of 90 mm Hg or less or a change of 10 mm Hg or more from baseline) or the highest dose (100 mg) was reached in the absence of adverse events | |
| Participants | Tasosartan 25 mg: n=71(51 males, 20 females); mean age=53.5(8.8) years; baseline sitting SBP=154.1 mm Hg, DBP=101.2 mm Hg; Placebo: n=71(55 males,16 females); mean age=50.9(10.5) years; baseline sitting SBP=151.5 mm Hg, DBP=101.6 mm Hg | |
| Interventions | Tasosartan 25 mg once daily; Placebo; taken at 8:30 AM (± 1 h) | |
| Outcomes | Mean change from baseline in trough sitting SBP/DBP | |
| Notes | Used week 3 BP data only; BP change reported; SD of change not reported; endpoint BP and SD not reported; baseline SBP/DBP SD not reported; imputed overall trial mean SD of change for SBP and DBP; BP data from Table 2, p. 296; BP measurement device not reported; WDAE reported at endpoint but not at week 3; Jadad score=3; funding source= not reported | |
| Risk of bias | ||
| Bias | Authors' judgement | Support for judgement |
| Allocation concealment? | Unclear risk | B ‐ Unclear |
Flack 2001.
| Methods | 4‐week placebo run‐in; inclusion criteria= mean sitting DBP 95‐109 mm Hg during 2 separate visits during run‐in; 12‐week total double‐blind treatment, initial 4‐week double‐blind treatment at fixed dose of losartan 50 mg monotherapy or losartan 50 mg/HCTZ 0 mg combination (week 0‐4), non‐responders titrated to response at weeks 4 or 8 | |
| Participants | Losartan 50 mg monotherapy: n=193(87 males,106 females); mean age=50.4(10.5) years; baseline sitting SBP=150.9(11.3) mm Hg, DBP=99.9(4.2) mm Hg; Losartan 50 mg/HCTZ 0 mg: n=59(28 males,31 females); mean age=47.2(9.8) years; baseline sitting SBP=149.1(10.6) mm Hg, DBP=100.2(4.2) mm Hg; Placebo: n=188(77 males,111 females); mean age=50.6(10.2) years; baseline sitting SBP=151.4(12.1) mm Hg, DBP=99.8(3.9) mm Hg | |
| Interventions | During first 4 weeks of double‐blind treatment: Losartan 50 mg once daily; Losartan 50 mg/HCTZ 0 mg once daily; Placebo; taken in the morning between 6 AM and 10 AM | |
| Outcomes | Adjusted mean change from baseline in trough sitting SBP/DBP using mercury sphygmomanometer | |
| Notes | Used week 4 BP data only, combined BP data for losartan monotherapy and losartan/HCTZ combination arms; BP change reported; SD of change not reported; endpoint BP and SD not reported; baseline SD reported; imputed baseline SBP SD for SBP SD of change, imputed overall trial mean DBP SD of change; DBP data from Figure 2, p. 1201, SBP data from Figure 3, p. 1202; WDAE reported at endpoint but not at week 4; Jadad score=3; funding source= Merck & Co. | |
| Risk of bias | ||
| Bias | Authors' judgement | Support for judgement |
| Allocation concealment? | Unclear risk | B ‐ Unclear |
Flack 2003.
| Methods | 2‐ to 4‐week single‐blind placebo run‐in; inclusion criteria= mean DBP 95‐109 mm Hg and mean SBP < 180 mm Hg after run‐in; 16‐week total double‐blind treatment, 4‐week double‐blind treatment at initial fixed dose of losartan monotherapy (week 0‐4), non‐responders titrated to response at weeks 4, 8 or 12 | |
| Participants | Losartan 50 mg: n=188(83 males,105 females); mean age=52.0(10.3) years; n=184: baseline sitting SBP=150.7(11.6) mm Hg, DBP=99.2(3.5) mm Hg, HR=71.5(8.8) bpm; Placebo: n=181(84 males,97 females); mean age=52.1(11.1) years; n=177: baseline sitting SBP=148.9(11.6) mm Hg, DBP=99.1(3.6) mm Hg, HR=73.1(8.9) bpm | |
| Interventions | Losartan 50 mg once daily; Placebo; administered in the morning | |
| Outcomes | Adjusted mean change from baseline in trough sitting DBP using mercury sphygmomanometer | |
| Notes | Used week 4 BP data only; BP change and SD of change reported, endpoint BP and SD not reported, baseline SD reported; time of BP measurement not reported; BP data from Figure 1, p. 1152; WDAE reported at endpoint but not at week 4; Jadad score=3; funding source= Pharmacia | |
| Risk of bias | ||
| Bias | Authors' judgement | Support for judgement |
| Allocation concealment? | Unclear risk | B ‐ Unclear |
Fogari 1997.
| Methods | 4‐to 5‐week placebo run‐in; inclusion criteria= mean sitting DBP 95‐110 mm Hg on days 22, 29 and, if necessary, day 36 (± 3 days) of run‐in; 8‐week double‐blind treatment | |
| Participants | Irbesartan 75 mg once daily: n=55(37 males,18 females); mean age=56.7(10.4) years; baseline sitting SBP=157.0(13.4) mm Hg, DBP=101.4(5.2) mm Hg; Irbesartan 150 mg once daily: n=53(32 males,21 females); mean age=54.6(11.7) years; baseline sitting SBP=158.9(13.8) mm Hg, DBP=101.0(5.1) mm Hg; Irbesartan 75 mg twice daily: n=57(36 males,21 females); mean age=54.1(10.6) years; baseline sitting SBP=156.0(12.8) mm Hg, DBP=106.7(4.5) mm Hg; Placebo: n=50(36 males,14 females); mean age=53.3(11.3) years; baseline sitting SBP=158.3(13.4) mm Hg, DBP=101.5(5.0) mm Hg | |
| Interventions | Irbesartan 75 mg once daily; Irbesartan 150 mg once daily; Irbesartan 75 mg twice daily; Placebo; once daily dosing: morning dose taken between 7 AM and 10 AM; twice daily dosing: morning dose taken between 7 AM and 10 AM and evening dose approximately 12 h later | |
| Outcomes | Mean change from baseline in trough sitting SBP/DBP using mercury sphygmomanometer; WDAE | |
| Notes | BP change and SE of change reported, endpoint BP and SD not reported, baseline SD reported; calculated SD from N and SE; BP data from Table 2, p. 1515; Jadad score=4; funding source= Bristol‐Myers Squibb and Sanofi | |
| Risk of bias | ||
| Bias | Authors' judgement | Support for judgement |
| Allocation concealment? | Unclear risk | B ‐ Unclear |
Fogari 2001.
| Methods | 2‐week placebo washout phase; inclusion criteria= postmenopausal women (51‐60 years old) with DBP 91‐105 mm Hg and SBP < 180 mm Hg; 12‐week double‐blind treatment phase, titration‐to‐response after 6 weeks | |
| Participants | Candesartan 8 mg: n=29; mean age=55.1(2.0) years; baseline SBP=159.8(12.3) mm Hg, DBP=100.5(7.2) mm Hg, HR= 76.8(8.9) bpm Irbesartan 150 mg: n=28; mean age=55.2(2.3) years; baseline SBP=160.6(13.0) mm Hg, DBP=100.9(5.9) mm Hg, HR= 75.9(8.8) bpm Losartan 50 mg: n=28; mean age=54.7(2.3) years; baseline SBP=160.2(12.1) mm Hg, DBP=99.8(7.1) mm Hg, HR= 76.1(8.6) bpm Valsartan 80 mg: n=30; mean age=54.8(2.2) years; baseline SBP=161.2(11.9) mm Hg, DBP=101.3(6.7) mm Hg, HR= 77.2(9.2) bpm Placebo: n=25; mean age=55.1(2.1) years; baseline SBP=159.7(11.5) mm Hg, DBP=100.6(6.1) mm Hg, HR= 75.7(9.1) bpm | |
| Interventions | Candesartan 8 mg once daily; Irbesartan 150 mg once daily; Losartan 50 mg once daily; Valsartan 80 mg once daily; Placebo; administered between 8 AM and 9 AM | |
| Outcomes | Trough sitting SBP/DBP using standard mercury sphygmomanometer; Trough sitting HR | |
| Notes | Used week 6 BP data only; BP change and SD of change not reported, week 6 BP and SD reported, imputed 6‐week SD for SD of change; BP data from Table II, p. 73; Jadad score=4; funding source= not reported | |
| Risk of bias | ||
| Bias | Authors' judgement | Support for judgement |
| Allocation concealment? | Unclear risk | B ‐ Unclear |
Gradman 1995.
| Methods | 7‐day washout period; total 4‐week single‐blind placebo run‐in, patients' supine DBP >/= 95 mm Hg after initial 2‐week single‐blind placebo phase; additional 2‐week single‐blind placebo phase; inclusion criteria= mean supine DBP 100‐115 mm Hg, and two BP readings during weeks 2 and 4 of single‐blind placebo phase could not differ by > 7 mm Hg; 8‐week double‐blind treatment | |
| Participants | Losartan 10 mg: n=80(51 males,29 females); median age=55 years; baseline SBP=160.7 mm Hg, DBP=104.3 mm Hg; Losartan 25 mg: n=82(55 males,27 females); median age=53 years; baseline SBP=158.7 mm Hg, DBP=103.3 mm Hg; Losartan 50 mg: n=79(53 males,26 females); median age=53 years; baseline SBP=158.3 mm Hg, DBP=104.1 mm Hg; Losartan 100 mg: n=90(59 males,31 females); median age=52.5 years; baseline SBP=156.3 mm Hg, DBP=104.1 mm Hg; Losartan 150 mg: n=84(62 males,22 females); median age=56 years; baseline SBP=158.6 mm Hg, DBP=103.4 mm Hg; Placebo: n=78(47 males,31 females); median age=53 years; baseline SBP=157.9 mm Hg, DBP=103.3 mm Hg | |
| Interventions | Losartan 10 mg once daily; Losartan 25 mg once daily; Losartan 50 mg once daily; Losartan 100 mg once daily; Losartan 150 mg once daily; Placebo | |
| Outcomes | Mean change from baseline in trough supine SBP/DBP; Mean change from baseline in peak supine SBP/DBP; WDAE | |
| Notes | BP change and SD of change reported, endpoint BP reported; endpoint SD not reported, BP data from Table 2, p.1348; BP measurement device not reported; Jadad score=3; funding source= Merck | |
| Risk of bias | ||
| Bias | Authors' judgement | Support for judgement |
| Allocation concealment? | Unclear risk | B ‐ Unclear |
Gradman 1999.
| Methods | 2‐ to 4‐week single‐blind placebo run‐in; inclusion criteria= mean sitting DBP 95‐114 mm Hg on 3 consecutive weekly visits before end of run‐in, with no more than 12 mm Hg difference in DBP between 3 visits, and difference between means at last 2 visits could not exceed 8 mm Hg; 8‐week double‐blind treatment | |
| Participants | Eprosartan 600 mg: n=123(71 males,52 females); mean age=54.0(11.1) years: baseline sitting SBP=149.3(13.3) mm Hg, DBP=100.4(4.4) mm Hg, HR=73.2(7.8) bpm; Placebo: n=120(76 males,44 females); mean age=53.3(9.9) years; baseline sitting SBP=151.3(14.2) mm Hg, DBP=101.2(4.4) mm Hg, HR=73.1(7.7) bpm | |
| Interventions | Eprosartan 600 mg once daily; Placebo; taken in the morning | |
| Outcomes | Least‐squares mean change from baseline in trough sitting SBP/DBP using mercury sphygmomanometer; Least‐squares mean change from baseline in trough standing SBP/DBP using mercury sphygmomanometer; Least‐squares mean change from baseline in trough sitting HR; Least‐squares mean change from baseline in trough standing HR; WDAE | |
| Notes | BP and SE of change reported, endpoint BP and SD not reported; calculated SD of change from N and SE of change; BP data from text, p. 445 and p.446 and Figure 1, p. 447; Jadad score=3; funding source= SmithKline Beecham Pharma | |
| Risk of bias | ||
| Bias | Authors' judgement | Support for judgement |
| Allocation concealment? | Unclear risk | B ‐ Unclear |
Gradman 2005.
| Methods | 2‐week washout period; 2‐ to 4‐week single‐blind placebo run‐in; inclusion criteria= mean sitting DBP 95‐110 mm Hg; 8‐week double‐blind treatment | |
| Participants | Irbesartan 150 mg: n=134(66 males,68 females); mean age=56.1(11.8) years; baseline sitting SBP=152.8(11.2) mm Hg, DBP=99.4(4.0) mm Hg, HR=72.9(7.9) bpm; Placebo: n=131(64 males,67 females); mean age=57.1(12.0) years; baseline sitting SBP=152.3(12.1) mm Hg, DBP=98.9(3.3) mm Hg, HR=72.8(9.2) bpm | |
| Interventions | Irbesartan 150 mg once daily; Placebo; taken with water at approximately 8 AM | |
| Outcomes | Mean change from baseline in trough sitting SBP/DBP using mercury sphygmomanometer; WDAE | |
| Notes | BP change and SD of change reported, endpoint BP and SD reported, BP data from Table 2, p. 1015; Jadad Score=4; funding source= Novartis | |
| Risk of bias | ||
| Bias | Authors' judgement | Support for judgement |
| Allocation concealment? | Unclear risk | B ‐ Unclear |
Guthrie 1998.
| Methods | 4‐ to 5‐week single‐blind placebo run‐in; inclusion criteria= sitting DBP 95‐110 mm Hg after weeks 3 and 4 of placebo therapy, with the two readings not differing by more than 8 mm Hg; a fifth week of placebo treatment was optional if patients did not meet eligibility criteria at week 4 of run‐in; 12‐week total double‐blind treatment, 6‐week fixed dose therapy, then titrated to response at week 6 | |
| Participants | Irbesartan 75 mg: n=104(71 males,33 females); mean age=53 years; baseline sitting SBP=148.9(14.2) mm Hg, DBP=100.6(4.4) mm Hg, HR=73(9) bpm; Irbesartan 150 mg: n=98(62 males,36 females); mean age=53 years; baseline sitting SBP=147.8(12.9) mm Hg, DBP=99.5(4.0) mm Hg, HR=72(8) bpm; Placebo: n=117(80 males,37 females); mean age=53 years; baseline sitting SBP=148.0(14.2) mm Hg, DBP=99.9(3.8) mm Hg, HR=72(9) bpm | |
| Interventions | Irbesartan 75 mg once daily; Irbesartan 150 mg once daily; Placebo; taken between 6 AM and 10 AM | |
| Outcomes | Mean change from baseline in trough sitting SBP/DBP using mercury sphygmomanometer | |
| Notes | Used week 6 BP data only; BP change and SE of change reported, endpoint BP and SD not reported, baseline SD reported; calculated SD from N and SE; BP data from Table II, p. 222; Jadad score=4; funding source= Bristol‐Myers Squibb | |
| Risk of bias | ||
| Bias | Authors' judgement | Support for judgement |
| Allocation concealment? | Unclear risk | B ‐ Unclear |
Hanefeld 2001.
| Methods | 3‐week placebo run‐in; inclusion criteria= sitting DBP 91‐105 mm Hg after run‐in; 12‐week double‐blind treatment | |
| Participants | Valsartan 80 mg: n=63(28 males,35 females); mean age=57.4(10.8) years; baseline sitting SBP=163.9(12.5) mm Hg, DBP=97.2(5.2) mm Hg, HR=72.2(6.1) bpm; Placebo: n=60(33 males,27 females); mean age=58.8(11.1) years; baseline sitting SBP=167.0(14.1) mm Hg, DBP=98.5(3.4) mm Hg, HR=73.6(7.9) bpm | |
| Interventions | Valsartan 80 mg once daily; Placebo; taken in the morning | |
| Outcomes | Mean change from baseline in trough sitting SBP/DBP; Mean change from baseline in trough sitting HR | |
| Notes | BP change and SD of change reported, endpoint BP and SD not reported; baseline SD reported; BP data from Table 3, p. 275; BP measurement device not reported; Jadad score=2; funding source= Novartis Pharma | |
| Risk of bias | ||
| Bias | Authors' judgement | Support for judgement |
| Allocation concealment? | Unclear risk | B ‐ Unclear |
Hedner 1999.
| Methods | 2‐week single‐blind placebo run‐in; inclusion criteria= sitting DBP 95‐115 mm Hg after run‐in; 8‐week total double‐blind treatment, 4‐week low‐dose treatment (week 0‐4), forced titration at week 4 to high‐dose, 4‐week high‐dose treatment (week 4‐8) | |
| Participants | Valsartan 80 mg: n=551(313 males,238 females); mean age=55.7(10.9) years; baseline sitting SBP=157.0(16.3) mm Hg, DBP=101.4(4.6) mm Hg, HR=73.9(9.8) bpm; Losartan 50 mg: n=545(309 males,236 females); mean age=54.9(10.5) years; baseline sitting SBP=157.4(15.9) mm Hg, DBP=101.6(5.1) mm Hg, HR=73.7(9.0) bpm; Placebo: n=273(157 males,116 females); mean age=55.2(10.5) years; baseline sitting SBP=157.8(16.3) mm Hg, DBP=101.9(5.2) mm Hg, HR=73.6(9.7) bpm | |
| Interventions | Valsartan 80 mg once daily; Losartan 50 mg once daily; Placebo; taken in the morning | |
| Outcomes | Trough sitting SBP/DBP using mercury sphygmomanometer; | |
| Notes | Used week 4 BP data only; BP change and SD of change not reported, endpoint BP reported, endpoint SD not reported, baseline SD reported; imputed baseline SBP SD for SBP SD of change; imputed overall trial mean DBP SD of change; BP data from text and Figure 1, p. 416; Jadad score=4; funding source= Novartis Pharma | |
| Risk of bias | ||
| Bias | Authors' judgement | Support for judgement |
| Allocation concealment? | Unclear risk | B ‐ Unclear |
Holwerda 1996.
| Methods | 1‐week washout; 2‐week placebo run‐in; inclusion criteria= sitting DBP 95‐115 mm Hg after run‐in; 8‐week double‐blind treatment | |
| Participants | Valsartan 80 mg: n=137(65 males,72 females); mean age=53.1(12.4) years; baseline sitting SBP=161.7(11.6) mm Hg, DBP=101.2(4.5) mm Hg; Enalapril 20 mg: n=69(40 males,29 females); mean age=52.5(10.3) years; baseline sitting SBP=161.5(10.4) mm Hg, DBP=102.2(4.2) mm Hg; Placebo: n=142(76 males,66 females); mean age=53.1(12.9) years; baseline sitting SBP=161.0(11.5) mm Hg, DBP=101.8(4.4) mm Hg | |
| Interventions | Valsartan 80 mg once daily; Enalapril 20 mg once daily; Placebo; taken in the morning | |
| Outcomes | Trough sitting SBP/DBP using mercury sphygmomanometer; WDAE | |
| Notes | BP change and SD of change not reported, endpoint BP and SD reported; imputed endpoint SD for SD of change; BP data from Table 3, p. 1150; Jadad score=3; funding source= Ciba‐Geigy | |
| Risk of bias | ||
| Bias | Authors' judgement | Support for judgement |
| Allocation concealment? | Unclear risk | B ‐ Unclear |
Ikeda 1997.
| Methods | 4‐week single‐blind placebo phase; inclusion criteria= sitting DBP 95‐115 mm Hg after 2 and 4 weeks of placebo therapy, with the two readings not differing by more than 7 mm Hg; no more than 30% of patients enrolled could have been black; 12‐week double‐blind treatment, 6‐week fixed dose therapy, with BP measured at 3‐week intervals, titrated to response at week 6 | |
| Participants | Losartan 50 mg: n=250(161 males,89 females); mean age=54.1 years; baseline DBP=102.2 mm Hg; Placebo: n=116(74 males,42 females); mean age=53.8 years; baseline DBP=101.3 mm Hg | |
| Interventions | Losartan 50 mg once daily; Placebo | |
| Outcomes | Change from baseline in trough sitting SBP/DBP using mercury sphygmomanometer | |
| Notes | Used week 6 BP data only; BP change reported, DBP SD of change reported only, endpoint BP reported, endpoint DBP SD reported only, baseline SD not reported; imputed overall trial mean SBP SD of change; DBP data from Table 2 and SBP data from Figure 2, p. 38; Jadad score=4; funding source= Merck | |
| Risk of bias | ||
| Bias | Authors' judgement | Support for judgement |
| Allocation concealment? | Unclear risk | B ‐ Unclear |
Kassler‐Taub 1998.
| Methods | 4‐ to 5‐week single‐blind placebo run‐in; inclusion criteria= sitting DBP 95‐110 mm Hg during 2 visits (days 22 and 29, or days 29 and 36), and two BP readings for two visits could not differ by > 8 mm Hg; 8‐week double‐blind treatment | |
| Participants | Irbesartan 150 mg: n=142(77 males,65 females); mean age=53.1(10.5) years; baseline sitting SBP=155.3(16.2) mm Hg, DBP=101.1(4.6) mm Hg; Irbesartan 300 mg: n=140(80 males,60 females); mean age=55.6(10.4) years; baseline sitting SBP=155.4(16.0) mm Hg, DBP=100.4(4.5) mm Hg; Losartan 100 mg: n=138(69 males,69 females); mean age=55.0(10.7) years; baseline sitting SBP=153.3(15.5) mm Hg, DBP=100.6(4.4) mm Hg; Placebo: n=147(90 males,57 females); mean age=53.8(9.6) years; baseline sitting SBP=152.4(14.7) mm Hg, DBP=100.3(4.3) mm Hg | |
| Interventions | Irbesartan 150 mg once daily; Irbesartan 300 mg once daily; Losartan 100 mg once daily; Placebo | |
| Outcomes | Adjusted mean change from baseline in trough sitting SBP/DBP using mercury sphygmomanometer; WDAE | |
| Notes | BP change and SE of change reported, endpoint BP and SD not reported; baseline SD not reported, calculated SD from N and SE; BP data from Table 2, p. 448; Jadad score=4; funding source= Bristol‐Myers Squibb | |
| Risk of bias | ||
| Bias | Authors' judgement | Support for judgement |
| Allocation concealment? | Unclear risk | B ‐ Unclear |
Klingbeil 2002.
| Methods | 4‐week washout; no single‐blind placebo run‐in; inclusion criteria= mean sitting BP =/> 160/95 mm Hg and < 220/115 mm Hg after washout; 6‐week double‐blind treatment | |
| Participants | Valsartan 80 mg: n=20(13 males,7 females); mean age=52(9) years; baseline sitting SBP=171(9) mm Hg, DBP=102(3) mm Hg, HR=70.6(8.3) bpm; Placebo: n=20(8 males,12 females); mean age=52(9) years; baseline sitting SBP=174(8) mm Hg, DBP=102(3) mm Hg, HR=70.3(6.8) bpm | |
| Interventions | Valsartan 80 mg once daily; Placebo; taken in the morning | |
| Outcomes | Mean change from baseline in trough sitting SBP/DBP | |
| Notes | BP change and SD of change reported, endpoint BP and SD not reported; BP data from text, p. 2425; BP measurement device not reported; Jadad score=2; funding source= Novartis Pharma | |
| Risk of bias | ||
| Bias | Authors' judgement | Support for judgement |
| Allocation concealment? | Unclear risk | B ‐ Unclear |
Kochar 1999.
| Methods | 4‐ to 5‐week single‐blind placebo run‐in; inclusion criteria= sitting DBP 95‐110 mm Hg at weeks 3 and 4 of run‐in, and two BP readings for two visits could not differ by > 8 mm Hg; an optional visit was permitted at week 5 and the mean DBP values at weeks 4 and 5 were then used to determine eligibility; 8‐week double‐blind treatment | |
| Participants | All patients: n=683(444 males,239 females); mean age=55.0(10.5) years; baseline sitting SBP=151(14.7) mm Hg, DBP=100(4.2) mm Hg | |
| Interventions | Irbesartan 37.5 mg once daily; Irbesartan 100 mg once daily; Irbesartan 300 mg once daily; Placebo; taken between 6 AM and 10 AM | |
| Outcomes | Mean change from baseline in trough sitting SBP/DBP using mercury sphygmomanometer; WDAE | |
| Notes | BP change and SD of change reported, endpoint BP and SD not reported; baseline SD reported; BP data from Table 2, p. 801; Jadad score=4; funding= Bristol‐Myers Squibb | |
| Risk of bias | ||
| Bias | Authors' judgement | Support for judgement |
| Allocation concealment? | Unclear risk | B ‐ Unclear |
Lacourciere 1998.
| Methods | 2‐ to 4‐week washout; 2‐week single‐blind placebo run‐in; inclusion criteria= mean sitting DBP 95‐114 mm Hg and did not vary by more than 10 mm Hg from the interday mean sitting DBP; 4‐week double‐blind treatment | |
| Participants | Tasosartan 10 mg: n=57(40 males,17 females); mean age=54 years: baseline sitting SBP=152 mm Hg, DBP=101 mm Hg; Tasosartan 30 mg: n=55(43 males,12 females); mean age=52 years; baseline sitting SBP=151 mm Hg, DBP=101 mm Hg; Tasosartan 100 mg: n=55(36 males,19 females); mean age=53 years; baseline sitting SBP=152 mm Hg, DBP=101 mm Hg; Tasosartan 300 mg: n=55(35 males,20 females); mean age=53 years; baseline sitting SBP=152 mm Hg, DBP=101 mm Hg; Placebo: n=56(33 males,23 females); mean age=55 years; baseline sitting SBP=152 mm Hg, DBP=100 mm Hg | |
| Interventions | Tasosartan 10 mg once daily; Tasosartan 30 mg once daily; Tasosartan 100 mg once daily; Tasosartan 300 mg once daily; Placebo; taken between 7:30 and 9:30AM | |
| Outcomes | Mean change from baseline in trough sitting SBP/DBP using mercury sphygmomanometer; WDAE | |
| Notes | BP change and 95% CI of change reported for tasosartan groups, BP change reported for placebo group, 95% CI of BP change not reported for placebo group, endpoint BP and SD not reported; calculated SD of change from 95% CI of change for tasosartan groups; imputed overall trial mean SBP/DBP SD of change for placebo group; BP data from Figure 1, p. 457; 95% CI data from text, p. 457; Jadad score=3; funding source= Wyeth Ayerst Research | |
| Risk of bias | ||
| Bias | Authors' judgement | Support for judgement |
| Allocation concealment? | Unclear risk | B ‐ Unclear |
Mallion 1999.
| Methods | 4‐week single‐blind placebo run‐in; inclusion criteria= mean supine DBP 95‐114 mm Hg and SBP 140‐200 mm Hg after run‐in; 6‐week double‐blind treatment | |
| Participants | Telmisartan 40 mg: n=57(38 males,19 females); mean age=58 years: baseline supine SBP=161.9(14.7) mm Hg, DBP=100.8(4.2) mm Hg, HR=70.8(10.3) bpm; Telmisartan 80 mg: n=54(35 males,19 females); mean age=57 years; baseline supine SBP=164.2(15.3) mm Hg, DBP=101.8(4.9) mm Hg, HR=69.6(8.5) bpm; Losartan 50 mg: n=57(33 males,24 females); mean age=56 years; baseline supine SBP=162.4(16.3) mm Hg, DBP=100.7(4.5) mm Hg, HR=70.6(9.1) bpm; Placebo: n=55(44 males,11 females); mean age=54 years; baseline supine SBP=156.5(14.7) mm Hg, DBP=99.2(3.9) mm Hg, HR=67.9(8.3) bpm | |
| Interventions | Telmisartan 40 mg once daily; Telmisartan 80 mg once daily; Losartan 50 mg once daily; Placebo; taken between 7 AM and 10 AM | |
| Outcomes | Mean change from baseline in trough supine SBP/DBP using mercury sphygmomanometer; WDAE | |
| Notes | BP change and SE of change reported, endpoint BP and SD not reported; calculated SD from SE and N; BP data from Table 3, p. 660; Jadad score=4; funding source= not reported | |
| Risk of bias | ||
| Bias | Authors' judgement | Support for judgement |
| Allocation concealment? | Unclear risk | B ‐ Unclear |
Manolis 2004.
| Methods | 2‐ to 4‐week single‐blind placebo run‐in; inclusion criteria= mean sitting SBP/DBP of 150‐179/<90 mm Hg after run‐in; 6‐week double‐blind treatment | |
| Participants | Telmisartan 20 mg: n=206(87 males,119 females); mean age=63.0(11.5) years: baseline sitting SBP=163.5(8.0) mm Hg, DBP=83.7(5.2) mm Hg, HR=72.4(10.0) bpm; Telmisartan 40 mg: n=210(87 males,123 females); mean age=62.7(10.8) years: baseline sitting SBP=162.7(8.2) mm Hg, DBP=83.4(4.6) mm Hg, HR=72.1(9.9) bpm; Telmisartan 80 mg: n=207(91 males,116 females); mean age=62.5(10.9) years; baseline sitting SBP=162.4(8.2) mm Hg, DBP=83.2(5.1) mm Hg, HR=72.4(9.9) bpm; Placebo: n=211(90 males,121 females); mean age=63.6(10.2) years; baseline sitting SBP=163.3(7.8) mm Hg, DBP=83.5(5.1) mm Hg, HR=72.2(9.9) bpm | |
| Interventions | Telmisartan 20 mg once daily; Telmisartan 40 mg once daily; Telmisartan 80 mg once daily; Placebo; taken in the morning | |
| Outcomes | Mean change from baseline in trough sitting SBP/DBP using mercury sphygmomanometer; WDAE | |
| Notes | Used SBP data only; BP change reported, SD of change not reported, endpoint BP and SD not reported, baseline SD reported; imputed overall trial mean SBP SD of change since SBP levels used as inclusion criteria; BP data from text, p. 1035; Jadad score=3; funding source= Boehringer Ingelheim | |
| Risk of bias | ||
| Bias | Authors' judgement | Support for judgement |
| Allocation concealment? | Unclear risk | B ‐ Unclear |
McGill 2001.
| Methods | 2‐week washout; 4‐week single‐blind placebo run‐in; inclusion criteria= mean supine DBP 95‐114 mm Hg during last 2 weeks of run‐in, which could not vary by > 7mm Hg from visit to visit or by > 10mm Hg over this 2‐week period, and mean supine SBP 140‐200 mm Hg at randomization; 8‐week double‐blind treatment | |
| Participants | Telmisartan 20‐160 mg: n=209(117 males,92 females); mean age=51 years; ITT(n=208) baseline supine SBP=153.2(12.0) mm Hg, DBP=100.7(4.6) mm Hg, HR=71.2(9.2) bpm; Placebo: n=74(45 males,29 females); mean age=55 years; ITT(n=73) baseline supine SBP=153.7(11.3) mm Hg, DBP=100.3(3.9) mm Hg, HR=71.9(9.3) bpm | |
| Interventions | Telmisartan 20 mg once daily; Telmisartan 40 mg once daily; Telmisartan 80 mg once daily; Telmisartan 160 mg once daily; Placebo; taken at 8AM and 1h before breakfast | |
| Outcomes | Mean change from baseline in trough supine SBP/DBP using mercury sphygmomanometer; WDAE | |
| Notes | BP change and SE of change reported, endpoint BP and SD not reported, baseline SD reported; calculated SD from N and SE; BP data from Table IV, p. 841 and Figure 2, p. 843; Jadad score=5; funding source= Boehringer Ingelheim | |
| Risk of bias | ||
| Bias | Authors' judgement | Support for judgement |
| Allocation concealment? | Low risk | A ‐ Adequate |
Meineke 1997.
| Methods | 2‐week washout; 2‐week single‐blind placebo run‐in; inclusion criteria= mean sitting DBP 95‐114 mm Hg after washout; 4‐week double‐blind treatment | |
| Participants | All candesartan groups: n=185(129 males,56 females); mean age=53 years; Candesartan 2 mg: baseline sitting SBP=151.7 mm Hg, DBP=102.4 mm Hg; Candesartan 4 mg: baseline sitting SBP=154.9 mm Hg, DBP=104.0 mm Hg; Candesartan 8 mg: baseline sitting SBP=152.1 mm Hg, DBP=102.0 mm Hg; Candesartan 12 mg: baseline sitting SBP=153.4 mm Hg, DBP=103.4 mm Hg; Candesartan 16 mg: baseline sitting SBP=152.3 mm Hg, DBP=102.4 mm Hg; Placebo: n=39; baseline sitting SBP=154.6 mm Hg, DBP=103.2 mm Hg | |
| Interventions | Candesartan 2 mg once daily; Candesartan 4 mg once daily; Candesartan 8 mg once daily; Candesartan 12 mg once daily; Candesartan 16 mg once daily; Placebo; taken just before breakfast | |
| Outcomes | Trough sitting SBP/DBP | |
| Notes | BP and SD of change not reported, endpoint BP reported, endpoint SD not reported, baseline SD not reported; imputed overall trial mean SBP/DBP SD of change; BP data from Table 2, p. 225; BP measurement device not reported; Jadad score=3; funding source= Takeda Euro R&D Centre | |
| Risk of bias | ||
| Bias | Authors' judgement | Support for judgement |
| Allocation concealment? | Unclear risk | B ‐ Unclear |
Neutel 1998.
| Methods | >/=7‐day washout; 4‐week placebo run‐in; inclusion criteria= mean supine DBP 100‐114 mm Hg after run‐in; 4‐week double‐blind treatment | |
| Participants | Telmisartan 20 mg: n=47(32 males,15 females); mean age=52(9.6) years; baseline supine SBP=153.0 mm Hg, DBP=103.0 mm Hg; Telmisartan 40 mg: n=47(32 males,15 females); mean age=54.3(7.1) years; baseline supine SBP=148.8 mm Hg, DBP=101.5 mm Hg; Telmisartan 80 mg: n=44(32 males,12 females); mean age=51.4(9.7) years; baseline supine SBP=153.1 mm Hg, DBP=103.1 mm Hg; Telmisartan 120 mg: n=45(31 males,14 females); mean age=50.8(10.2) years; baseline supine SBP=149.8 mm Hg, DBP=102.1 mm Hg; Telmisartan 160 mg: n=45(33 males,12 females); mean age=53(9.7) years; baseline supine SBP=152.7 mm Hg, DBP=101.9 mm Hg; Placebo: n=46(29 males,17 females); mean age=52(8.2) years; baseline supine SBP=152.9 mm Hg, DBP=102.5 mm Hg | |
| Interventions | Telmisartan 20 mg once daily; Telmisartan 40 mg once daily; Telmisartan 80 mg once daily; Telmisartan 120 mg once daily; Telmisartan 160 mg once daily; Placebo | |
| Outcomes | Adjusted mean change from baseline in trough supine SBP/DBP using mercury sphygmomanometer; Adjusted mean change from baseline in HR; WDAE | |
| Notes | BP change and SE of change reported, endpoint BP and SD not reported, baseline SD reported; calculated SD from N and SE; BP data from Table 2, p. 211; Jadad score=4; funding source= not reported | |
| Risk of bias | ||
| Bias | Authors' judgement | Support for judgement |
| Allocation concealment? | Unclear risk | B ‐ Unclear |
Neutel 1999.
| Methods | 2‐ to 4‐week washout; 2‐week single‐blind placebo run‐in; inclusion criteria= mean sitting DBP 95‐114 mm Hg and did not vary by more than 10 mm Hg for each of three visits during run‐in; 10‐week total double‐blind treatment, patients initially received tasosartan 50 mg once daily initially, this dose was titrated to 100 mg at end of week 3 and to 200 mg at end of week 6, until efficacy was achieved (defined as mean trough sitting DBP of 90 mm Hg or less) | |
| Participants | Tasosartan 50 mg: n=132(88 males, 44 females); mean age=52.2(9.6) years; baseline sitting SBP=150.6(13.8) mm Hg, DBP=100.3(8.0) mm Hg; Placebo: n=130(92 males,38 females); mean age=52.5(9.7) years; baseline sitting SBP=150.1(13.7) mm Hg, DBP=100.3(8.0) mm Hg | |
| Interventions | Tasosartan 50 mg once daily; Placebo; taken as close to 8:30 AM as possible | |
| Outcomes | Mean change from baseline in trough sitting SBP/DBP | |
| Notes | Used week 3 BP data only; BP and SD of change reported, endpoint BP and SD not reported; BP measurement device not reported; DBP data from Figure 1, p. 120; SBP data from Figure 2, p. 120; Jadad score=2; funding source= Wyeth Ayerst Research | |
| Risk of bias | ||
| Bias | Authors' judgement | Support for judgement |
| Allocation concealment? | Unclear risk | B ‐ Unclear |
Neutel 2002.
| Methods | 14‐21 day single‐blind placebo run‐in; inclusion criteria= mean sitting DBP 100‐115 mm Hg after run‐in; 8‐week double‐blind treatment | |
| Participants | Olmesartan 5 mg once daily: n=45(30 males, 15 females); mean age=56 years; baseline sitting SBP=151 mm Hg, DBP=96 mm Hg; Olmesartan 20 mg once daily: n=45(31 males, 14 females); mean age=52 years; baseline 24h SBP=149 mm Hg, DBP=96 mm Hg; Olmesartan 80 mg once daily: n=48(32 males, 16 females); mean age=52 years; baseline 24h SBP=148 mm Hg, DBP=95 mm Hg; Olmesartan 2.5 mg twice daily: n=50(34 males, 16 females); mean age=53 years; baseline 24h SBP=148 mm Hg, DBP=94 mm Hg; Olmesartan 10 mg twice daily: n=48(29 males, 19 females); mean age=53 years; baseline 24h SBP=148 mm Hg, DBP=95 mm Hg; Olmesartan 40 mg twice daily: n=50(34 males, 16 females); mean age=56 years; baseline 24h SBP=151 mm Hg, DBP=95 mm Hg; Placebo: n=48(29 males, 19 females); mean age=53 years; baseline 24 h SBP=149 mm Hg, DBP=94 mm Hg | |
| Interventions | Olmesartan 5 mg once daily; Olmesartan 20 mg once daily; Olmesartan 80 mg once daily; Olmesartan 2.5 mg twice daily; Olmesartan 10 mg twice daily; Olmesartan 40 mg twice daily; Placebo; once daily dosing: active drug given in the morning and matched placebo for the evening dose; twice daily dosing: first dose taken with breakfast and second dose approximately 12 h later | |
| Outcomes | Mean change from baseline in trough sitting SBP/DBP; WDAE | |
| Notes | SBP change reported for olmesartan groups, SBP change not reported for placebo group, SBP SD of change not reported for all groups, DBP change reported for all groups, DBP SD of change not reported for all groups, endpoint BP and SD not reported, baseline SD not reported; imputed overall trial mean SBP/DBP SD of change; BP data from Figure 3, p. 327; BP measurement device not reported; Jadad score=3; funding source= Sankyo Pharma | |
| Risk of bias | ||
| Bias | Authors' judgement | Support for judgement |
| Allocation concealment? | Unclear risk | B ‐ Unclear |
Oparil 1996.
| Methods | 2‐week washout; 2‐ to 4‐week single‐blind placebo run‐in; inclusion criteria= mean sitting DBP 95‐115 mm Hg after run‐in; 8‐week double‐blind treatment | |
| Participants | Valsartan 20 mg: n=140(93 males,47 females); mean age=53.8 years; baseline sitting SBP=151.6 mm Hg, DBP=100.8 mm Hg; Valsartan 80 mg: n=150(88 males,62 females); mean age=53.6 years; baseline sitting SBP=152.1 mm Hg, DBP=100.9 mm Hg; Valsartan 160 mg: n=148(94 males,54 females); mean age=52.0 years; baseline sitting SBP=149.9 mm Hg, DBP=101.4 mm Hg; Valsartan 320 mg: n=150(95 males,55 females); mean age=53.7 years; baseline sitting SBP=151.0 mm Hg, DBP=101.3 mm Hg; Placebo: n=148(98 males,50 females); mean age=53.6 years; baseline sitting SBP=152.4 mm Hg, DBP=100.8 mm Hg | |
| Interventions | Valsartan 20 mg once daily; Valsartan 80 mg once daily; Valsartan 160 mg once daily; Valsartan 320 mg once daily; Placebo; taken in the morning | |
| Outcomes | Least squares mean change from baseline in trough sitting SBP/DBP using mercury sphygmomanometer; WDAE | |
| Notes | BP change reported, SD of change not reported, endpoint BP and SD not reported, baseline SD not reported; imputed overall trial mean SBP/DBP SD of change; BP data from text, p. 801; Jadad score=4; funding source= Ciba‐Geigy | |
| Risk of bias | ||
| Bias | Authors' judgement | Support for judgement |
| Allocation concealment? | Unclear risk | B ‐ Unclear |
Oparil 1999.
| Methods | 4‐ to 5‐week single‐blind placebo run‐in during which previous antihypertensive medication withdrawn; patients qualified for 3‐ to 4‐week enalapril challenge period if sitting DBP 95‐114 mm Hg and difference between their average sitting DBP values for last 2 visits of placebo run‐in period did not exceed 12 mm Hg; during enalapril challenge patients received enalapril 20 mg daily (10 mg for first 3 days); patients who developed persistent, nonproductive cough while receiving enalapril were then given placebo for 2‐ to 4‐weeks to allow cough to clear; eligible patients (those meeting inclusion criteria for enalapril challenge and whose cough subsequently cleared during placebo washout period) then entered 6‐week double‐blind treatment | |
| Participants | Eprosartan: n=46(27 males,19 females); baseline sitting SBP=153.1(14.9) mm Hg, DBP=101.5(4.1) mm Hg, HR=75.9(7.5) bpm; Placebo:n=45(21 males,24 females); baseline sitting SBP=154.1(14.1) mm Hg, DBP=99.8(4.0) mm Hg, HR=74.4(8.1) bpm | |
| Interventions | Eprosartan 300 mg twice daily (200 mg for first 3 days); Placebo | |
| Outcomes | Mean change from baseline in sitting DBP; WDAE | |
| Notes | BP change and SD of change reported, endpoint BP and SD not reported, DBP data from text, p. 8 and Figure 3, p. 10; time of BP measurement not reported; BP measurement device not reported; Jadad Score=4; funding source= SmithKline Beecham Pharma | |
| Risk of bias | ||
| Bias | Authors' judgement | Support for judgement |
| Allocation concealment? | Unclear risk | B ‐ Unclear |
Patterson 2003.
| Methods | 7‐ to 28‐day washout; 2‐week single‐blind placebo run‐in; inclusion criteria= mean sitting DBP 95‐114 mm Hg and mean sitting SBP </= 190 mm Hg after run‐in; 4‐week double‐blind treatment | |
| Participants | KT3‐671 40 mg: ITT n=65(39 males,26 females); mean age=55 years; baseline BP for ITT not reported; Per protocol n=50; baseline sitting SBP=162.1(13.6) mm Hg, DBP=102.4(4.8) mm Hg; KT3‐671 80 mg: ITT n=58(42 males,16 females); mean age=53 years; baseline BP for ITT not reported; Per protocol n=51; baseline sitting SBP=not reported, DBP=101.5(4.7) mm Hg; KT3‐671 160 mg: ITT n=60(42 males,18 females); mean age=52 years; baseline BP for ITT not reported; Per protocol n=48; baseline sitting SBP=not reported, DBP=102.2(4.8) mm Hg; Placebo: ITT n=61(35 males,26 females); mean age=54 years; baseline BP for ITT not reported; Per protocol n=48; baseline sitting SBP= 158.2(11.8) mm Hg, DBP=101.4(4.3) mm Hg | |
| Interventions | KT3‐671 40 mg once daily; KT3‐671 80 mg once daily; KT3‐671 160 mg once daily; Placebo | |
| Outcomes | Mean change from baseline in trough sitting SBP/DBP using automatic BP measuring device (Omron HEM 705CP); WDAE | |
| Notes | BP and SD of change reported (for per protocol population only), endpoint BP and SD not reported; BP data from Table 2, p. 516; Jadad score=3; funding source= Kotobuki Pharma | |
| Risk of bias | ||
| Bias | Authors' judgement | Support for judgement |
| Allocation concealment? | Unclear risk | B ‐ Unclear |
Pool 1998 (study 1).
| Methods | 4‐ to 5‐week placebo run‐in; inclusion criteria= mean sitting DBP 95‐110 mm Hg on days 22 and 29 (± 3 days) and, if necessary, day 36 (± 3 days) of run‐in; the two measurements could not differ by > 8 mm Hg; 8‐week double‐blind treatment | |
| Participants | All patients: n=570(382 males,188 females); mean age=54.2(10.3) years; baseline sitting SBP=152.9(14.4) mm Hg, DBP=101.0(4.3) mm Hg | |
| Interventions | Irbesartan 50 mg once daily; Irbesartan 100 mg once daily; Placebo; taken in the morning | |
| Outcomes | Mean change from baseline in trough sitting SBP/DBP using mercury sphygmomanometer; Mean change from baseline in peak sitting SBP/DBP using mercury sphygmomanometer; WDAE | |
| Notes | BP change and SE of change reported, endpoint BP and SD not reported, baseline SD reported; calculated SD from N and SE; BP data from Table 2, p. 465; Jadad score=4; funding source= Bristol‐Myers Squibb | |
| Risk of bias | ||
| Bias | Authors' judgement | Support for judgement |
| Allocation concealment? | Unclear risk | B ‐ Unclear |
Pool 1998 (study 2).
| Methods | 4‐ to 5‐week placebo run‐in; inclusion criteria= mean sitting DBP 95‐110 mm Hg on days 22 and 29 (± 3 days) and, if necessary, day 36 (± 3 days) of run‐in; the two measurements could not differ by > 8 mm Hg; 8‐week double‐blind treatment | |
| Participants | All patients: n=319(220 males,99 females); mean age=52.8(10.2) years; baseline sitting SBP=149.8(13.6) mm Hg, DBP=100.7(4.2) mm Hg | |
| Interventions | Irbesartan 100 mg once daily; Irbesartan 200 mg once daily; Irbesartan 300 mg once daily; Placebo; taken in the morning | |
| Outcomes | Mean change from baseline in trough sitting SBP/DBP using mercury sphygmomanometer; Mean change from baseline in peak sitting SBP/DBP using mercury sphygmomanometer; WDAE | |
| Notes | BP change and SE of change reported, endpoint BP and SD not reported, baseline SD reported; calculated SD from N and SE; BP data from Table 2, p. 465; Jadad score=4; funding source= Bristol‐Myers Squibb | |
| Risk of bias | ||
| Bias | Authors' judgement | Support for judgement |
| Allocation concealment? | Unclear risk | B ‐ Unclear |
Pool 1999.
| Methods | 4‐week placebo run‐in; inclusion criteria= mean supine DBP 95‐115 mm Hg after run‐in; 4‐week double‐blind treatment | |
| Participants | Valsartan 10 mg: n=25(19 males,6 females); mean age=54.3(10.1) years: baseline supine SBP=157.3(13.8) mm Hg, DBP=102.6(5.8) mm Hg; Valsartan 40 mg: n=25(17 males,8 females); mean age=52.4(9.3) years; baseline supine SBP=150.7(13.5) mm Hg, DBP=101.8(5.3) mm Hg; Valsartan 80 mg: n=23(19 males,4 females); mean age=52.3(12.9) years; baseline supine SBP=152.7(13.4) mm Hg, DBP=100.7(5.0) mm Hg; Valsartan 160 mg: n=24(12 males,12 females); mean age=52.2(10.2) years; baseline supine SBP=155.1(15.7) mm Hg, DBP=101.0(5.2) mm Hg; Placebo: n=25(12 males,13 females); mean age=53.0(9.3) years; baseline supine SBP=156.4(17.6) mm Hg, DBP=101.7(4.9) mm Hg | |
| Interventions | Valsartan 10 mg once daily; Valsartan 40 mg once daily; Valsartan 80 mg once daily; Valsartan 160 mg once daily; Placebo; taken in the morning | |
| Outcomes | Adjusted mean change from baseline in trough supine SBP/DBP using mercury sphygmomanometer | |
| Notes | BP change and SD of change not reported, endpoint BP and SD not reported, baseline SD reported; imputed baseline SBP SD for SBP SD of change, imputed overall trial mean DBP SD of change; BP data from text, p. 277 and p. 279; Jadad score=4; funding source= Novartis | |
| Risk of bias | ||
| Bias | Authors' judgement | Support for judgement |
| Allocation concealment? | Unclear risk | B ‐ Unclear |
Punzi 2004.
| Methods | 3‐ to 5‐week placebo run‐in; inclusion criteria= patients with isolated systolic hypertension, defined as mean sitting SBP =/> 160 mm Hg and mean sitting DBP < 90 mm Hg at 3 consecutive run‐in visits; 13‐week total double‐blind treatment, 6‐week titration phase (week 0‐6), 3‐week monotherapy maintenance phase, and 4‐week combination therapy phase; patients initially received eprosartan 600 mg or matched placebo once daily, non‐responders titrated to eprosartan 1200 mg after 3 weeks. | |
| Participants | Eprosartan 600 mg: n=148(67 males,81 females); mean age=69.8(7.3) years; baseline sitting SBP=171(9.7) mm Hg, DBP=83.4(4.9) mm Hg, HR=73.0(7.3) bpm; Placebo: n=135(60 males,75 females); mean age=70.4(7.0) years; baseline sitting SBP=170(9.3) mm Hg, DBP=82.7(5.8) mm Hg, HR=74.2(8.1) bpm | |
| Interventions | Eprosartan 600 mg once daily; Placebo; taken in the morning | |
| Outcomes | Mean change from baseline in trough sitting SBP using mercury sphygmomanometer | |
| Notes | Used week 3 SBP data only; BP change reported, SE of change reported, endpoint BP and SD not reported, baseline SD reported but not appropriate; calculated SD from SE and N, SBP data from Figure 2, p. 658; Jadad score=4; funding source= SmithKlineBeecham | |
| Risk of bias | ||
| Bias | Authors' judgement | Support for judgement |
| Allocation concealment? | Unclear risk | B ‐ Unclear |
Reif 1998.
| Methods | 4‐ to 5‐week single‐blind placebo run‐in; inclusion criteria= mean sitting DBP 95‐114 mm Hg on 2 sequential clinic visits during placebo run‐in; 8‐week double‐blind treatment | |
| Participants | Candesartan 2 mg: n=59(29 males,30 females); mean age=54(10) years; baseline sitting SBP=152(12) mm Hg, DBP=99(4) mm Hg; Candesartan 4 mg: n=63(44 males,19 females); mean age=55(11) years; baseline sitting SBP=152(17) mm Hg, DBP=100(5) mm Hg; Candesartan 8 mg: n=60(34 males,26 females); mean age=55(11) years; baseline sitting SBP=154(17) mm Hg, DBP=101(6) mm Hg; Candesartan 16 mg: n=60(38 males,22 females); mean age=55(11) years; baseline sitting SBP=153(18) mm Hg, DBP=100(5) mm Hg; Candesartan 32 mg: n=59(41 males,18 females); mean age=55(12) years; baseline sitting SBP=152(17) mm Hg, DBP=100(5) mm Hg; Placebo: n=64(46 males,18 females); mean age=55(12) years; baseline sitting SBP=154(13) mm Hg, DBP=101(5) mm Hg | |
| Interventions | Candesartan 2 mg once daily; Candesartan 4 mg once daily; Candesartan 8 mg once daily; Candesartan 16 mg once daily; Candesartan 32 mg once daily; Placebo; taken in the morning | |
| Outcomes | Least squares mean change from baseline in trough sitting SBP/DBP using mercury sphygmomanometer; WDAE | |
| Notes | BP change and 95% CI of change reported, endpoint BP and SD not reported, baseline SD reported; calculated SD of change from 95% CI of change; BP data from Table II, p. 962; Jadad score=3; funding source= Astra Merck Inc. | |
| Risk of bias | ||
| Bias | Authors' judgement | Support for judgement |
| Allocation concealment? | Unclear risk | B ‐ Unclear |
Schoenberger 1995.
| Methods | 4‐week placebo phase; inclusion criteria= sitting DBP 95‐115 mm Hg after 4 weeks with less than 7 mm Hg variation from sitting DBP reading at week 2; 12‐week double‐blind treatment | |
| Participants | Losartan 50 mg: n=139(90 males,49 females); median age=55 years; baseline sitting DBP=100.9 mm Hg; Placebo: n=140(81 males,59 females); median age=54 years; baseline sitting DBP=101.3 mm Hg | |
| Interventions | Losartan 50 mg once daily; Placebo | |
| Outcomes | Mean change from baseline in trough sitting SBP/DBP; WDAE | |
| Notes | BP change and SD of change reported, endpoint BP reported; endpoint SD reported, BP data from Tables 2 and 3, p. S45; BP measurement device not reported; Jadad score=3; funding source= Merck | |
| Risk of bias | ||
| Bias | Authors' judgement | Support for judgement |
| Allocation concealment? | Unclear risk | B ‐ Unclear |
Smith 1998.
| Methods | 2‐ to 3‐week screening/washout period; 4‐week single‐blind placebo run‐in; inclusion criteria= supine DBP 95‐114 mm Hg; 12‐week double‐blind treatment | |
| Participants | Telmisartan 40 mg: n=72(50 males,22 females); mean age=54.6(12.0) years; baseline supine SBP=155.2(14.3) mm Hg, DBP=100.8(4.3) mm Hg; Telmisartan 80 mg: n=72(41 males,31 females); mean age=54.4(10.4) years; baseline supine SBP=153.7(13.0) mm Hg, DBP=100.0(3.6) mm Hg; Telmisartan 120 mg: n=73(48 males,25 females); mean age=53.2(11.0) years; baseline supine SBP=151.9(10.4) mm Hg, DBP=100.2(4.0) mm Hg; Telmisartan 160 mg: n=75(51 males,24 females); mean age=53.4(10.5) years; baseline supine SBP=154.2(14.6) mm Hg, DBP=100.5(4.9) mm Hg; Placebo: n=76(49 males,27 females); mean age=55.6(9.6) years; baseline supine SBP=154.8(11.8) mm Hg, DBP=100.4(4.5) mm Hg | |
| Interventions | Telmisartan 40 mg once daily; Telmisartan 80 mg once daily; Telmisartan 120 mg once daily; Telmisartan 160 mg once daily; Placebo | |
| Outcomes | Mean change from baseline in trough supine SBP/DBP using mercury sphygmomanometer; WDAE | |
| Notes | BP change and SE of change reported; endpoint BP and SD not reported; calculated SD of change from N and SE of change; change in BP data from Figures 1 and 2, p. 235; SE of change data from Table 2, p. 234; Jadad score=3; funding source= Boehringer Ingelheim Pharma | |
| Risk of bias | ||
| Bias | Authors' judgement | Support for judgement |
| Allocation concealment? | Unclear risk | B ‐ Unclear |
Smith 2000.
| Methods | Minimum 7‐day washout; 4‐week single‐blind placebo run‐in; inclusion criteria= supine DBP 100‐114 mm Hg during final 2 weeks of run‐in, mean supine DBP could not vary by more than 7 mm Hg between weeks 2 and 3 or weeks 3 and 4 of run‐in or by more than 10 mm Hg between weeks 2 and 4 of run‐in; 4‐week double‐blind treatment | |
| Participants | Telmisartan 40 mg: n=40(23 males,17 females); mean age=54.3 years; baseline supine SBP=154.6 mm Hg, DBP=102.4 mm Hg, HR=71.8 bpm; Telmisartan 80 mg: n=41(26 males,15 females); mean age=50.6 years; baseline supine SBP=154.2 mm Hg, DBP=103.1 mm Hg, HR=72.0 bpm; Telmisartan 120 mg: n=41(25 males,16 females); mean age=52.0 years; baseline supine SBP=153.9 mm Hg, DBP=102.0 mm Hg, HR=72.0 bpm; Placebo: n=43(24 males,19 females); mean age=52.0 years; baseline supine SBP=159.5 mm Hg, DBP=104.9 mm Hg, HR=72.5 bpm | |
| Interventions | Telmisartan 40 mg once daily; Telmisartan 80 mg once daily; Telmisartan 120 mg once daily; Placebo; taken with water (120 ml) between 6 AM and 9 AM and at least 1 h before breakfast | |
| Outcomes | Mean change from baseline in trough standing SBP/DBP using mercury sphygmomanometer; Mean change from baseline in trough supine SBP/DBP using mercury sphygmomanometer; Mean change from baseline in trough standing HR; Mean change from baseline in trough supine HR; WDAE | |
| Notes | BP change and SE of change reported; endpoint BP and SD not reported; calculated SD of change from N and SE of change; change in BP data from Table II, p. 1385; Jadad score=4; funding source= Boehringer Ingelheim Pharma | |
| Risk of bias | ||
| Bias | Authors' judgement | Support for judgement |
| Allocation concealment? | Unclear risk | B ‐ Unclear |
Weber 1995.
| Methods | 4‐week single‐blind placebo phase; inclusion criteria= sitting DBP 95‐115 mm Hg after run‐in; 4‐week double‐blind treatment | |
| Participants | All patients: 122(83 males,39 females); mean age=53(11) years; baseline BP for all randomized patients not reported; Losartan 50 mg once daily: n=29; Losartan 100 mg once daily: n=30; Losartan 50 mg twice daily: n=31; Placebo: n=32 | |
| Interventions | Losartan 50 mg once daily; Losartan 100 mg once daily; Losartan 50 mg twice daily; Placebo; administered between 7:30 AM and 10 AM and in the evening 12 h later | |
| Outcomes | Mean change from baseline in trough sitting SBP/DBP using mercury sphygmomanometer; WDAE | |
| Notes | BP change and SD of change reported, endpoint BP and SD reported; SBP data from Figure 2, p. S32, DBP data from Figure 3, p. S33; Jadad score=4; funding source= Merck | |
| Risk of bias | ||
| Bias | Authors' judgement | Support for judgement |
| Allocation concealment? | Unclear risk | B ‐ Unclear |
White 2001.
| Methods | 2‐ to 4‐week single‐blind placebo run‐in; inclusion criteria= mean sitting DBP 95‐114 mm Hg on 2 consecutive visits with no more than 8 mm Hg difference in DBP between 2 visits; 8‐week double‐blind treatment | |
| Participants | Eprosartan 600 mg: n=59(40 males,19 females); mean age=54(9) years; baseline sitting SBP=152(12) mm Hg, DBP=100(9) mm Hg; Eprosartan 1200 mg: n=63(42 males,21 females); mean age=55(10) years; baseline sitting SBP=154(13) mm Hg, DBP=101(9) mm Hg; Placebo: n=55(39 males,16 females); mean age=54(9) years; baseline sitting SBP=152(20) mm Hg, DBP=100(10) mm Hg | |
| Interventions | Eprosartan 600 mg once daily; Eprosartan 1200 mg once daily; Placebo; taken in the morning | |
| Outcomes | Mean change from baseline in trough sitting SBP/DBP; WDAE | |
| Notes | BP and SE of change reported, endpoint BP and SD not reported; calculated SD of change from N and SE of change; BP data from text, p. 1250; BP measurement device not reported; Jadad score=3; funding source= SmithKline Beecham, Solvay Pharma | |
| Risk of bias | ||
| Bias | Authors' judgement | Support for judgement |
| Allocation concealment? | Unclear risk | B ‐ Unclear |
White 2002.
| Methods | 1‐ to 2‐week wash‐out period for patients who were currently receiving antihypertensive therapy; 2‐ to 4‐week single‐blind placebo run‐in; inclusion criteria= sitting DBP 95‐115 mm Hg during 2 consecutive weeks of run‐in; also required that ambulatory awake DBP >/= 85 mm Hg; 8‐week total double‐blind treatment, 4‐week low‐dose treatment (week 0‐4), forced titration at week 4 to high‐dose, 4‐week high‐dose treatment (week 4‐8) | |
| Participants | Losartan 50 mg: n=103(64 males,39 females); mean age=55(10) years; baseline SBP=148(14) mm Hg, DBP=95(7) mm Hg, HR=72(9) bpm; Placebo: n=46(30 males,16 females); mean age=56(11) years; baseline SBP=148(12) mm Hg, DBP=95(6) mm Hg, HR=71(9) bpm | |
| Interventions | Losartan 50 mg once daily; Placebo; administered in the morning | |
| Outcomes | Mean change from baseline in trough sitting SBP/DBP using mercury sphygmomanometer; WDAE | |
| Notes | Used week BP data only; BP change and SD of change reported; BP data from Table IV, p. 663; Jadad score=3; funding source= not reported | |
| Risk of bias | ||
| Bias | Authors' judgement | Support for judgement |
| Allocation concealment? | Unclear risk | B ‐ Unclear |
BP=blood pressure, DBP=diastolic blood pressure; SBP=systolic blood pressure; SD=standard deviation; WDAE=withdrawal due to adverse effects; ITT=intention‐to‐treat; bpm=beats per minute
Characteristics of excluded studies [ordered by study ID]
| Study | Reason for exclusion |
|---|---|
| ABC 2000 | Parallel group trial in black patients with 12‐week treatment period, titration in non‐responders every 4 weeks. Pre‐titration data not reported (candesartan 16 mg/day vs. placebo). |
| Asmar 2000 | Parallel group trial with 8‐week treatment period, forced titration at 4 weeks. BP data for placebo group not reported at 4 weeks (candesartan 8 mg/day vs. placebo). |
| Asmar 2001 | Crossover trial with no pre‐crossover data reported for first 4 weeks of treatment (telmisartan 40 mg/day vs. placebo). |
| Bakris 2002 | Parallel group trial with 8‐week treatment period, forced titration at 4 weeks. Pre‐titration data not reported (losartan 50 mg/day vs. enalapril 10 mg/day vs. placebo). |
| Fagard 2001 | Crossover trial with no pre‐crossover data reported for first 6 weeks of treatment (losartan 50 mg/day vs. enalapril 20 mg/day vs. placebo). |
| Fridman 1999 | Crossover trial with no pre‐crossover data reported for first 6 weeks of treatment (candesartan 16 mg/day vs. placebo). |
| Hedner 1999a | Parallel group trial with 13‐week treatment period, including 9‐week dose titration phase followed by 4‐week maintenance phase. Pre‐titration data not reported (eprosartan 400 mg once daily vs. eprosartan 200 mg twice daily vs. placebo). |
| Koh 2004 | Parallel group trial with 8‐week treatment period. Time and position of BP measurement not reported. BP measurement device also not reported. (losartan 100 mg/day vs. irbesartan 300 mg/day vs. candesartan 16 mg/day vs. placebo). |
| Lacourciere 1998a | Parallel group trial with 12‐week treatment period, titration in non‐responders every 4 weeks. Pre‐titration data not reported (telmisartan 40 mg/day vs. placebo). |
| Lacourciere 1999 | Parallel group trial with 8‐week treatment period. BP data for placebo group not reported (telmisartan 80 mg/day vs. lisinopril 20 mg/day vs. placebo). |
| Marino 1999 | Parallel group trial with 4‐week treatment period. BP data reported as 24 h area under curve (irbesartan 300 mg/day vs. placebo). |
| McInnes 1997 | Parallel group trial with 12‐week treatment period, titration in non‐responders at 6 weeks. Pre‐titration data not reported (candesartan 8 mg/day vs. placebo). |
| Neutel 1997 | Parallel group trial with 8‐week treatment period. Only ambulatory BP monitoring data reported (valsartan 20, 80, 160, 320 mg/day vs. placebo). |
| Neutel 2000 | Parallel group trial with 8‐week treatment period, titration in non‐responders at 4 weeks. Pre‐titration data not reported (valsartan 80 mg/day vs. placebo). |
| Petrov 2001 | Crossover trial with no pre‐crossover data reported for first 6 weeks of treatment (losartan 50 mg/day vs. enalapril 20 mg/day vs. placebo). |
| Zanchetti 2001 | Parallel group trial with 8‐week treatment period, titration in non‐responders at 4 weeks. Pre‐titration data not reported (candesartan 4 mg/day vs. enalapril 10 mg/day vs. placebo). |
| Zuschke 1999 | Parallel group trial with 8‐week treatment period, forced titration at 4 weeks. Pre‐titration data not reported (candesartan 16 mg once daily vs. candesartan 8 mg twice daily vs. placebo). |
Contributions of authors
Dr. James M. Wright conceived, designed and secured funding for the review, assisted with the analysis and interpretation of data, as well as provided a clinical perspective.
Dr. Balraj S. Heran designed the search strategy, undertook the search, screened search results, collected data for the review, screened retrieved papers against eligibility criteria, appraised quality of papers, extracted data from papers, wrote to authors of papers for additional information, entered data into RevMan, analyzed and interpreted data, and wrote the review.
Dr. Michelle Wong and Inderjit K. Heran screened retrieved papers against eligibility criteria, appraised quality of papers and extracted data from papers.
Sources of support
Internal sources
Department of Anesthesiology, Pharmacology & Therapeutics, University of British Columbia, Canada.
External sources
Canadian Institutes of Health Research (CIHR), Canada.
Declarations of interest
No conflicts of interest declared.
Edited (no change to conclusions)
References
References to studies included in this review
Andersson 1998 {published data only}
- Andersson OK, Neldam S. The antihypertensive effect and tolerability of candesartan cilexitil, a new generation angiotensin II antagonist, in comparison with losartan. Blood Pressure 1998;7(1):53‐9. [DOI] [PubMed] [Google Scholar]
Benetos 2000 {published data only}
- Benetos A, Gautier S, Lafleche A, Topouchian J, Frangin G, Girerd X, Sissmann J, Safar ME. Blockade of angiotensin II type 1 receptors: Effect on carotid and radial artery structure and function in hypertensive humans. Journal of Vascular Research 2000;37(1):8‐15. [DOI] [PubMed] [Google Scholar]
Benz 1998 {published data only}
- Benz JR, Black HR, Graff A, Reed A, Fitzsimmons S, Shi Y. Valsartan and hydrochlorothiazide in patients with essential hypertension. A multiple dose, double‐blind, placebo controlled trial comparing combination therapy with monotherapy. Journal of Human Hypertension 1998;12(12):861‐6. [DOI] [PubMed] [Google Scholar]
Black 1997 {published data only}
- Black HR, Graff A, Shute D, Stoltz R, Ruff D, Levine J, Shi Y, Mallows S. Valsartan, a new angiotensin II antagonist for the treatment of essential hypertension: efficacy, tolerability and safety compared to an angiotensin‐converting enzyme inhibitor, lisinopril. Journal of Human Hypertension 1997;11(8):483‐9. [DOI] [PubMed] [Google Scholar]
Chrysant 2003 {published data only}
- Chrysant SG, Marbury TC, Robinson TD. Antihypertensive efficacy and safety of olmesartan medoxomil compared with amlodipine for mild‐to‐moderate hypertension. Journal of Human Hypertension 2003;17(6):425‐32. [DOI] [PubMed] [Google Scholar]
Chrysant 2004 {published data only}
- Chrysant SG, Weber MA, Wang AC, Hinman DJ. Evaluation of antihypertensive therapy with the combination of olmesartan medoxomil and hydrochlorothiazide. American Journal of Hypertension 2004;17(3):252‐9. [DOI] [PubMed] [Google Scholar]
Cushman 2002 {published data only}
- Cushman WC, Brady WE, Gazdick LP, Zeldin RK. The effect of a losartan‐based treatment regimen on isolated systolic hypertension. Journal of Clinical Hypertension 2002;4(2):101‐7. [DOI] [PMC free article] [PubMed] [Google Scholar]
Farsang 2001 {published data only}
- Farsang C, Kawecka‐Jaszcz K, Langan J, Maritz F, Zannad F. Antihypertensive effects and tolerability of candesartan cilexitil alone and in combination with amlodipine. Clinical Drug Investigation 2001;21(1):17‐23. [Google Scholar]
Feldman 1997 {published data only}
- Feldman R, Chattman MS, Lonigro A, Sievers RJ. Tasosartan in patients with essential hypertension: A randomized, double‐blind, dose‐titration study. Advances in Therapy 1997;14(5):290‐303. [Google Scholar]
Flack 2001 {published data only}
- Flack JM, Saunders E, Gradman A, Kraus WE, Lester M, Pratt H, Alderman M, Green S, Vargas R, Espenshade M, Ceesay P, Alexander J, Goldberg A. Antihypertensive efficacy and safety of losartan alone and in combination with hydrochlorothiazide in adult african americans with mild to moderate hypertension. Clinical Therapeutics 2001;23(8):1193‐208. [DOI] [PubMed] [Google Scholar]
Flack 2003 {published data only}
- Flack JM, Oparil S, Pratt JH, Roniker B, Garthwaite S, Kleiman JH, Yang Y, Krause SL, Workman D, Saunders E. Efficacy and tolerability of eplerenone and losartan in hypertensive black and white patients. Journal of the American College of Cardiology 2003;41(7):1148‐55. [DOI] [PubMed] [Google Scholar]
Fogari 1997 {published data only}
- Fogari R, Ambrosoli S, Corradi L, Esposti ED, Mos L, Nami R, Nicrosini F, Pessina AC, Salvetti A, Vaccarella A, Zanchetti A, Martin A, Reeves RA. 24‐hour blood pressure control by once‐daily administration of irbesartan assessed by ambulatory blood pressure monitoring. Journal of Hypertension 1997;15(12 Pt 1):1511‐8. [DOI] [PubMed] [Google Scholar]
Fogari 2001 {published data only}
- Fogari R, Zoppi A, Malamani G, Marasi G, Pesce RM, Banderali A, Mugellini A. Effects of four angiotensin II‐receptor antagonists on fibrolysis in postemenopausal women with hypertension. Current Therapeutic Research 2001;62(1):68‐78. [Google Scholar]
Gradman 1995 {published data only}
- Gradman AH, Arcuri KE, Goldberg AI, Ikeda LS, Nelson EB, Snavely DB, Sweet CS. A randomized, placebo‐controlled, double‐blind, parallel study of various doses of losartan potassium compared with enalapril maleate in patients with essential hypertension. Hypertension 1995;25(6):1345‐50. [DOI] [PubMed] [Google Scholar]
Gradman 1999 {published data only}
- Gradman AH, Gray J, Maggiacomo F, Punzi H, White WB. Assessment of once‐daily eprosartan, an angiotensin II antagonist, in patients with systemic hypertension. Clinical Therapeutics 1999;21(3):442‐53. [DOI] [PubMed] [Google Scholar]
Gradman 2005 {published data only}
- Gradman AH, Schmieder RE, Lins RL, Nussberger J, Chiang Y, Bedigian MP. Aliskiren, a novel orally effective renin inhibitor, provides dose‐dependent antihypertensive efficacy and placebo‐like tolerability in hypertensive patients. Circulation 2005;111(8):1012‐8. [DOI] [PubMed] [Google Scholar]
Guthrie 1998 {published data only}
- Guthrie R, Saini R, Herman T, Pleskow W, Sprecher D, Collins G. Efficacy and tolerability of irbesartan, an angiotensin II receptor antagonist, in primary hypertension. Clinical Drug Investigation 1998;15(3):217‐27. [Google Scholar]
Hanefeld 2001 {published data only}
- Hanefeld M, Abletshauser C. Effect of the angiotensin II receptor antagonist valsartan on lipid profile and glucose metabolism in patients with hypertension. Journal of International Medical Research 2001;29(4):270‐9. [DOI] [PubMed] [Google Scholar]
Hedner 1999 {published data only}
- Hedner T, Oparil S, Rasmussen K, Rapelli A, Gatlin M, Kobi P, Sullivan J, Oddou‐Stock P. A comparison of the angiotensin II antagonists valsartan and losartan in the treatment of essential hypertension. American Journal of Hypertension 1999;12(4 Pt 1):414‐7. [DOI] [PubMed] [Google Scholar]
Holwerda 1996 {published data only}
- Holwerda NJ, Fogari R, Angeli P, Porcellati C, Hereng C, Oddou‐Stock P, Heath R, Bodin F. Valsartan, a new angiotensin II antagonist for the treatment of essential hypertension: efficacy and safety compared with placebo and enalapril. Journal of Hypertension 1996;14(9):1147‐51. [DOI] [PubMed] [Google Scholar]
Ikeda 1997 {published data only}
- Ikeda LS, Harm SC, Arcuri KE, Goldberg AI, Sweet CS. Comparative antihypertensive effects of losartan 50 mg and losartan 50 mg titrated to 100 mg in patients with essential hypertension. Blood Pressure 1997;6(1):35‐43. [DOI] [PubMed] [Google Scholar]
Kassler‐Taub 1998 {published data only}
- Kassler‐Taub K, Littlejohn T, Elliott W, Ruddy T, Adler E. Comparative efficacy of two angiotensin II receptor antagonists, irbesartan and losartan, in mild‐to‐moderate hypertension. American Journal of Hypertension 1998;11(4 Pt 1):445‐53. [DOI] [PubMed] [Google Scholar]
Klingbeil 2002 {published data only}
- Klingbeil AU, John S, Schneider MP, Jacobi J, Handrock R, Schmieder RE. Effect of AT1 receptor blockade on endothelial function in essential hypertension. American Journal of Hypertension 2003;16(2):123‐8. [DOI] [PubMed] [Google Scholar]
- Klingbeil AU, John S, Schneider MP, Jacobi J, Weidinger G, Schmieder RE. AT1‐receptor blockade improves augmentation index: a double‐blind, randomized, controlled study. Journal of Hypertension 2002;20(12):2423‐8. [DOI] [PubMed] [Google Scholar]
Kochar 1999 {published data only}
- Kochar M, Guthrie R, Triscari J, Kassler‐Taub K, Reeves RA. Matrix study of irbesartan with hydrochlorothiazide in mild‐to‐moderate hypertension. American Journal of Hypertension 1999;12(8 Pt 1):797‐805. [DOI] [PubMed] [Google Scholar]
Lacourciere 1998 {published data only}
- Lacourciere Y, Pool JL, Svetkey L, Gradman AH, Larochelle P, Champlain J, Smith WB. A randomized, double‐blind, placebo‐controlled, parallel‐group, multicenter trial of four doses of tasosartan in patients with essential hypertension. American Journal of Hypertension 1998;11(4 Pt 1):454‐61. [DOI] [PubMed] [Google Scholar]
Mallion 1999 {published data only}
- Mallion JM, Siche JP, Lacourciere Y. ABPM comparison of the antihypertensive profiles of the selective angiotensin II receptor antagonists telmisartan and losartan in patients with mild‐to‐moderate hypertension. Journal of Human Hypertension 1999;13(10):657‐64. [DOI] [PubMed] [Google Scholar]
Manolis 2004 {published data only}
- Manolis AJ, Reid JL, Zeeuw D, Murphy MB, Seewaldt‐Becker E, Koster J. Angiotensin II receptor antagonist telmisartan in isolated systolic hypertension (ARAMIS) study: efficacy and safety of telmisartan 20, 40 or 80 mg versus hydrochlorothiazide 12.5 mg or placebo. Journal of Hypertension 2004;22(5):1033‐7. [DOI] [PubMed] [Google Scholar]
McGill 2001 {published data only}
- McGill JB. Angiotensin II receptor antagonist plus a thiazide diuretic is more efficacious for treating hypertension than either drug alone. Blood Pressure Monitoring 2001;6(Suppl 1):S3‐S13. [Google Scholar]
- McGill JB, Reilly PA. Combination treatment with telmisartan and hydrochlorothiazide in black patients with mild to moderate hypertension. Clinical Cardiology 2001;24(1):66‐72. [DOI] [PMC free article] [PubMed] [Google Scholar]
- McGill JB, Reilly PA. Telmisartan plus hydrochlorothiazide versus telmisartan or hydrochlorothiazide monotherapy in patients with mild to moderate hypertension: A multicenter, randomized, double‐blind, placebo‐controlled, parallel‐group trial. Clinical Therapeutics 2001;23(6):833‐50. [DOI] [PubMed] [Google Scholar]
Meineke 1997 {published data only}
- Meineke I, Feltkamp H, Hogemann A, Gundert‐Remy U. Pharmacokinetics and pharmacodynamics of candesartan after administration of its pro‐drug candesartan cilexitil in patients with mild to moderate essential hypertension ‐ a population analysis. European Journal of Clinical Pharmacology 1997;53(3‐4):221‐8. [DOI] [PubMed] [Google Scholar]
Neutel 1998 {published data only}
- Neutel JM, Smith DHG. Dose response and antihypertensive efficacy of the AT1 receptor antagonist telmisartan in patients with mild to moderate hypertension. Advances in Therapy 1998;15(4):206‐17. [Google Scholar]
Neutel 1999 {published data only}
- Neutel JM, Buckalew v, Chrysant SG, Mroczek WJ, Ruff DA, Weber M. Efficacy and tolerability of tasosartan, a novel angiotensin II receptor blocker: Results from a 10‐week, double‐blind, placebo‐controlled, dose‐titration study. American Heart Journal 1999;137(1):118‐25. [DOI] [PubMed] [Google Scholar]
Neutel 2002 {published data only}
- Neutel JM, Elliott WJ, Izzo JL, Chen CL, Masonson HN. Antihypertensive efficacy of olmesartan medoxomil, a new angiotensin II receptor antagonist, as assessed by ambulatory blood pressure measurements. Journal of Clinical Hypertension 2002;4(5):325‐31. [DOI] [PMC free article] [PubMed] [Google Scholar]
Oparil 1996 {published data only}
- Oparil S, Dyke S, Harris F, Kief J, James D, Hester A, Fitzsimmons S. The efficacy and safety of valsartan compared with placebo in the treatment of patients with essential hypertension. Clinical Therapeutics 1996;18(5):797‐810. [DOI] [PubMed] [Google Scholar]
Oparil 1999 {published data only}
- Oparil S. Eprosartan versus enalapril in hypertensive patients with angiotensin‐converting enzyme inhibitor‐induced cough. Current Therapeutic Research 1999;60(1):1‐14. [Google Scholar]
Patterson 2003 {published data only}
- Patterson D, Webster J, McInnes G, Brady A, MacDonald T. The effects of KT3‐671, a new angiotensin II (AT I) receptor blocker in mild to moderate hypertension. British Journal of Clinical Pharmacology 2003;56(5):513‐9. [DOI] [PMC free article] [PubMed] [Google Scholar]
Pool 1998 (study 1) {published data only}
- Pool JL, Guthrie RM, Littlejohn TW, Raskin P, Shephard AMM, Weber MA, Weir MR, Wilson TW, Wright J, Kassler‐Taub KB, Reeves RA. Dose‐related antihypertensive effects of irbesartan in patients with mild‐to‐moderate hypertension. American Journal of Hypertension 1998;11(4 Pt 1):462‐70. [DOI] [PubMed] [Google Scholar]
Pool 1998 (study 2) {published data only}
- Pool JL, Guthrie RM, Littlejohn TW, Raskin P, Shephard AMM, Weber MA, Weir MR, Wilson TW, Wright J, Kassler‐Taub KB, Reeves RA. Dose‐related antihypertensive effects of irbesartan in patients with mild‐to‐moderate hypertension. American Journal of Hypertension 1998;11(4 Pt 1):462‐70. [DOI] [PubMed] [Google Scholar]
Pool 1999 {published data only}
- Pool JL, Glazer R, Chiang Y‐T, Gatlin M. Dose‐response efficacy of valsartan, a new angiotensin II receptor blocker. Journal of Human Hypertension 1999;13(4):275‐81. [DOI] [PubMed] [Google Scholar]
Punzi 2004 {published data only}
- Punzi HA, Punzi CF. Once‐daily eprosartan mesylate in the treatment of elderly patients with isolated systolic hypertension: data from a 13‐week double‐blind, placebo‐controlled, parallel, multicenter study. Journal of Human Hypertension 2004;18(9):655‐61. [DOI] [PubMed] [Google Scholar]
Reif 1998 {published data only}
- Reif M, White WB, Fagan TC, Oparil S, Flanagan TL, Edwards DT, Cushing DJ, Michelson EL. Effects of candesartan cilexitil in patients with systemic hypertension. American Journal of Cardiology 1998;82(8):961‐5. [DOI] [PubMed] [Google Scholar]
Schoenberger 1995 {published data only}
- Schoenberger JA. Losartan with hydrochlorothiazide in the treatment of hypertension. Journal of Hypertension 1995;13(Suppl 1):S43‐S47. [PubMed] [Google Scholar]
Smith 1998 {published data only}
- Smith DHG, Neutel JM, Morgenstern P. Once‐daily telmisartan compared with enalapril in the treatment of hypertension. Advances in Therapy 1998;15(4):229‐40. [Google Scholar]
Smith 2000 {published data only}
- Smith DHG, Matzek KM, Kempthorne‐Rawson J. Dose response and safety of telmisartan in patients with mild to moderate hypertension. Journal of Clinical Pharmacology 2000;40(12 Pt 1):1380‐90. [PubMed] [Google Scholar]
Weber 1995 {published data only}
- Byyny RL. Antihypertensive efficacy of the angiotensin II AT1‐receptor antagonist losartan: results of a randomized, double‐blind, placebo‐controlled, parallel‐group trial using 24‐hour blood pressure monitoring. Blood Pressure 1996;5(Suppl 2):71‐7. [PubMed] [Google Scholar]
- Byyny RL. Losartan potassium lowers blood pressure measured by ambulatory blood pressure monitoring. Journal of Hypertension 1995;13(Suppl 1):S29‐S33. [DOI] [PubMed] [Google Scholar]
- Weber MA, Byyny RL, Pratt JH, Faison EP, Snavely DB, Goldberg AI, Nelson EB. Blood pressure effects of the angiotensin II receptor blocker, losartan. Archives of Internal Medicine 1995;155(4):405‐11. [PubMed] [Google Scholar]
- Weber MA, Neutel JM, Smith DHG. Controlling blood pressure throughout the day: issues in testing a new anti‐hypertensive agent. Journal of Human Hypertension 1995;9(Suppl 5):S29‐S35. [PubMed] [Google Scholar]
White 2001 {published data only}
- White WB, Anwar YA, Mansoor GA, Sica DA. Evaluation of the 24‐hour blood pressure effects of eprosartan in patients with systemic hypertension. American Journal of Hypertension 2001;14(12):1248‐55. [DOI] [PubMed] [Google Scholar]
White 2002 {published data only}
- White WB, Sica DA, Calhoun D, Mansoor GA, Anders RJ. Preventing increases in early‐morning blood pressure, heart rate, and the rate‐pressure product with controlled onset extended release verapamil at bedtime versus enalapril, losartan, and placebo on arising. American Heart Journal 2002;144(4):657‐65. [DOI] [PubMed] [Google Scholar]
References to studies excluded from this review
ABC 2000 {published data only}
- Association of Black Cardiologists (ABC) Candesartan Study Group. Evaluation of candesartan cilexetil in black patients with systemic hypertension: the ABC trial. Heart Disease 2000;2(6):392‐9. [PubMed] [Google Scholar]
Asmar 2000 {published data only}
- Asmar R, Lacourciere Y. A new approach to assessing antihypertensive therapy: effect of treatment on pulse pressure. Journal of Hypertension 2000;18(11):1683‐90. [DOI] [PubMed] [Google Scholar]
- Lacourciere Y, Asmar R. A comparison of the efficacy and duration of action of candesartan cilexitil and losartan as assessed by clinic and ambulatory blood pressure after a missed dose, in truly hypertensive patients: a placebo‐controlled, forced titration study. American Journal of Hypertension 1999;12(12 Pt 1‐2):1181‐7. [DOI] [PubMed] [Google Scholar]
Asmar 2001 {published data only}
- Asmar R. Effect of telmisartan on arterial distensibility and central blood pressure in patients with mild to moderate hypertension and Type 2 diabetes mellitus. Journal of the Renin‐Angiotensin‐Aldosterone System 2001;2(Suppl 2):S8‐11. [DOI] [PubMed] [Google Scholar]
Bakris 2002 {published data only}
- Bakris G, Sica D, Ram V, Fagan T, Vaitkus PT, Anders RJ, et al. A comparative trial of controlled‐onset, extended‐release verapamil, enalapril, and losartan on blood pressure and heart rate changes. American Journal of Hypertension 2002;15(1 Pt 1):53‐7. [DOI] [PubMed] [Google Scholar]
Fagard 2001 {published data only}
- Fagard R, Lijnen P, Pardaens K, Thijs L, Vinck W. A randomised, placebo‐controlled, double‐blind, crossover study of losartan and enalapril in patients with essential hypertension. Journal of Human Hypertension 2001;15(3):161‐7. [DOI] [PubMed] [Google Scholar]
Fridman 1999 {published data only}
- Fridman K, Wysocki M, Friberg P, Andersson OK. Candesartan cilexetil and renal hemodynamics in hypertensive patients. American Journal of Hypertension 2000;13(9):1045‐8. [DOI] [PubMed] [Google Scholar]
- Fridman KU, Wysocki M, Friberg PR, Andersson OK. Candesartan cilexetil in hypertension: effects of six weeks' treatment on haemodynamics, baroreceptor sensitivity and the renin‐angiotensin‐aldosterone system. Blood Pressure 1999;8(4):242‐7. [DOI] [PubMed] [Google Scholar]
Hedner 1999a {published data only}
- Hedner T, Himmelmann A. The efficacy and tolerance of one or two daily doses of eprosartan in essential hypertension. Journal of Hypertension 1999;17(1):129‐36. [DOI] [PubMed] [Google Scholar]
Koh 2004 {published data only}
- Koh KK, Chung WJ, Ahn JY, Han SH, Kang WC, Seo YH, et al. Angiotensin II type 1 receptor blockers reduce tissue factor activity and plasminogen activator inhibitor type‐1 antigen in hypertensive patients: a randomized, double‐blind, placebo‐controlled study. Atherosclerosis 2004;177(1):155‐60. [DOI] [PubMed] [Google Scholar]
- Koh KK, Han SH, Chung W‐J, Ahn JY, Jin DK, Kim HS, et al. Comparison of effects of losartan, irbesartan, and candesartan on flow‐mediated brachial artery dilation and on inflammatory and thrombolytic markers in patients with systemic hypertension. American Journal of Cardiology 2004;93(11):1432‐5. [DOI] [PubMed] [Google Scholar]
Lacourciere 1998a {published data only}
- Lacourciere Y, Lenis J, Orchard R, Lewanczuk R, Houde M, Pesant Y, et al. A comparison of the efficacies and duration of action of the angiotensin II receptor blockers telemisartan and amlodipine. Blood Pressure Monitoring 1998;3(5):295‐302. [PubMed] [Google Scholar]
Lacourciere 1999 {published data only}
- Lacourciere Y. The incidence of cough:A comparison of lisinopril, placebo and telmisartan, a novel angiotensin II antagonist. International Journal of Clinical Practice 1999;53(2):99‐103. [PubMed] [Google Scholar]
Marino 1999 {published data only}
- Marino MR, Langenbacher KM, Ford NF, Raymond RH, Manning J, Vesterqvist O, et al. Pharmacodynamics and pharmacokinetics of irbesartan in patients with mild to moderate hypertension. Journal of Cardiovascular Pharmacology & Therapeutics 1999;4(2):67‐75. [DOI] [PubMed] [Google Scholar]
McInnes 1997 {published data only}
- McInnes GT, O'Kane KP, Jonker J, Roth J. The efficacy and tolerability of candesartan cilexetil in an elderly hypertensive population. Journal of Human Hypertension 1997;11(Suppl 2):S75‐80. [PubMed] [Google Scholar]
Neutel 1997 {published data only}
- Neutel J, Weber M, Pool J, Smith D, Fitzsimmons S, Chiang YT, et al. Valsartan, a new angiotensin II antagonist: antihypertensive effects over 24 hours. Clinical Therapeutics 1997;19(3):447‐58. [DOI] [PubMed] [Google Scholar]
Neutel 2000 {published data only}
- Neutel JM, Bedigian MP. Efficacy of valsartan in patients aged > or =65 years with systolic hypertension. Clinical Therapeutics 2000;22(8):961‐9. [DOI] [PubMed] [Google Scholar]
Petrov 2001 {published data only}
- Petrov VV, Fagard RH, Lijnen PJ. T‐lymphocyte and plasma angiotensin‐converting enzyme activity during enalapril and losartan administration in humans. Journal of Cardiovascular Pharmacology 2001;38(4):578‐83. [DOI] [PubMed] [Google Scholar]
Zanchetti 2001 {published data only}
- Zanchetti A, Omboni S. Comparison of candesartan versus enalapril in essential hypertension. American Journal of Hypertension 2001;14(2):129‐34. [DOI] [PubMed] [Google Scholar]
Zuschke 1999 {published data only}
- Zuschke CA, Keys I, Munger MA, Carr AA, Marinides GN, Flanagan TL, et al. Candesartan cilexitil: comparison of once‐daily versus twice‐daily administration for systemic hypertension. Clinical Therapeutics 1999;21(3):464‐74. [DOI] [PubMed] [Google Scholar]
Additional references
Bucher 1997
- Bucher HC, Guyatt GH, Griffith LE, Walter D. The results of direct and indirect treatment comparisons in meta‐analysis of randomized controlled trials. Journal of Clinical Epidemiology 1997;50(6):683‐91. [DOI] [PubMed] [Google Scholar]
Cochrane Handbook
- Sterne JAC, Egger M, Moher D (editors). Chapter 10: Addressing reporting biases. In: Higgins JPT, Green S editor(s). Cochrane Handbook for Systematic Reviews of Intervention. The Cochrane Collaboration, 2008. Available from www.cochrane‐handbook.org, Version 5.0.0 (updated February 2008). [Google Scholar]
e‐CPS
- e‐CPS [Internet]. Micardis [product monograph]. Ottawa (ON): Canadian Pharmacists Association. Available from: http://www.e‐cps.ca. Also available in paper copy from the publisher, c2008 [updated 2005 May 4; cited 2008 Feb 29]:[product monograph]. [Google Scholar]
Heran 2002
- Heran BS, Jauca CD, Wright JM. Development of an optimal search strategy for finding trials demonstrating ACE inhibitor blood pressure lowering efficacy. 10th International Cochran Colloquium, Stavenger, Norway 2002.
Jadad 1996
- 88.Jadad AR, Moore RA, Carrol D, et al. Assessing the quality of reports of randomized clinical trials: Is blinding necessary?. Controlled Clinical Trials 1996;17:1‐12. [DOI] [PubMed] [Google Scholar]
Song 2003
- Song F, Altman DG, Glenny AM Deeks JJ. Validity of indirect comparison for estimating efficacy of competing interventions: emperical evidence from published meta‐analyses. British Medical Journal 2003;326:472‐76. [DOI] [PMC free article] [PubMed] [Google Scholar]
WHO‐ICTRP
- World Health Organization. International Clinical Trials Registry Platform (ICTRP). Available from: http://www.who.int/ictrp/en 2006 [cited 2008 Feb 29].