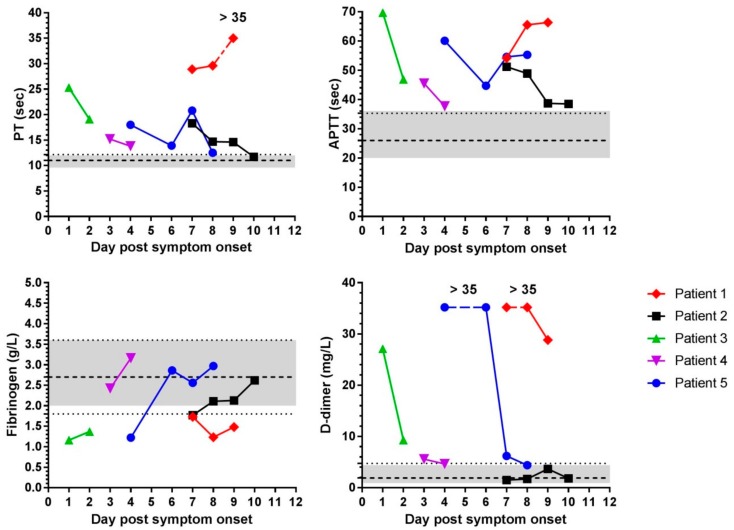
Figure 2.
Changes in haemostasis parameters over time in Ebola virus-infected individuals. Mean values of Prothrombin Time (PT), Activated Partial Thromboplastin Time (APTT) (top row) and fibrinogen, and D-Dimer values (bottom row) from plasma samples collected without centrifugation from five patients are shown. Each time-point was tested in at least duplicate and mean plotted. Each patient is represented by a different colour and symbol and days of sampling post-symptom onset were different for each patient. Grey shaded area indicates the range of values for each test obtained from naïve ‘normal’ human donor samples also collected without centrifugation (Figure 1). Dashed line is the mean value from the un-centrifuged non-infected samples and the dotted line is the value of the un-centrifuged mean + 3 standard deviations (for fibrinogen—3 standard deviations also shown with a second dotted line). If data distribution is approximately normal, then 99.7 % lies within three standard deviations. One PT result and several D-dimer results were out of range and are plotted at the upper limit of the test and indicated as such for each data set.

