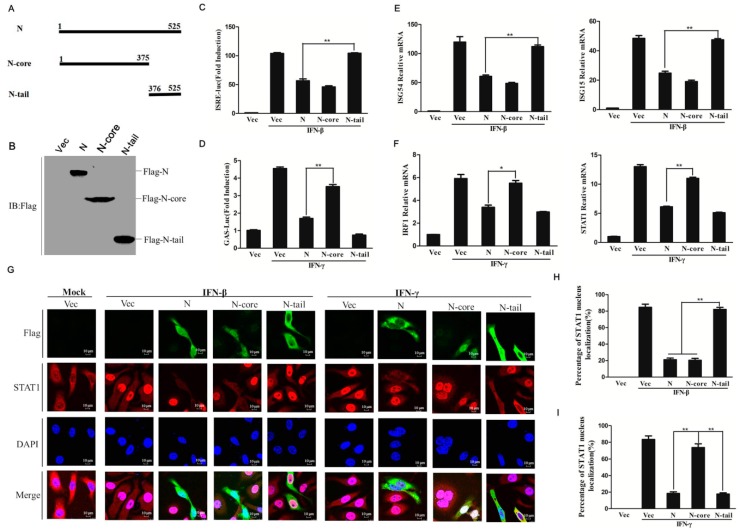
Figure 5.
N-core domain and N-tail domain of PPRV N protein show different antagonistic roles in IFN response inhibition. (A) Schematics of N, N-core, and N-tail. (B) The expression of N-core and N-tail domain in HEK-293T cells were analyzed by immunoblotting. (C and D) HEK-293T cells were co-transfected with ISRE (C) or GAS (D) reporter plasmids together with pRL-TK plasmids, and empty vector, N, N-core or N-tail expressing plasmids. The IFN treatment and luciferase activity detection were performed at 24 h post-transfection as described in Figure 1B. (E and F) HEK-293T cells were transfected with empty vector, N, N-core or N-tail expressing plasmids for 24 h. The cells were then treated with IFN-β (E) or IFN-γ (F) for 12 h. The relative mRNA expression levels of ISG54, ISG15, IRF1, and STAT1 were determined respectively. (G) HeLa cells (5 × 10⁴) were grown in the glass bottom dish. The monolayer cells were transfected with N (2 μg), N-core (2 μg), N-tail domain expressing plasmids (2 μg) or vector plasmids (2 μg), followed by IFN-β (2000 U/mL) or IFN-γ (200 ng/mL) treatment for 30 min. The cells were fixed and permeabilized and incubated with mouse anti-STAT1 antibody and rabbit anti-Flag antibody and appropriate secondary antibodies. The subcellular localization of STAT1 was detected (Red). Confocal images were obtained using laser confocal microscopy under a 60× objective. (H and I) Statistical analysis of STAT1 nuclear translocation in the N-core and N-tail proteins expressing cells. One-hundred cells were counted in the randomly selected visual fields for three times, and the STAT1 nuclear localization ratio was determined.

