Abstract
Positron emission tomography (PET) imaging serves as one of the most competent methods for the diagnosis of various malignancies, such as lung tumor. However, with an elevation in the utilization of PET scan, radiologists are overburdened considerably. Consequently, a new approach of “computer-aided diagnosis” is being contemplated to curtail the heavy workloads. In this article, we propose a multiscale Mask Region–Based Convolutional Neural Network (Mask R-CNN)–based method that uses PET imaging for the detection of lung tumor. First, we produced 3 models of Mask R-CNN for lung tumor candidate detection. These 3 models were generated by fine-tuning the Mask R-CNN using certain training data that consisted of images from 3 different scales. Each of the training data set included 594 slices with lung tumor. These 3 models of Mask R-CNN models were then integrated using weighted voting strategy to diminish the false-positive outcomes. A total of 134 PET slices were employed as test set in this experiment. The precision, recall, and F score values of our proposed method were 0.90, 1, and 0.95, respectively. Experimental results exhibited strong conviction about the effectiveness of this method in detecting lung tumors, along with the capability of identifying a healthy chest pattern and reducing incorrect identification of tumors to a large extent.
Keywords: multiscale, mask R-CNN, ensemble learning, lung tumor, PET
Introduction
Lung tumor is one of the most life-threatening ailment that renders a highly increasing incidence and mortality rate all over the world. Survival and life quality improvement in patients with lung cancer is eminently subjective to early diagnosis and treatment. The 5-year survival of patients with early diagnosis is approximately 54%, while it is only 4% for those who are initially diagnosed at stage 4 cancer.1 Imaging technology is of paramount significance for the evaluation of lung tumors,2 since it can facilitate early diagnosis and treatment for such malignancies by essentially discovering tumors at early stages. Positron emission tomography (PET) is an important 3-dimensional imaging technique for lung tumor detection.3 In addition, as the image scan technique becomes more widely utilized, the number of images required for diagnosis has rapidly increased, thus escalating the work load of radiologists. Consequently, radiologists have been demanding a new approach of diagnosis to lessen their burden called computer-aided diagnosis (CAD or CADx).
Computer-aided diagnosis is a popular research topic in medical imaging and diagnostic radiology. The concept of CAD was first proposed by the University of Chicago in the mid-1980s, in order to provide a computer output as a “second opinion” to assist radiologists in interpreting images. Such a tool reinforces the accuracy and consistency in radiological diagnosis, along with the reduction in image interpretation time4-6 Since then, a large amount of research has been proposed for developing various customized CAD schemes for the detection and classification of numerous abnormalities such as breast diseases,7-11 lung diseases,12-15 and other pathologies in different organs.16-20
In recent years, various computer-aided detection (CADe) methods for lung tumor detection using PET imaging have been developed. A common automatic method revolves around the dynamic definition of threshold values to isolate the lesion.21,22 Ying et al23 proposed a novel approach to enhance the effectiveness of lung tumor detection using PET images. This method processed 3-dimensional images through segmentation, multithreshold creation with volume criterion, and heuristics-based tumor candidate ranking. Gifford et al24 proposed a support vector machine (SVM)-based visual-search algorithm model for tumor detection using PET imaging. Liu et al25 presented a segmentation algorithm for detecting lung cancer via PET images by using pseudo color and context awareness. Kopriva et al26 suggested an advanced method for single-channel blind separation of non-overlapping sources and applied it for the first time, to automatic segmentation of lung tumors in PET images. Feng et al27 developed an iterative threshold method for lung tumor delineation on 18F-FDG (fluorodeoxyglucose—a radiopharmaceutical) PET images that can eliminate the influence of the heart over the imaging. Later, a novel image processing method capable of automatically detecting and ranking tumor candidates in the lungs using full-body PET images was presented by Hao et al.28 Kano15 proposed a distinct detection method which could identify malignant tumors in the lung area of a given FDG-PET/computed tomography (CT) image. This method firstly extracts tumor candidates by binarizing the PET image and then rejects false positives by constructing an “Eigen space” (space generated by the eigen vectors corresponding to the same eigen values). Sawada17 reported a single-class classifier that could distinguish between true malignant tumors and false-positive results.
Several other methods employ both PET and CT imaging for lung tumor detection and diagnosis. Teramoto29 proposed a novel lung tumor detection method which operates with active contour filters to detect the rigorous nodules that were deemed “difficult” in previous CAD schemes. Guo et al30 and Cuiying et al31 proposed to apply SVM in order to train the vector of an image and its features, including heterogeneity, extracted from PET image and CT texture, so as to augment the diagnosis and staging of lung cancer. Punithavathy et al32 proposed an Fuzzy C means clustering-based method that aims at developing a methodology for automatic detection of lung cancer from PET/CT images. In 2015, this research group33 designed an artificial neural network (ANN) to facilitate the detection of lung cancer that combined the textural and fractal features extracted from PET/CT imaging. Wang presented a deep learning method based on backpropagation-ANN to classify non-small cells mediastinal lymph node metastasis of lung cancer using PET/CT imaging.34 Ding et al35 proposed a novel pulmonary nodule detection approach based on deep convolutional neural network.
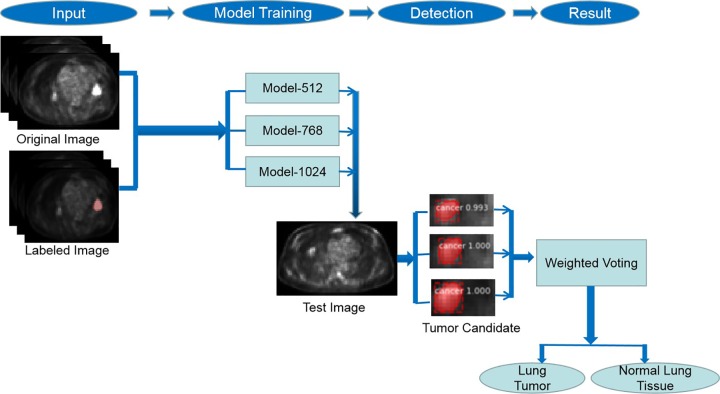
Summarizing, the research on lung tumor detection with PET imaging using deep learning technology is significant but rare. This is because low resolution and oversimplified imaging emanates a large number of false-positive results, irrespective of the admirable sensitivity of PET imaging for lung tumor detection. In this article, we propose a novel deep learning-based method using multiscale Mask Region–Based Convolutional Neural Network (Mask R-CNN) to address the aforementioned issues for detecting lung tumor in PET imaging. In this proposed method, we firstly produced 3 models of Mask R-CNN, which is a state-of-the-art object detection and segmentation model for lung tumor candidate detection. All the 3 models were fine-tuned and trained with certain data sets using images from 3 different scales. Then, these 3 models of Mask R-CNN were integrated using weighted voting strategy to diminish false-positive outcomes. The framework of our method is illustrated in Figure 1.
Figure 1.
Framework of multiscale Mask Region–Based Convolutional Neural Network (Mask R-CNN)-based lung tumor detection approach.
Imaging Characteristics of Lung Tumors in PET Scan
Functional imaging obtained by PET, which depicts the spatial distribution of metabolic or biochemical activities in the body, is vital in determining the diagnosis for a certain tumor. During a PET scan for cancer inspection, tracers such as FDG (a glucose-mimicking radioactive element) are administered intravenously to a patient. The γ-rays emitted from the patient due to the injected radiopharmaceutical are photographed by the nuclear imaging system. The PET images demonstrate the various levels of absorption of these rays (standard uptake value [SUV]) of the FDG throughout the body. We analyzed the different absorption levels of FDG by tissues and lesions, thus distinguishing between the normal and the pathological regions.36
In the undertaken PET scan, the lung tumor area showed a higher SUV than the other tissues of the chest cavity. Employing Wang et al’s research,37 the maximum SUV values of squamous cell carcinoma, small-cell carcinoma, adenocarcinoma, and benign lesions were 12.57 ± 4.34, 10.6 ± 2.90, and 8.19 ± 6.01, respectively, which is evidently higher than the SUVs of normal chest tissues. However, the inflammatory lesions and heart tissues also tend to absorb a higher amount of FDG with an equally higher SUV depiction than the surrounding areas, thus resulting in a false-positive result. This needs to be identified with a true positive by a radiologist or by CAD.
Related Work
Mask R-CNN
Mask R-CNN38—a deep neural network that can deduce instance segmentation and classification—is the latest and the most effective and beneficial in-depth learning model. Mask R-CNN extends faster R-CNN39 by adding a branch for the prediction of segmentation masks on each region of interest (ROI) parallel to the existing branch for classification and bounding box regression. The masked branch is a small fully convolutional network applied to each ROI, predicting a segmentation mask in a pixel-to-pixel manner. The Mask R-CNN comes across as a network that is easy to implement and train due to the Faster R-CNN framework that facilitates a wide range of flexible architectural designs. Additionally, the masked branch only adds a small computational overhead, enabling a faster system and experimentation.
Ensemble Learning
Ensemble learning, as its name implies, enables multiple individual learners to perform deep learning tasks together by combining them. It is often referred to as a “multiclassifier system” or “committee-based learning.” Ensemble learning proposes the idea of amalgamating multiple individual learners with a certain strategy. The combination of multiple learners can aid and guide each other with their own strengths as well as yield better performance together. The combination strategy for individual learners usually includes the following:
Major voting: The weight of each classifier is the same, while the minority is subordinate to the majority and more than half of the votes are obtained as the classification result.
Weighted voting: Each classifier has different weights. Each weak learner multiplies the number of classified votes by a weight, and finally the weighted votes of each class are totaled. The maximum value of the corresponding class or the voting value above a certain threshold value is identified as the final result.
Proposed Approach
Multiscale Mask R-CNNs–Based Lung Tumor Candidate Detection
High sensitivity and low false-positive outcomes are vital parameters for lung tumor candidate detection using CAD. However, due to the ambiguity in PET imaging, excessive false positives become the main barrier in lung tumor detection using PET, even after implementing a deep learning algorithm for feature extraction. To address this problem, we propose a novel method based on multiscale Mask R-CNN, where 3 different scales of Mask R-CNN are used together, which proves lucrative to detect lung tumor candidates from PET images.
Images with 3 different scales were used to produce 3 training data sets: PET images with resolution 512 × 512, 768 × 768, and 1024 × 1024, respectively. All the PET images used in this study were obtained from Changhai Hospital PET/CT Center, and the data were stored in the DICOM format. Every training data set included 594 slices from 62 patients with lung cancer. The test data consisted of 134 slices from 18 cases, in which 74 slices from 8 cases were patients with lung cancer, and 60 slices from 10 cases were healthy ones and is shown in Table 1.
Table 1.
The Number of Training Data and Test Data.
| Date Type | Number of Slices | Number of Patients/Cases |
|---|---|---|
| Training data | 594 | 62 |
| Test data—abnormal | 74 | 8 |
| Test data—normal | 60 | 10 |
| Total | 728 | 80 |
The PET scan system used was Siemens Biograph 64 HD PET-CT, whose supplier is Siemens, Knoxville, Tennessee. Now this machine is located in Changhai Hospital. The image pixels were 168 × 168 and the full-body PET image was of 274 slices. We took the PET slice from 40th to 120th layers that corresponded to the location of the thoracic cavity. The abnormal image data used in this study has been confirmed as lung tumor by pathological examination.
All the training images were labeled using “Labelme” software under the guidance of 2 certified radiologists. “Labelme” is an image-tagging software that was developed by Massachusetts Institute of Technology (MIT; Download Link: http://labelme.csail.mit.edu/Release3.0/). The training set input included the original PET image and the segmented lung tumor masked image. Each training image is marked as 2 parts: lung tumor and background (see Figure 2).
Figure 2.
Examples of training image. (Left is original PET image. Middle is the mask of the lung tumor. Right is the fusion image of original PET and mask of lung tumor). PET indicates positron emission tomography.
To fit the size of lung tumor in the PET image with different resolutions, we set the scale of 5 anchors in each model as follows: 4, 8, 16, 32, and 64 for resolution 512 × 512; 8, 16, 32, 64, and 128 for resolution 768 × 768; and 16, 32, 64,128, and 256 for resolution 1024 × 1024. Batch size was 8; steps per epoch were 50; epoch number was 300 with a learning rate of 0.0001. The network was trained on 2 GPUs (GeForce GTX TITAN X, 12 GB RAM).
Models with different scales could extract features of lung tumor at different scales, which can provide more comprehensive and enhanced information to aid lung tumor detection. In the next step, the lung tumor candidate extracted by the 3 models could be analyzed by ensemble learning for false-positive reduction, finally achieving suitable lung tumor detection.
Ensemble Model–Based False-Positive Reduction
In this step, an ensemble model was proposed to concatenate different scales of Mask R-CNN so that the sequence produced could diminish the false-positive results. This ensemble model consisted of 2 parts: (1) matching and labeling operation and (2) weighted voting.
(1) Matching and labeling operation
Figure 3 shows the diagram of matching and labeling operation. As shown in Figure 3B, in Model-512, recorded as , was used to identify the same mask in Model-768 and Model-1024. If the overlap of and the mask in Model-768 was more than 50%; then both the masks (Model-768 and ) were identified as one and were recorded as . could also be identified using the same criteria. Then, was used to match the unlabeled masks in Model-768 and Model-1024, and and could be derived. All masks in Model-512, Model-768, and Model-1024 could be matched and labeled by analogy. The details of matching and labeling are shown in Figure 3A-D.
Figure 3.
Matching and labeling operation. (A) A test result of Model-512, Model-768, and Model-1024. (B) Masks of Model-512 were achieved by the matching and labeling operation with Model-768 and Model-1024, respectively. (C) Matching and labeling operation was achieved between Model-768 and Model-1024. (D) Unlabeled masks of Model-1024 was achieved by the final labeling operation.
(2) Weighted voting
The second step was the weighted voting process. The confidence of masks generated by Mask R-CNN was regarded as the weight value, and the masks generated by all the 3 models were voted using this confidence value in order to reduce the number of false positives. The confidence of masks with the same label were summarized and reassigned to the mask. The mask is considered as a false-positive result if its final confidence is less than a certain threshold value. The detail of weighted voting is shown in Figure 4.
Figure 4.
The diagram of weighted voting.
As shown in Figure 4, the masks with the same tag “i” were viewed as the mask of the same lung tumor candidate, which is represented as ; represents confidence of . For example, represents the confidence of for Model-512. The values of ,, and are in the range of [0,1], where 0 means that no matching mask has been found in the model. The details of voting operation are given as follows:
If certain threshold,
is true positive,
else is false positive
End
Experimental Results and Analysis
Evaluation Criteria
The F score, precision, and recall parameters were used as the evaluation metric. The F score, precision, and recall can be calculated using the equation:
where the values of TP (number of true positives), FP (number of false positives), and FN (number of false negatives) were computed according to the definitions proposed in previous work.40
Evaluation of Ensemble Mask R-CNN Model
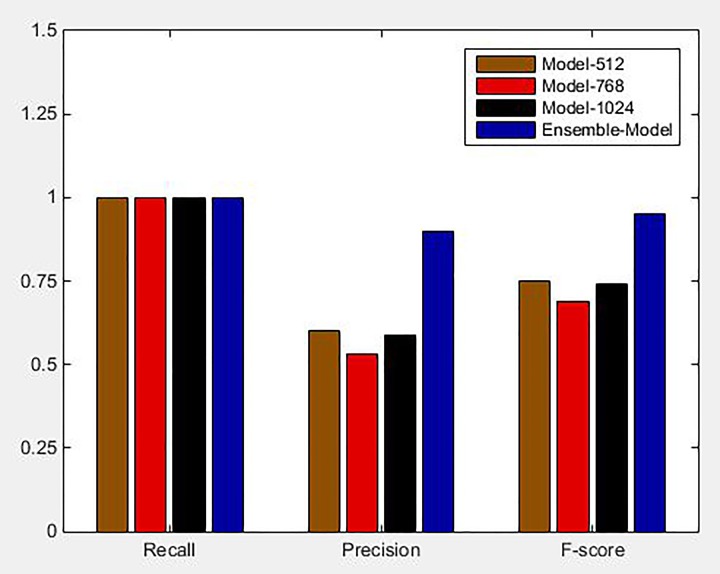
We evaluated the framework of ensemble model by comparing it with the performance of a single model. The value of F score, precision, and recall of 3 single models and ensemble model are shown in Figure 5. Recall of all 3 models was obtained to be 1, which affirmed that every single model was sensitive enough for detecting lung tumor with an effective detection of true positives. Precision value indicated the ratio of true positive numbers to all detected positive values. Precision values of Model-512, Model-768, and Model-1024 were 0.60, 0.53, and 0.59, respectively, which suggested that each single model could still produce several false positives. It can be observed that the ensemble model yielded more accurate and effective results in lung tumor detection. The precision and F score of the ensemble model was 0.90 and 0.95, which was 0.3 and 0.2 higher than that of Model-512, where Model-512 was the best-performing single model. The recall of ensemble model was 1, which is equal to that of the single model. Compared to the single model, the ensemble model extracted more enhanced and comprehensive features and used weighted voting strategy for lung tumor detection, while being more effective and accurate in reducing the false positives.
Figure 5.
Comparative histograms of precision, recall, and F-score between single model and ensemble model.
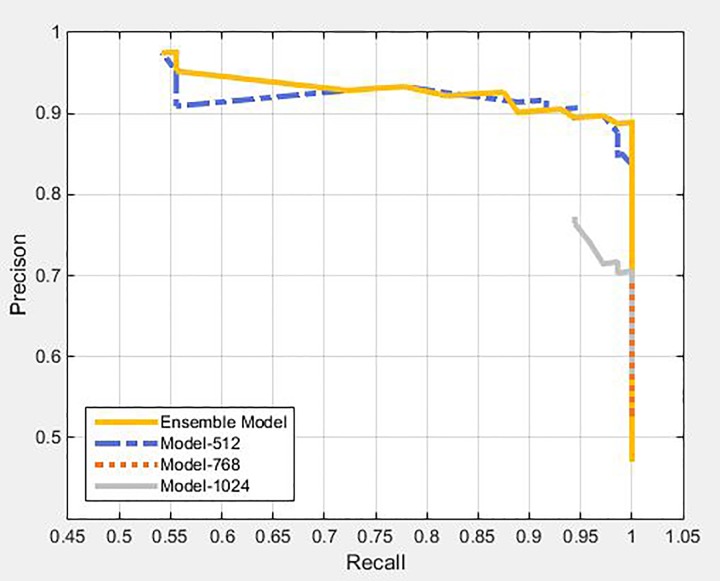
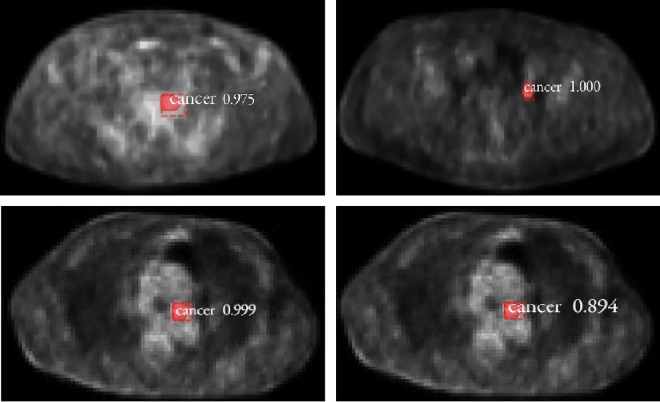
Figure 6 shows the P-R curves of the ensemble model and single models. The more convex the top-right corner of the P-R curve, the better was its corresponding model. From Figure 6, we can observe that the ensemble model combined the advantages of all 3 single models and demonstrated optimum overall performance. In the single model, the tumor candidate extracted from Model-512 exhibited a trend, where the confidence of a true positive was higher than that of a false positive on the whole and this trend showed a decline in Model-768 and Model-1024, in turn. Therefore, in the single model, Model-512 performs best, followed by Model-768 and Model-1024. At the same time, although many false-positive results were produced in each single model, the spatial distribution of false-positive results produced by different models showed staggered distribution as shown in Figure 7. Therefore, the 3 models were integrated and evaluated comprehensively from the perspective of spatial distribution and confidence for tumor candidates, such as to reduce the number of false positives, in order to achieve suitable detection of lung tumor.
Figure 6.
P-R curves for single model and ensemble model.
Figure 7.
Staggered spatial distribution for false positives. Top left image, A false positive was extracted in Model-512 but not in Model-768 and Model-1024. Top right image, A false positive was detected in Model-768 but not in Model-512 and Model-1024. Below left image and below right image, The test results of same slice for Model-768 and Model-1024. It showed that a false positive was detected in Model-768 and Model-1024 respectively but not in Model-512.
Evaluation of Weighted Voting Strategy
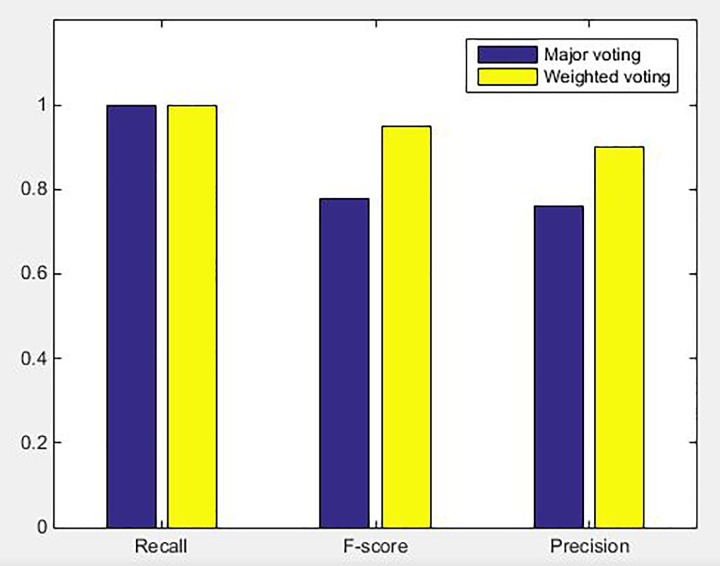
We compared the 2 ensemble strategies: major voting and weighted voting. Major voting did not consider confidence as weight; hence, it used 1 as the weight. If the overlap rate between the 2 masks was more than 50%, the 2 masks were identified as 1 unified mask, and the weights of these masks got superimposed. If the mask obtained 3 votes, it was considered as a positive result, otherwise as a negative result. The comparative diagram of precision, recall, and F score between major voting and weighted voting are shown in Figure 8. The values of precision, recall, and F score obtained by the weighted voting strategy were higher than those of major voting, while the weighted voting method yields better performance. The weighted voting strategy introduced confidence as an important indicator for judging tumor, which made tumor detection more flexible and effective. Therefore, the precision and F score values of the weighted voting strategy were refined in turn. This affirmed that the weighted voting strategy was much more efficacious in the reduction of false positives.
Figure 8.
Comparative histograms of precision, recall, and F score between major voting and weighted voting.
However, there is a limitation to this study. The number of training data set is insufficient. Furthermore, in the future work, we will try to increase the accuracy of this method by further cooperation with hospitals and obtaining sufficient image data for experiments.
Conclusion
In this article, we propose a novel lung tumor detection method based on Mask R-CNN. This method incorporates multiscale models based on Mask R-CNN in order to detect lung tumor candidates from PET axial slices. Weighted voting of ensemble learning was used for the curtailment of false positives. Experimental results demonstrate that the proposed method could effectively and precisely detect lung tumors while suitably avoiding incorrect detection of tumors. Thus, this method could prove highly pivotal in aiding radiologists by acquiring proper interpretation of PET images, and rendering efficient auxiliary diagnostic information, to ensure accuracy and consistency in radiological diagnosis as well as reduction in image interpretation time, ensuring timely and promising diagnosis of patients with such ailments.
Acknowledgment
The authors wish to thank Professor Changjing Zuo for his assistance in understanding and applying PET-CT image.
Footnotes
Declaration of Conflicting Interests: The author(s) declared no potential conflicts of interest with respect to the research, authorship, and/or publication of this article.
Funding: The author(s) disclosed receipt of the following financial support for the research, authorship, and/or publication of this article: This work was supported by Shenzhen Science and Technology Project (Grant No. JCYJ20170306095702695, KJYY20170724152553858), Special Innovation Project of Guangdong Education Department (Grand No. 2017GkQNCX069), National Natural Science Foundation of China (Grant No. 61702337), and Natural Science Foundation of Guangdong Province (Grant No. 2018A030313382 and 2018A030313339).
Reference
- 1. Bach PB, Mirkin JN, Oliver TK. et al. Benefits and harms of CT screening for lung cancer: a systematic review. Jama J Am Med Assoc. 2012;307(22):2418–2429. [DOI] [PMC free article] [PubMed] [Google Scholar]
- 2. Veloz A, Orellana A, Vielma J. et al. Brain tumors: how can images and segmentation techniques help. Diagnostic Techniq Surg Manage Brain Tumors. Rijeka, Croatia: In Tech; 2011. [Google Scholar]
- 3. Yen RF, Chen KC, Lee JM. et al. 18 F-FDG PET for the lymph node staging of non-small cell lung cancer in a tuberculosis-endemic country: is dual time point imaging worth the effort? Eur J Nucl Med Mol I. 2008;35(7):1305–1315. [DOI] [PubMed] [Google Scholar]
- 4. Hoffmann KR. Automated tracking of the vascular tree in DSA images using a double-square box region-of-search algorithm. Proc Spie. 1986;626:326–333. [Google Scholar]
- 5. Chan HP, Doi K, Galhotra S. et al. Image feature analysis and computer-aided diagnosis in digital radiography.1. automated detection of microcalcifications in mammography. Med Phys. 1987;14(4):538–548. [DOI] [PubMed] [Google Scholar]
- 6. Giger ML, Doi K, MacMahon H. Image feature analysis and computer aided diagnosis in digital radiography. 3. automated detection of nodules in peripheral lung fields. Med Phys. 1988;15(2):158–166. [DOI] [PubMed] [Google Scholar]
- 7. Huo Z, Giger ML, Vyborny CJ. et al. Effectiveness of CAD in the diagnosis of breast cancer: an observer study on an independent database of mammograms. Radiology. 2002;224:560–568. [DOI] [PubMed] [Google Scholar]
- 8. Wu YT, Wei J, Hadjiiski LM. et al. Bilateral analysis based false positive reduction for computer-aided mass detection. Med Phys. 2007;34(8):3334–3344. [DOI] [PMC free article] [PubMed] [Google Scholar]
- 9. Chan HP, Wei J, Zhang Y. et al. Computer-aided detection of masses in digital tomosynthesis mammography: comparison of three approaches. Med Phys. 2008;35(9):4087–4095. [DOI] [PMC free article] [PubMed] [Google Scholar]
- 10. Bhooshan N, Giger M, Medved M. et al. Potential of computer-aided diagnosis of high spectral and spatial resolution (HiSS) MRI in the classification of breast lesions. J Magn Reson Imaging. 2014;39(1):59–67. [DOI] [PMC free article] [PubMed] [Google Scholar]
- 11. Xiao Y, Zeng J, Niu L. et al. Computer-aided diagnosis based on quantitative elastographic features with supersonic shear wave imaging. Ultrasound Med Biol. 2014;40(2):275–286. [DOI] [PubMed] [Google Scholar]
- 12. Arimura H, Katsuragawa S, Suzuki K. et al. Computerized scheme for automated detection of lung nodules in low-dose computed tomography images for lung cancer screening. Acad Radiol. 2004;11(6):617–629. [DOI] [PubMed] [Google Scholar]
- 13. Li F, Arimura H, Suzuki K. et al. Computer-aided detection of peripheral lung cancers missed at CT: ROC analyses without and with localization. Radiology. 2005;237(2):684–690. [DOI] [PubMed] [Google Scholar]
- 14. Li Q, Li F, Doi K. Computerized detection of lung nodules in thin-section CT images by use of selective enhancement filters and an automated rule-based classifier. Acad Radiol. 2008;15(2):165–175. [DOI] [PMC free article] [PubMed] [Google Scholar]
- 15. Kano N, Hontani H, Takeda T. False positive rejection for detection tumors in lung area of FDG-PET/CT image. IEICE Technical Report. 2009;112:247–251. [Google Scholar]
- 16. Yu H, Caldwell C, Mah K. et al. Automated radiation targeting in head and neck cancer using region-based texture analysis of PET and CT images. Int J Radiat Oncol. 2009:75(2):618–625. [DOI] [PubMed] [Google Scholar]
- 17. Sawada Y, Oku T, Hotani H. et al. Improved detection of tumors in FDG-PET/CT images based on single-class classifier. IEICE Technical Report. 2009;109:229–234. [Google Scholar]
- 18. Garcıa G, Maiora J, Tapia A. et al. Computer-aided diagnosis of abdominal aortic aneurysm after endovascular repair using active learning segmentation and texture analysis. IFMBE Proceedings. 2014;41:186–189. [Google Scholar]
- 19. Nagarajan MB, Coan P, Huber MB. et al. Computer aided diagnosis for phase-contrast X-ray computed tomography: Quantitative characterization of human patellar cartilage with high-dimensional geometric features. J Digit Imaging. 2014;27(1):98–107. [DOI] [PMC free article] [PubMed] [Google Scholar]
- 20. Azami ME, Hammers A, Costes N. et al. Computer aided diagnosis of intractable epilepsy with MRI imaging based on textural information. Pattern Recognition in Neuroimaging. 2013;65(1):90–93. [Google Scholar]
- 21. Arisawa H. Improvement of automated cancer detection system using PET-CT images. Proceedings of the 95th Scientific Assembly and Annual Meeting of Radiological Society of North America RSNA;2009;12:921–921. [Google Scholar]
- 22. Arisawa H, Sato T. PET-CT imaging and diagnosis system following doctor’s method 1st International Conference on Health Informatics. SCITEPRESS;2008;12:258–261. [Google Scholar]
- 23. Ying H, Zhou F, Shields A. et al. A novel computerized approach to enhancing lung tumor detection in whole-body PET images International Conference of the IEEE Engineering in Medicine & Biology Society. IEEE;2004;9. [DOI] [PubMed] [Google Scholar]
- 24. Gifford HC, Sen A, Azencott R. SVM-based visual-search model observers for PET tumor detection. Proc SPIE. 2015;9416(2):216–222. [Google Scholar]
- 25. Liu L, Yu X, Ding B. Research on segmentation algorithm of lung cancer PET images based on pseudo color and context aware. Applicat Res Comput. 2017;34(3):953–956. [Google Scholar]
- 26. Kopriva I, Wei J, Zhang B. et al. Single-channel sparse non-negative blind source separation method for automatic 3-D delineation of lung tumor in PET images. IEEE J Biomed Health Inform. 2017;21(6):1656–1666. [DOI] [PubMed] [Google Scholar]
- 27. Feng Y, Ming X, Zhang Y. et al. A novel autosegmentation method for lung tumor on 18F-FDG PET images. Int J Radiat Oncol. 2012;84(3):110–110. [Google Scholar]
- 28. Hao Y, Zhou F, Shields AF. et al. A novel computerized approach to enhancing lung tumor detection in whole-body PET images. Eng Med Biology Society. 2005;108:1589. [DOI] [PubMed] [Google Scholar]
- 29. Teramoto A, Adachi H, Tsujimoto M. et al. Automated detection of lung tumors in PET/CT images using active contour filter. Int Soc Optics Photonics. 2015;9414(2):1–4. [Google Scholar]
- 30. Guo N, Yen R F, Fakhri G E. et al. SVM based lung cancer diagnosis using multiple image features in PET/CT Nuclear Science Symposium and Medical Imaging Conference. IEEE;2015:1–4. [Google Scholar]
- 31. Cuiying W, Zhou T, Huiling L. et al. SVM ensemble based computer-aided-diagnosis method of lung tumor using PET/CT multi-modality data. J Biomed Eng Res. 2017;36(3):207–212. [Google Scholar]
- 32. Punithavathy K, Ramya MM, Poobal S. Analysis of statistical texture features for automatic lung cancer detection in PET/CT images International Conference on Robotics, Automation, Control and Embedded Systems. February 18-20, 2015; Chennai, India: IEEE; 1–5. [Google Scholar]
- 33. Kannuswami P, Poobal S, Ramya M. Artificial neural network based lung cancer detection for PET/CT images. Indian J Sci Technol. 2018;10(42):1–13. [Google Scholar]
- 34. Wang H, Zhou Z, Li Y. et al. Comparison of machine learning methods for classifying mediastinal lymph node metastasis of non-small cell lung cancer from 18F-FDG PET/CT images. Ejnmmi Res. 2017;7(1):11. [DOI] [PMC free article] [PubMed] [Google Scholar]
- 35. Ding J, Li A, Hu Z, Wang L. Accurate pulmonary nodule detection in computed tomography images using deep convolutional neural networks. Lect Notes Comput Sc. 2017;10435. [Google Scholar]
- 36. 陣 之 内 正 史 [Jinnouchi Masafumi]: FDG-PET FDG-PET マ ニ ュ ア ル— 検 査 と 読 影 の コ ツ [FDG-PET FDG-PET Manual-Inspection and Reading Tips], Tokyo: Inner vision;2004;67–78. [Google Scholar]
- 37. Wang SY, Zhang J, Sun GF. et al. The maximum standardized uptake value of 18F-FDG PET/CT combined with the image features on high resolution CT for the diagnosis of lung cancer. Chin J Nucl Med Mol Imaing. 2013;33(1):29–33. [Google Scholar]
- 38. He K, Gkioxari G, Dollar P, Girshick R. et al. Mask R-CNN. IEEE Trans Pattern Anal Mach Intell. 2018. [DOI] [PubMed] [Google Scholar]
- 39. Ren S, He K, Girshick R, Sun J. et al. Faster R-CNN: towards real-time object detection with region proposal networks. IEEE Trans Pattern Anal Mach Intell. 2017;39(6):1137–1149. [DOI] [PubMed] [Google Scholar]
- 40. Li Y, Shen L, Yu S. HEp-2 specimen image segmentation and classification using very deep fully convolutional network. IEEE Trans Med Imaging. 2017;36(7):1561–1572. [DOI] [PubMed] [Google Scholar]


