Abstract
Affinity mass spectrometry (MS) enables rapid screening of compound mixtures for ligands bound to a specific protein target, yet its current throughput is limited to individually assay pools of 400−2000 compounds. Typical affinity MS screens implemented in pharmaceutical industry laboratories identify putative ligands based on qualitative analysis of compound binding to the target whereas no quantitative information is acquired to discriminate high- and low-affinity ligands in the screening phase. Furthermore, these screens require purification of a stabilized form of the protein target, which poses a great challenge for membrane receptor targets. Here, we describe a new, potentially general affinity MS strategy that allows screening of 20,000 compounds in one pool for highly efficient ligand discovery toward a G protein-coupled receptor (GPCR) target. Quantitative measurement of compound binding to the receptor enables high-affinity ligand selection using both the purified receptor and receptor-embedded cell membranes. This high-throughput, label-free and quantitative affinity MS screen resulted in discovery of three new antagonists of the A2A adenosine receptor.
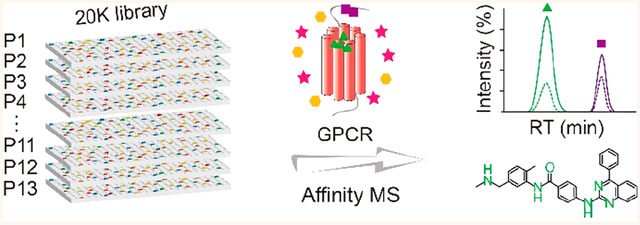
Graphical Abstract
In the past 2 decades, high-throughput screening (HTS) has become a mainstay for the generation of new chemical entities as a starting point for drug development in the pharmaceutical industry. A routine HTS campaign typically involves screening a library of 1−2 million compounds against a target of interest using the recombinant protein or cell-based functional assays. In spite of success with various targets, the experience in the past showed that HTS can generate significant numbers of “artifact” hits partly caused by the assay detection systems based on a fluorescence or luminescence readout.1,2 Recently, the traditional functional assay technologies are being complemented by affinity-based methods that directly measure the physical interaction between a test compound and a protein target. These biophysical technologies are increasingly introduced into the lead discovery pipeline for hit identification and optimization, to remove false positive hits of HTS, or to address protein interactions for challenging targets with no bioactivity assay adaptable to HTS.3,4
In the early phase of lead discovery, two affinity-based techniques that strongly complement the classical activity-based HTS assays for rapidly screening large libraries are DNA-encoded library (DEL) and affinity mass spectrometry (MS). Both techniques adopt a multiplexed screening format in which a pool of compounds is incubated with the target of interest, and multiple ligands are selected simultaneously due to their affinity to the target. DEL has afforded unprecedented screening throughput given that 1 million to 100 million compounds are typically synthesized and screened in one pool toward a specific target.5–7 The high sensitivity and selectivity of a DEL screen is enabled by amplification of the distinct DNA barcode attached to each compound.5 By contrast, current affinity MS screening permits ligand identification from pools of only 400−2000 compounds, which significantly limits its throughput.2,4,8,9 Therefore, far more protein is needed when a large-scale library has to be subdivided into hundreds of less complex cocktails compared to screening the entire library as a whole. In addition, the majority of affinity MS screens implemented in pharmaceutical industry laboratories identify putative ligands based on qualitative analysis of compounds bound to the target.2,8,10,11 No quantitative information is derived from screening large libraries at a single condition to discriminate high- and low-affinity ligands. Precise affinity ranking can be achieved by doing titration experiments, in which the concentration of either a ligand or the protein target is varied,12,13 yet this type of multidose experiments would lower the throughput and require more of the protein or compounds.
Another prevailing challenge for affinity-based screening techniques is the requirement of protein targets of high purity, activity, and stability.4 Because it is especially difficult to obtain a stable and active form of a membrane protein, very few applications of DEL, affinity MS, NMR, or surface plasmon resonance (SPR)-based ligand screening have been reported for this target class unless the protein is heavily engineered to increase thermostability.9,10,14–16 We have previously reported a new approach to use target protein-expressing cell membranes to screen for G protein-coupled receptor (GPCR) ligands by affinity MS.17 This approach allowed us to eliminate the demanding step of receptor purification and to keep the receptor embedded in the native membrane environment. However, our earlier GPCR screening was performed with a limited throughput by mixing 480 compounds in each pool for ligand selection.
In this study, we describe a new affinity MS strategy that enables screening of 20,000 compounds in one pool for highly efficient ligand discovery. Quantitative measurement of compound binding to the target compared to a control renders the selection of high-affinity ligands. This approach was applied to ligand screening for the A2A adenosine receptor (A2AR), an attractive GPCR target for immune−oncology, inflammation, and central nervous system disorders.18–20 Pharmaceutical development of A2AR antagonists and agonists is limited by the lack of novel scaffolds.21 Our high-throughput, label-free, and quantitative affinity MS screen resulted in the discovery of three unreported antagonists for A2AR, which could provide new starting points for chemical optimization and drug development.
EXPERIMENTAL SECTION
Protein Expression, Purification, and Compound Library Preparation.
See Experimental Section in the Supporting Information for a detailed description.
Protein-Based Affinity Selection of Different Compound Pools.
The purified receptor, A2AR or HCAR2 (3 μg), was immobilized on nickel agarose beads overnight in the incubation buffer of 25 mM HEPES, 800 mM NaCl, 0.02% (w/v) DDM, and 0.004% (w/v) CHS. Then, the A2AR beads were incubated with a specific compound pool (50 nM of each compound) in a total volume of 200 μL incubation buffer for 1 h at 4 °C. The supernatant was removed and the beads were washed four times with 150 mM ammonium acetate (pH 7.5). For the single-round affinity selection, 100 μL of 100% methanol was added twice to extract the compounds from A2AR beads and dried out in a speed vacuum and the residue redissolved in 50% methanol. For the iterative affinity selection, the compound extract from the A2AR beads was dried, reconstituted in the incubation buffer, and reincubated with freshly prepared A2AR beads. Through three rounds of affinity selection, finally eluted compounds were reconstituted in 50% methanol prior to LC-MS analysis. HCAR2 beads as the negative control were processed by the same procedure.
Membrane-Based Affinity Selection of 20K-Mix.
Cell membrane proteins were extracted using 1% SDS in 0.1% NaOH, and total protein concentration was measured with the BCA quantification kit (TIANGEN, China). The amount of A2AR and HCAR2 present in the membrane extract was determined using ELISA with an anti-Flag antibody (Sigma, China). The membrane fraction expressing A2AR (200−300 nM) was incubated with a specific compound pool (50 nM of each compound) in a total volume of 200 μL for 1 h at 25 °C. As previously described in detail,17 the membrane fraction was separated from free compounds in solution by vacuum filtration on a filter plate (Millipore, U.S.A.) and extensively washed by ammonium acetate (pH 7.5). After the first round of affinity selection, the A2AR-expressing membranes were treated by 100 μL of 100% methanol four times to elute compounds and the supernatant was collected by centrifugation at 20000g for 20 min. The supernatant was dried out, reconstituted in the incubation buffer, and reincubated with new A2AR-expresssing membranes. Three rounds of affinity selection were performed before the finally eluted compounds were collected for LC-MS analysis. HCAR2-expressing membrane fractions were processed using the same procedure.
LC-MS Analysis and Data Processing for Hit Identification.
Samples were analyzed on a Thermo Q Exactive HF apparatus operating in the positive ion mode and as a hybrid with a Waters ACQUITY UPLC instrument. Typically a two-thirds volume of the sample prepared from each replicate was injected. Chromatographic separation was performed on a ACQUITY UPLC BEH C18 column (1.7 μm, 2.1 × 100 mm2, Waters, U.S.A.) at a 200 μL/min flow rate and maintained at 40 °C, with the mobile phases of water/0.1% formic acid (A) and acetonitrile/0.1% formic acid (B). In the 480-mix screens, the previously reported LC gradient was applied.15 In 2400-mix, 4800-mix, and 20K-mix screens, a longer gradient was applied: 0−2 min, 5% B; 2−2.1 min, 5−20% B; 2.1−30 min, 20−35% B; 30−46 min, 35−60% B; 46−46.5 min, 60−90% B; 46.5−55 min, 90% B; and re-equilibration for 5 min. In the affinity MS assay of a simple mixture, a shorter gradient was applied: 0−2 min, 5% B; 2−8 min, 5−50% B; 8−10 min, 50− 90% B; 10−12 min, 90% B; and re-equilibration for 3 min. Full-scan mass spectra were acquired in the range of 160−1000 m/z with major ESI source settings: spray voltage 3.5 kV; probe heater temperature, 300 °C; capillary temperature, 320 °C; sheath gas, 35; auxiliary gas, 10. MS1 scan parameters included resolution 60,000, AGC target 3e6, and maximum injection time 200 ms. For isomeric compounds, MSMS spectra were acquired on selected compound precursors with collision energy set at 20, 40, and 60 eV. For each sample set, we first injected the compound pool followed by four pairs of target and control samples.
Compound idenfication and binding index (BI) measurement based on different screening data mainly followed the previous procedure.15 Briefly, compounds in the target and control samples were identified by extracting ion chromatograms (EICs) using TraceFinder 4.0 (Thermo Fisher Scientific, U.S.A.) based on accurate mass (<5 ppm), isotope distribution (<30% deviation), and retention time matching with respective peaks in the compound pool. For the compound pools of 480-mix, 2400-mix, and 4800-mix (either alone or in the 20K-mix library), the typical compound detection rate was 70−80%. BI of each compound refers to the ratio of EIC peak area in the target vs the control. BI was defined as 99 if the compound was only detected in the target samples or the actual ratio was above 100. Initial hits of 2400-mix, 4800-mix, and 20K-mix screens with purified receptor were selected based on mean BI > 5 and P < 0.01 from four replicates, or BI = 99 in all replicates. Initial hits of 480-mix and 20K-mix screens with cell membranes were selected based on mean BI > 2 and P < 0.01 from four replicates or BI = 99 in all replicates. For each compound, significant difference in the EIC signals between the target and the control is reflected by P-values determined in a two-tailed t test. Putative ligands were searched in ChEMBL, DrugBank, Binding DB, and SciFinder databases to find out whether they are known ligands for A2AR.
SPR.
The surface plasmon resonance (SPR) analysis was performed at 10 °C using Biacore T200 with NTA sensor chip (GE Healthcare, U.S.A.) and equilibrated with running buffer (20 mM Tris-HCl, 150 mM NaCl, 0.1% LMNG, 0.02% CHS, 0.1% DMSO, and pH 7.5). The purified A2AR protein containing a C-terminal 10× His tag was immobilized on the chip to yield a capture level of 5,000−10,000 resonance units (RU). Each unknown ligand from the 480-mix screen was first tested at 1 μM. Those with responses above the buffer control (9 ± 1 RU) were subjected to binding affinity and kinetics determination. The analytes were prepared and injected in multicycle format in 2-fold dilution series in the range of 0.04− 10 μM. The association and dissociation time was both 180 s followed by two 60 s injections of regeneration reagent of 5 mM theophylline and a 60 s injection of buffer. SPR analysis of each compound was conducted in duplicate. For Kd calculation, the data were fitted to a 1:1 interaction model with equilibrium analysis using Biacore T200 evaluation software.
Radioligand Binding Assay.
[3H]CGS21680 binding was analyzed using plasma membranes prepared from HEK-293 cells transiently expressing wild-type A2AR. Approximately 1.2 × 10⁸ transfected HEK-293 cells were harvested, suspended in 10 mL of ice-cold membrane buffer (50 mM Tris-HCl, pH 7.4), and centrifuged for 5 min at 700g. The resulting pellet was resuspended in cold membrane buffer, then homogenized by a Dounce homogenizer (Wheaton, Millville, NJ, U.S.A.), and centrifuged for 20 min at 50000g. The pellet was resuspended, homogenized, and centrifuged again, and the precipitate containing the plasma membranes was suspended in the membrane buffer containing protease inhibitor (Sigma-Aldrich, St. Louis, MO, USA) and stored at −80 °C. Protein concentration was determined using a protein BCA assay kit (Pierce Biotechnology, Pittsburgh, PA, USA). Cell membrane homogenates (10 μg of protein per well) were incubated in membrane-binding buffer (50 mM Tris-HCl, 10 mM NaCl, 0.1 mM EDTA, and pH 7.4) with constant concentration of [3H]CGS21680 (1 nM, PerkinElmer, U.S.A.) and serial dilutions of unlabeled CGS21680 (0.26 nM to 100 μM) or compounds (0.64 nM to 50 μM) at room temperature for 3 h. Following incubation, the samples were filtered rapidly in vacuum through glass fiber filter plates (PerkinElmer). After soaking and rinsing 4 times with ice-cold PBS, the filters were dried and counted for radioactivity in a scintillation counter (PerkinElmer).
cAMP Accumulation Assay.
The human A2AR full-length cDNA was subcloned into the pIRES-hyg2 mammalian expression vector. The full-length ORF has been confirmed by sequencing. The A2AR cell line was created by transfection of the HEK293 parental cell line and selected by 100 μg/mL hygromycin. Single cell clones with high A2AR inducibility were isolated. The clones with the largest dynamic range in the cAMP assay upon stimulation with adenosine were chosen for pharmacological studies. Cells were seeded in 6-well plates for overnight culture before inoculation into 384-well plates (1250 cells per well) for the assay. Accumulation of cAMP was measured using the LANCE cAMP kit (PerkinElmer) according to the manufacturer’s instructions. First, cells were incubated for 30 min in assay buffer with varying concentrations of each compound (0.1−60 μM) alone or together with CGS21680 at 37 °C for 30 min. Following addition of the detection mixture, plates were left for 1 h at room temperature prior to reading using an EnVision plate reader (PerkinElmer).
Molecular Docking Calculations.
Docking calculations were performed with graphical user interface Maestro 10.4 in Schrödinger Suite 2015–4 using a 1.8 Å resolution crystal structure of the human A2AR in complex with an antagonist (PDB accession: 4EIY). Ligand 3D structures were generated using LigPrep 3.6. The receptor was prepared by removing all nonprotein atoms. Molecular docking was carried out using Induced Fit Docking with the extra precision docking score and allowing optimization of residues within 5.0 Å.
RESULTS AND DISCUSSION
Ligand Screening toward Stabilized A2A Receptor from 480-Mix Compound Pools.
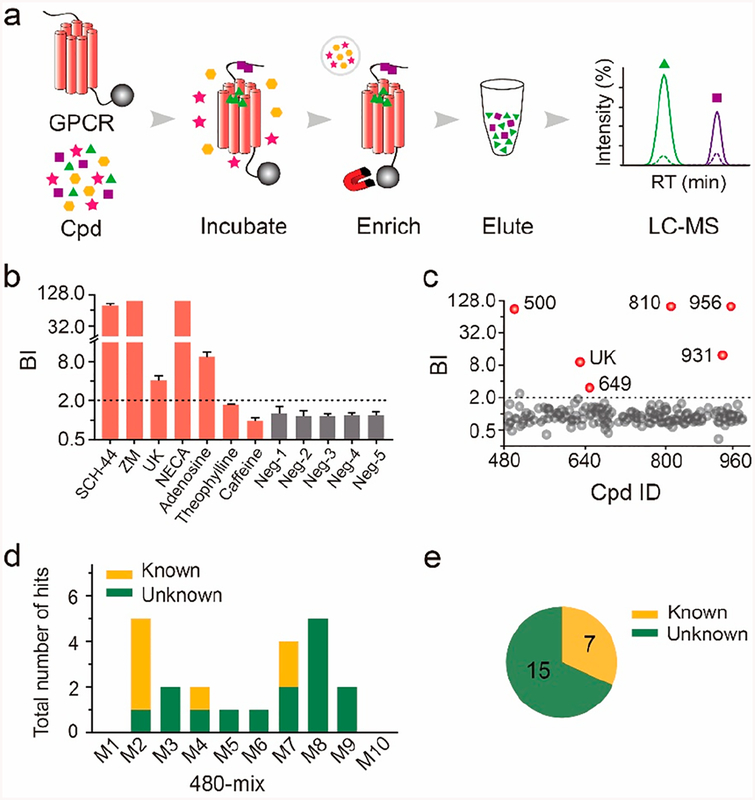
In order to obtain a relatively pure and stable receptor preparation for ligand screening, we purified a thermostabilized A2AR variant that was initially designed for protein crystallization.22 This engineered apo receptor that was fused with a stabilizing partner and incorporated three mutations within the seven-transmembrane domain remained in a homogeneous monomeric conformation after purification (Supporting Information Figure S1). An affinity MS workflow for the purified receptor was initiated by immobilizing A2AR on magnetic beads through its C-terminal His tag, and the immobilized target was then incubated with a compound mixture. The ligand-bound A2AR complexes were enriched by magnetic separation from the solution phase. Bound ligands were then dissociated from the protein target and subjected to liquid chromatography coupled to high-resolution mass spectrometry (LC-MS) analysis (Figure 1a). Another purified GPCR protein (hydroxyl carboxylic acid receptor 2, HCAR2) was immobilized and processed in the same manner to serve as a negative control (Figure S1). Quantitative comparison of the extracted ion chromatograms of individual compounds detected in the target vs the control incubations allowed us to distinguish specific A2AR-interacting ligands from nonspecific binders (Figure 1a).
Figure 1.
Affinity MS screen of 480-mix cocktails for ligand identification toward A2AR. (a) Experimental workflow. High- and low-affinity hits are distinguished by their MS intensity in the target vs control. (b) Affinity MS analysis of known A2AR ligands (red) and unrelated compouds (gray) in a simple mixture. Ligands with BI > 2 (n = 4) were identified. (c) Affinity MS screen of a 480-mix cocktail. Hits (mean BI > 2, P < 0.01, and n = 4) are indicated by red dots while gray dots represent negatives. (d) Hit identification from screening each 480-mix cocktail (M1−M10). (e) Total numbers of known and unreported ligands for A2AR identified from all 480-mix screens. Cpd, compound.
We first validated our method by incubating A2AR or the control with a mixture of seven known A2AR ligands and five unrelated compounds. Specific A2AR binding was defined by a compound BI > 2 from four experimental replicates according to our previous experience with affinity MS analysis of different targets.9,17,23 It is noteworthy that BI measurement does not precisely correlate to binding affinity of individual ligands, though it allows for semiquantitative estimation of affinity ranking for multiple ligands. Agonists and antagonists with high to medium A2AR affinity (Ki < 1 μM)19 showed BI values ranging from 4.0 to 99, while none of the unrelated compounds passed the BI threshold (Figure 1b). It is noteworthy that two antagonists, theophylline and caffeine, were not selected as ligands in our affinity MS assay probably due to their weak interaction with the receptor (Ki > 20 μM)19 (Figure 1b). Thus, our affinity MS assay established for a purified GPCR target enabled confident identification of relatively strong-binding receptor ligands.
Next, we employed the affinity MS assay to screen a collection of 4800 small molecules against the A2AR. This library was first divided into 10 cocktails of 480-mix to represent the complexity of compound pools commonly seen in affinity MS experiments.2,9,11,17 Each 480-mix cocktail was spiked with a known agonist UK-432,09722 and separately incubated with the target or control. Affinity MS analysis generated a set of initial hits passing the hit selection criteria (BI > 2, P < 0.01, and n = 4). Hits identified from one of the 480-mix cocktails were illustrated in Figure 1c. The positive control UK-432,097 was detected in all cocktails to ensure the receptor binding activity maintained throughout our affinity MS experiments. Screening ten 480-mix cocktails resulted in a total of 22 initial hits with a mean BI of 2.1 to 99 (Figure 1d and Table S1). They included seven well-characterized A2AR ligands, and six of them showed <1 μM receptor binding affinity in radioligand competition assays.24–27 The remaining 15 hits had no documented bioactivity or interaction toward any adenosine receptor subfamily member (A2AR, A2BR, A1R, and A3R) and were thus regarded as new, putative A2AR ligands (Figure 1e).
Validation of Binding of New Putative Ligands to A2A Receptor.
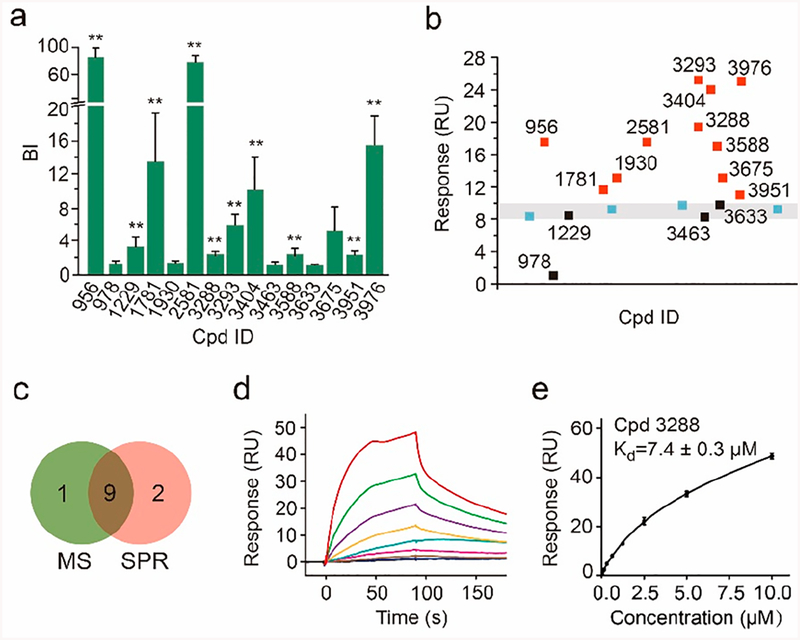
To verify the 15 new, putative A2AR ligands, we obtained each pure compound and created a simple mixture. Incubating this mixture with the target or control receptor followed by affinity MS analysis28 verified 10 compounds specifically bound to A2AR (Figure 2a). Those that were not validated could have resulted from compound misidentification or altered binding behavior in the original 480-mix cocktails. Meanwhile we exploited SPR-based biosensors to evaluate the binding capability of each putative ligand to the purified receptor. In a single-dose experiment, 11 of the 15 putative ligands yielded normalized responses significantly above the buffer control, and they were considered validated A2AR binders (Figure 2b). The majority of the ligands validated by either the affinity MS assay or the SPR assay overlapped, thus increasing our confidence in ligand identification (Figure 2c). The nine overlapping validated ligands were further analyzed by SPR in a multidose experiment to determine their dissociation constants. One ligand, 3288, showed low μM affinity to the receptor according to its SPR sensorgrams and the binding curve (Figures 2d,e). SPR data for the other ligands are summarized in Figure S2.
Figure 2.
Validation of putative A2AR ligands by affinity MS and SPR. (a) Affinity MS assay on a mixture of 15 putative ligands. Confirmed ligands (mean BI > 2, P < 0.01, and n = 4) are designated by asterisks. (b) SPR analysis of 15 putative ligands (each tested at 1 μM). Verified ligands (response > 10 RU), nonbinders and blank controls are represented by red, black, and blue squares, respectively. (c) Overlap of verified ligands by affinity MS and SPR. SPR sensorgrams (d) and the binding curve (e) of a verified ligand 3288. SPR data are shown as means of duplicate measurements at each concentration (0.04−10 μM). Cpd, compound.
Notably, GPCR ligand detection has posed several technical challenges for SPR analysis. Detergents and co-solvents for GPCR purification may influence the SPR binding signals, or the commonly used reagents for target immobilization and regeneration in SPR may not be suitable for GPCRs.29,30 In our SPR experiment, we had to screen detergents, optimize buffer composition, and select a suitable reagent for receptor regeneration. Very often each of these SPR conditions has to be optimized for different GPCRs. Unlike SPR, the affinity MS assay is more tolerant of buffer interferences, and our workflow established for A2AR ligand screening and validation is more easily adapted to other receptors.
Ligand Screening from 2400-Mix and 4800-Mix Compound Pools.
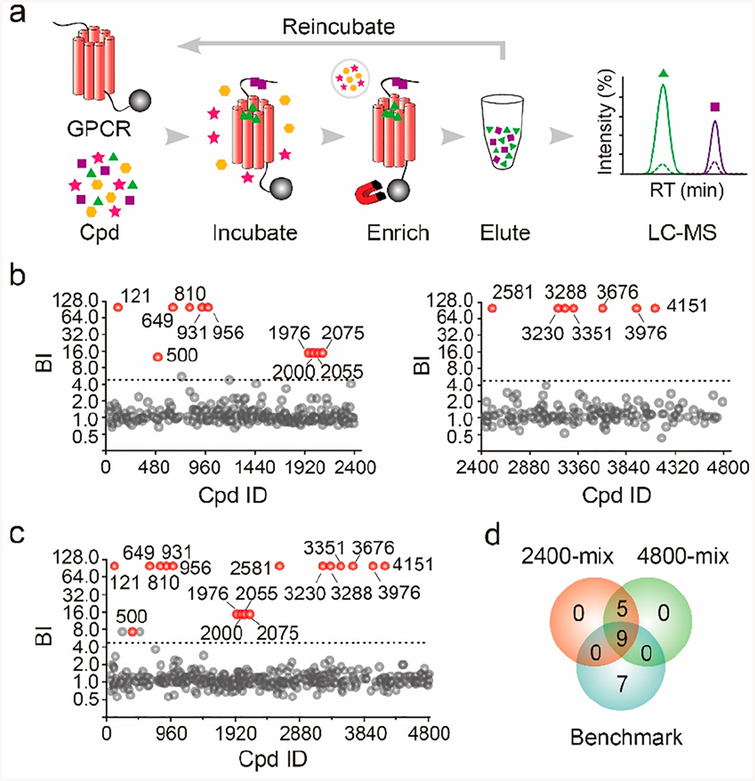
To increase the throughput of our affinity MS screen, we modified our workflow by performing iterative rounds of affinity selection of compounds associated with the protein target. Specifically, after each selection round, the associated compounds were eluted from A2AR by chemical denaturation of the receptor and reincubated with freshly prepared A2AR (Figure 3a). Three sequential selection rounds were carried out before the finally eluted compounds were analyzed by LC-MS/MS. To test the new workflow, we prepared two cocktails of 2400-mix and a single 4800-mix from the initial compound library. After the multiround affinity MS analysis, many compounds were barely detectable in the negative control, giving rise to a BI of 99 (meaning only detected in the target samples). It suggested that nonspecific binders in the control tend to be completely washed off in the multiround selection process. To screen for high-affinity ligands, we raised the BI threshold to above 5 (P < 0.01, n = 4) for hit selection. Screening either two 2400-mix compound pools or a single 4800-mix pool yielded the same set of 14 initial hits, and 12 hits had BI of 99 (Figure 3b,c and Table S1). These hits were compared with the benchmark ligand set from the standard 480-mix screen, which consisted of seven reported ligands and nine new ligands covalidated by MS and SPR binding assays. Nine hits from both the 2400-mix and 4800-mix screens turned out to be benchmark ligands, suggesting our multiround affinity MS approach efficiently captured true ligands from compound pools of 10-fold increased complexity (Figure 3d). For the five new hits identified from the 2400-mix or 4800-mix screen, three of which were validated in the affinity MS binding assay with a simple compound mixture (Figure S3a). In the 4800-mix screen, we further varied the protein:compound ratio during incubation and found that increasing the concentration of protein or compounds led to identification of slightly more benchmark ligands and many more new “hits” that were presumably false positives (Figure S3b). Thus, we retained the original incubation conditions to restrict the hit rate < 1% for multiround affinity MS screen.
Figure 3.
Affinity MS screen of 2400-mix and 4800-mix compound pools. (a) Modified workflow integrating iterative incubation of eluted compounds with the target. (b) Screening two 2400-mix pools and (c) one 4800-mix pool yielded the same set of initial hits. Initial hits and negatives are indicated by red and gray dots, respectively. (d) Overlap of hits from the 2400-mix and 4800-mix screens and comparison with the benchmark ligand set from the regular 480-mix screen. Isomeric compounds that cannot be distinguished by LC-MS/MS analysis are separately shown in panels b and c, yet they are de-duplicated to be a single hit in panel d. Cpd, compound.
Accelerated Ligand Screening from a 20K Compound Pool with Purified Receptor or Receptor-Embedded Cell Membranes.
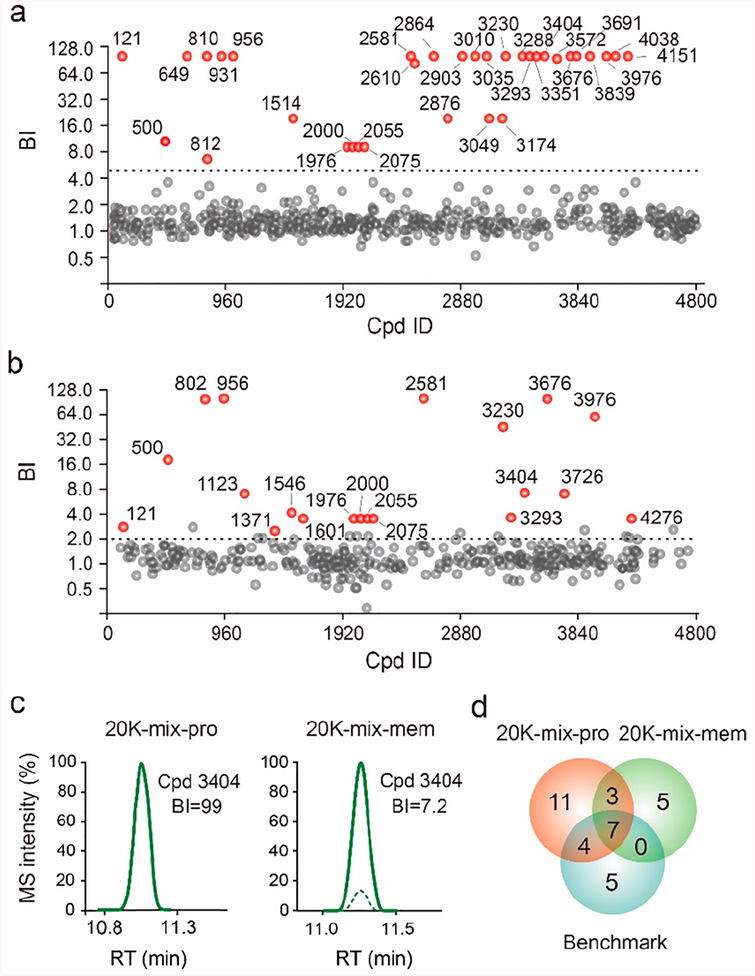
Encouraged by our success with the 4800-mix screen using the iterative affinity selection strategy, we moved forward to see whether the benchmark ligands could still be identified from an even more complex compound pool. To this end, we combined the original 4800-mix with another library containing 15.7K compounds. This 20K-mix was incubated with purified A2AR protein and underwent multi-round affinity MS analysis. Comparison of the LC-MS trace for the input 20K-mix and the compounds eluted from the receptor after three-round selection revealed that the number of detectable compound peaks was substantially reduced after affinity MS screen, indicating enrichment of putative ligands (Figure S4). Twenty-five initial hits were discovered from the 20K-mix screen with purified A2AR protein (Figure 4a and Table S1). It is noteworthy that only compounds in the 4800-mix library were counted as hits but not compounds in the additional 15.7K library, which merely served as the compound pool background.
Figure 4.
Affinity MS screens of a 20K compound pool. Hit identification from screening the 20K library with purified A2AR protein (a) or A2AR-expressing cell membranes (b). Descriptions for panels a and b are the same as those for Figure 3b,c. (c) Extracted LCMS traces of compound 3404 from the protein-based screen (left) or the membrane-based screen (right). (d) Overlap of hits from the two 20K-mix screens and comparison with the benchmark ligand set. Pro, protein; mem, membrane.
Previously, we established an affinity MS workflow using cell membranes overexpressing a specific GPCR target as the screening subject to eliminate the need for laborious receptor purification.17 In the earlier study, screening was performed against 480-mix compound pools with a single-round affinity selection procedure. Here, we implemented the new multi-round affinity MS workflow to screen the 20K-mix for ligands associated with A2AR-expressing cell membranes (Figure S5). Since the membrane-based screen yielded higher background signals, the BI threshold was lowered to 2 (P < 0.01, n = 4) for hit selection. Fifteen initial hits resulted from the affinity MS screen with A2AR-expressing membranes (Figure 4b and Table S1). Ten of them were in common with those from screening the same 20K-mix with purified A2AR protein. For these shared hits, we noticed that six of them displayed significantly reduced BI values in the membrane-based screen compared to the protein-based screen. For instance, one hit, 3404, was only detected in the target samples (BI = 99) in the protein-based screen in contrast to a lower BI of 7.2 measured in the membrane-based screen (Figure 4c). Nevertheless, two 20K-mix screens using different forms of the receptor identified 69% of the benchmark ligands (Figure 4d), suggesting that our screening approach with highly complex compound pools can achieve efficient GPCR ligand identification.
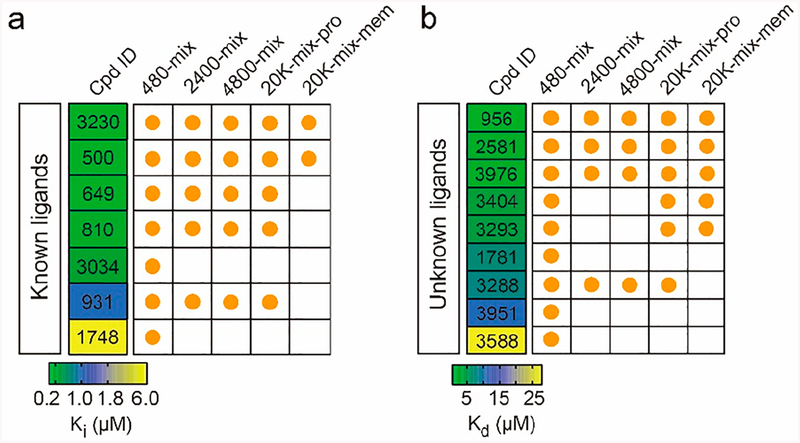
We then compared the selection of 16 benchmark A2AR ligands from screening compound pools of 480-mix, 2400-mix, 4800-mix, and 20K-mix (Figure 5 and full data in Table S2). Among the seven known ligands, the two with highest A2AR affinity (Ki < 0.03 μM) were identified in all five types of screens, and three more ligands of medium affinity (0.061− 0.84 μM) were selected in all four screens using the purified target, but not that using the target-expressing membranes. Concordantly, for the nine unknown ligands discovered in our study, three with the highest affinity (Kd < 1.4 μM) were identified in all five screens. Two more ligands with slightly reduced affinity (~4.0 μM) could be also captured in the 20K-mix screens. Although there was a trade-off between increased screening throughput and reduced hit rate, we concluded that the accelerated affinity MS screening for a GPCR target, using either purified protein or cell membranes, enables efficient detection of most of the high-affinity ligands present. The entire experiment, including compound library incubation, affinity selection, and LC-MS analysis of ligand mixtures, took about 4 h in total.
Figure 5.
Selection of seven known ligands (a) and nine unknown ligands (b) for A2AR in the benchmark ligand set by different affinity MS screens. The range of binding affinity of known ligands from literature24–27 (Ki) and unknown ligands measured by our SPR analysis (Kd) is color coded. Cpd, compound; Pro, protein; mem, membrane.
Discovery of New Chemical Modulators for A2A Receptor.
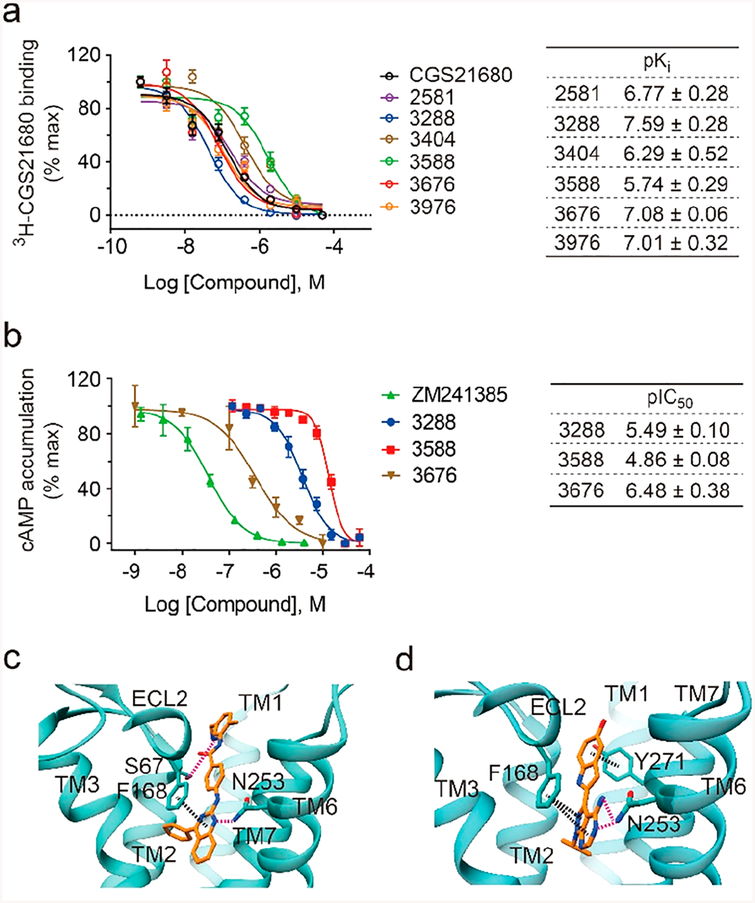
As for the nine A2AR ligands discovered in our screen, yet not reported in the literature, we further conducted radioligand binding and cell activity assays to evaluate their functional interaction with the endogenous, wild-type receptor. Another unknown ligand, 3676, that was missed in the 480-mix, yet selected in four other screens of higher complexity, was also assayed (Figure S6). Six test compounds showed radioligand binding affinity in the competition assay with IC50 spanning from 26 nM to 1.8 μM (Figure 6a). Three of them, 3288, 3588, and 3676, were further characterized as A2AR antagonists in a cAMP accumulation assay (Figure 6b). Docking of the compound 3288 to the A2AR structure predicted that the pyrimidine core of 3288 is anchored by an aromatic π-stacking interaction with Phe168 in the extracellular loop 2 (ECL2) and hydrogen bonding with Asn253 in transmembrane helix (TM) VI (Figure 6c). These two interactions are common to many reported agonist- and antagonist-bound A2AR structures.16,17,19,22 Hydrophobic interaction of the phenyl ring with multiple residues and the hydrogen bond engaging the imino group and Ser67 could strengthen receptor binding of 3288 (Figure S7). For the adenine-like ligand 3676, molecular docking indicated that the adenine moiety of 3676 is also anchored by key interactions with Phe168 and Asn253, and its indole moiety involves a new π-stacking interaction with Y271 in TM VII (Figure 6d). Additional hydrophobic and polar interactions contributed to the antagonist binding (Figure S7). It is noteworthy that the identification of novel agonists for A2AR in broad screening of diverse chemotypes such as a virtual screen of millions of compounds is very rare.19,21 Given that our unbiased screening approach was able to detect several known A2AR agonists, including adenosine, UK-432,097, and NECA (Figure 1b), we hope to identify novel agonists by screening much larger and more diverse libraries in the future.
Figure 6.
Discovery of new chemical modulators for A2AR. (a) Binding affinity of six new ligands determined by radioligand binding assay. (b) Activity of three new antagonists revealed in a cAMP accumulation assay. ZM and CGS are positive controls. Affinity and activity measurements in panels a and b were represented by means and SD from experimental triplicates. (c) Docked pose of 3288 (orange) in the A2AR model (cyan). (d) Docked pose of 3676 (orange) in the A2AR model (cyan). Interactions: hydrogen bonds, pink dashed line; π−π interaction, black dashed line.
CONCLUSIONS
In this study, we present a new, potentially general affinity MS strategy that significantly increases the screening throughput by assaying 20K compounds in one pool compared to our previous work of merely screening 480 compounds at a time. When applied to A2AR ligand discovery, this approach enabled repeated identification of high-affinity hits from compound pools of increased complexity. Both novel A2AR antagonists and agonists are sought for pharmaceutical development. These hit molecules from this study can now be chemically optimized for pharmacological and drug-like properties. Furthermore, our accelerated affinity MS approach can be employed to screen with both the purified stable form of a GPCR target and the target-embedded cell membranes. Using the iterative selection procedure developed in this study, we expect the throughput of affinity MS screening can be further increased to assay hundreds of thousands or even 1 million compounds in one pool, approaching the throughput of the DEL screen. Construction of a million-scale library to be screened by affinity MS in one pool for rapid GPCR ligand discovery is underway.
Supplementary Material
ACKNOWLEDGMENTS
This work was partially funded by ShanghaiTech University (W.S.), the National Key Research and Development Program of China (Grant 2018YFA0507004 to W.S.), National Natural Science Foundation of China Grants 81573479 and 81773792 (D.Y.), National Mega R&D Program for Drug Discovery Grants 2018ZX09711002-002-005 (D.Y.) and 2018ZX09735–001 (M.-W.W.) and NIDDK Intramural ZIADK31117 (K.A.J.). We thank Yang Yang for the gift of HCAR2 plasmid, Wanjing Guo, Li Zhong, the Core Facilities of iHuman Institute, and the MS facility of School of Life Science and Technology at ShanghaiTech University for technical support.
Footnotes
Supporting Information
The Supporting Information is available free of charge on the ACS Publications website at DOI: 10.1021/acs.anal-chem.9b00477.
Affinity MS screening data for initial hits; binding affinities; SPR sensorgrams and binding curves; validation of unknown ligands and comparison of initial hits; TICs of affinity selected compounds; SDS-PAGE and Western blot of A2AR and HCAR2-expressing cell membranes; unknown ligands identified in screening; schematic of the interactions (PDF)
Table of affinity MS screening data (XLSX)
Notes
The authors declare no competing financial interest.
REFERENCES
- (1).Thorne N; Auld DS; Inglese J Curr. Opin. Chem. Biol 2010, 14, 315–324. [DOI] [PMC free article] [PubMed] [Google Scholar]
- (2).O’Connell TN; Ramsay J; Rieth SF; Shapiro MJ; Stroh JG Anal. Chem 2014, 86, 7413–7420. [DOI] [PubMed] [Google Scholar]
- (3).Zhu Z; Cuozzo JJ Biomol. Screening 2009, 14, 1157–1164. [DOI] [PubMed] [Google Scholar]
- (4).Bergsdorf C; Ottl J Expert Opin. Drug Discovery 2010, 5, 1095–1107. [DOI] [PubMed] [Google Scholar]
- (5).Goodnow RA Jr.; Dumelin CE; Keefe AD Nat. Rev. Drug Discovery 2017, 16, 131–147. [DOI] [PubMed] [Google Scholar]
- (6).Yang H; Medeiros PF; Raha K; Elkins P; Lind KE; Lehr R; Adams ND; Burgess JL; Schmidt SJ; Knight SD; Auger KR; Schaber MD; Franklin GJ; Ding Y; DeLorey JL; Centrella PA; Mataruse S; Skinner SR; Clark MA; Cuozzo JW; Evindar G ACS Med. Chem. Lett 2015, 6, 531–536. [DOI] [PMC free article] [PubMed] [Google Scholar]
- (7).Deng H; Zhou J; Sundersingh FS; Summerfield J; Somers D; Messer JA; Satz AL; Ancellin N; Arico-Muendel CC; Sargent Bedard KL; Beljean A; Belyanskaya SL; Bingham R; Smith SE; Boursier E; Carter P; Centrella PA; Clark MA; Chung CW; Davie CP; Delorey JL; Ding Y; Franklin GJ; Grady LC; Herry K; Hobbs C; Kollmann CS; Morgan BA; Pothier Kaushansky LJ; Zhou Q ACS Med. Chem. Lett 2015, 6, 919–924. [DOI] [PMC free article] [PubMed] [Google Scholar]
- (8).Deng Y; Shipps GW Jr.; Cooper A; English JM; Annis DA; Carr D; Nan Y; Wang T; Zhu HY; Chuang CC; Dayananth P; Hruza AW; Xiao L; Jin W; Kirschmeier P; Windsor WT; Samatar AA J. Med. Chem 2014, 57, 8817–8826. [DOI] [PubMed] [Google Scholar]
- (9).Chen X; Qin SS; Chen S; Li JL; Li LX; Wang ZL; Wang Q; Lin JP; Yang C; Shui WQ Sci. Rep 2015, 5, 8361. [DOI] [PMC free article] [PubMed] [Google Scholar]
- (10).Whitehurst CE; Yao ZP; Murphy D; Zhang MX; Taremi S; Wojcik L; Strizki JM; Bracken JD; Cheng CC; Yang XS; Shipps GW; Ziebell M; Nickbarg E Comb. Chem. High Throughput Screening 2012, 15, 473–485. [DOI] [PubMed] [Google Scholar]
- (11).Kutilek VD; Andrews CL; Richards MP; Xu Z; Sun T; Chen Y; Hashke A; Smotrov N; Fernandez R; Nickbarg EB; Chamberlin C; Sauvagnat B; Curran PJ; Boinay R; Saradjian P; Allen SJ; Byrne N; Elsen NL; Ford RE; Hall DL; Kornienko M; Rickert KW; Sharma S; Shipman JM; Lumb KJ; Coleman K; Dandliker PJ; Kariv I; Beutel BJ Biomol. Screening 2016, 21, 608–619. [DOI] [PubMed] [Google Scholar]
- (12).Annis DA; Shipps GW Jr.; Deng Y; Popovici-Muller J; Siddiqui MA; Curran PJ; Gowen M; Windsor WT Anal. Chem 2007, 79, 4538–4542. [DOI] [PubMed] [Google Scholar]
- (13).Gesmundo NJ; Sauvagnat B; Curran PJ; Richards MP; Andrews CL; Dandliker PJ; Cernak T Nature 2018, 557, 228–232. [DOI] [PubMed] [Google Scholar]
- (14).Ahn S; Kahsai AW; Pani B; Wang QT; Zhao S; Wall AL; Strachan RT; Staus DP; Wingler LM; Sun LD; Sinnaeve J; Choi M; Cho T; Xu TT; Hansen GM; Burnett MB; Lamerdin JE; Bassoni DL; Gavino BJ; Husemoen G; Olsen EK; Franch T; Costanzi S; Chen X; Lefkowitz RJ Proc. Natl. Acad. Sci. U.S.A 2017, 114, 1708–1713. [DOI] [PMC free article] [PubMed] [Google Scholar]
- (15).Chen D; Errey JC; Heitman LH; Marshall FH; Ijzerman AP; Siegal G ACS Chem. Biol 2012, 7, 2064–2073. [DOI] [PubMed] [Google Scholar]
- (16).Rich RL; Errey J; Marshall F; Myszka DG Anal. Biochem 2011, 409, 267–272. [DOI] [PMC free article] [PubMed] [Google Scholar]
- (17).Qin S; Meng M; Yang D; Bai W; Lu Y; Peng Y; Song G; Wu Y; Zhou Q; Zhao S; Huang X; McCorvy JD; Cai X; Dai A; Roth BL; Hanson MA; Liu ZJ; Wang MW; Stevens RC; Shui W Chem. Sci 2018, 9, 3192–3199. [DOI] [PMC free article] [PubMed] [Google Scholar]
- (18).Congreve M; Brown GA; Borodovsky A; Lamb ML Expert Opin. Drug Discovery 2018, 13, 997–1003. [DOI] [PubMed] [Google Scholar]
- (19).de Lera Ruiz M; Lim YH; Zheng JJ Med. Chem 2014, 57, 3623–3650. [DOI] [PubMed] [Google Scholar]
- (20).Young A; Ngiow SF; Barkauskas DS; Sult E; Hay C; Blake SJ; Huang Q; Liu J; Takeda K; Teng MWL; Sachsenmeier K; Smyth MJ Cancer Cell 2016, 30, 391–403. [DOI] [PubMed] [Google Scholar]
- (21).Rodriguez D; Gao ZG; Moss SM; Jacobson KA; Carlsson JJ Chem. Inf. Model 2015, 55, 550–563. [DOI] [PMC free article] [PubMed] [Google Scholar]
- (22).Liu W; Chun E; Thompson AA; Chubukov P; Xu F; Katritch V; Han GW; Roth CB; Heitman LH; IJzerman AP; Cherezov V; Stevens RC Science 2012, 337, 232–236. [DOI] [PMC free article] [PubMed] [Google Scholar]
- (23).Fu X; Wang Z; Li L; Dong S; Li Z; Jiang Z; Wang Y; Shui W Sci. Rep 2016, 6, 29680. [DOI] [PMC free article] [PubMed] [Google Scholar]
- (24).Gillespie RJ; Bamford SJ; Botting R; Comer M; Denny S; Gaur S; Griffin M; Jordan AM; Knight AR; Lerpiniere J; Leonardi S; Lightowler S; McAteer S; Merrett A; Misra A; Padfield A; Reece M; Saadi M; Selwood DL; Stratton GC; Surry D; Todd R; Tong X; Ruston V; Upton R; Weiss SM J. Med. Chem 2009, 52, 33–47. [DOI] [PubMed] [Google Scholar]
- (25).Deflorian F; Kumar TS; Phan K; Gao ZG; Xu F; Wu H; Katritch V; Stevens RC; Jacobson KA J. Med. Chem 2012, 55, 538–552. [DOI] [PMC free article] [PubMed] [Google Scholar]
- (26).Sanders MP; Roumen L; van der Horst E; Lane JR; Vischer HF; van Offenbeek J; de Vries H; Verhoeven S; Chow KY; Verkaar F; Beukers MW; McGuire R; Leurs R; Ijzerman AP; de Vlieg J; de Esch IJ; Zaman GJ; Klomp JP; Bender A; de Graaf CJ Med. Chem 2012, 55, 5311–5325. [DOI] [PubMed] [Google Scholar]
- (27).Schmidt M; Sun H; Rogne P; Scriba GK; Griesinger C; Kuhn LT; Reinscheid UM J. Am. Chem. Soc 2012, 134, 3080–3083. [DOI] [PubMed] [Google Scholar]
- (28).Qin S; Ren Y; Fu X; Shen J; Chen X; Wang Q; Bi X; Liu W; Li L; Liang G; Yang C; Shui W Anal. Chim. Acta 2015, 886, 98–106. [DOI] [PubMed] [Google Scholar]
- (29).Giannetti AM Methods Enzymol. 2011, 493, 169–218. [DOI] [PubMed] [Google Scholar]
- (30).Aristotelous T; Hopkins AL; Navratilova I Methods Enzymol. 2015, 556, 499–525. [DOI] [PubMed] [Google Scholar]
Associated Data
This section collects any data citations, data availability statements, or supplementary materials included in this article.


