

Abstract
Reactive oxygen species (ROS) are emerging as important regulators of cancer growth and metastatic spread. However, how cells integrate redox signals to affect cancer progression is not fully understood. Mitochondria are cellular redox hubs, which are highly regulated by interactions with neighboring organelles. Here, we investigated how ROS at the endoplasmic reticulum (ER)–mitochondria interface are generated and translated to affect melanoma outcome. We show that TMX1 and TMX3 oxidoreductases, which promote ER–mitochondria communication, are upregulated in melanoma cells and patient samples. TMX knockdown altered mitochondrial organization, enhanced bioenergetics, and elevated mitochondrial‐ and NOX4‐derived ROS. The TMX‐knockdown‐induced oxidative stress suppressed melanoma proliferation, migration, and xenograft tumor growth by inhibiting NFAT1. Furthermore, we identified NFAT1‐positive and NFAT1‐negative melanoma subgroups, wherein NFAT1 expression correlates with melanoma stage and metastatic potential. Integrative bioinformatics revealed that genes coding for mitochondrial‐ and redox‐related proteins are under NFAT1 control and indicated that TMX1, TMX3, and NFAT1 are associated with poor disease outcome. Our study unravels a novel redox‐controlled ER–mitochondria–NFAT1 signaling loop that regulates melanoma pathobiology and provides biomarkers indicative of aggressive disease.
Keywords: calcium, contact site, melanoma, mitochondria, redox
Subject Categories: Cancer, Metabolism
Introduction
Cancer cells' redox state is emerging as an important factor in carcinogenesis, tumor cell aggressive behavior, metabolism, and drug resistance (Chio & Tuveson, 2017). Abnormal reactive oxygen species (ROS) levels in transformed cells can be attributed to changes in organelle dynamics, an inefficient mitochondrial respiratory chain, increased metabolic needs, altered ROS scavenging, and oncogene‐induced stress (Weinberg & Chandel, 2009; Sabharwal & Schumacker, 2014; Willems et al, 2015; Idelchik et al, 2017). At the center of it all, ER and mitochondria, via precise contact sites, play the essential role of coordinating redox, but also calcium (Ca2+) and lipid signaling (Elbaz & Schuldiner, 2011; Rowland & Voeltz, 2012; Booth et al, 2016; Pedriali et al, 2017). Accordingly, alterations in organelle structure and inter‐organelle contacts can have profound implications for redox signaling and, hence, tumor cell behavior. However, how cells react or adapt to these alterations, how these are integrated with other signaling inputs, and how we can use this knowledge for therapeutic or diagnostic purposes require further understanding (Gorrini et al, 2013; Panieri & Santoro, 2016; Chio & Tuveson, 2017; Hempel & Trebak, 2017).
Melanoma, the deadliest of skin cancers, is highly reliant on mitochondrial activity and ROS signaling for its resilience (Haq et al, 2013; Roesch et al, 2013; Vazquez et al, 2013). A recent study showed that healthy tissues have consistent mitochondrial morphology and organization as well as protein expression, while those patterns disappear in skin cancer (Pouli et al, 2016). At the molecular level, we have shown that tumor‐maintaining and multidrug‐resistant melanoma cells (displaying high levels of the histone demethylase JARID1B) have higher mitochondrial energy production, consume more oxygen, and generate higher amounts of ROS compared to drug‐sensitive cells (Roesch et al, 2013). Meanwhile, the transcription factor peroxisome proliferator‐activated receptor gamma coactivator 1alpha (PGC1α) defines a subset of oxidative stress‐resistant melanoma cells featuring increased mitochondrial capacity (Haq et al, 2013; Vazquez et al, 2013). Recent studies also suggest that antioxidants (some targeted to the mitochondria) promote distant metastasis in melanoma and lung cancer (Sayin et al, 2014; Le Gal et al, 2015; Piskounova et al, 2015). Confirming this, specific pharmacological targeting of the antioxidant enzyme thioredoxin reductase 1 efficiently eliminated a panel of cancer cells (Stafford et al, 2018).
Recent findings demonstrated that the thioredoxin‐related transmembrane proteins 1 and 3 (TMX1 and TMX3) are enriched in the mitochondria‐associated membranes (MAMs) of the ER (Lynes et al, 2012; Raturi et al, 2016). In a separate study, TMX1, TMX3, and the related TXNDC15 were identified as regulators of the nuclear factor of activated T cells (NFAT1) through a whole‐genome siRNA screen (Sharma et al, 2013). NFAT1 belongs to the NFAT family of transcription factors and is essential for controlling the immune system and the function of other organ systems. Under resting conditions, NFAT proteins are phosphorylated and reside in the cytosol; in activated cells, NFAT1 is dephosphorylated by the calcineurin phosphatase, a process which is controlled by intracellular Ca2+. Thus, the store‐operated Ca2+ entry (SOCE) through the STIM‐gated ORAI channels is a major regulator of the NFAT1‐governed gene transcription (Shaw et al, 1988; Rao et al, 1997; Kar & Parekh, 2015). As a major Ca2+ entry pathway in non‐excitable cells, SOCE is also implicated in the regulation of important cancer‐based processes (Prevarskaya et al, 2011; Prakriya & Lewis, 2015; Hoth, 2016). We and others have shown that SOCE regulates melanoma growth and metastatic spread (Stanisz et al, 2014, 2016; Hooper et al, 2015). Moreover, the NFAT family was reported to play an important role in melanoma and other cancers (Flockhart et al, 2009; Mancini & Toker, 2009; Muller & Rao, 2010; Perotti et al, 2012; Shoshan et al, 2016). These studies collectively suggested that TMX, mitochondrial activity, and NFAT1 signaling cooperate to control cancer biology.
In this study, we first examined the expression and abundance of TMX1, TMX3, and NFAT1 in healthy vs. cancer tissues. We investigated how disrupting ER–mitochondria communication by TMX downregulation affected cellular redox processes, with implications on signaling activity via the monitoring of NFAT1 translocation. We then showed that TMX1, TMX3, and NFAT1 contribute to melanoma proliferation and migration in vitro and in vivo. We finally analyzed their roles in patient survival and propose a model whereby redox signals at ER–mitochondria interface emerge as important regulators of melanoma aggressive behavior.
Results
TMX1, TMX3, and NFAT1 expression is elevated in melanoma
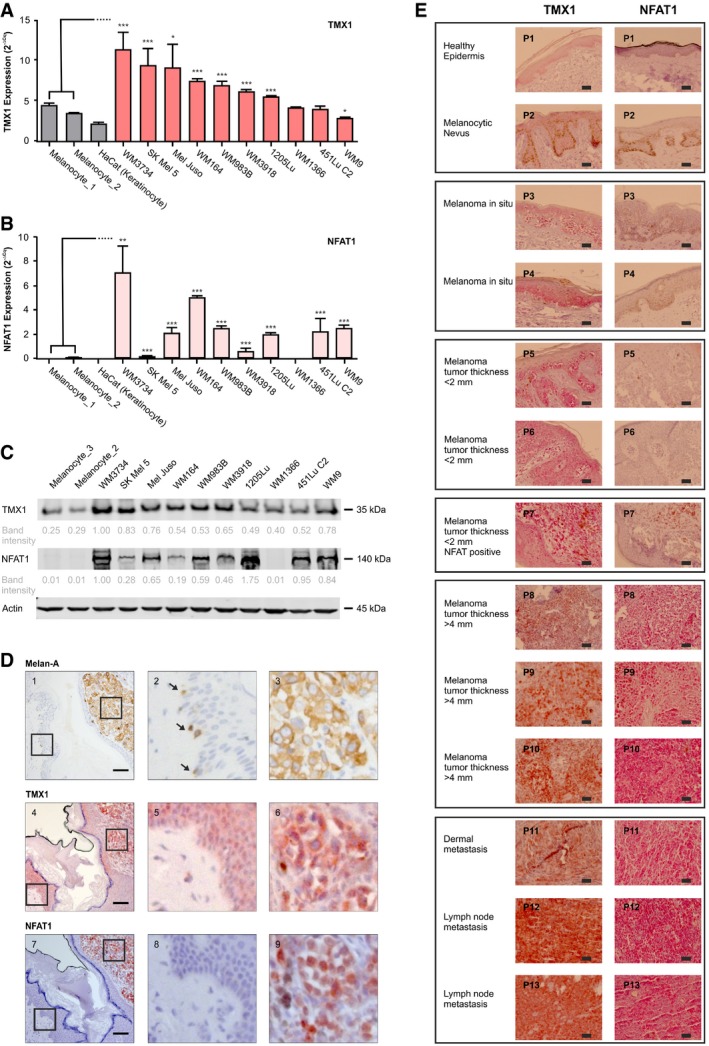
Because melanoma is heterogeneous genetically and in its clinical manifestation, we investigated TMX and NFAT expression patterns across multiple human melanoma cell lines. As shown in Fig 1A, TMX1 mRNA levels were heterogeneous; however, in more than 70% of the lines tested, they reached higher levels than that observed for healthy melanocytes. Higher expression patterns were also observed for TMX3, suggesting a non‐trivial role for the TMX family in melanoma (Fig EV1A). Quantitative PCR (qPCR)‐based screening of all five NFAT isoforms in melanoma cell lines indicated that all NFAT isoforms are detectable, while NFAT1 is predominant (Fig EV1B). We next compared NFAT1 mRNA expression in our extended panel of genetically distinct melanoma cell lines and observed that in nine out of ten melanoma lines, NFAT1 is expressed and is higher compared to healthy melanocytes and keratinocytes, wherein NFAT1 transcripts were almost undetectable (Fig 1B). Intriguingly, one melanoma line (WM1366) was NFAT1‐negative, suggesting alternative signaling in this vertical growth phase (VGP) melanoma cell line. The higher expression levels of TMX1 and NFAT1 were also confirmed at the protein level using immunoblot analysis (Fig 1C).
Figure 1. TMX1 and NFAT1 expression is elevated in human melanoma cell lines and patient samples.
-
A, BmRNA levels of TMX1 (A) and NFAT1 (B) in primary melanocytes, keratinocytes, and melanoma cell lines.
-
CRepresentative immunoblot (from 3) depicting protein abundance of TMX1 and NFAT1 in melanocytes and melanoma cell lines; actin was used as a loading control. Indicated band intensities were normalized to actin, and background signal was subtracted.
-
DMelan‐A (brown), TMX1 (red‐brown), and NFAT1 (deep red) staining (IHC) in a primary stage 4 high‐risk nodular melanoma patient I (out of four); the enlarged regions show healthy tissue (panels 2, 5, and 8) and tumor tissue (panels 3, 6, and 9). Arrows indicate Melan‐A‐positive melanocytes.
-
ETMX1 (red‐brown) and NFAT1 (deep red) staining of healthy human skin and increasing melanoma stages; P1–P13 refer to the donor patient number.
Figure EV1. TMX and NFAT expression in melanoma cells and human melanoma samples.
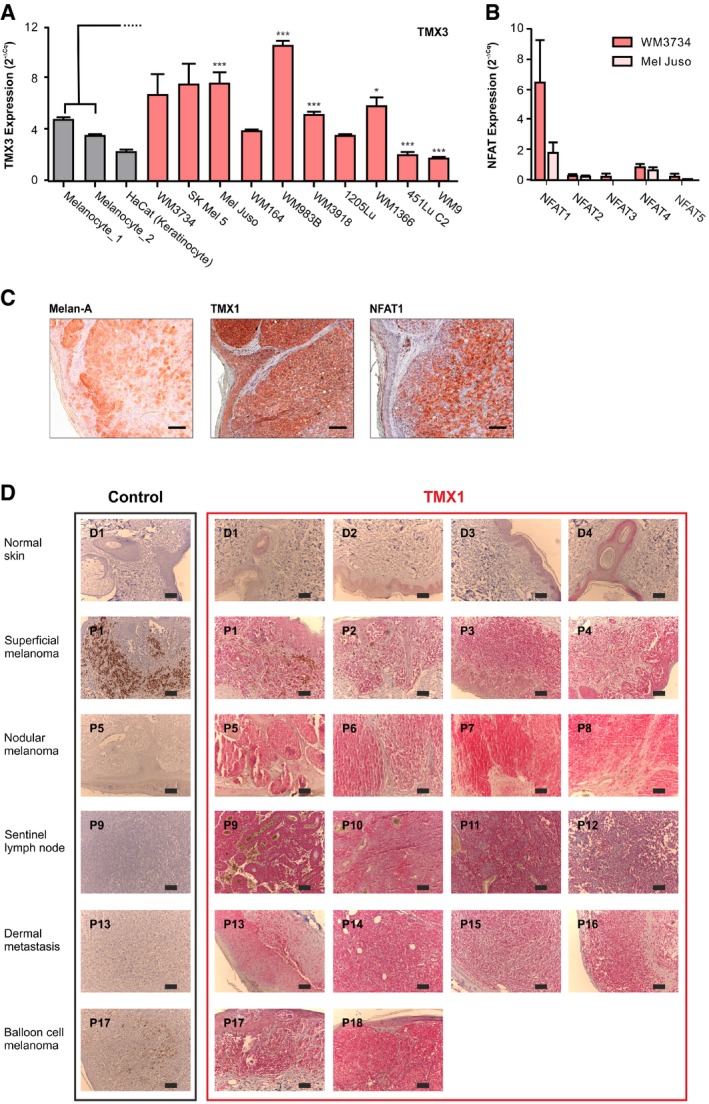
- mRNA expression of TMX3 was quantified by RT–qPCR in melanocytes from two donors, in keratinocytes, and in a panel of genetically distinct melanoma cell lines.
- mRNA expression of NFAT isoforms in melanoma.
- Melan‐A, TMX1, and NFAT1 staining (IHC) in nodular melanoma patient II (out of four).
- TMX1 and NFAT1 staining (IHC) of paraffin‐embedded samples of healthy human tissue (donors D1–D4) and progressing stages of melanoma (patient numbers P1–P18).
To explore the clinical relevance of TMX1 and NFAT1, we analyzed their abundance in samples from human melanoma patients compared to normal human skin using immunohistochemistry (IHC). In Fig 1D, we examined TMX1 and NFAT1 expression in healthy skin melanocytes (panels 1, 4, and 7, left) and in a melanoma lesion (panels 1, 4, and 7, right) of a patient diagnosed with nodular melanoma (tumor thickness ≥ 4 mm). Figure 1D shows that melanocytes, positive for Melan‐A (panels 1 and 2, brown staining; see arrows), express moderate levels of TMX1 (panels 4 and 5, red‐brown staining). The images shown in panels 7 and 8 indicate that NFAT1 is not expressed in the melanocytes within the basal epidermal layer nor in the epidermal keratinocytes. Our IHC analysis also shows that melanoma cells are positive for Melan‐A (panel 3, brown staining) as well as for TMX1 (panel 6, red‐brown staining) and NFAT1 (panel 9, deep red staining). A similar pattern of expression for Melan‐A, TMX1, and NFAT1 is found in a second patient with nodular melanoma (Fig EV1C; tumor thickness ≥ 4 mm). To test if the expression patterns of TMX1 and NFAT1 correlate with melanoma stage, we performed IHC to compare their abundance in progressively aggressive tissues. Our samples featured healthy skin, a nevus, melanoma in situ, melanoma patient samples with tumor thickness lower than 2 mm (less aggressive), samples with thickness higher than 4 mm (more aggressive), and metastatic melanoma (highly aggressive). The images in Fig 1E indicate that TMX1 (red‐brown staining) abundance starts to increase in melanoma in situ [patients 3 and 4 (P3 and P4)] and remains relatively high in the more aggressive melanoma stages (P5–P13). On the other hand, NFAT1 is absent in healthy skin and melanocytic nevi as well as in melanoma in situ and two out of three melanomas with thickness lower than 2 mm (P1–P6). One melanoma with thickness lower than 2 mm was positive for NFAT1 (deep red staining) as well as the samples from the more aggressive melanoma stages (P7–P13). These findings confirmed the expression analysis obtained from the melanoma cell line panel and suggested that melanoma aggressiveness correlates with TMX1 and NFAT1 expression levels. In an additional set of patient samples, we tested the expression of TMX1 based on melanoma staging (Fig EV1D), which confirmed our findings regarding the high expression of TMX1 in increasingly aggressive melanomas. Collectively, our diverse cell line and patient data depicted in Figs 1 and EV1 show a frequent and significant increase in TMX1, TMX3, and NFAT1 expression in melanoma, which correlates with disease stage.
NFAT1 nuclear translocation is impaired in TMX‐silenced melanoma cells
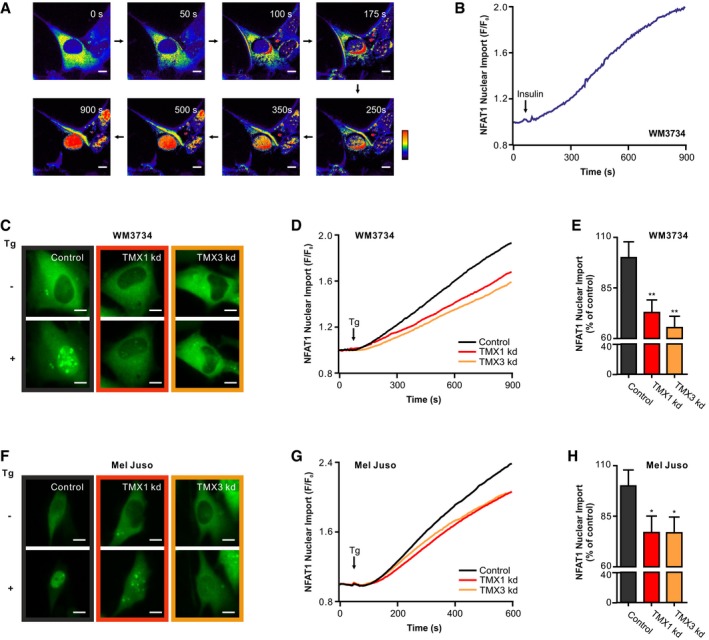
Given that the interplay between TMX1, TMX3, and NFAT1 in melanoma has not been investigated so far and was only indirectly suggested by a whole‐genome siRNA screen (Sharma et al, 2013), we explored their connection in more detail. Therefore, we used a GFP‐tagged NFAT1 construct to track its nuclear translocation, using time‐lapse fluorescence microscopy. We monitored NFAT1 nuclear translocation in WM3734 melanoma cells following stimulation with insulin (50 μg/ml), which induces SOCE (Fig 2A and B). The data indicate that physiologically, melanoma cells readily respond to SOCE with NFAT1 translocation to the nucleus. Next, we silenced TMX1 or TMX3 and monitored NFAT1 translocation in two melanoma cell lines. To obtain a more robust readout, we henceforth used the SERCA pump inhibitor, thapsigargin (Tg, 1 μM), which activates SOCE by passively depleting the ER Ca2+ stores (Lytton et al, 1991). Due to the high expression of TMX1, TMX3, and NFAT1, we selected WM3734 as a primary cell line for this study. The second line chosen was Mel Juso, which expresses high levels of both TMX1 and TMX3 and moderate amounts of NFAT1 (see Figs 1 and EV1). An additional reason for selecting these cell lines is to take into account different BRAF mutational backgrounds. To this end, WM3734 carries the BRAF V600E mutation while the Mel Juso line is BRAF wild type (WT). Later in the study, we expand the cell line panel to include 1205Lu, due to their highly aggressive behavior in animal xenografts, and WM1366, due to their NFAT1‐negative status (see Appendix Table S1 for additional information on the melanoma cell lines used in this study).
Figure 2. TMX1 or TMX3 silencing impairs NFAT1 nuclear translocation in melanoma cells.
-
A, BInsulin (50 μg/ml) induced the translocation of NFAT1‐GFP to the nucleus of WM3734 cells. (A) Ratio images (F/F 0); (B) corresponding endpoint quantification (n = 5).
-
C–HReduced nuclear translocation of NFAT1‐GFP in TMX1‐ or TMX3‐silenced (siRNA) melanoma cells. (C) Images show NFAT1‐GFP fluorescence intensity before and after stimulation with thapsigargin (Tg; 1 μM) in WM3734 cells. (D) Corresponding time‐dependent nuclear import of NFAT1 as a change of F/F 0. (E) Normalized endpoint quantification. The same analysis was performed with Mel Juso cells with (F) images, (G) time‐dependent nuclear import, and (H) normalized endpoint quantification.
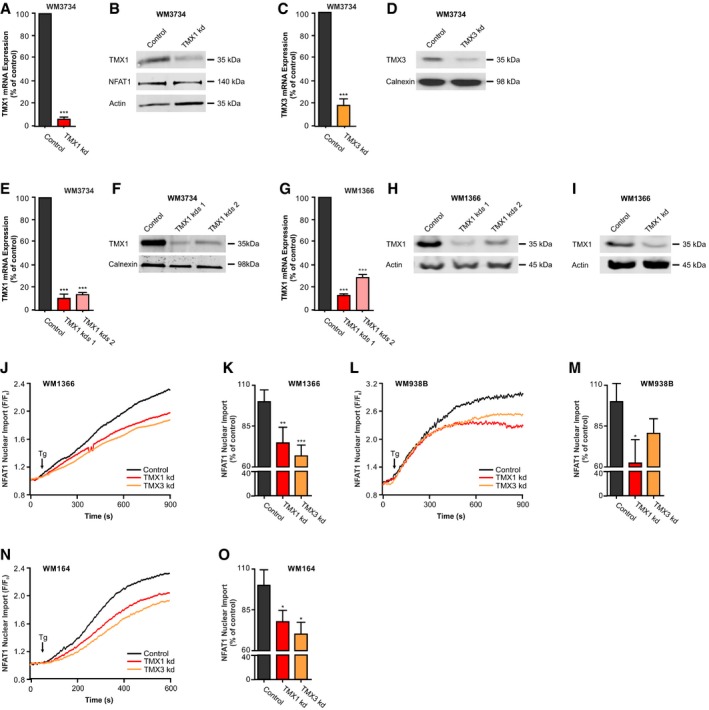
To examine the role of TMX1 and TMX3 in melanoma cells, we used siRNA (transient, kd) and shRNA (stable, kds) to downregulate gene expression. Knockdown efficiency was confirmed by immunoblots and qPCR analyses (Fig EV2A–I). Figure 2C–E shows that WM3734 cells silenced for TMX1 (red) or TMX3 (orange) have reduced NFAT1 nuclear translocation by 30–40%. Similar observations apply to Mel Juso (Fig 2F–H), WM1366 (Fig EV2J and K), WM983B (Fig EV2L and M), and WM164 (Fig EV2N and O), examined for their different genetic backgrounds (Appendix Table S1). In summary, the data shown in Figs 2 and EV2 indicate that NFAT1 nuclear translocation is influenced by the levels of TMX oxidoreductases in melanoma cells.
Figure EV2. Transient and stable downregulation of TMX1 and TMX3, and NFAT translocation.
-
AmRNA expression of TMX1‐silenced WM3734 melanoma cells, quantified by RT–qPCR.
-
BImmunoblot of WM3734 melanoma cells and TMX1‐silenced cells probed for TMX1, NFAT1, and actin as a loading control.
-
CmRNA expression of TMX3‐silenced WM3734 melanoma cells, quantified by RT–qPCR.
-
DImmunoblot of WM3734 melanoma cells and TMX3‐silenced cells probed for TMX3 and calnexin.
-
EmRNA expression of WM3734 melanoma cells with stable knockdown of TMX1 (two clones), quantified by RT–qPCR.
-
FImmunoblot of WM3734 melanoma cells with stable knockdown of TMX1 (two clones) probed for TMX1 and calnexin.
-
GmRNA expression of WM1366 melanoma cells with stable knockdown of TMX1 (two clones), quantified by RT–qPCR.
-
HImmunoblot of WM1366 melanoma cells with stable knockdown of TMX1 (two clones) probed for TMX1 and actin.
-
IImmunoblot of WM1366 melanoma cells with transient knockdown of TMX1 probed for TMX1 and actin.
-
J–ONuclear translocation of NFAT1‐GFP in TMX1‐ or TMX3‐silenced (siRNA) melanoma cells after stimulation with thapsigargin in Ringer's buffer with 1 mM Ca2+. Time‐dependent nuclear import of NFAT1 in WM1366 (J), WM938B (L), and WM164 (N); corresponding normalized endpoint quantification (K, M, and O).
TMX1 silencing does not affect SOCE but increases ROS production
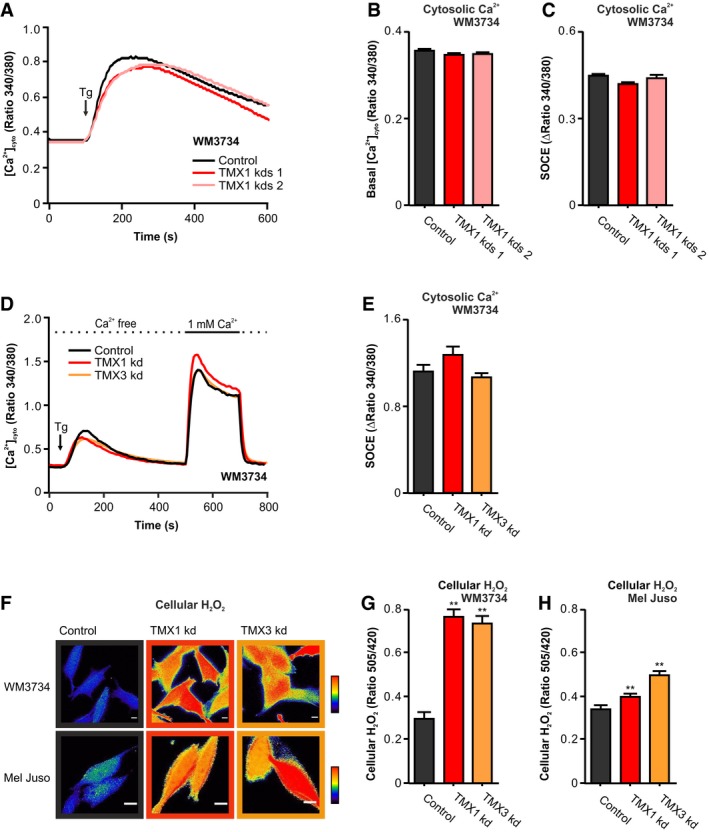
Because intracellular Ca2+ and SOCE regulate NFAT1 activity, and we had previously implicated TMX1 in intracellular Ca2+ signaling (Raturi et al, 2016), we measured cytosolic Ca2+ dynamics in TMX‐silenced WM3734 cells using two different protocols and two different sensors (Figs 3A–E and EV3A–C). Cells were treated with Tg in order to induce Ca2+ release from the ER and thus initiate STIM/ORAI‐mediated Ca2+ entry across the plasma membrane (PM). The data shown in Figs 3A–E and EV3A–C display no overt effects of TMX silencing on SOCE in melanoma cells. These results suggested that alterations in TMX expression control NFAT1 translocation through an alternative molecular mechanism.
Figure 3. Silencing of TMX1 or TMX3 causes ROS production.
-
A–C(A) Thapsigargin (Tg)‐induced Fura‐2‐based cytosolic Ca2+ imaging in Ringer's buffer containing 0.25 mM Ca2+. (B) Quantification of basal cytosolic calcium levels and (C) SOCE quantification (plateau–basal) for WM3734 after stable silencing of TMX1 (two clones).
-
D, E(D) Cytosolic Ca2+ imaging (Fura‐2) and (E) SOCE quantification (plateau–basal) for WM3734 after transient silencing of TMX1 or TMX3.
-
F–HCellular H2O2 (HyPer) was evaluated in two melanoma cell lines upon TMX1 kd and TMX3 kd. (F) Exemplary ratiometric images (F 505 nm/F 420 nm) are shown for WM3734 and Mel Juso. Quantification of basal cellular H2O2 in WM3734 (G) and Mel Juso (H) cells.
Figure EV3. Calcium, H2O2 and pH measurements, H2O2 and TMX1 expression correlation, NFAT1 translocation, antioxidants, and calcineurin activity.
-
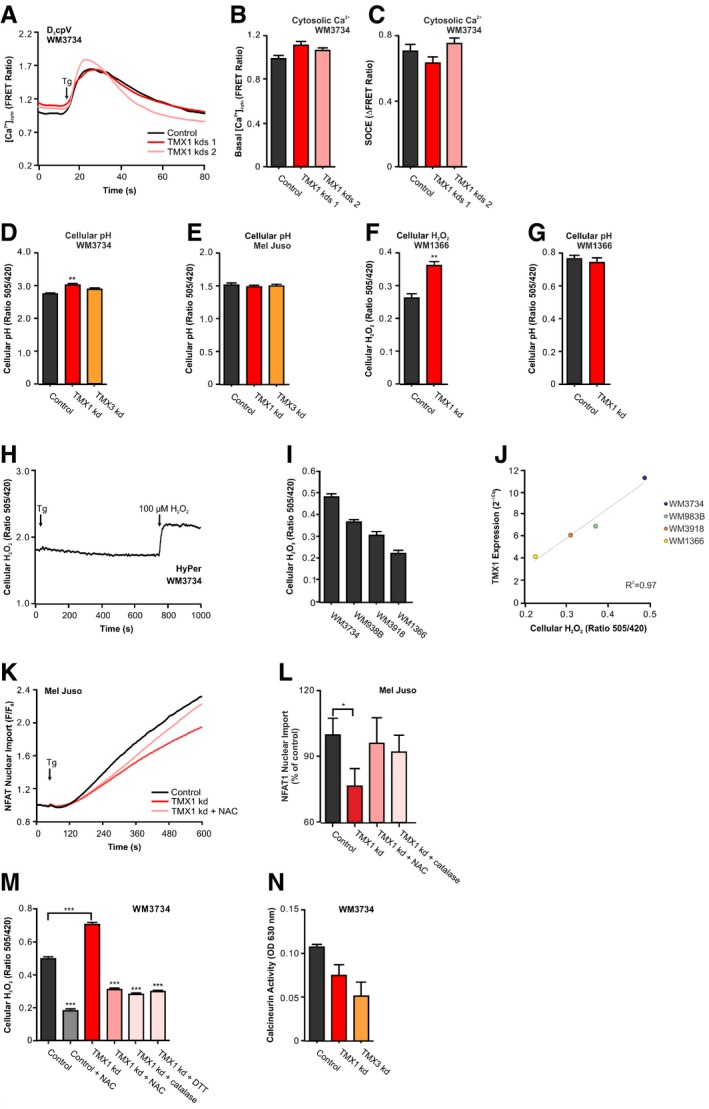
A–C(A) Cytosolic calcium after stimulation with thapsigargin in Ringer's buffer with 0.25 mM Ca2+ measured with the FRET sensor D3cpV. (B) Quantification of basal cytosolic calcium levels and (C) SOCE quantification (plateau–basal) for WM3734 after stable silencing of TMX1 (two clones).
-
D, ECellular pH was measured using the H2O2‐insensitive but pH‐sensitive SypHer 48 h after silencing of TMX1 or TMX3 in WM3734 (D) and Mel Juso cells (E).
-
F, GCellular H2O2 (F) and cellular pH (G) in WM1366 after transient knockdown of TMX1.
-
HCellular H2O2 was measured with HyPer after stimulation with thapsigargin (1 μM); additionally, 100 μM H2O2 was added for maximal oxidation.
-
ICellular ROS were measured in melanoma cell lines using HyPer.
-
JCorrelation between TMX1 expression and cellular H2O2 measured with HyPer. Expression data are from Fig 1A.
-
K, LNFAT1‐GFP nuclear import was induced by thapsigargin (Tg; 1 μM) in TMX1‐silenced Mel Juso cells and after pre‐incubation with 100 μM N‐acetyl‐L‐cysteine (NAC) for 48 h (K). Quantification of the data from (K) and upon treatment with PEG‐catalase (50 U/ml) (L).
-
MCellular H2O2 was measured with HyPer 25 min after treatment with antioxidants (NAC: 100 μM; catalase: 50 U/ml; DTT 2 mM).
-
NCalcineurin activity in WM3734 melanoma cells was measured with an enzymatic assay, 48 h after siRNA transfection.
TMXs are oxidoreductases found in the ER MAM domains and can thus influence the cellular redox state by affecting ER–mitochondria interactions. Hence, we next investigated the cellular ROS levels following TMX silencing. For this purpose, we used the genetically encoded protein sensor HyPer to measure overall H2O2 levels (Bilan et al, 2013; Gibhardt et al, 2016). Our data show a significant increase in cellular H2O2 levels in the TMX1 (red)‐ and TMX3 (orange)‐silenced WM3734 and Mel Juso melanoma cells (Fig 3F–H). To exclude the effects of pH from our results, we used the control SypHer sensor, which is a redox‐insensitive but pH‐sensitive form of HyPer (HyPer‐C199S; Poburko et al, 2011). Figure EV3D and E shows that cellular pH is not altered following TMX silencing. In addition, TMX1 silencing caused a moderate, but significant, increase in H2O2 levels in the NFAT1‐negative WM1366 cells, with no effect on the cellular pH (Fig EV3F and G). To evaluate the effect of Ca2+‐store depletion on cellular redox state, we quantified H2O2 levels upon stimulation with Tg. Figure EV3H demonstrates that acute Tg stimulation has no significant effect on the cellular H2O2 production (see Tg arrow).
Our findings point toward an important role for TMX oxidoreductases as regulators of cellular redox state. To test this hypothesis, we measured H2O2 levels in a number of genetically distinct melanoma cells and correlated these values with TMX1 mRNA levels. Figure EV3I and J demonstrates a strong correlation between TMX1 expression levels and the resting H2O2 levels.
Summarizing, we show that TMX1 and TMX3 are important regulators of the cellular redox state; TMX downregulation leads to an increase in cellular ROS levels in NFAT1‐positive as well as in NFAT1‐negative melanoma cells.
ROS inhibit NFAT1 via oxidation of calcineurin
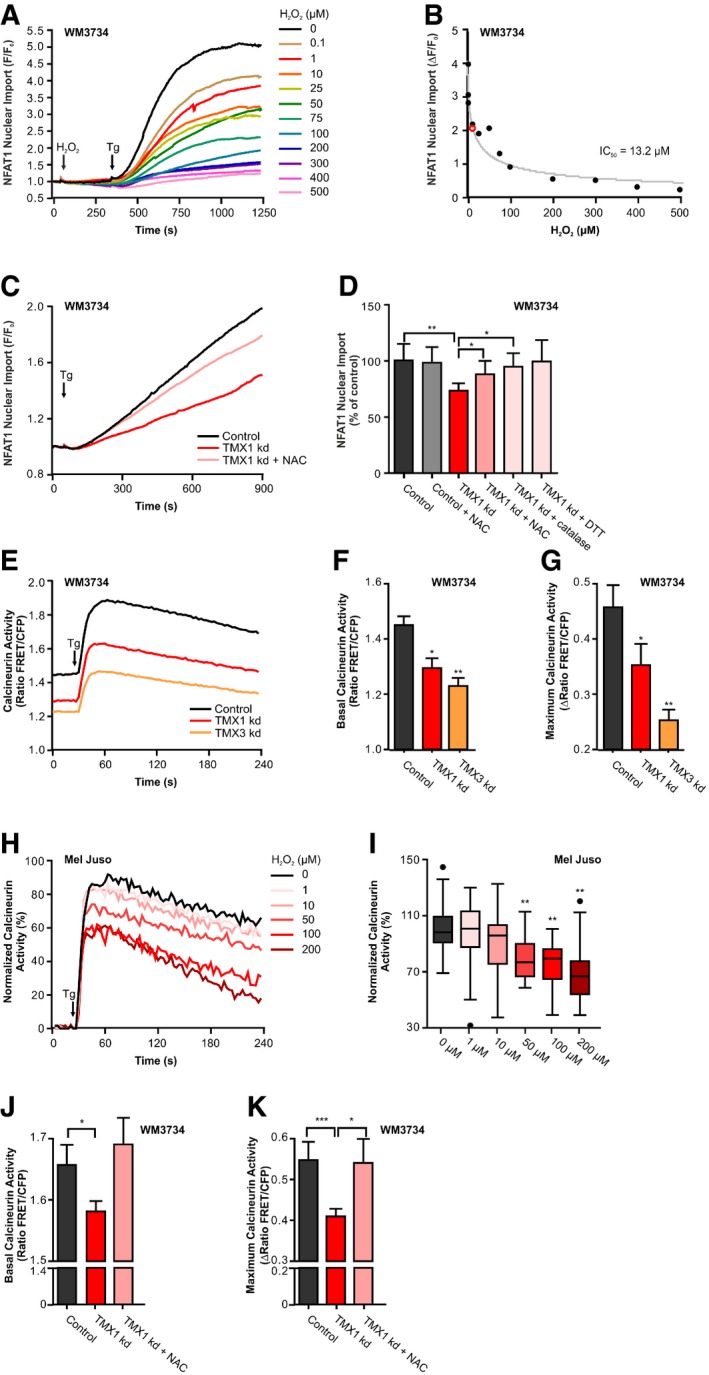
We next examined the mechanism behind the inhibition of NFAT1 translocation following TMX knockdown. NFAT1 in its inactive form resides in the cytosol (Rao et al, 1997). Accordingly, we asked if the increased oxidative environment within the cytosol caused by altered TMX expression could be responsible for NFAT1 inhibition. To test this hypothesis, we exposed WM3734 cells overexpressing NFAT1‐GFP to increasing doses of H2O2 and imaged Tg‐induced NFAT1 translocation. Figure 4A demonstrates that H2O2 inhibits NFAT1 translocation in a concentration‐dependent manner. Evaluation of the data revealed an H2O2 IC50 value of approximately 13 μM for WM3734 cells (Fig 4B). To further examine the oxidant‐induced inhibition of NFAT1, we monitored NFAT1 translocation in TMX1‐silenced WM3734 cells in the absence (red) and presence (light red) of the antioxidant N‐acetyl‐l‐cysteine (NAC; Fig 4C), PEG‐catalase (a H2O2 scavenger), and dithiothreitol (DTT, a reducing agent). Figure 4D shows that all agents interfering with oxidative protein modifications or elimination of ROS reversed the effect of TMX1 silencing on NFAT1. These findings were further confirmed in Mel Juso cells (Fig EV3K and L). To evaluate the effects of antioxidants on HyPer oxidation status, we treated the TMX‐silenced cells with NAC, PEG‐catalase, and DTT. Figure EV3M shows that antioxidants cause the reduction of the HyPer sensor and thus support the role of H2O2 in the TMX silencing‐induced NFAT1 inhibition.
Figure 4. ROS inhibit NFAT1 translocation via oxidation of calcineurin.
-
AWM3734 cells were pre‐incubated for 5 min with extracellular H2O2 (0–500 μM). Tg‐stimulated NFAT1‐GFP nuclear translocation was measured as F/F 0.
-
BThe IC50 of H2O2 inhibition of NFAT1 nuclear import was determined to be 13.2 μM (red mark).
-
CTg‐induced NFAT1‐GFP nuclear import in transient TMX1‐silenced WM3734 cells and after pre‐incubation with 100 μM N‐acetyl‐L‐cysteine (NAC) for 48 h.
-
DEndpoint quantification of the data from (C) and upon treatment with NAC, PEG‐catalase (50 U/ml), or DTT (1 mM).
-
ECytosolic calcineurin activity (CaNAR2) in WM3734 cells with transient knockdown of TMX1 or TMX3 measured upon Tg stimulation.
-
F, GQuantification of the basal calcineurin activity and the maximal calcineurin activity (plateau–basal).
-
GNormalized Tg‐induced cytosolic calcineurin activity in Mel Juso cells after 5‐min pre‐incubation with extracellular H2O2 (0–200 μM).
-
HQuantification of the maximum cytosolic calcineurin activity (plateau–basal).
-
IQuantification of the basal calcineurin activity and the maximal calcineurin activity (plateau–basal) 8 h after treatment with the antioxidant NAC (100 μM) in WM3734 with transient knockdown of TMX1.
Oxidation can affect NFAT1 translocation by targeting different proteins involved in NFAT1 signaling, i.e., calmodulin, calcineurin, or NFAT1 itself. Protein phosphatases are often sensitive and are inhibited by oxidation (Denu & Tanner, 1998). We therefore focused on the role of calcineurin in TMX‐silenced cells using a genetically encoded sensor of calcineurin activity (CaNAR2; Mehta et al, 2014). Our data show that the basal (resting) and the Tg‐induced calcineurin activity are suppressed in TMX‐silenced WM3734 melanoma cells (Fig 4E–G). The responsiveness of CaNAR2 was tested by exposing melanoma cells overexpressing the sensor to increasing doses of H2O2; Fig 4H and I display concentration‐dependent sensitivity of CaNAR2 to H2O2. Using an alternative commercially available calcineurin activity assay, we confirmed that TMX knockdown inhibits calcineurin in melanoma cells (Fig EV3N). Similar to the NFAT1 translocation results, NAC reversed the TMX1 silencing‐induced calcineurin inhibition (Fig 4J and K). In sum, Fig 4 suggests that oxidation‐induced inhibition of calcineurin activity plays an important role in the inhibition of NFAT1 following TMX downregulation.
Mitochondria and NADPH oxidase 4 are sources for ROS
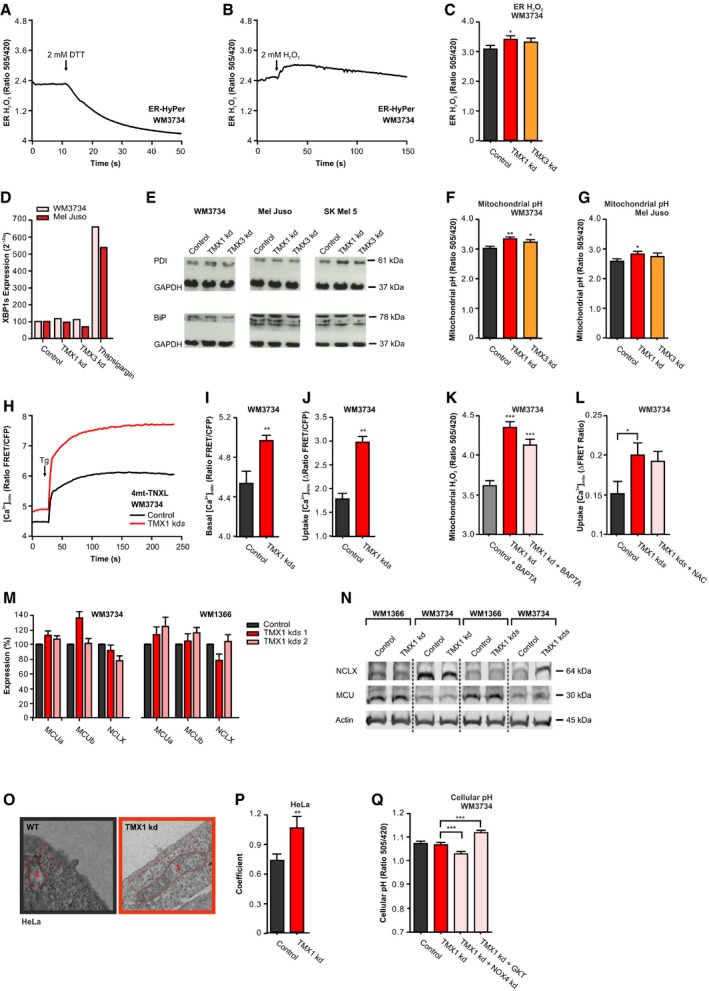
We next wanted to understand how TMX oxidoreductases control ROS production and therefore NFAT1 nuclear translocation. Given that TMX oxidoreductases reside in the ER, we examined if TMX downregulation leads to elevated ROS levels in this organelle. Due to the highly oxidizing environment within the lumen of the ER, measurements of ER ROS are difficult; nevertheless, ER‐targeted roGFP and HyPer sensors have successfully been used in the past (van Lith et al, 2011; Santos et al, 2016). Hence, we overexpressed HyPer targeted to the ER and measured ER H2O2 in control and TMX1‐silenced WM3734 cells. As expected, DTT treatment caused significant reduction in the HyPer ratio, suggesting that the majority of the sensor molecules are in an oxidized state (Fig EV4A). However, addition of external H2O2 caused a small elevation in the signal, indicating that ER‐HyPer was not fully oxidized (Fig EV4B). Based on these control experiments, we tested the effects of TMX1 on the ER H2O2 levels and found that TMX1 or TMX3 silencing causes a slight increase in H2O2 within the ER lumen (Fig EV4C). Given that elevated ER H2O2 is often connected with disturbed ER function, we evaluated ER stress by quantifying the splicing product of X‐box binding protein 1 (XBP1s) mRNA levels as well as protein disulfide isomerase (PDI) and binding immunoglobulin protein (BiP) abundance in melanoma cells after TMX silencing. The results shown in Fig EV4D and E indicate no apparent ER stress in TMX‐silenced cells and hint toward an alternative source of ROS within the ER or its vicinity.
Figure EV4. ER H2O2, ER stress, mitochondrial Ca2+ uptake, MCU, NCLX, and EM of mitochondria–PM contacts.
-
AER‐HyPer measurements before and after reduction with 2 mM DTT.
-
BER‐HyPer measurements before and after oxidation with 2 mM H2O2.
-
CROS levels were measured with ER‐targeted HyPer in WM3734 cells with transient knockdown of TMX1 or TMX3.
-
DmRNA expression of XBP1s in melanoma cells, 48 h after TMX1 or TMX3 knockdown. The positive control was treated for 4 h with thapsigargin (1 μM) to induce ER stress.
-
EImmunoblot of melanoma cells stained for protein disulfide isomerase (PDI) and the ER stress marker immunoglobulin heavy chain‐binding protein (BiP); GAPDH was used as loading control.
-
F, GMitochondrial pH was measured using the H2O2‐insensitive but pH‐sensitive mito‐SypHer, 48 h after silencing of TMX1 or TMX3 in WM3734 (F) and Mel Juso cells (G).
-
H–JMitochondrial Ca2+ uptake in WM3734 melanoma cells with stable knockdown of TMX1 measured with the protein sensor 4mt‐TNXL after addition of Ringer's buffer containing 1 mM Ca2+ and stimulation with thapsigargin (Tg, 1 μM) (H). Quantification of basal mitochondrial Ca2+ levels (I) and mitochondrial Ca2+ uptake (plateau–basal) (J).
-
KBasal mitochondrial H2O2 levels measured with mito‐HyPer 8 h after treatment with BAPTA‐AM (10 μM).
-
LMitochondrial Ca2+ uptake (plateau–basal) of WM3734 cells with stable knockdown of TMX1 8 h after treatment with NAC (100 μM) measured with 4mt‐D3cpV in Ringer's buffer containing 0.25 mM Ca2+.
-
MNormalized mRNA expression of MCUa, MCUb (mitochondrial calcium uniporter), and NCLX (mitochondrial Na+‐Ca2+ exchanger) in melanoma cells with stable knockdown of TMX1 (two clones).
-
NImmunoblot of melanoma cells with transient (kd) or stable (kds) knockdown of TMX1 stained for MCU, NCLX, and actin (60 μg protein).
-
O, PRepresentative electron micrographs of control and TMX1 knockdown HeLa cells (O); 1 defines exemplary marked mitochondria. Corresponding quantification of the distance coefficient (see Materials and Methods) (P).
-
QCellular pH was measured in TMX1‐silenced WM3734 with additional knockdown of NOX4 or after inhibiting NOX4 with GKT137831 (140 nM).
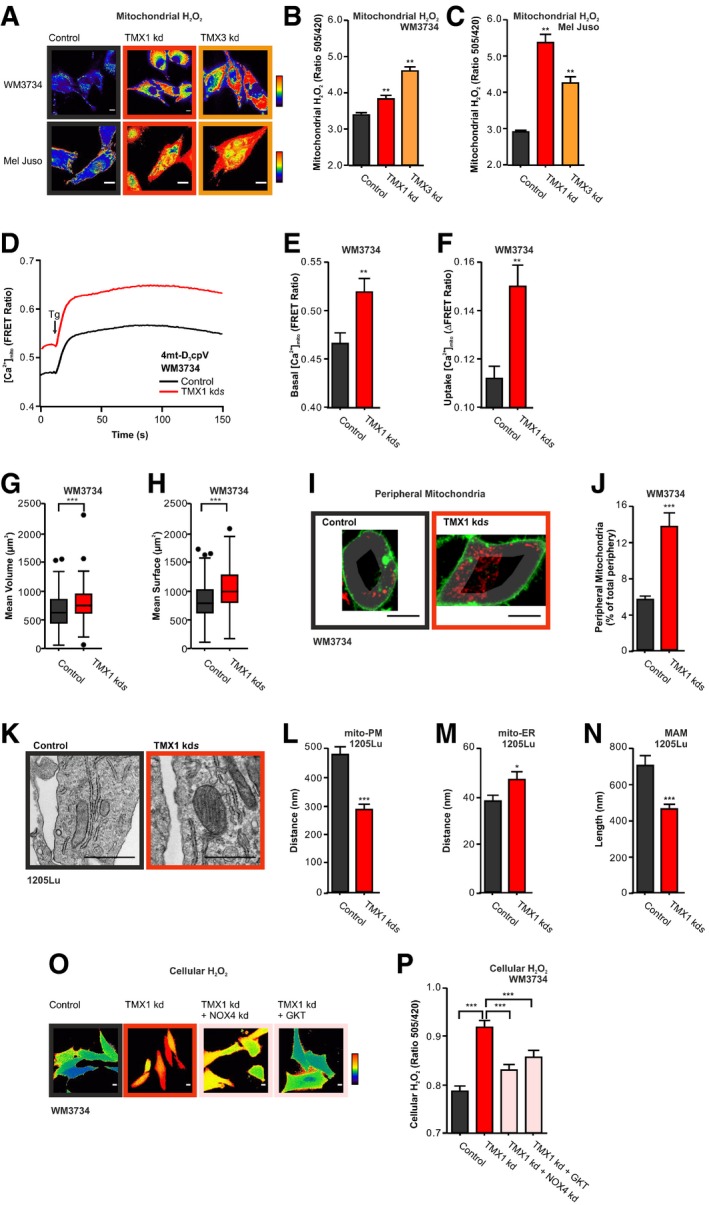
In most cells, mitochondria and NADPH oxidases (NOX) are major sources of superoxide radicals and thereby H2O2 (Bedard & Krause, 2007; Murphy, 2009; Bogeski et al, 2011; Holmstrom & Finkel, 2014). To first explore the role of mitochondria in ROS production, we expressed HyPer in the mitochondrial matrix of WM3734 and Mel Juso melanoma cells and observed that TMX silencing led to an increase in resting mitochondrial H2O2 levels (Fig 5A–C). To exclude pH effects, we used the control SypHer sensor (Fig EV4F and G). Mitochondrial oxidative phosphorylation and thus ROS production are tightly coupled with mitochondrial Ca2+ signaling (Booth et al, 2016). To assess the role of Ca2+ dynamics on mitochondrial ROS production, we measured mitochondrial Ca2+ levels using a genetically encoded Ca2+ sensor (4mt‐D3cpV). We observed that TMX1‐silenced WM3734 cells have increased resting mitochondrial Ca2+ levels as well as increased mitochondrial Ca2+ uptake following concomitant ER Ca2+‐store depletion and SOCE activation using Tg (Fig 5D–F). To confirm these findings, we used an alternative genetically encoded mitochondrial Ca2+ sensor (4mt‐TNXL). Due to the differential Ca2+ sensitivity (Kd value) of the two sensors, the external Ca2+ concentration was elevated from 0.25 to 1 mM Ca2+. Regardless of these parameters, the resting mitochondrial Ca2+ levels as well as the Tg‐induced Ca2+ uptake were elevated following TMX1 downregulation (Fig EV4H–J). To dissect this finding in more detail, we asked if suppression of the mitochondrial Ca2+ uptake by Ca2+ chelators such as BAPTA‐AM would affect the TMX1 silencing‐induced mitochondrial H2O2 production. Figure EV4K shows that inhibition of the mitochondrial Ca2+ uptake only partially reversed the TMX silencing‐induced mitochondrial H2O2 production. To test if redox regulation of the MCU complex (see Petrungaro et al, 2015; Dong et al, 2017) might play a role, we evaluated the effects of NAC on mitochondrial Ca2+ in control and TMX1‐silenced cells. Figure EV4L demonstrates no overt effects of this antioxidant on the TMX1 silencing‐induced mitochondrial Ca2+ elevation. Based on these findings, we next asked if TMX1 silencing might affect the mitochondrial Ca2+ signaling machinery. For this purpose, we evaluated mitochondrial Ca2+ uniporter A and B (MCUa and MCUb) and mitochondrial sodium calcium lithium exchanger (NCLX) expression by qPCR and immunoblotting. Figures EV4M and N show no overt, i.e., consistent, differences in MCUa, MCUb, and NCLX expression following TMX1 downregulation in WM3734 and WM1366 cells. Collectively, these data indicated that elevated mitochondrial Ca2+ plays a role but is not the only cause for enhanced ROS production following TMX downregulation. To identify alternative causes that lead to elevated mitochondrial ROS in TMX1‐silenced cells, we examined mitochondrial morphology, dynamics, and intracellular positioning using 3D confocal fluorescence microscopy. Our findings indicate that disturbing the ER–mitochondria communication through TMX1 downregulation increases mitochondrial surface and volume (Fig 5G and H). Moreover, by calculating the area occupied by mitochondria within the plasma membrane periphery, we observed a significant increase in mitochondria in the vicinity of the PM in the TMX1 knockdown WM3734 cells (see Figs 5I and J, and 9A–E for details). In addition, electron microscopy of 1205Lu melanoma cells confirmed and expanded these findings by demonstrating that downregulation of TMX1 leads to reduced distances between mitochondria and the PM, shorter MAMs, and larger distances between mitochondria and the ER (Fig 5K–N). In addition, electron microscopy of HeLa cells confirmed the role of TMX1 in altering mitochondrial morphology and mitochondrial positioning relative to the ER and PM (Fig EV4O and P). Collectively, the data in Fig 5A–N indicate that interference with ER–mitochondria communication through TMX1 downregulation induces elevated ROS production through mitochondrial Ca2+ overload and via alterations in mitochondrial morphology and a shift of their intracellular positioning into the proximity of the plasma membrane.
Figure 5. TMX1 silencing causes elevated ROS via mitochondria and NADPH oxidase 4.
-
A–CMitochondrial H2O2 (mito‐HyPer) was measured in two cell lines upon transient TMX knockdown. Exemplary ratiometric images (F 505 nm/F 420 nm) are shown (A); corresponding quantification for (B) WM3734 and (C) Mel Juso.
-
D–FMitochondrial Ca2+ uptake in WM3734 with stable TMX1 knockdown was measured using a mitochondria‐targeted calcium sensor (4mt‐D3cpV) (D). Cells were exposed to 0.25 mM Ca2+ containing Ringer's buffer and Tg. (E) Quantification of basal mitochondrial Ca2+ levels and (F) mitochondrial Ca2+ uptake (basal–plateau).
-
G, HMitochondrial volume was determined using MitoTracker Deep Red in WM3734 cells with stable knockdown of TMX1. The mean mitochondrial volume was modeled based on microscopy, and the quantification of mean volume (μm3) and mean surface (μm2) is depicted in (G) and (H), respectively.
-
I, JPeripheral mitochondria were quantified in WM3734 cells with stable knockdown of TMX1. A peripheral mask was applied based on the membrane staining (CellMask Green), and mitochondria covered area (MitoTracker Deep Red) was evaluated (see Fig 9). Representative images (I) and quantification (J).
-
K–NRepresentative electron micrographs of control and 1205Lu cells with stable TMX1 knockdown (K). Corresponding quantification of the distance between (L) mitochondria and the plasma membrane, (M) mitochondria and the ER, and (N) the length of the MAM (mitochondria–ER contact site).
-
O, PCellular H2O2 concentration (HyPer) 48 h after transient silencing of TMX1 and/or NOX4 in WM3734 cells or after inhibiting NOX4 with GKT137831 (140 nM) (O) Representative ratiometric images (F 505 nm/F 420 nm) and (P) quantification.
An alternative source of ROS, and thereby H2O2, within cells are the NADPH oxidases. NADPH oxidase 4 (NOX4) is highly upregulated in melanoma and absent in healthy skin (Yamaura et al, 2009; Meitzler et al, 2017) and the interaction between TMX proteins and NOX4 was previously reported, proposing the presence of NOX4 within the MAM domains (Prior et al, 2016). Hence, we examined the impact of NOX4 on cellular ROS production in TMX1‐silenced cells with the H2O2 sensor HyPer. As shown before (see Figs 3 and EV3), cellular ROS levels were elevated in TMX1‐silenced cells. This increase is mitigated if NOX4 expression is silenced or if protein function is suppressed with the NOX4 inhibitor GKT137831 (Fig 5O and P); pH changes do not contribute as shown with the control sensor SypHer (Fig EV4Q).
Summarizing, our data suggest two sources for elevated ROS upon TMX1 knockdown: first, the mitochondria through elevated Ca2+ and altered morphology, positioning, and architecture; and second, the ER via enhanced NOX4 activity.
TMX1, TMX3, and NFAT1 affect melanoma aggressive behavior
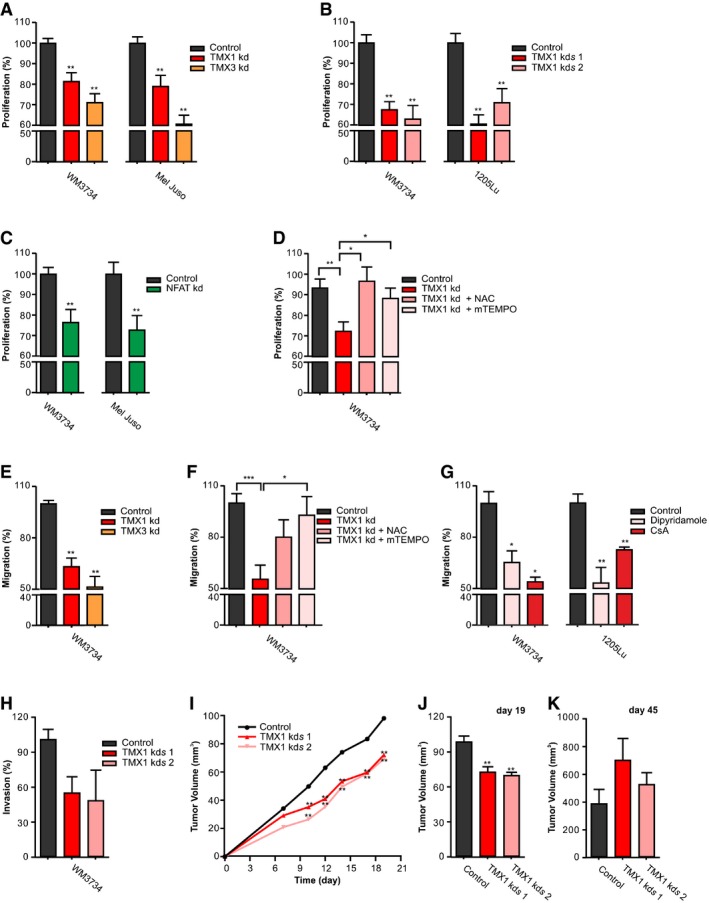
To investigate the functional relevance of the TMX–ROS–NFAT1 axis on melanoma cell behavior, we examined the role of TMX1, TMX3, and NFAT1 in proliferation and migration. As shown in Fig 6A, cell proliferation was significantly decreased in the two TMX1 (red)‐ or TMX3 (orange)‐silenced melanoma cell lines. Consistent with these data, long‐term knockdown of TMX1 using two different shRNAs in two different melanoma cell lines showed a comparable inhibition in proliferation (Fig 6B). These findings suggested a contribution of TMX1 and TMX3 to aggressive cancer cell behavior and supported the patient data shown in Figs 1 and EV1.
Figure 6. TMX1, TMX3, and NFAT1 control melanoma proliferation and invasion.
-
AProliferation (48 h) of melanoma cell lines measured after transient knockdown of TMX1 or TMX3.
-
BProliferation (48 h) of melanoma cell lines with stable TMX1 knockdown (two clones).
-
CProliferation (24 h) of melanoma cell lines after transient knockdown of NFAT1.
-
DProliferation of WM3734 48 h after transient knockdown of TMX1 and treatment with NAC (100 μM) or mTEMPO (100 nM).
-
ETranswell migration (48 h) of WM3734 after transient knockdown of TMX1 or TMX3.
-
FTranswell migration (48 h) of WM3734 after transient knockdown of TMX1 and treatment with NAC (100 μM) or mTEMPO (1 μM).
-
GTranswell migration (48 h) of melanoma cell lines after preventing NFAT–calcineurin interaction with dipyridamole (40 μM) or inhibition of calcineurin with cyclosporine A (CsA, 2 μM).
-
HInvasion of WM3734 with stable TMX1 knockdown (two clones) through Matrigel for 96 h.
-
I–KMouse xenograft model to assess tumor growth of WM3734 with stable TMX1 knockdown (TMX1 kds; two clones) in immunodeficient mice. (I) Tumor growth in the first 19 days after injection; (J) the corresponding tumor volume quantified after 19 days and (K) after 45 days.
We next suppressed NFAT1 expression to examine if targeting downstream of TMX1 causes similar results. Figure 6C shows that NFAT1 silencing reduces the proliferation of the two melanoma cell lines tested. Furthermore, we treated two melanoma lines with dipyridamole, a drug that prevents NFAT1–calcineurin interaction, and observed a concentration‐dependent reduction in melanoma cell growth (Fig EV5A). Figures 6A–C and EV5A suggest that TMX1, TMX3, and NFAT1 promote melanoma proliferation. To investigate the role of ROS in the TMX silencing‐induced inhibition of melanoma cell proliferation, we treated the knockdown cells with NAC and mitochondria‐targeted mTEMPO. The results presented in Fig 6D show that antioxidants reverse the “negative” effect of TMX silencing on melanoma cell growth and thus support the central role of ROS in the TMX‐mediated control of melanoma behavior. Next, we assessed how TMX1, TMX3, and NFAT1 affect melanoma cell migration. Figure 6E shows that silencing of TMX1 or TMX3 reduces melanoma cell migration potential. Similar as for the proliferation data, antioxidant treatment abrogated the “negative” effects of TMX silencing on melanoma's migration potential (Fig 6F). Moreover, inhibition of the calcineurin–NFAT interaction by dipyridamole as well as calcineurin inhibition by cyclosporine A suppressed the migration of two melanoma cell lines (WM3734 and 1205Lu; Fig 6G). To compare the role of TMX oxidoreductases in NFAT1‐positive and NFAT1‐negative melanoma cells, we silenced TMX1 and TMX3 in WM1366 cells and evaluated cell proliferation and migration as performed in WM3734 and Mel Juso. As shown in Fig EV5B, TMX1 or TMX3 silencing caused a reduction in WM1366 cell growth. However, when compared with WM3734 and Mel Juso cells, this effect was less pronounced (10% vs. 19% and 21% for TMX1, and 7% vs. 29% and 39% for TMX3, respectively). The inhibitory effect of TMX silencing on cell migration was less evident in the WM1366 cells (Fig EV5C), supporting the functional importance of NFAT1 in melanoma cell aggressive behavior. To further explore the role of TMX oxidoreductases in melanoma invasion, we used transwell Matrigel‐based invasion assays. The data shown in Fig 6H indicate that TMX1 downregulation inhibits not only WM3734 migration but also invasion potential.
Figure EV5. TMX1, TMX3, BRAF, and NFAT1 in melanoma behavior, adaptation, mitochondrial respiration, melanoma patient survival, and NFAT1 translocation.
-
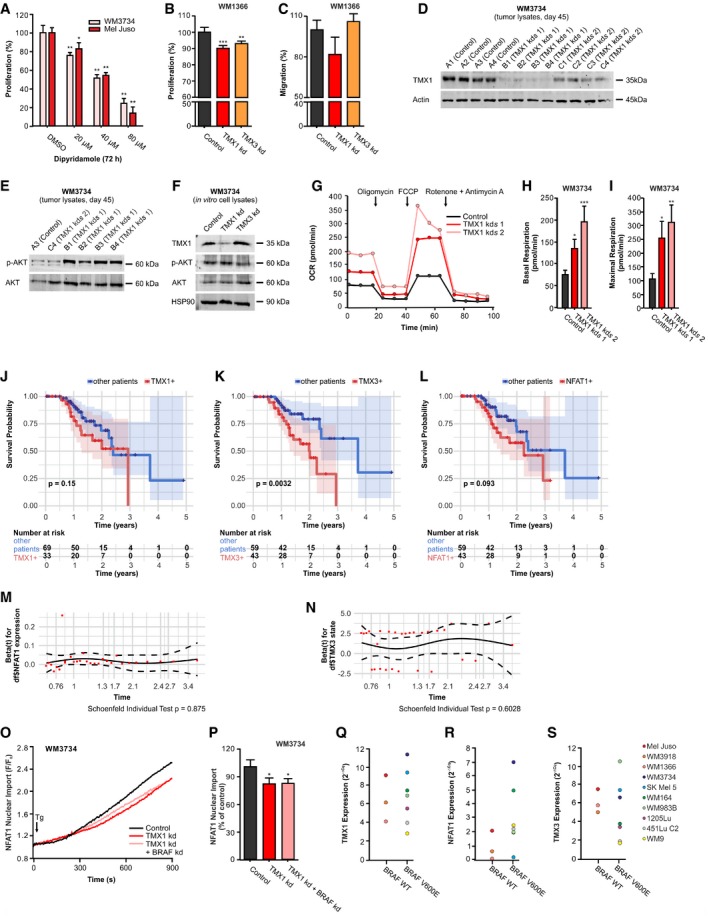
AProliferation (72 h) of melanoma cells after treatment with different concentrations of the drug dipyridamole, which prevents NFAT–calcineurin interaction.
-
BProliferation (48 h) of WM1366 after transient knockdown of TMX1 and TMX3.
-
CTranswell migration (48 h) of WM1366 after transient knockdown of TMX1 and TMX3.
-
DImmunoblot probing for TMX1 and actin in lysates isolated from tumor samples collected 45 days after mouse injection (corresponding to the data shown in Fig 6I–K). Samples labeled with “A” represent the control group, while “B” and “C” represent groups with the two different clones of TMX1 shRNA knockdown.
-
ERepresentative immunoblots of tumor‐extracted lysates probed for phosphorylated AKT (S473) and total AKT.
-
FRepresentative immunoblots for TMX1, phosphorylated AKT (S473), and total AKT expression in lysates extracted from TMX1‐ and TMX3‐silenced WM3734 melanoma cells grown in standard culture conditions. HSP90 was used as a loading control.
-
G–IThe oxygen consumption rate (OCR) was determined in control and stable TMX1 knockdown WM3734 (two clones) seeded in glucose‐containing medium following standard treatment with oligomycin, FCCP, and rotenone + antimycin A (G). The basal respiration (H) and maximal respiration (I) were quantified.
-
J–LKaplan–Meier survival plots and log rank for the correlation between mRNA expression levels and survival probability of melanoma patients, separated in groups with high or low expression of TMX1 (J), TMX3 (K), and NFAT1 (L); shaded areas depict the 95% confidence intervals of the survival probabilities, and significance was assessed using log‐rank tests.
-
M, NSchoenfeld's test for Cox analysis. The P‐values for individual Schoenfeld's test are indicated in the figure (global Schoenfeld's test P = 0.8694).
-
O, PNFAT1‐GFP nuclear import was induced by thapsigargin (Tg; 1 μM) in Ringer's buffer containing 0.25 mM Ca2+ in TMX1‐silenced WM3734 cells with and without additional knockdown of BRAF (O); endpoint quantification (P).
-
Q, SThe role of BRAF mutation status on NFAT1, TMX1, and TMX3 expression in melanoma cells. mRNA levels of TMX1 (Q), NFAT1 (R), and TMX3 (S) in a panel of melanoma cell lines characterized by their BRAF mutation status.
To investigate the role of TMX1 in vivo, we injected control and stable TMX1‐downregulated WM3734 cells (using two different clones) in NOD.Cg‐Prkdcscid Il2rgtm1WjI/SzJ (NSG) mice. Confirmation of TMX1 knockdown in the tumor samples is shown in Fig EV5D. In the first three weeks following s.c. injection, we observed a decrease in tumor growth in the TMX1 knockdown groups, which corresponded with the effects seen in vitro (Fig 6I and J). This effect was no longer present by the end of the experiment as shown in Fig 6K. These results suggested that the cells were initially inhibited by TMX1 knockdown but were able to adapt in vivo over a longer period.
Many parameters such as nutrient supply, antioxidative systems, and oxygen availability could affect bioenergetics, metabolism as well as redox and Ca2+ signaling differently in vitro and in vivo. Figure EV5E and F shows that phosphorylated AKT (Ser473) is upregulated in many tumors lacking TMX1 vs. control, but not in TMX1‐silenced cells grown under standard 2D culture conditions. These data agree with the important role of ROS in regulating the phosphatidylinositide 3‐kinase (PI3K) pathway and highlight one adaptation mechanism employed by melanoma cells to offset TMX expression changes in vivo (Robey & Hay, 2009; Villanueva et al, 2010; Cho et al, 2015). Other long‐term adaptive mechanisms upon TMX silencing could be changes in metabolism and energy handling. To examine this possibility, we measured mitochondrial respiration in stable TMX1‐silenced WM3734 cells (two clones) using a Seahorse analyzer. The data shown in Fig EV5G–I indicate that long‐term downregulation of TMX1 leads to an increase in basal mitochondrial oxygen consumption in the NFAT1‐positive WM3734 cells. Oligomycin treatment showed a robust inhibition of respiration (respiratory control) while uncoupling using FCCP yielded a maximal respiratory rate, which is increased in TMX1‐silenced cells (Fig EV5G–I). Collectively, the data presented in this figure indicate that the TMX–ROS–NFAT1 signaling axis favors melanoma cell behavior toward a more proliferative and invasive phenotype.
NFAT1 regulates tumor‐associated genes and along with TMXs affects disease outcome
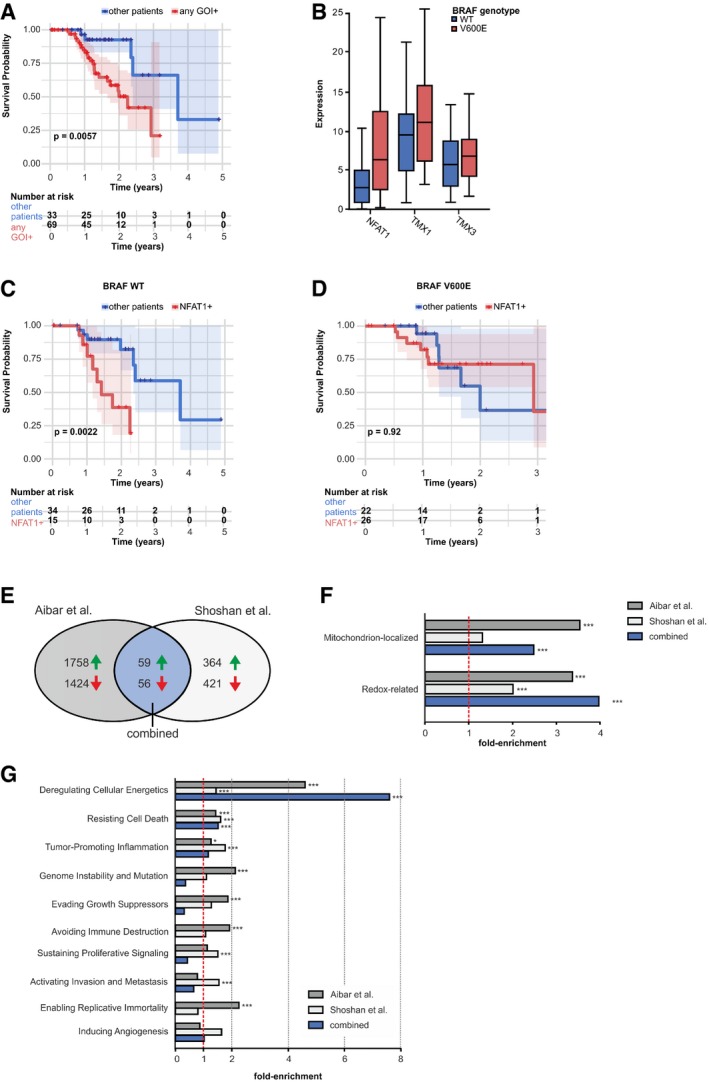
To confirm our functional data and to address the clinical importance of TMX1, TMX3, and NFAT1, we analyzed the relationship between their individual expression levels and disease outcome in patients with cutaneous melanoma, using The Cancer Genome Atlas database (TCGA; https://cancergenome.nih.gov/). Our analyses showed that patients with increased TMX1, TMX3, or NFAT1 expression had significantly lower survival expectancy (log‐rank test, P = 0.006, TCGA Skin Cutaneous Melanoma (SKCM) cohort; Fig 7A). This trend was also apparent when patients were grouped by high expression of the three genes individually (Fig EV5J–L).
Figure 7. NFAT1 regulates tumor‐associated genes, and with TMX and BRAF, it affects disease outcome.
-
AKaplan–Meier survival plots and log rank for the correlation between mRNA expression levels and survival probability of melanoma patients, separated in groups with high or low expression of any of the three genes of interest (GOI): TMX1, TMX3, and NFAT1. For survival probabilities for the individual genes, please refer to Fig EV5.
-
BmRNA expression levels of NFAT1, TMX1, and TMX3 in BRAF WT and BRAF V600E melanoma patients.
-
C, DKaplan–Meier survival plots and log rank for the correlation between mRNA expression levels and survival probability of melanoma patients, separated in groups with (C) BRAF WT and (D) BRAF V600E and with high or low expression of NFAT1.
-
EVenn diagram showing the respective numbers of differentially expressed genes after NFAT1 knockdown.
-
FFrom the differentially expressed genes in (E), mitochondrion‐localized and redox‐related proteins were more than by chance downregulated after NFAT1 knockdown.
-
GDifferentially expressed genes, categorized by Gene Ontology terms annotations covering established hallmarks of cancer, after NFAT1 knockdown, presented as fold‐enrichment.
Besides the discretized expression states, we additionally assessed the information content of the actual FPKM (fragments per kilobase million) values of NFAT1, TMX1, and TMX3 by constructing Cox proportional‐hazards models (Cox, 1972). In univariate models, again the discretized state of TMX3 (hazard ratio (HR) 3.09, 95% confidence interval (CI) 1.41–6.77, P < 0.005), but also the NFAT1 expression (HR 1.02, 95% CI 1.01–1.04, P < 0.05), showed a significant negative impact on patient survival rates (Appendix Table S2). Guided by the univariate results and since the expression of TMX3 and NFAT1 was not correlated in the data (corr = 0.18), we also constructed a predictive multivariate Cox model including both significant covariates (likelihood ratio test, P < 0.005). Both the TMX3 state (HR 2.94, 95% CI 1.33–6.50, P < 0.01) and the NFAT1 expression (HR 1.02, 95% CI 1.00–1.04, P < 0.05) independently contributed to the model significantly, emphasizing the potential use of TMX3 and NFAT1 as prognostic markers (Appendix Table S3). Cox assumptions were valid for the model (see Fig EV5M and N).
Around 50% of all cutaneous melanoma patients carry the BRAF V600E mutation (Schadendorf et al, 2015). Accordingly, we asked if the BRAF status affects the TMX–NFAT1 axis in melanoma. For this purpose, we performed bioinformatic analyses on the TCGA melanoma patient database. As shown in Appendix Table S4, out of 97 patients, 49 were BRAF WT and 48 were BRAF V600E. We first evaluated the effect of BRAF V600E on NFAT1, TMX1, and TMX3 expression levels and found that only NFAT1 transcripts were significantly elevated in patients carrying the BRAF V600E mutation (two‐sided Wilcoxon rank‐sum test P = 0.0007) while TMX1 and TMX3 levels were not significantly affected (Fig 7B). To examine the BRAF–NFAT1 interplay in more detail, we divided the BRAF WT and BRAF V600E groups into NFAT1‐high and NFAT1‐low subgroups (Appendix Table S4). This approach indicated that in the BRAF V600E group, more patients had high NFAT1 (n_high = 26 vs. n_low = 22) compared with the WT group (n_high = 15 vs. n_low = 34, Fisher's exact test, P = 0.024). As shown in Fig 7B, neither TMX1 nor TMX3 showed systematic changes in their expression levels when the BRAF WT and BRAF V600E cohorts were compared. To inspect the clinical relevance of the NFAT1–BRAF relationship, we evaluated the survival probability of the patients categorized as NFAT1‐high vs. the patients categorized as NFAT1‐low in the BRAF WT population. We found that the survival probability is significantly reduced (log‐rank test P = 0.0022) in the patients with high NFAT1 when compared with the patients with low NFAT1 (Fig 7C). We performed the same analysis in the BRAF V600E patient group and found that in this case, NFAT1 status was not as relevant (Fig 7D). In addition, downregulation of BRAF in the WM3734 cells did not significantly affect the TMX1 silencing‐induced inhibition of NFAT1 nuclear translocation (Fig EV5O and P). Moreover, the qPCR‐based correlational analysis of the BRAF status and NFAT1, TMX1, and TMX3 expression in the panel of cell lines used in this study (Fig EV5Q–S) showed a similar relationship as for the melanoma patients, i.e., increased NFAT1 in the BRAF V600E cells and unchanged TMX1 and TMX3 (compare to Fig 7B). Overall, these results display the complexity and interconnected signaling of NFAT1 and BRAF in melanoma. Nevertheless, within this signaling network, our data clearly showed that the TMX–ROS–NFAT1 signaling axis is functionally relevant in both BRAF WT and BRAF V600E melanomas.
Because of the more aggressive phenotype of NFAT1‐positive melanoma cells (see IHC data in Figs 1 and EV1), we set out to identify genes that are under NFAT1 control in melanoma. For this purpose, we used differential gene expression datasets from two independent NFAT1 knockdown studies in melanoma cell lines (for details, see Shoshan et al, 2016; Aibar et al, 2017). Because the two studies used different approaches, we first compared their common up‐ and downregulated hits and identified 59 genes that were upregulated and 56 genes that were downregulated following NFAT1 knockdown (Fig 7E and Appendix Table S5). To identify the NFAT1‐controlled signaling pathways and mechanisms, we investigated gene function according to associated annotation data by the Gene Ontology Consortium (www.geneontology.org). Based on the distribution of term annotations in the respective background set of genes, we calculated fold‐enrichments for each term per experiment, as well as the significance of the fold increase (hypergeometric test, adjustment by the Benjamini–Hochberg procedure, FDR = 0.05). As shown in Fig 7F and Appendix Table S5, more than by chance of the genes suppressed following NFAT1 silencing are assigned to the standard terms “Mitochondrion‐localized” (GO:0005739 mitochondrion) and “Redox‐related” (GO:0016491 oxidoreductase activity, and GO:0016209 antioxidant activity). These findings suggest that NFAT1‐positive melanoma cells possess mitochondria with higher bioenergetic capacity and have altered redox state and regulation. Furthermore, we assessed the transcriptomic data regarding the “Hallmarks of Cancer” classification and calculated fold‐enrichment in order to identify cancer‐related genes under the control of NFAT1. As shown in Fig 7G and in Appendix Table S5, most of the genes suppressed following NFAT1 silencing could be assigned to the hallmark “Deregulating Cellular Energetics”. This analysis also highlights proliferation‐ and migration‐associated genes, thus confirming our experimental findings, which suggested that NFAT1 is a critical regulator of melanoma cell proliferation and invasion. Detailed listings of hits, from both experiments and their intersection, are compiled in Appendix Table S5. In summary, the data presented in Fig 7E–G reveal that NFAT1‐positive melanoma cells might have altered mitochondrial activity and redox‐related properties. Altogether, our results indicate that TMX1, TMX3, and NFAT1 act as promoters of melanoma disease and can be considered together as possible prognostic markers in melanoma, independently of a tumor's BRAF mutational status.
Discussion
The role of ER–mitochondria contacts, metabolism, and ROS in cancer
ER–mitochondria contacts act as regulators of redox, Ca2+, metabolic, and bioenergetic processes; additionally, due to their contribution to multiple aspects of pro‐tumorigenic behavior, these organelles pose interesting targets for anti‐cancer therapies (Cardenas et al, 2010; Fulda et al, 2010; Clarke et al, 2014; Theodosakis et al, 2014; Schrepfer & Scorrano, 2016; Zong et al, 2016; Kerkhofs et al, 2017; Pedriali et al, 2017). Mitochondrial metabolic switches and ROS production have been proposed to control melanoma drug and oxidative stress resistance in distinct melanoma subpopulations (Haq et al, 2013; Roesch et al, 2013; Vazquez et al, 2013). These studies highlight the important role of mitochondria in cancer behavior and drug sensitivity, but also raise a number of questions. For example, how do mitochondria and their contact sites contribute to cancer progression? How do ER and mitochondria affect cell outcome and by which signaling mechanisms? Within this study, we examined how ER–mitochondria communication regulates melanoma redox signaling and how this influences melanoma cell behavior. We selected the TMX oxidoreductases and the transcription factor NFAT1 to facilitate our analyses, based on previous studies suggesting their association (Lynes et al, 2012; Sharma et al, 2013). We first investigated the link between TMX and NFAT1, with its signaling relevance; then, we examined how TMX‐driven ER–mitochondria changes affect mitochondrial Ca2+ signaling and ROS production, and finally, we studied the functional relevance of TMX and NFAT1 for melanoma biology and patient outcome.
TMX and NFAT1 are upregulated in melanoma and they are functionally linked
Our expression analyses of TMX1, TMX3, and NFAT1 in a panel of melanoma cell lines and patient samples suggested that the upregulation of these proteins might be associated with a biological advantage for cancer. While our expression observations in melanoma cell lines and patient tissues may not represent every melanoma (known for their heterogeneity), they still point to an elevation of TMX1 as well as to the existence of NFAT1‐positive melanoma subgroups, which are notably predominant among more aggressive melanomas. These findings are supported by studies showing that NFAT members play an important role in cancer and that NFAT isoforms are overexpressed and/or constitutively activated in both human solid tumors and hematological cancers (Mancini & Toker, 2009; Muller & Rao, 2010; Pan et al, 2013). In melanoma, for example, it was reported that targeting NFAT signaling enhanced melanoma cell death in oncogenic BRAF V600E cells (Flockhart et al, 2009; Perotti et al, 2012). Accordingly, we examined the link between the BRAF mutational status and the TMX–ROS–NFAT1 signaling axis in melanoma cell lines and patient databases. Our findings suggested that TMX–NFAT1 signaling is functionally relevant not only in BRAF WT but also in BRAF V600E melanomas and can contribute to melanoma aggressive behavior, in particular in BRAF WT patients.
Silencing of TMX1 or TMX3 (to interfere with ER–mitochondria contacts) inhibited NFAT1 translocation in melanoma cells, and these results are in line with previous findings by another group (Sharma et al, 2013), which prompted us to originally hypothesize that TMX1 and TMX3 might affect cytosolic Ca2+ signaling to regulate NFAT1 (Crabtree & Olson, 2002). However, TMX knockdown showed no overt changes in SOCE, so this mechanism could not explain NFAT1 inhibition.
TMXs can regulate ROS production
TMX downregulation did not affect SOCE, but instead induced oxidative stress in melanoma cells. Our results showed higher resting Ca2+ concentration, as well as increased Tg‐induced mitochondrial Ca2+ uptake. Mitochondria can take up Ca2+ from the ER (via IP3R and/or via the constitutively active ER Ca2+ leak channels) and/or from the cytosol (i.e., via ORAI channels; Bakowski et al, 2012; de Brito & Scorrano, 2008; Hoth et al, 1997). It was shown that ER–mitochondria positioning can influence contacts between mitochondria and the PM; additionally, the same study suggested that the distances between the ER and mitochondria are essential in shaping mitochondrial Ca2+ dynamics (Csordas et al, 2010). This is in line with our observations from silencing TMX1, which caused intracellular mitochondrial repositioning that may expose mitochondria to Ca2+ hotspots close to the plasma membrane and thus cause elevated mitochondrial Ca2+ levels and increased ROS production. Additional studies are necessary to decipher how organelle contact sites govern mitochondrial Ca2+ and ROS dynamics.
TMX1 and TMX3 are enriched in the MAMs, regulating ER–mitochondria communication and, thus, mitochondrial function (Lynes et al, 2012; Raturi et al, 2016). Changes in mitochondrial morphology and dynamics could, independently of Ca2+, also explain the observed elevation in mitochondrial ROS following TMX knockdown and the increased cellular oxidative stress (Willems et al, 2015).
We could not discount that other sources of ROS were also adding to the oxidative stress during TMX disruption, such as the ER lumen or NOX4 (Appenzeller‐Herzog et al, 2016). ER stress was not observed, but our data showed that NOX4, which is upregulated in melanoma (Yamaura et al, 2009; Meitzler et al, 2017), is also a key player in ROS production following TMX knockdown. This is in agreement with a study showing that TMX3 is an interaction partner for NOX4 (Prior et al, 2016). These findings also indicate that TMX oxidoreductases serve as suppressors of NOX4 and thereby as cellular antioxidants, a concept that is in line with the findings reported in a recent study (Phan et al, 2018).
TMXs protect NFAT1 from oxidative inactivation
Our data also revealed that TMX silencing‐induced H2O2 inhibits NFAT1 translocation via the oxidation of calcineurin, a concept previously explored but not in melanoma (Wang et al, 1996; Reiter et al, 1999). These findings are supported by our antioxidant results that reversed this process and indicate that TMX oxidoreductases promote a less oxidative cell state. Given the broad importance of calcineurin, in particular in cancer, these findings identified one of the mechanisms linking TMX knockdown with reduced NFAT1 translocation. Thus, our results suggest that TMX knockdown drives ROS production (from mitochondria and NOX4), with inhibitory consequences on calcineurin/NFAT1 signaling. Based on our data, which show that the basal and the SOCE‐induced calcineurin and NFAT1 activity are suppressed following TMX silencing, it is likely that the redox regulation of NFAT1 is dominant over its Ca2+‐driven activation.
TMXs and NFAT1 are promoters of aggressive melanoma phenotypes
It is tempting to propose that keeping mitochondria close to the ER via high TMX levels ensures controlled metabolism, redox, and Ca2+ homeostasis, thus facilitating cancer growth and invasion. This hypothesis would be in line with the findings of Cardenas et al (2016), who demonstrated an increased dependence of cancer cells on ER–mitochondria Ca2+ transfer. With this mechanism and our data in mind, we postulate that high TMX levels keep mitochondria close to the ER, ROS levels are kept in check, and NFAT signaling is unimpaired. Conversely, when we reduce TMX expression, we cause mitochondrial Ca2+ overload and disturb mitochondrial architecture and function to cause higher ROS production, which ultimately results in oxidative stress and NFAT1 inhibition (proposed model in Fig 8).
Figure 8. Schematic of a mitochondria‐controlled TMX–ROS–NFAT1 signaling axis in melanoma.
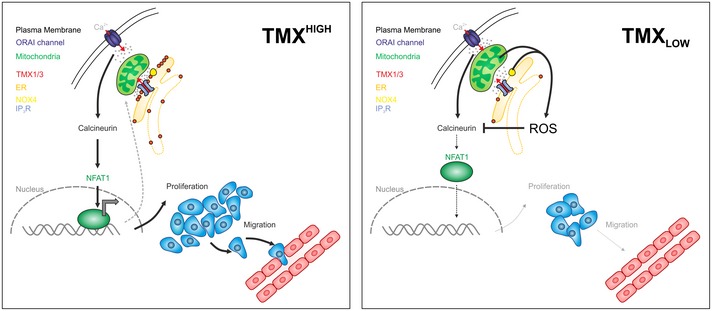
(Left panel) In TMXHIGH cells, the undisturbed ER–mitochondria contacts allow Ca2+ and lipid transfer and thus optimal mitochondrial function. Here, mitochondria and NOX4 generate no or low levels of ROS which can be eliminated by mitochondrial/cellular antioxidants. ORAI channel‐governed SOCE activates NFAT1 translocation by its dephosphorylation through calcineurin and initiates the expression of target genes promoting melanoma proliferation and migration. NFAT1 controls the gene expression of mitochondrial proteins, thus suggesting a regulatory mitochondria–NFAT1 feedback loop. (Right panel) In TMXLOW cells, ER–mitochondria communication is disturbed, leading to altered mitochondrial morphology, repositioning close to the PM, elevated mitochondrial Ca2+ uptake, and altered NOX4 activity, thus ultimately causing oxidative stress. Elevated ROS inhibit NFAT1 activation via oxidation of calcineurin and impair melanoma growth and migration.
After showing a link between TMX and NFAT1 signaling, with mitochondrial changes contributing to ROS production and calcineurin/NFAT1 inactivation, the next step was to confirm the relevance of these processes to cancer cell behavior and outcome. TMX1, TMX3, or NFAT1 downregulation caused the inhibition of melanoma cell proliferation and migration in vitro; moreover, TMX1 downregulation transiently suppressed melanoma tumor growth in xenograft mouse models. The importance of NFAT1 within this constellation was further supported by the less aggressive behavior of the NFAT1‐negative WM1366 cells, in which TMX silencing had less dramatic effects on melanoma pathobiology when compared with the NFAT1‐positive melanoma cells.
The transient nature of the TMX1 inhibition in vivo can be explained by the compensatory activation of other pathways (exemplified by AKT phosphorylation and changes in bioenergetics; Fig EV5); compensatory mechanisms are also observed for BRAF inhibition in melanoma (Villanueva et al, 2013). Alone, our observations hinted at the pro‐tumorigenic contribution of TMX/NFAT1‐driven signaling; this was then further confirmed with our analyses of the TCGA melanoma patient database (Figs 7 and EV5). Our investigations showed that elevated levels of either TMX1, TMX3, or NFAT1 reduced patient survival expectancy. Additionally, our bioinformatics analyses showed that most of the NFAT1 target genes code for mitochondrial proteins, for redox‐related proteins (identified as oxidoreductase and antioxidant activity‐related genes), and for tumor promoters. Together, our data and TCGA analyses suggest the combined TMX/NFAT1 high expression is indicative of aggressive disease and is of importance to regulate oxidative stress.
Three seminal studies report that melanoma cell drug resistance and adaptation to oxidative stress are controlled by mitochondria; these studies identified PGC1α, MITF, and JARID1B as regulators of these mitochondria‐based resistance mechanisms (Haq et al, 2013; Roesch et al, 2013; Vazquez et al, 2013). Given that antioxidants can promote melanoma metastatic spread (Le Gal et al, 2015; Piskounova et al, 2015) and that inhibition of antioxidant enzymes can lead to specific elimination of cancer cells (Stafford et al, 2018), our findings highlight the importance of better understanding redox‐based processes in cancer and the possibility of using TMX–ROS–NFAT1 signaling for clinical purposes.
Conclusion
Cancer is a heterogeneous disease where multiple signaling pathways, genetic aberrations, and microenvironmental inputs integrate to determine cell fate. Our findings not only support the importance of further dissecting ER–mitochondria communication and activity to understand aggressive tumor cell behavior, but also suggest a novel pro‐melanoma signaling axis linking ER–mitochondria contacts, bioenergetics, redox regulation, and NFAT1 signaling. We conclude that the TMX oxidoreductases affect NFAT1 signaling and contribute to melanoma proliferation and migration and that the restructuring of ER–mitochondria contacts allows a redox configuration that favors tumor progression. Since TMX1, TMX3, and NFAT1 levels are found elevated in melanoma samples and because they indicate poor survival outcome, they hold potential as biomarkers of aggressive disease.
Materials and Methods
Cell culture and reagents
Human melanoma cell lines were previously described (Iliopoulos et al, 1989; Satyamoorthy et al, 2003) and were a gift from Meenhard Herlyn (The Wistar Institute, Philadelphia, USA; see Appendix Table S1). Cellular genotypes and cell line identities were confirmed by DNA fingerprinting. Melanoma cell lines were cultivated in TU2% medium (80% MCDB153 basal medium (Biochrom #F8105), and 20% Leibovitz's L‐15 medium (Biochrom #F21315) supplemented with 1.68 mM CaCl2 and 2% FCS), RPMI medium (Fisher Scientific #21875‐091) supplemented with 10% FCS, or DMEM (Fisher Scientific #41966‐029) supplemented with 10% FCS. HeLa cells were grown in RPMI medium, supplemented with 10% FCS; HaCat keratinocytes were grown in DMEM, supplemented with 10% FCS, 1% l‐glutamine (200 mM), and 1% penicillin/streptomycin, and primary melanocytes in M2 Melanocyte Medium (PromoCell #C‐24300). All cells were found negative for mycoplasma and were maintained at 37°C in 5% CO2. For imaging experiments, cells (150,000–300,000) were seeded on 25‐mm round glass coverslips 24–48 h before transfection. Genetically encoded protein sensors and NFAT1‐GFP (NFAT1 translocation assay) were transfected using FuGENE® HD (Promega GmbH, Mannheim, Germany) along with 1 μg of plasmid DNA, according to the manufacturer's instructions. Imaging was performed 24 h after transfection, unless otherwise specified.
All chemicals were purchased from Sigma‐Aldrich (Munich, Germany), unless otherwise indicated. The NOX4 inhibitor GKT137831 was from Cayman Chemical (#17764, USA). Plasmids used and kindly provided by: NFAT1‐GFP (Dr. Rainer Schindl, Graz, Austria); pcDNA3‐cyto‐CaNAR2 (Addgene #64729, Jin Zhang, Baltimore, USA); pcDNA‐4mt‐D3cpV (Addgene #36324) and pcDNA3‐4mt‐TNXL (Addgene #51994, Peter Lipp, Homburg, Germany); pC1‐HyPer3 (Addgene #42131), pC1‐HyPer‐C199S (SypHer; Addgene #42213), ER‐HyPer (Santos et al, 2016), mito‐HyPer2 (Evrogen #FP942) and mito‐SypHer (Addgene #48251, Dr. Vsevolod V. Belousov, Moscow, Russia); and pcDNA‐D3cpV (Addgene #36323).
Protein knockdown
For transient knockdown, siRNAs from Microsynth were used (Balgach, Switzerland): siTMX1 (5′‐GAG AAG AUC UUG AGG UUA ATT dTdT‐3′); siTMX3 (5′ GGA GUU CGA GGU UAU CCA ATT dTdT‐3′); siNFAT‐1 (5′ CUG AUG AGC GGA UCC UUA A dTdT‐3′); siNOX4 (5′‐GUU CUU AAC CUC AAC UGC ATT dTdT‐3′); and a non‐silencing control (5′ AGG UAG UGU AAU CGC CUU G dTdT‐3′). BRAF siRNA was purchased from Sigma‐Aldrich (#EHU127401). Two million cells and 4 μl of 20 pmol siRNA were used per nucleofection (Amaxa Nucleofector; Lonza GmbH, Cologne, Germany). All measurements were performed 48 h after transfection. For stable downregulation of TMX1, the Sigma MISSION® shRNA was used following the manufacturer's protocol (SHCLNG‐NM_030755; #TRCN0000338583 and #TRCN0000150291). The shRNAs were transduced into WM3734, 1205Lu, and WM1366 with a lentiviral vector (pLKO.1), which was also used as control, and cells were selected with puromycin (2 μg/ml).
Fura‐based Ca2+ imaging
Measurements of cytosolic calcium were performed as in Saul et al (2016). Briefly, cells were loaded with 1 μM Fura‐2 AM (Thermo Fisher Scientific GmbH, Schwerte, Germany) in growth medium for 30 min at room temperature. The measurements were performed in Ringer's buffer (pH 7.4) containing 145 mM NaCl, 4 mM KCI, 10 mM glucose, 10 mM HEPES, 2 mM MgCl2, and concentrations of CaCl2 as indicated, or in 0 mM CaCl2 with 1 mM EGTA. Time‐lapse ratiometric imaging was performed on an Olympus microscope and analyzed with TILLVISION software (FEI GmbH, Munich, Germany).
Fluorescence microscopy
Imaging experiments were performed with a Zeiss Cell Observer Z1 equipped with a 40× oil Fluar (N.A. 1.3) objective, multi‐filter system, fast acquisition EMCCD camera (Evolve® 512 Delta), and LED system (Colibri, Zeiss) at 37°C. Data were analyzed with AxioVision software (Zeiss, Oberkochen, Germany).
NFAT1 translocation assay
Cells transfected with NFAT1‐GFP were imaged (excitation 490 nm; emission filter 525 ± 25 nm) in Ringer's buffer containing 0.25 or 1 mM Ca2+ and stimulated with thapsigargin (1 μM). The increase in fluorescence intensity in the nucleus was marked with a ROI (region of interest) and was analyzed by normalizing the background‐corrected fluorescence intensity of F/F 0.
Ca2+ measurements
Mitochondrial and cytosolic Ca2+ imaging were performed using the FRET (fluorescence resonance energy transfer) sensors 4mt‐D3cpV or D3cpV (excitation 420 and 505 nm; emission filters 483 ± 16 nm and 542 ± 14 nm) in Ringer's buffer containing 0.25 mM Ca2+ or 1 mM Ca2+. Background and bleed‐through were corrected in the FRET/donor ratio (equation (1)).
| (1) |
CF: correction factor for YFP or CFP bleed‐through
For mitochondrial Ca2+ imaging with 4mt‐TNXL (excitation 420 and 505 nm; emission filters 483 ± 16 nm and 542 ± 14 nm), Ringer's buffer containing 1 mM Ca2+ was used and the background‐corrected FRET/CFP ratio was analyzed.
Hydrogen peroxide measurements
Cellular, mitochondrial, and ER H2O2 were measured using the protein sensors HyPer, mito‐HyPer, and ER‐HyPer, respectively, in Ringer's buffer containing 0.25 mM Ca2+ (excitation 420 and 505 nm; emission filter 542 ± 14 nm). For HyPer in Figs 3G and H, and in EV3F, the H2O2 concentration was set to background levels by incubating cells with N‐acetyl‐L‐cysteine (100 μM) and subtracting this background ratio value from the experimental data. As a control to access the pH sensitivity of HyPer, the pH‐sensitive but H2O2‐insensitive mutant SypHer (HyPer‐C199S) and mito‐SypHer were used to monitor pH in the cytosol and mitochondria, respectively, using the same experimental setting.
Calcineurin activity
The FRET sensor CaNAR2 was used to measure cytosolic calcineurin activity (excitation 420 and 505 nm; emission filters 483 ± 16 nm and 542 ± 14 nm). Cells were measured with Ca2+‐free Ringer's buffer. Ca2+ influx and subsequent activation of calcineurin was induced by thapsigargin (1 μM), ionomycin (1 μM), and Ringer's buffer containing 1 mM Ca2+. The background‐corrected FRET/CFP ratio was analyzed.
Calcineurin activity assay
The calcineurin cellular activity assay kit (Enzo Life Sciences #BML‐AK816‐0001, USA) was used to determine the phosphatase activity of calcineurin in melanoma cells, using the manufacturer's instructions. Briefly, 2 × 10⁶ cells were collected by centrifugation and protein was extracted with complete lysis buffer (Enzo Life Sciences #BML‐KI135, USA) for 15 min. Phosphatase activity was quantified by detection of free phosphate released from the reaction by measuring the absorbance of malachite green (OD 630 nm).
Proliferation, migration, and invasion assays
Proliferation was measured with the CellTiter‐Blue assay (Promega GmbH, Mannheim, Germany), according to the manufacturer's instructions. In summary, 5,000 cells/well were seeded into 96‐well plates, and after the indicated growth time, CellTiter‐Blue was added and incubated for 3 h prior to fluorescence measurements using a plate reader (Tecan, Männedorf, Switzerland).
Migration was assessed using a transwell migration assay (Corning®, Kennebunk, ME, USA), featuring 8‐μm‐pore‐size inserts. Cells were seeded 100,000/per well and were stimulated to migrate toward preconditioned medium supplemented with 10% FCS. Cells migrated through the membrane were detached with Accutase® after 48 h and quantified using a Moxi Z Mini cell counter (ORFLO Technologies, Ketchum, USA).
Invasion was measured using the same 8‐μm‐pore‐size inserts, which were coated with 40 μl of growth factor‐reduced Matrigel (BD Matrigel™ Basement Membrane Matrix, Growth Factor Reduced; Becton Dickinson, Heidelberg, Germany) diluted 1:2 in DMEM. A total of 200,000 cells were made to invade for 96 h through Matrigel toward medium supplemented with 20% FCS. Invaded cells were stained with Hoechst 33342 (0.5 μg/ml), imaged with a Zeiss inverted fluorescence microscope, and quantitated using ImageJ (NIH, Bethesda, USA).
RT–qPCR
Total isolated RNA (800 ng) was reverse‐transcribed to cDNA using SuperScript II (Thermo Fisher Scientific GmbH, Schwerte, Germany), and 0.5 μl was used for RT–qPCR using the QuantiTect SYBR Green Kit (Qiagen #204145) and Bio‐Rad CFX96™ Real‐Time System. TBP (TATA box binding protein) was used as a housekeeping gene. Primer sequences used for detection are listed in Appendix Table S6. Data were analyzed using the 2−ΔCT method.
Immunoblotting
Proteins were extracted as described in Stanisz et al (2014). Briefly, 25 μg (unless otherwise specified) of protein were separated by 10% SDS–polyacrylamide gel electrophoresis and were transferred onto a nitrocellulose membrane (Amersham Protran Premium 0.45 μm; GE Healthcare #10600003). After transfer, membranes were blocked in 5% bovine serum albumin prior to primary antibody incubation overnight. Antibodies and used dilutions are listed in Appendix Table S7. Fluorescent secondary antibodies (IRDye; LI‐COR, Lincoln, USA) were incubated for 1 h in the dark, at room temperature. Membranes were scanned and quantified using an Odyssey Sa Infrared imaging system (LI‐COR, USA).
Determination of mitochondrial volume, surface, and peripheral mitochondria
Cells were stained with MitoTracker™ Deep Red FM (100 nM; Thermo Fisher #M22426) alone or co‐stained with CellMask™ Green Plasma Membrane Stain (200 nM; Thermo Fisher #C37608) for 10 min at room temperature in cell culture medium and measured in Ringer's buffer containing 0.5 mM Ca2+. Z‐stacks were acquired upon 638 nm (mitochondria) and 488 nm (membrane) excitation with a Nikon Ti‐Eclipse spinning disk confocal microscope, 100× oil‐immersion objective (1.44 NA). Mitochondria of individual cells were modeled with Imaris 9.1 (Bitplane, Zurich, Switzerland), to obtain the volume and surface on a per‐cell basis. Peripheral mitochondria were determined using a custom‐written macro implemented in the FIJI image processing package (Schindelin et al, 2012) as described in Fig 9. Cell membrane outlines of individual cells were marked manually in a Z‐stack image 5 μm above the coverslip surface. A peripheral mask of identical thickness was created, and occupied area was measured based on mitochondrial staining.
Figure 9. Determining mitochondrial positioning using confocal microscopy.
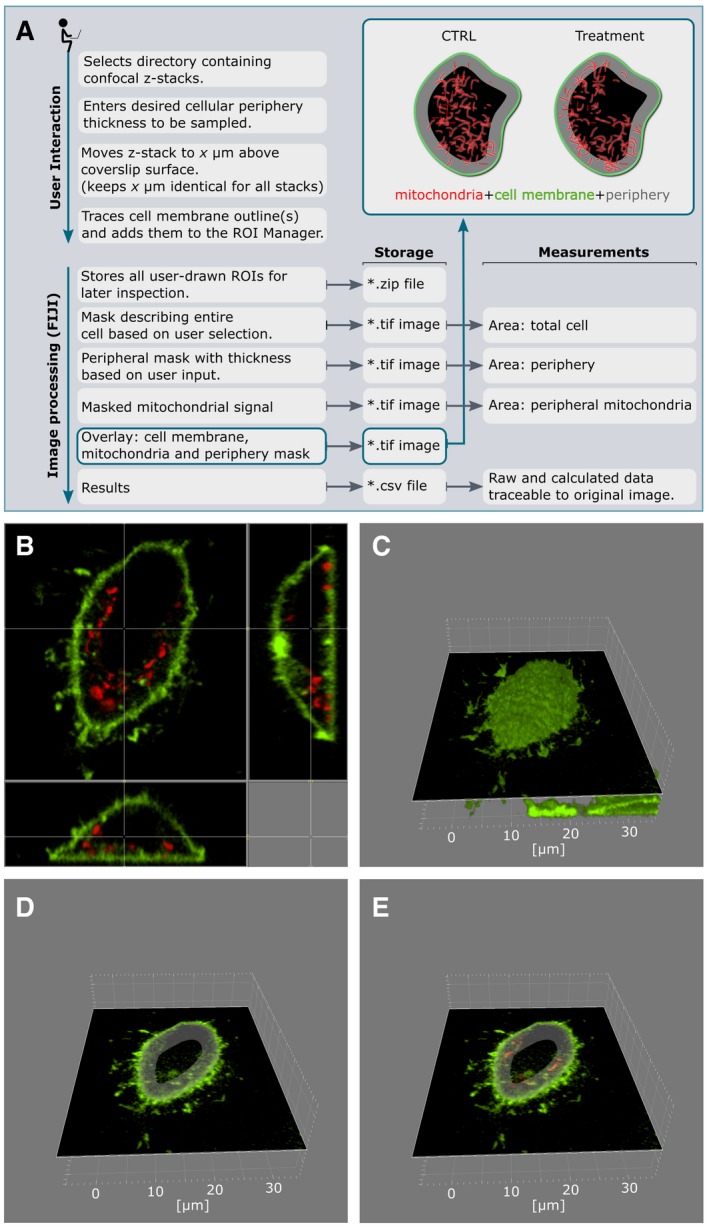
- Schematic workflow for the ImageJ plugin for analysis of peripheral mitochondria.
- Representative cell; top and side views.
- 3D reconstruction of the plasma membrane based on CellMask Green staining.
- Z‐stack 5 μm above the coverslip with intracellular peripheral mask.
- Quantification of mitochondria in peripheral mask based on MitoTracker Deep Red staining.
Seahorse analysis
For the determination of respiratory capacity, 100,000 melanoma cells were seeded into a Seahorse 96‐well plate. Cells were prepared for measurement 3 h after seeding by exchanging medium to Seahorse XF media supplemented with 1 mM pyruvate and 4.5 g/l glucose. Oxygen consumption rate (OCR) was measured with a Seahorse XF96 Extracellular Flux Analyzer (Seahorse Bioscience, Billerica, MA, USA). Periodic measurements of oxygen consumption were performed at basal state and after the administration of 3 μM oligomycin, 1 μM FCCP, and 2 μM rotenone plus 1 μM antimycin A.
Preparation and analysis of electron micrographs
Cell monolayers from control and TMX1 knockdown HeLa and 1205Lu cells were fixed and processed as previously described (Raturi et al, 2016). Briefly, cells were fixed in 2% paraformaldehyde and 2% glutaraldehyde in 100 mM sodium cacodylate buffer at pH 7.4 for 20 min. Cells were then scraped and pelleted, and then underwent secondary fixation in osmium tetroxide 1%. Dehydration of the samples was done after washes and staining in 1% uranyl acetate. After incubation in propylene oxide, pellets were then infused with Embed 812 and blocks were hardened at 60°C for a minimum of 48 h. Images were acquired with “MegaView III” using a digital camera mounted on a Philips 410 TEM. Mitochondrial proximity to the plasma membrane was quantified via the coefficient between the lengths in nm of the contact, divided by the perimeter of mitochondria times the distance of the contact: Coefficient = L contact/(perimeter · distance), for the HeLa dataset. For 1205Lu, distance of mitochondria and ER contact and the length of ER–mitochondria contact sites (MAM length) were measured in nm. Mitochondrial proximity to the plasma membrane was quantified by measuring the distance of the closest mitochondria to the plasma membrane in nm.
Immunohistochemistry
The handling of patient material was performed according to the Göttingen ethics committee votum No. 13/5/17 and according to the Statement of the National Ethics Council on Biobanks for Research, Berlin, Germany. Human melanoma samples were collected only from patients who signed informed consent. Samples were pseudo‐anonymized, and immunohistochemical staining was performed. Briefly, 5‐μm slides of paraffin‐embedded normal skin, primary melanoma, and metastasis samples were deparaffinated and treated with target retrieval solution (Dako #S1699) for 20 min. After cooling, endogenous peroxidases were blocked with 3% H2O2, washed with PBS three times, and stained with primary antibody overnight in a wet chamber at 4°C (specifics and dilutions are listed in Appendix Table S7). Samples were afterward washed with PBS three times. Secondary antibody (goat‐anti‐mouse Vector #BA‐9200, dilution 1:150; rabbit‐anti‐goat Vector #BA‐5000, dilution 1:150; goat‐anti‐rabbit Vector #BA‐1000, dilution 1:150) was incubated and washed exactly as the primary antibody. Samples were blocked with streptavidin peroxidase (Calbiochem #189733). Photographs were taken with an Axio Imager M1 and recorded using the AxioVision software Rel 4.7 (Zeiss, Göttingen, Germany). The slight difference in staining color (brown‐red for TMX1 and deep red for NFAT1) is due to different secondary antibodies.
In vivo studies
All animal experiments were approved by the local governmental animal care committee (Landesamt für Verbraucherschutz des Saarlandes) and were conducted in accordance with the German legislation on protection of animals and the National Institutes of Health Guide for the Care and Use of Laboratory Animals (NIH Publication #85–23 Rev. 1985). Male athymic nude NOD.Cg‐Prkdcscid Il2rgtm1WjI/SzJ (NSG) mice (8 weeks old; Charles River Laboratories, Sulzfeld, Germany) were randomized into three groups (n = 7 mice/group): (i) shRNA control (control), (ii) shTMX1_1 (TMX1 kds 1), and (iii) shTMX1_2 (TMX1 kds 2). Mice were kept in groups in isolated ventilated cages under specific pathogen‐free conditions in a temperature‐ and humidity‐controlled 12‐h dark/light environment at the animal care facility of the Institute for Clinical and Experimental Surgery at Saarland University. Animals had free access to tap water and standard pellet food, and their health status was monitored daily. Mice were each inoculated s.c. with 100,000 WM3734 human melanoma cells in a 1:1 suspension with Matrigel (BD Matrigel™ Basement Membrane Matrix, Growth Factor Reduced; Becton Dickinson, Heidelberg, Germany) and cell media. Tumor growth was measured every 2–3 days by a single veterinarian blinded to the experimental groups, by means of a caliper. Volumes were calculated according to the formula V = (π/6)·L·W 2 [mm3]. Tumor samples (tumors size up to 15 mm in diameter prior to sacrifice) were fixed and embedded in paraffin or were snap‐frozen in liquid nitrogen for subsequent protein analyses. Immunoblots featuring tumor lysates were conducted as described in the “Immunoblotting” section, using 25 μg of protein.
Bioinformatics
Significantly deregulated genes from Aibar et al (2017) were adopted as shown in Appendix Table S5 from the original publication. Normalized data from Shoshan et al (2016) were downloaded from NCBI GEO (accession GSE76541), and hits were selected according to adjusted P‐values (Benjamini–Hochberg procedure, FDR = 0.05). The annotation data were downloaded on 03.22.2018 and included associations inferred from electronic annotation. The list of genes that are related to established hallmarks of cancer was compiled by integrating Gene Ontology (Huntley et al, 2015) data as described in Will and Helms (2016). Additionally, the terms “Mitochondrion‐localized” (GO:0005739 mitochondrion) and “Redox‐related” (GO:0016491 oxidoreductase activity; GO:0016209 antioxidant activity) were added. The full Aibar et al and Shoshan et al datasets are available at NCBI GEO under accessions GSM2027644 and GSM2027645 and GSM2644430 and GSM2644431. On the basis of the distribution of term annotations in the respective background set of genes, we calculated fold‐enrichments for each term per experiment as well as the significance of the fold increase (hypergeometric test, adjustment by the Benjamini–Hochberg procedure, FDR = 0.05).
RNA‐seq gene expression (FPKM‐quantified) and survival data on Skin Cutaneous Melanoma (SKCM) by TCGA were downloaded from NIH's GDC portal on 02.19.2018. Mutation data (MuTect2 aggregated) on the patients were downloaded on 11.29.2018. Only data on primary tumors and patients with non‐negative survival times were considered. Analogous to Uhlen et al (2017), we grouped the 102 patients according to low and high expression states of NFAT1, TMX1, and TMX3, respectively. Corresponding FPKM thresholds for each gene of interest were derived by scanning the 20–80% percentiles of the gene's expression value distribution and determining an optimal separation in terms of survival based on the log‐rank test. When relevant, the patients were partitioned into three cohorts given their BRAF genotype: wild type (BRAF WT), existence of mutation V600E (BRAF V600E), and other mutations. All analyses were conducted using R (version 3.4.3) with the packages “survival” (version 2.41.3) and “survminer” (version 0.4.2).
Data and statistical analyses
Data obtained from experiments were analyzed or processed using Zeiss AxioVision, TILLVISION, Bio‐Rad Quantity One, ImageJ or FIJI, and Microsoft Excel. Statistical significance was tested with unpaired, two‐tailed Student's t‐test unless otherwise specified. The significant differences are indicated by asterisks: *P < 0.05; **P < 0.01; and ***P < 0.005.
Author contributions
Conceptualization of study: IB with help of AV. Writing: AV and IB. Investigation: XZ performed majority of experiments and processed the data. CSG performed experiments, processed the data, and prepared figures and tables. Experimental data collection: TW, JD, HS, MM, IS, SC, NT, LM, DP‐G, CK, and AV. Conceptualization of experimental procedures: XZ, CSG, TW, VH, TS, MM, BAN, HS, AV, and IB. Supervision: TS, MPS, BAN, MWL, MDM, PR, VH, AV, and IB. Funding acquisition: HS and IB. Proofreading and editing of the manuscript: all authors.
Conflict of interest
The authors declare that they have no conflict of interest.
Supporting information
Appendix
Expanded View Figures PDF
Review Process File
Acknowledgements
We thank Dr. Markus Hoth for his continuous support as well as Dr. Meenhard Herlyn for the generous gift of all WM‐ and Lu‐labeled melanoma cell lines. Many thanks go to Dr. Richard Zimmerman and Dr. Martin Jung for providing the PDI and BiP antibodies as well as to Dr. Lars Elgaard for the TMX3 antibody and for helpful discussions. We acknowledge Dr. Patrick Hogan for helpful manuscript suggestions. Many thanks also go to Dr. Dörthe Katschinski and Dr. Anke Zieseniss for critical reading of the paper. The CaNAR2 sensor was kindly provided by Dr. Jin Zhang. We thank Sandra Janku, Alexandra Stark, Annette Bennemann, and Andrea Paluschkiwitz for their technical assistance. This work was supported by the German Research Foundation (DFG) through SFB1190 Projects 17 (to I.B.) and 13 (to P.R.), SFB1027 Projects C3 (to V.H.) and C4 (to I.B.), and BO3643/3‐2 (to I.B.). H.S. acknowledges financial support from the Medical School, Saarland University, via the HOMFOR program. T.S. was supported by CIHR (MOP 133541).
The EMBO Journal (2019) 38: e100871
References
- Aibar S, Gonzalez‐Blas CB, Moerman T, Huynh‐Thu VA, Imrichova H, Hulselmans G, Rambow F, Marine JC, Geurts P, Aerts J et al (2017) SCENIC: single‐cell regulatory network inference and clustering. Nat Methods 14: 1083–1086 [DOI] [PMC free article] [PubMed] [Google Scholar]
- Appenzeller‐Herzog C, Banhegyi G, Bogeski I, Davies KJA, Delaunay‐Moisan A, Forman HJ, Gorlach A, Kietzmann T, Laurindo F, Margittai E et al (2016) Transit of H2O2 across the endoplasmic reticulum membrane is not sluggish. Free Radic Biol Med 94: 157–160 [DOI] [PubMed] [Google Scholar]
- Bakowski D, Nelson C, Parekh AB (2012) Endoplasmic reticulum–mitochondria coupling: local Ca2+ signalling with functional consequences. Pflügers Arch Eur J Physiol 464: 27–32 [DOI] [PubMed] [Google Scholar]
- Bedard K, Krause KH (2007) The NOX family of ROS‐generating NADPH oxidases: physiology and pathophysiology. Physiol Rev 87: 245–313 [DOI] [PubMed] [Google Scholar]
- Bilan DS, Pase L, Joosen L, Gorokhovatsky AY, Ermakova YG, Gadella TWJ, Grabher C, Schultz C, Lukyanov S, Belousov VV (2013) HyPer‐3: a genetically encoded H2O2 probe with improved performance for ratiometric and fluorescence lifetime imaging. ACS Chem Biol 8: 535–542 [DOI] [PubMed] [Google Scholar]
- Bogeski I, Kappl R, Kummerow C, Gulaboski R, Hoth M, Niemeyer BA (2011) Redox regulation of calcium ion channels: chemical and physiological aspects. Cell Calcium 50: 407–423 [DOI] [PubMed] [Google Scholar]
- Booth DM, Enyedi B, Geiszt M, Varnai P, Hajnoczky G (2016) Redox nanodomains are induced by and control calcium signaling at the ER‐mitochondrial interface. Mol Cell 63: 240–248 [DOI] [PMC free article] [PubMed] [Google Scholar]
- de Brito OM, Scorrano L (2008) Mitofusin 2 tethers endoplasmic reticulum to mitochondria. Nature 456: 605–610 [DOI] [PubMed] [Google Scholar]
- Cardenas C, Miller RA, Smith I, Bui T, Molgo J, Muller M, Vais H, Cheung KH, Yang J, Parker I et al (2010) Essential regulation of cell bioenergetics by constitutive InsP(3) receptor Ca2+ transfer to mitochondria. Cell 142: 270–283 [DOI] [PMC free article] [PubMed] [Google Scholar]
- Cardenas C, Muller M, McNeal A, Lovy A, Jana F, Bustos G, Urra F, Smith N, Molgo J, Diehl JA et al (2016) Selective vulnerability of cancer cells by inhibition of Ca(2+) transfer from endoplasmic reticulum to mitochondria. Cell Rep 14: 2313–2324 [DOI] [PMC free article] [PubMed] [Google Scholar]
- Chio IIC, Tuveson DA (2017) ROS in cancer: the burning question. Trends Mol Med 23: 411–429 [DOI] [PMC free article] [PubMed] [Google Scholar]
- Cho JH, Robinson JP, Arave RA, Burnett WJ, Kircher DA, Chen G, Davies MA, Grossmann AH, VanBrocklin MW, McMahon M et al (2015) AKT1 activation promotes development of melanoma metastases. Cell Rep 13: 898–905 [DOI] [PMC free article] [PubMed] [Google Scholar]
- Clarke HJ, Chambers JE, Liniker E, Marciniak SJ (2014) Endoplasmic reticulum stress in malignancy. Cancer Cell 25: 563–573 [DOI] [PubMed] [Google Scholar]
- Cox DR (1972) Regression models and life‐tables. J R Stat Soc Series B Methodol 34: 187–220 [Google Scholar]
- Crabtree GR, Olson EN (2002) NFAT signaling. Cell 109: S67–S79 [DOI] [PubMed] [Google Scholar]
- Csordas G, Varnai P, Golenar T, Roy S, Purkins G, Schneider TG, Balla T, Hajnoczky G (2010) Imaging interorganelle contacts and local calcium dynamics at the ER‐mitochondrial interface. Mol Cell 39: 121–132 [DOI] [PMC free article] [PubMed] [Google Scholar]
- Denu JM, Tanner KG (1998) Specific and reversible inactivation of protein tyrosine phosphatases by hydrogen peroxide: evidence for a sulfenic acid intermediate and implications for redox regulation. Biochemistry 37: 5633–5642 [DOI] [PubMed] [Google Scholar]
- Dong Z, Shanmughapriya S, Tomar D, Siddiqui N, Lynch S, Nemani N, Breves SL, Zhang X, Tripathi A, Palaniappan P et al (2017) Mitochondrial Ca(2+) uniporter is a mitochondrial luminal redox sensor that augments MCU channel activity. Mol Cell 65: 1014–1028.e7 [DOI] [PMC free article] [PubMed] [Google Scholar]
- Elbaz Y, Schuldiner M (2011) Staying in touch: the molecular era of organelle contact sites. Trends Biochem Sci 36: 616–623 [DOI] [PubMed] [Google Scholar]
- Flockhart RJ, Armstrong JL, Reynolds NJ, Lovat PE (2009) NFAT signalling is a novel target of oncogenic BRAF in metastatic melanoma. Br J Cancer 101: 1448–1455 [DOI] [PMC free article] [PubMed] [Google Scholar]
- Fulda S, Galluzzi L, Kroemer G (2010) Targeting mitochondria for cancer therapy. Nat Rev Drug Discovery 9: 447–464 [DOI] [PubMed] [Google Scholar]
- Gibhardt CS, Zimmermann KM, Zhang X, Belousov VV, Bogeski I (2016) Imaging calcium and redox signals using genetically encoded fluorescent indicators. Cell Calcium 60: 55–64 [DOI] [PubMed] [Google Scholar]
- Gorrini C, Harris IS, Mak TW (2013) Modulation of oxidative stress as an anticancer strategy. Nat Rev Drug Discov 12: 931–947 [DOI] [PubMed] [Google Scholar]
- Haq R, Shoag J, Andreu‐Perez P, Yokoyama S, Edelman H, Rowe GC, Frederick DT, Hurley AD, Nellore A, Kung AL et al (2013) Oncogenic BRAF regulates oxidative metabolism via PGC1alpha and MITF. Cancer Cell 23: 302–315 [DOI] [PMC free article] [PubMed] [Google Scholar]
- Hempel N, Trebak M (2017) Crosstalk between calcium and reactive oxygen species signaling in cancer. Cell Calcium 63: 70–96 [DOI] [PMC free article] [PubMed] [Google Scholar]
- Holmstrom KM, Finkel T (2014) Cellular mechanisms and physiological consequences of redox‐dependent signalling. Nat Rev Mol Cell Biol 15: 411–421 [DOI] [PubMed] [Google Scholar]
- Hooper R, Zhang XX, Webster M, Go C, Kedra J, Marchbank K, Gill DL, Weeraratna AT, Trebak M, Soboloff J (2015) Novel protein kinase C‐mediated control of Orai1 function in invasive melanoma. Mol Cell Biol 35: 2790–2798 [DOI] [PMC free article] [PubMed] [Google Scholar]
- Hoth M, Fanger CM, Lewis RS (1997) Mitochondrial regulation of store‐operated calcium signaling in T lymphocytes. J Cell Biol 137: 633–648 [DOI] [PMC free article] [PubMed] [Google Scholar]
- Hoth M (2016) CRAC channels, calcium, and cancer in light of the driver and passenger concept. Biochim Biophys Acta 1863: 1408–1417 [DOI] [PubMed] [Google Scholar]
- Huntley RP, Sawford T, Mutowo‐Meullenet P, Shypitsyna A, Bonilla C, Martin MJ, O'Donovan C (2015) The GOA database: gene ontology annotation updates for 2015. Nucleic Acids Res 43: D1057–D1063 [DOI] [PMC free article] [PubMed] [Google Scholar]
- Idelchik MDS, Begley U, Begley TJ, Melendez JA (2017) Mitochondrial ROS control of cancer. Semin Cancer Biol 47: 57–66 [DOI] [PMC free article] [PubMed] [Google Scholar]
- Iliopoulos D, Ernst C, Steplewski Z, Jambrosic JA, Rodeck U, Herlyn M, Clark WH Jr, Koprowski H, Herlyn D (1989) Inhibition of metastases of a human melanoma xenograft by monoclonal antibody to the GD2/GD3 gangliosides. J Natl Cancer Inst 81: 440–444 [DOI] [PubMed] [Google Scholar]
- Kar P, Parekh AB (2015) Distinct spatial Ca2+ signatures selectively activate different NFAT transcription factor isoforms. Mol Cell 58: 232–243 [DOI] [PMC free article] [PubMed] [Google Scholar]
- Kerkhofs M, Giorgi C, Marchi S, Seitaj B, Parys JB, Pinton P, Bultynck G, Bittremieux M (2017) Alterations in Ca(2+) signalling via ER‐mitochondria contact site remodelling in cancer. Adv Exp Med Biol 997: 225–254 [DOI] [PubMed] [Google Scholar]
- Le Gal K, Ibrahim MX, Wiel C, Sayin VI, Akula MK, Karlsson C, Dalin MG, Akyurek LM, Lindahl P, Nilsson J et al (2015) Antioxidants can increase melanoma metastasis in mice. Sci Transl Med 7: 308re8 [DOI] [PubMed] [Google Scholar]
- van Lith M, Tiwari S, Pediani J, Milligan G, Bulleid NJ (2011) Real‐time monitoring of redox changes in the mammalian endoplasmic reticulum. J Cell Sci 124: 2349–2356 [DOI] [PMC free article] [PubMed] [Google Scholar]
- Lynes EM, Bui M, Yap MC, Benson MD, Schneider B, Ellgaard L, Berthiaume LG, Simmen T (2012) Palmitoylated TMX and calnexin target to the mitochondria‐associated membrane. EMBO J 31: 457–470 [DOI] [PMC free article] [PubMed] [Google Scholar]
- Lytton J, Westlin M, Hanley MR (1991) Thapsigargin inhibits the sarcoplasmic or endoplasmic‐reticulum CA‐atpase family of calcium pumps. J Biol Chem 266: 17067–17071 [PubMed] [Google Scholar]
- Mancini M, Toker A (2009) NFAT proteins: emerging roles in cancer progression. Nat Rev Cancer 9: 810–820 [DOI] [PMC free article] [PubMed] [Google Scholar]
- Mehta S, Aye‐Han N‐N, Ganesan A, Oldach L, Gorshkov K, Zhang J (2014) Calmodulin‐controlled spatial decoding of oscillatory Ca(2+) signals by calcineurin. Elife 3: e03765 [DOI] [PMC free article] [PubMed] [Google Scholar]
- Meitzler JL, Makhlouf HR, Antony S, Wu Y, Butcher D, Jiang G, Juhasz A, Lu J, Dahan I, Jansen‐Dürr P et al (2017) Decoding NADPH oxidase 4 expression in human tumors. Redox Biol 13: 182–195 [DOI] [PMC free article] [PubMed] [Google Scholar]
- Muller MR, Rao A (2010) NFAT, immunity and cancer: a transcription factor comes of age. Nat Rev Immunol 10: 645–656 [DOI] [PubMed] [Google Scholar]
- Murphy MP (2009) How mitochondria produce reactive oxygen species. Biochem J 417: 1–13 [DOI] [PMC free article] [PubMed] [Google Scholar]
- Pan MG, Xiong Y, Chen F (2013) NFAT gene family in inflammation and cancer. Curr Mol Med 13: 543–554 [DOI] [PMC free article] [PubMed] [Google Scholar]
- Panieri E, Santoro MM (2016) ROS homeostasis and metabolism: a dangerous liason in cancer cells. Cell Death Dis 7: e2253 [DOI] [PMC free article] [PubMed] [Google Scholar]
- Pedriali G, Rimessi A, Sbano L, Giorgi C, Wieckowski MR, Previati M, Pinton P (2017) Regulation of endoplasmic reticulum–mitochondria Ca2+ transfer and its importance for anti‐cancer therapies. Front Oncol 7: 180 [DOI] [PMC free article] [PubMed] [Google Scholar]
- Perotti V, Baldassari P, Bersani I, Molla A, Vegetti C, Tassi E, Dal Col J, Dolcetti R, Anichini A, Mortarini R (2012) NFATc2 is a potential therapeutic target in human melanoma. J Invest Dermatol 132: 2652–2660 [DOI] [PubMed] [Google Scholar]
- Petrungaro C, Zimmermann KM, Kuttner V, Fischer M, Dengjel J, Bogeski I, Riemer J (2015) The Ca(2+)‐dependent release of the Mia40‐induced MICU1‐MICU2 dimer from MCU regulates mitochondrial Ca(2+) uptake. Cell Metab 22: 721–733 [DOI] [PubMed] [Google Scholar]
- Phan V, Schmidt J, Matyash V, Malchow S, Thanisch M, Lorenz C, Diepolder I, Schulz JB, Stenzel W, Roos A et al (2018) Characterization of naive and Vitamin C‐treated mouse Schwann cell line MSC80: induction of the anti‐oxidative Thioredoxin Related Transmembrane Protein 1. J Proteome Res 17: 2925–2936 [DOI] [PubMed] [Google Scholar]
- Piskounova E, Agathocleous M, Murphy MM, Hu Z, Huddlestun SE, Zhao Z, Leitch AM, Johnson TM, DeBerardinis RJ, Morrison SJ (2015) Oxidative stress inhibits distant metastasis by human melanoma cells. Nature 527: 186–191 [DOI] [PMC free article] [PubMed] [Google Scholar]
- Poburko D, Santo‐Domingo J, Demaurex N (2011) Dynamic regulation of the mitochondrial proton gradient during cytosolic calcium elevations. J Biol Chem 286: 11672–11684 [DOI] [PMC free article] [PubMed] [Google Scholar]
- Pouli D, Balu M, Alonzo CA, Liu Z, Quinn KP, Rius‐Diaz F, Harris RM, Kelly KM, Tromberg BJ, Georgakoudi I (2016) Imaging mitochondrial dynamics in human skin reveals depth‐dependent hypoxia and malignant potential for diagnosis. Sci Transl Med 8: 367ra169 [DOI] [PMC free article] [PubMed] [Google Scholar]
- Prakriya M, Lewis RS (2015) Store‐operated calcium channels. Physiol Rev 95: 1383–1436 [DOI] [PMC free article] [PubMed] [Google Scholar]
- Prevarskaya N, Skryma R, Shuba Y (2011) Calcium in tumour metastasis: new roles for known actors. Nat Rev Cancer 11: 609–618 [DOI] [PubMed] [Google Scholar]
- Prior KK, Wittig I, Leisegang MS, Groenendyk J, Weissmann N, Michalak M, Jansen‐Durr P, Shah AM, Brandes RP (2016) The endoplasmic reticulum chaperone calnexin is a NADPH oxidase NOX4 interacting protein. J Biol Chem 291: 7045–7059 [DOI] [PMC free article] [PubMed] [Google Scholar]
- Rao A, Luo C, Hogan PG (1997) Transcription factors of the NFAT family: regulation and function. Annu Rev Immunol 15: 707–747 [DOI] [PubMed] [Google Scholar]
- Raturi A, Gutierrez T, Ortiz‐Sandoval C, Ruangkittisakul A, Herrera‐Cruz MS, Rockley JP, Gesson K, Ourdev D, Lou PH, Lucchinetti E et al (2016) TMX1 determines cancer cell metabolism as a thiol‐based modulator of ER mitochondria Ca2+ flux. J Cell Biol 214: 433–444 [DOI] [PMC free article] [PubMed] [Google Scholar]
- Reiter TA, Abraham RT, Choi MJ, Rusnak F (1999) Redox regulation of calcineurin in T‐lymphocytes. J Biol Inorg Chem 4: 632–644 [DOI] [PubMed] [Google Scholar]
- Robey RB, Hay N (2009) Is Akt the “Warburg kinase”?—Akt‐energy metabolism interactions and oncogenesis. Semin Cancer Biol 19: 25 [DOI] [PMC free article] [PubMed] [Google Scholar]
- Roesch A, Vultur A, Bogeski I, Wang H, Zimmermann KM, Speicher D, Korbel C, Laschke MW, Gimotty PA, Philipp SE et al (2013) Overcoming intrinsic multidrug resistance in melanoma by blocking the mitochondrial respiratory chain of slow‐cycling JARID1B(high) cells. Cancer Cell 23: 811–825 [DOI] [PMC free article] [PubMed] [Google Scholar]
- Rowland AA, Voeltz GK (2012) Endoplasmic reticulum‐mitochondria contacts: function of the junction. Nat Rev Mol Cell Biol 13: 607–615 [DOI] [PMC free article] [PubMed] [Google Scholar]
- Sabharwal SS, Schumacker PT (2014) Mitochondrial ROS in cancer: initiators, amplifiers or an Achilles' heel? Nat Rev Cancer 14: 709–721 [DOI] [PMC free article] [PubMed] [Google Scholar]
- Santos CX, Hafstad AD, Beretta M, Zhang M, Molenaar C, Kopec J, Fotinou D, Murray TV, Cobb AM, Martin D et al (2016) Targeted redox inhibition of protein phosphatase 1 by Nox4 regulates eIF2α‐mediated stress signaling. EMBO J 35: 319–334 [DOI] [PMC free article] [PubMed] [Google Scholar]
- Satyamoorthy K, Li G, Gerrero MR, Brose MS, Volpe P, Weber BL, Van Belle P, Elder DE, Herlyn M (2003) Constitutive mitogen‐activated protein kinase activation in melanoma is mediated by both BRAF mutations and autocrine growth factor stimulation. Cancer Res 63: 756–759 [PubMed] [Google Scholar]
- Saul S, Gibhardt CS, Schmidt B, Lis A, Pasieka B, Conrad D, Jung P, Gaupp R, Wonnenberg B, Diler E et al (2016) A calcium‐redox feedback loop controls human monocyte immune responses: the role of ORAI Ca2+ channels. Sci Signal 9: ra26 [DOI] [PubMed] [Google Scholar]
- Sayin VI, Ibrahim MX, Larsson E, Nilsson JA, Lindahl P, Bergo MO (2014) Antioxidants accelerate lung cancer progression in mice. Sci Transl Med 6: 221ra15 [DOI] [PubMed] [Google Scholar]
- Schadendorf D, Fisher DE, Garbe C, Gershenwald JE, Grob JJ, Halpern A, Herlyn M, Marchetti MA, McArthur G, Ribas A et al (2015) Melanoma. Nat Rev Dis Primers 1: 15003 [DOI] [PubMed] [Google Scholar]
- Schindelin J, Arganda‐Carreras I, Frise E, Kaynig V, Longair M, Pietzsch T, Preibisch S, Rueden C, Saalfeld S, Schmid B et al (2012) Fiji: an open‐source platform for biological‐image analysis. Nat Methods 9: 676–682 [DOI] [PMC free article] [PubMed] [Google Scholar]
- Schrepfer E, Scorrano L (2016) Mitofusins, from mitochondria to metabolism. Mol Cell 61: 683–694 [DOI] [PubMed] [Google Scholar]
- Sharma S, Quintana A, Findlay GM, Mettlen M, Baust B, Jain M, Nilsson R, Rao A, Hogan PG (2013) An siRNA screen for NFAT activation identifies septins as coordinators of store‐operated Ca2+ entry. Nature 499: 238–242 [DOI] [PMC free article] [PubMed] [Google Scholar]
- Shaw J, Utz P, Durand D, Toole J, Emmel E, Crabtree G (1988) Identification of a putative regulator of early T cell activation genes. Science 241: 202–205 [DOI] [PubMed] [Google Scholar]
- Shoshan E, Braeuer RR, Kamiya T, Mobley AK, Huang L, Vasquez ME, Velazquez‐Torres G, Chakravarti N, Ivan C, Prieto V et al (2016) NFAT1 directly regulates IL8 and MMP3 to promote melanoma tumor growth and metastasis. Can Res 76: 3145–3155 [DOI] [PMC free article] [PubMed] [Google Scholar]
- Stafford WC, Peng X, Olofsson MH, Zhang X, Luci DK, Lu L, Cheng Q, Trésaugues L, Dexheimer TS, Coussens NP et al (2018) Irreversible inhibition of cytosolic thioredoxin reductase 1 as a mechanistic basis for anticancer therapy. Sci Transl Med 10: eaaf7444 [DOI] [PMC free article] [PubMed] [Google Scholar]
- Stanisz H, Saul S, Muller CSL, Kappl R, Niemeyer BA, Vogt T, Hoth M, Roesch A, Bogeski I (2014) Inverse regulation of melanoma growth and migration by Orai1/STIM2‐dependent calcium entry. Pigment Cell Melanoma Res 27: 442–453 [DOI] [PubMed] [Google Scholar]
- Stanisz H, Vultur A, Herlyn M, Roesch A, Bogeski I (2016) The role of Orai‐STIM calcium channels in melanocytes and melanoma. J Physiol 594: 2825–2835 [DOI] [PMC free article] [PubMed] [Google Scholar]
- Theodosakis N, Micevic G, Kelly DP, Bosenberg M (2014) Mitochondrial function in melanoma. Arch Biochem Biophys 563: 56–59 [DOI] [PubMed] [Google Scholar]
- Uhlen M, Zhang C, Lee S, Sjöstedt E, Fagerberg L, Bidkhori G, Benfeitas R, Arif M, Liu Z, Edfors F et al (2017) A pathology atlas of the human cancer transcriptome. Science 357: eaan2507 [DOI] [PubMed] [Google Scholar]
- Vazquez F, Lim JH, Chim H, Bhalla K, Girnun G, Pierce K, Clish CB, Granter SR, Widlund HR, Spiegelman BM et al (2013) PGC1alpha expression defines a subset of human melanoma tumors with increased mitochondrial capacity and resistance to oxidative stress. Cancer Cell 23: 287–301 [DOI] [PMC free article] [PubMed] [Google Scholar]
- Villanueva J, Vultur A, Lee JT, Somasundaram R, Fukunaga‐Kalabis M, Cipolla AK, Wubbenhorst B, Xu X, Gimotty PA, Kee D et al (2010) Acquired resistance to BRAF inhibitors mediated by a RAF kinase switch in melanoma can be overcome by cotargeting MEK and IGF‐1R/PI3K. Cancer Cell 18: 683–695 [DOI] [PMC free article] [PubMed] [Google Scholar]
- Villanueva J, Infante JR, Krepler C, Reyes‐Uribe P, Samanta M, Chen HY, Li B, Swoboda RK, Wilson M, Vultur A et al (2013) Concurrent MEK2 mutation and BRAF amplification confer resistance to BRAF and MEK inhibitors in melanoma. Cell Rep 4: 1090‐1099 [DOI] [PMC free article] [PubMed] [Google Scholar]
- Wang XT, Culotta VC, Klee CB (1996) Superoxide dismutase protects calcineurin from inactivation. Nature 383: 434–437 [DOI] [PubMed] [Google Scholar]
- Weinberg F, Chandel NS (2009) Reactive oxygen species‐dependent signaling regulates cancer. Cell Mol Life Sci 66: 3663–3673 [DOI] [PMC free article] [PubMed] [Google Scholar]
- Will T, Helms V (2016) PPIXpress: construction of condition‐specific protein interaction networks based on transcript expression. Bioinformatics 32: 571–578 [DOI] [PubMed] [Google Scholar]
- Willems PH, Rossignol R, Dieteren CE, Murphy MP, Koopman WJ (2015) Redox homeostasis and mitochondrial dynamics. Cell Metab 22: 207–218 [DOI] [PubMed] [Google Scholar]
- Yamaura M, Mitsushita J, Furuta S, Kiniwa Y, Ashida A, Goto Y, Shang WH, Kubodera M, Kato M, Takata M et al (2009) NADPH oxidase 4 contributes to transformation phenotype of melanoma cells by regulating G2‐M cell cycle progression. Cancer Res 69: 2647–2654 [DOI] [PubMed] [Google Scholar]
- Zong WX, Rabinowitz JD, White E (2016) Mitochondria and cancer. Mol Cell 61: 667–676 [DOI] [PMC free article] [PubMed] [Google Scholar]
Associated Data
This section collects any data citations, data availability statements, or supplementary materials included in this article.
Supplementary Materials
Appendix
Expanded View Figures PDF
Review Process File