

Abstract
Parkin mutations in humans produce parkinsonism whose pathogenesis is related to impaired protein degradation, increased free radicals, and abnormal neurotransmitter release. The role of glia in parkin deficiency is little known. We cultured midbrain glia from wild-type (WT) and parkin knock-out (PK-KO) mice. After 18–20 d in vitro, PK-KO glial cultures had less astrocytes, more microglia, reduced proliferation, and increased proapoptotic protein expression.
PK-KO glia had greater levels of intracellular glutathione (GSH), increased mRNA expression of the GSH-synthesizing enzyme γ-glutamylcysteine synthetase, and greater glutathione S-transferase and lower glutathione peroxidase activities than WT. The reverse happened in glia cultured in serum-free defined medium (EF12) or in old cultures. PK-KO glia was more susceptible than WT to transference to EF12 or neurotoxins (1-methyl-4-phenylpyridinium, blockers of GSH synthesis or catalase, inhibitors of extracellular signal-regulated kinase 1/2 and phosphatidylinositol 3 kinases), aging of the culture, or combination of these insults. PK-KO glia was less susceptible than WT to Fe2+ plus H2O2 and less responsive to protection by deferoxamine.
Old WT glia increased the expression of heat shock protein 70, but PK-KO did not. Glia conditioned medium (GCM) from PK-KO was less neuroprotective and had lower levels of GSH than WT. GCM from WT increased the levels of dopamine markers in midbrain neuronal cultures transferred to EF12 more efficiently than GCM from PK-KO, and the difference was corrected by supplementation with GSH. PK-KO-GCM was a less powerful suppressor of apoptosis and microglia in neuronal cultures. Our data prove that abnormal glial function is critical in parkin mutations, and its role increases with aging.
Keywords: astrocytes, microglia cells, parkin knock-out mice, proliferation index, glutathione, hydrogen peroxide, glia aging, Parkinson's disease
Introduction
Parkinson's disease (PD) is a multifactorial neurodegenerative disease (Litvan et al., 2007a,b) of genetic origin in 25% of the cases. Park-2, one of the genes responsible for autosomal recessive PD (AR-PD) codes for parkin, an ubiquitin E3 ligase protein (Kitada et al., 1998; Moore, 2006), whose suppression induces neuronal death related to abnormal processing of degraded proteins. Other pathogenic mechanisms may play additional roles in parkin-related AR-PD and may help to explain the selective lesion of the nigrostriatal pathway that occurs in these patients.
Astrocytes, the most abundant glial cells, support the differentiation, survival, pharmacological properties, and resistance to injury of dopamine neurons (Mena et al., 2002; Takuma et al., 2004). The role of glia is mediated by the secretion of chemical substances into the media (Mena et al., 1997a, 2002; de Bernardo et al., 2003). Dysfunctional astrocytes enhance neuronal degeneration by a diminished secretion of trophic factors (Riederer et al., 1989; Engele et al., 1991, 1996; Damier et al., 1993; Makar et al., 1994; Muller et al., 1995; Mena et al., 1997a, 1998b, 2002; Kinor et al., 2001), the release of cytokines, and the increased production of reactive oxidative molecules (Hirsch et al., 1999; Liberatore et al., 1999; Hirsch and Hunot, 2000; Vila et al., 2001; Wu et al., 2002; Canals et al., 2003b; de Bernardo et al., 2004).
Parkin enhances the survival of the dopamine neurons (Kitada et al., 1998; Abbas et al., 1999; Lucking et al., 2000). A putative role of parkin in glial function could explain a selectivity of parkin dysfunction in nigrostriatal dopamine neurons because these cells have the smallest glial/neuron ratios of the brain (Damier et al., 1993), and, therefore, the consequences of glial dysfunction in them could be more critical than in other brain regions. Parkin dysfunction impairs astrocytic function and contributes to the pathogenesis of parkin-linked AR-PD (Ledesma et al., 2002). Furthermore, a reduction in parkin levels renders the rat glial-like cell line RG-6 more susceptible to dopamine (DA)- and H2O2-induced cell death (MacCormac et al., 2004).
Parkin knock-out (PK-KO) mice are used to investigate the role of parkin (Goldberg et al., 2003; Itier et al., 2003; Von Coelln et al., 2004; Perez and Palmiter, 2005). These mice present abnormal release and metabolism of dopamine and increased susceptibility to rotenone in early adulthood and severe dopamine cell loss while aging (Itier et al., 2003; Casarejos et al., 2005, 2006; Serrano et al., 2005; Solano et al., 2006, Rodriguez-Navarro et al., 2007). Microglia increases rotenone-induced dopamine cell loss in PK-KO midbrain neuronal cultures (Casarejos et al., 2006). PK-KO mice, therefore, are a good model to study the role of glia in parkin-related AR-PD. The aim of this work was to characterize the PK-KO mesencephalic glial cultures, to provide new information concerning cellular responses of glia to oxidative stress, and to study the glial role in neuronal death during aging in PK-KO models.
Materials and Methods
Culture media.
DMEM with high glucose (4.5 g/L), Ham's F-12 nutrient mixture, Eagle's minimal essential medium (EMEM) with Earl's salts, Leibovitz's L-15 medium, B27/Neurobasal TM medium, HBSS, l-glutamine, pyruvate, penicillin–streptomycin, and fetal bovine serum (United States origin) were purchased from Invitrogen (Carlsbad, CA). Glucose at 45%, trypsin–EDTA, insulin, putrescine, progesterone, sodium selenite, and poly-d-lysine were from Sigma (Madrid, Spain), and human transferrin, 30% iron-saturated, was from Roche Diagnostics (Barcelona, Spain). All other agents were of the highest commercially available purity, from Merck (Darmstadt, Germany) or Sigma. The radiochemical [3H]DA (70 Ci/mmol) was obtained from DuPont NEN (Boston, MA).
Antibodies.
Polyclonal anti-glial fibrillary acidic protein (GFAP) raised in rabbit and mouse anti-bromodeoxyuridine (BrdU) antibodies were from DakoCytomation (Glostrup, Denmark), O1 antibody was obtained from hybridoma supernatants (Raff et al., 1979, 1983), and isolectin B4 from Bandeiraea simplicifolia peroxidase labeled, anti-total extracellular signal-regulated kinase (ERK), and anti-phospho-ERK1/2 antibody were purchased from Sigma. Anti-mouse IgG fluorescein was from Jackson ImmunoResearch (West Grove, PA), and anti-rat IgG Alexa Fluor 568 and anti-rabbit Alexa Fluor 488 were from Invitrogen. Anti-tyrosine hydroxylase (TH) antibody made in mouse and mouse monoclonal anti-GFAP antibody were from Chemicon (Temecula, CA). Mouse monoclonal anti-OX6 (specific for major histocompatibility complex class II4 antigens) and rat anti-CD11b antibodies were from Serotec (Oxford, UK). Rabbit polyclonal anti-BclxS/L (S-18) antibody and mouse monoclonal anti-heat shock protein 70 (HSP-70) were from Santa Cruz Biotechnology (Heidelberg, Germany), and rabbit polyclonal anti-parkin antibody was from Cell Signaling Technology (Boston, MA).
Chemicals.
The apoptosis terminal deoxynucleotidyl transferase-mediated biotinylated UTP nick end labeling (TUNEL) detection kit was from Promega (Madison WI). The cytotoxicity detection kit for lactate dehydrogenase (LDH) and the cell proliferation kit I [3-(4,5-dimethylthiazol-2-yl)-2,5-diphenyl tetrazolium bromide (MTT)] were from Roche Diagnostics. PD98059 [2-(2-amino-3-methyoxyphenyl)-4H-1-benzopyran-4-one] and LY-294002 [2-(4-morpholinyl)-8-phenyl-1(4H)-benzopyran-4-one] were from Alexis (Carlsbad, CA). The BCA protein assay kit was from Pierce (Rockford, IL). Bis-benzimide, l-buthionine-S, R-sulfoximine (BSO), BrdU, 1-methyl-4-phenylpyridinium (MPP+), deferoxamine mesylate (DFO), hydrogen peroxide (30% w/w), 3-amino-1,2,4-triazole (3AT), 1-chloro-2,4-dinitrobenzene (CDNB), propidium iodide (PI), and glutathione S-transferase enzyme were purchased from Sigma. GBR 12935 (1-[2-(diphenyl-methoxy)-ethyl]-4-(3-phenylpropyl)piperazine), a dopamine transporter inhibitor, was from Tocris Bioscience (Ellisville, MO). All other reagents were of the highest purity commercially available from Merck or Sigma.
Cell cultures.
Glial mesencephalic cultures and neuronal-enriched mesencephalic primary cultures were obtained from 129SV/C57BL/6 wild-type (WT) or parkin mutant mice (Itier et al., 2003). Cultures were derived from littermate −/− and +/+ embryos obtained from homozygous colonies generated previously by heterozygous parkin −/+ intercross. The genotype was confirmed by PCR analysis of tail tissue and by Western blot analysis of parkin protein in the cultures (Casarejos et al., 2005). Procedures using laboratory animals were in accordance with the European Union Directives. All efforts were made to minimize the number of animals used and their suffering.
For glial cultures, the ventral mesencephalon was removed from embryonic tissue (day 13 of gestation), diced in small fragments, and incubated in trypsin–EDTA (0.5% in HBSS) at 37°C for 15 min. Trypsinization was stopped by adding culture medium, and the tissue was gently centrifuged. The supernatant was discarded, and the pellet was resuspended in 1 ml of culture medium. Single-cell dissociation was achieved by mechanical disruption. Dissociated cells were plated in DMEM with 15% (v/v) heat-inactivated fetal bovine serum, 4 mm l-glutamine, 1 mm pyruvate, and 100 U/ml penicillin–streptomycin (growth medium; DMEM–FCS) (de Bernardo et al., 2003) at a density of 3 × 10⁶ cells per 80 cm2 cell culture flask. Culture medium was refreshed after 6–7 d and every 7 d thereafter. After 18 d in culture, positive staining with anti-GFAP antibody identified the astrocytes in these cultures and contained at least 80–90% of total cells.
To obtain the glia-conditioned medium (GCM), DMEM–FCS medium was discarded, and the cells were washed out three times with Leibovitz's L-15 medium and subsequently cultured in a chemically serum-free defined medium (EF12) (Mena et al., 1993; Pardo et al., 1997). After 24 h of culture under such conditions, the medium was collected and stored frozen. This medium was considered GCM. EF12 consisted of a 1:1 (v/v) EMEM and nutrient mixture of Ham's F-12, supplemented with d-glucose (6 mg/ml), insulin (25 mg/ml), transferrin (100 mg/ml), putrescine (60 mm), progesterone (20 nm), and sodium selenite (30 nm).
Neuronal-enriched mesencephalic primary cultures were obtained and prepared as described previously (Casarejos et al., 2005). The ventral mesencephalon was removed from embryonic tissue (day 13 of gestation) and incubated with 0.36 mg/ml papain in PBS/d-glucose (6 mg/ml)/1% BSA buffer for 15 min at 37°C and mechanically dissociated in the presence of 10 mg/ml DNase-I. The cells were seeded in B27/Neurobasal TM medium with 15% (v/v) heat-inactivated fetal calf serum (B27/NBL–FCS) supplemented with glutamine (4 mm) and penicillin– streptomycin (100 U/ml) at a density of 2.5 × 10⁵ cells/cm2 in multiwells or 2 × 10⁵ cells/cm2 in glass cover slides precoated with poly-d-lysine (4.5 μg/cm2) in 0.1 m borate buffer, pH 8.4, and laminin (3 μg/ml). The cultures were kept in a humidified chamber at 37°C in a 5% CO2 atmosphere for 7–8 d in vitro. Twenty-four hours after plating, the cells were changed to serum-free medium (B27/NBL).
Treatment of the cells.
After 15–20 d in vitro (DIV) in the growth medium (DMEM–FCS), glial cultures had reached confluency; at this time, the cells were mildly trypsinized and reseeded for the different experiments at a density of 1.3 × 10⁴ cells/cm2 in 24-, 12-, or 6-well plate cultures and maintained in growth medium for 5–6 additional days for cell viability studies, detoxification, enzymatic activities, and protein and mRNA expression studies, respectively. For BrdU proliferation studies, TUNEL and propidium iodide assays, and phenotype characterization, the cells were seeded at 20,000 cells/cover slide and used 3 and 6 d after seeding, respectively. For [3H]DA uptake in glial cultures, we used 30–45 DIV glial cultures, after testing that only glial cells were present, at a density of 1.3 × 10⁴ cells/cm2 in 24-well plate cultures and maintained in growth medium for 6 additional days.
To study the effects of different oxidative stress insults, after 5 d of reseeding in 24-well plates, the growth medium was changed to serum-free defined medium (EF12) and incubated during 24, 52, or 72 h alone or in presence of MPP+ (30 μm). In another set of experiments, 6–7 DIV after seeding, the cells were treated with H2O2 (50, 100, or 200 μm) for different times, in EMEM plus d-glucose (6 mg/ml), the most appropriated medium for H2O2 studies.
To assess the relative contributions of glutathione (GSH) and catalase to H2O2 toxicity, glial cultures were preincubated either for 24 h with the GSH synthesis inhibitor BSO (40 μm) or 2 h with the catalase activity inhibitor 3AT (10 mm) before the addition of H2O2 (100 or 200 μm) for 3 h. For BSO plus 3AT conditions, cells were incubated for 24 h with BSO and for the last 2 h with 3AT.
The roles of the mitogen-activated protein kinase (MAPK) and phosphatidylinositol 3 kinase (PI3K) signaling pathways in the H2O2 effects in WT and PK-KO glial cultures were investigated using the mitogen ERK-1/2 inhibitor PD98059 (15 μm) and the specific PI3K inhibitor LY-294002 (25 μm), 30 min before the H2O2 treatment (200 μm for 3 h). The iron contribution to the cytotoxicity induced by hydrogen peroxide treatment was studied by iron supplementation, with FeSO4 (50 μm), and iron chelating, with DFO. FeSO4 (50 μm) was added to the cells at the time of H2O2 (100 μm) treatment, and DFO was added in a final concentration of 2 or 4 mm, 2 h before the application of the peroxide.
In longitudinal studies, the effects of aging in WT and PK-KO glial cultures were performed maintaining the glial cultures during different periods of time, from 20 DIV to 9 months, changing the growth medium (DMEM–FCS) every week.
The effect of WT and PK-KO GCM on cell survival and DA expression was investigated in 6 DIV neuronal-enriched mesencephalic primary cultures treated during 24 h with defined medium or WT and PK-KO glia-conditioned medium. The number of TH+, microglial, and apoptotic cells present in the neuronal cultures was counted after 24 h of incubation with GCM or defined medium.
Immunocytochemistry.
After 7 DIV, midbrain WT and PK-KO cultures were used for phenotype studies. Astrocytes were characterized by immunostaining with a rabbit anti-GFAP antibody (1:500). Microglial cells were identified with isolectin B4 peroxidase-labeled (12.5 μg/ml) (Streit and Kreutzberg, 1987; Ashwell, 1991) or rat anti-CD11b antibody (1:50). In neuronal-enriched midbrain cultures, DA neurons were characterized by immunostaining with a mouse anti-TH antibody (1:500).
The cells were fixed with 4% paraformaldehyde, washed in 0.1 m PBS, pH 7.4, permeabilized with ethanol/acetic acid (19:1), and incubated at 4°C for 24 h with primary antibodies diluted in PBS containing 10% fetal bovine serum. CD11b antibody, diluted in TBS/0.1% Triton X-100, was added to fixed cells without permeabilization. Fluorescein- and Alexa Fluor-conjugated secondary antibodies were used to visualize positive cells under fluorescent microscopy. For microglial cells identification with isolectin B4 peroxidase-labeled, cultures were fixed with 4% paraformaldehyde–1% glutaraldehyde and incubated overnight at 4°C with isolectin B4 peroxidase-labeled diluted in TBS/0.1% Triton X-100; the positive cells were developed with a DAB system (LSAB2 system; DakoCytomation) and visualized under optical microscopy. Total nuclei were stained with bis-benzimide.
The number of immunoreactive cells was counted in one-seventh of the total area of the cover slides, and the nuclei were stained with bis-benzimide added in the anti-fading solution and counted in 10 predefined fields that represent of the cover slide area. The cells were counted in predefined parallel strips using a counting reticule inserted into the ocular.
3 H-Dopamine uptake.
[3H]DA uptake was measured after incubation of the 7 DIV neuronal cultures and 30–45 DIV glial cultures with 10−8 m [3H]DA (70 Ci/mmol), in the presence of 10−5 m pargyline, and 10−3 m ascorbic acid, at 37°C for 20 min. Nonspecific uptake/binding was calculated in the presence of 10−5 m mazindol for neuronal cultures or 1–10 μm GBR 12935 (dopamine transporter inhibitor) for glial cultures and represented ≤5% (Mena et al., 1993; Pardo et al., 1997).
BrdU incorporation.
Three days after reseeding in the growth medium, WT and PK-KO glial cultures were incubated with 5-bromo-3-deoxyuridine (5 × 10⁻⁵ m). Twenty-four hours later, cells were fixed with 4% paraformaldehyde, permeabilized with ethanol/acetic acid solution (19:1), and treated with 2N HCl for 30 min at 4°C. A primary monoclonal antibody against BrdU (1:20) was added for 24 h at 4°C. An anti-mouse fluorescein-conjugated secondary antibody (45 min at room temperature) was used to visualize proliferate cells (BrdU+ cells) under fluorescent microscopy. Data of proliferate cells was expressed as a percentage of total cells in WT and PK-KO cultures.
Measurement of the cell viability.
Mitochondrial activity was analyzed with the MTT assay in WT and PK-KO glial cultures. The MTT assay determines the ability of cells to metabolize MTT. At the end of the cell treatment period, 300 μl of culture medium was removed from total 500 μl of each well, and 20 μl of MTT solution (5 mg/ml) was added and incubated for 2 h. At this time, 200 μl of solubilization solution (10% SDS in 0.01 m HCl) was then added to the wells, and, after 24 h of incubation at 37°C, 100 μl were transferred into a 96-well microtiter plate, and the absorption value at 540 nm was measured in an automatic microtiter reader (Spectra Fluor; Tecan, Männedorf, Switzerland).
Apoptosis was measured by light microscopy features, DNA staining, and the TUNEL assay. Cells growing on cover slides were fixed in 4% paraformaldehyde, and the nuclei were stained with bis-benzimide (Hoechst 33342) added to the anti-fading solution, 3 × 10⁻⁶ m final concentration (Pardo et al., 1997), and counted in of the cover slide area; apoptotic cells were identified by chromatin condensation.
TUNEL detection system for apoptosis measures the fragmented DNA of cells by incorporating fluorescein-12-dUTP* at the 3′-OH ends of the DNA by using the enzyme terminal deoxynucleotidyl transferase (TdT) (Gavrieli et al., 1992). For this assay, the cells were fixed in 4% paraformaldehyde and permeabilized with 0.2% Triton X-100. The fluorescein-12-dUTP-labeled DNA of apoptotic cells was visualized by fluorescence microscopy. The number of TUNEL+ cells was counted in of the cover slide area. Cells were counted in predefined parallel strips by using a counting reticule in the microscope ocular. Cells incubated with buffer in the absence of TdT enzyme were used as negative controls.
For necrotic cell death, lactate dehydrogenase activity was measured in the culture medium by using a cytotoxicity detection kit and PI dye exclusion assay was performed. Propidium iodide is membrane impermeable and excluded from viable cells. The number of red fluorescence PI+ cells was counted in one-seventh of the total area of the cover slides, in predefined parallel strips using a counting reticule inserted into the microscope ocular.
Measurement of GSH.
Total glutathione levels in WT and PK-KO glial cultures were measured by the method of Tietze (1969). Briefly, cells from fetal midbrain cultures were washed with PBS, lysed in 100 μl of 0.4 N perchloric acid (PCA) for 30 min at 4°C, and centrifuged, and the supernatants were neutralized with four volumes of 0.1 m NaH2PO4 and 5 mm EDTA, pH 7.5. Glutathione content was measured in a P96 automatic reader by the addition of 5,5′ dithio-bis-2-nitrobenzoic acid (0.6 mm), NADPH (0.2 mm), and glutathione reductase (1 U), and the reaction was monitored at 412 nm for 6 min. Oxidized glutathione (GSSG) was measured in the cells by the method of Griffith (1980). Briefly, after PCA extraction and pH neutralization, reduced glutathione (GSH) was derivatized with 2-vinylpyridine at room temperature for 1 h, and the reaction performed as above. GSH was obtained by subtracting GSSG levels from total glutathione levels.
To analyzed the GSH levels in GCM, we added 10 μl of 1N PCA to 50 μl of GCM, and, after centrifugation, the supernatant was used as above.
Glutathione peroxidase, glutathione S-transferase, and catalase enzyme activity assay.
In WT and PK-KO glial cultures after 7 DIV, the cells were washed with PBS, harvested by centrifugation at 1000 × g for 5 min, pooled in 110 μl of 50 mm potassium phosphate, pH 7.2, 1 mm EDTA, and sonicated. The homogenate was centrifuged at 10,000 × g for 15 min at 4°C, and the supernatant was used for glutathione peroxidase (GPx), catalase activity, and protein determination. GPx activity was measured according to the method of Flohe and Gunzler (1984). Briefly, 110 μl of 50 mm potassium phosphate, pH 7.2, 1 mm EDTA, 25 μl of 10 mm GSH, and 25 μl of GSH reductase (0.6 U/μl) were added over 40 μl of the cell homogenates. This reaction mixture was incubated for 5 min at 37°C, after which 25 μl of 1.5 mm NADPH was added. The change in absorbance was followed at 340 nm for 5 min at room temperature to quantify the hydroperoxide independent oxidation of NADPH. Twenty-five microliters of 12 mm tert-butyl hydroperoxide were then added, and the rate of NADPH oxidation was followed at 340 nm for 5 min. One unit of GPx activity is the amount of enzyme necessary to oxidize 1 μmol of NADPH per minute.
For catalase activity measurement, we used 10 μl of the cell homogenates obtained as above. The assay is based on the reaction of the enzyme with methanol in the presence of an optimal concentration (4.2 mm) of hydrogen peroxide. The formaldehyde produced was measured spectrophotometrically with 4-amino-3-hydrazino-5-mercapto-1,2,4-triazole (Purpald) as a chromogen at 540 nm (Johansson and Borg, 1988). One unit of catalase is the amount of enzyme necessary to produce 1 μmol of formaldehyde per minute.
Glutathione transferase activity in WT and PK-KO glial cultures was determined by the method of Habig et al. (1974), using CDNB. After 7 DIV, the cells were washed with PBS, harvested by centrifugation at 1000 × g for 5 min, pooled in 110 μl of 0.1 m potassium phosphate, pH 7.0, and 1 mm EDTA, and sonicated. The homogenate was centrifuged at 10,000 × g for 15 min at 4°C, and the supernatant was used in the enzyme assay. The assay mixture consisted of 140 μl of 0.1 m potassium phosphate, pH 6.5, 20 μl of 1 mm CDNB, 20 μl of 1 mm GSH, and 20 μl of supernatant. The formation of the adduct of CDNB (S-2,4-dinitrophenyl glutathione) was monitored by measuring the rate of increase in absorbance at 340 nm at 25°C for 5 min.
Determination of H2O2 concentration.
The concentration of H2O2 in midbrain glial cultures was estimated with a colorimetric assay, in the most appropriate experimental culture media (EMEM plus glucose) for the H2O2 stability. After the experimental treatments, the media was centrifuged at 10,000 × g for 2 min, and 100 μl of the supernatants were added to 50 μl of 3,3′-dimethoxybenzidine (2 mm) and 50 μl of horseradish peroxidase (240 IU/ml). 3,3′-Dimethoxybenzidine, which is colorless in its reduced form, is oxidized in the presence of H2O2 and peroxidase into a red-colored product. Optical density was estimated at 490 nm. The concentration of H2O2 in the culture media was determined using standard solutions.
Western blot analysis.
Glial midbrain cultures were homogenized with a sonicator in lysis buffer containing 20 mm Tris-HCl, 10 mm potassium acetate, 1 mm dithiothreitol, 1 mm EDTA, 1 mm phenylmethylsulfonyl fluoride, 1 mm benzamidine, leupeptin, aprotinin, and pepstatin at 5 μg/ml each, and 0.25% NP-40, pH 7.4, and then centrifuged at 12,000 × g for 30 min at 4°C. For p-ERK and total ERK detection, 10 mm sodium fluoride, 2 mm sodium molibdate, 10 mm β-glicerophosphate, and 0.2 mm orthovanadate were added to the lysis buffer. The supernatant was used for protein determination by the BCA protein assay kit and for electrophoretical separation. Samples (20–40 μg of protein) were added to SDS sample loading buffer, electrophoresed in 10% SDS-polyacrylamide gels, and then electroblotted to 0.45 μm nitrocellulose membranes. For immunolabeling, the blots were blocked with TTBS [20 mm Tris-HCl, pH 7.6, 137 mm NaCl plus 0.1% (v/v) Tween-20 and 5% dry skimmed milk] for 1 h at room temperature. After blocking nonspecific binding, the membranes were incubated with different specific primary antibodies in blocking solution overnight at 4°C. The blots were developed by chemiluminescence detection using a commercial kit (GE Healthcare, Little Chalfont, UK) and quantified by computer-assisted video densitometry.
We used a rabbit polyclonal anti-parkin antibody diluted 1:500 to confirm the genotype of the WT and PK-KO glial cultures. For astroglial and microglial, mouse monoclonal anti-GFAP antibody diluted 1:5000 and mouse monoclonal anti-OX6 (1:500), respectively, were used. Other antibodies and dilutions used in the study were as follows: mouse monoclonal anti-HSP-70 (1:500) and rabbit polyclonal anti-BclxL/S antibody diluted 1:500; anti-phospho-ERK-1/2 and rabbit anti-ERK-1/2 diluted 1:5000 and 1:10,000, respectively. Mouse monoclonal anti-β-actin antibody diluted 1:5000 was used as a control of charge after inactivation of nitrocellulose membrane with sodium azide. Goat anti-mouse HRP and anti-rabbit HRP secondary antibodies were diluted 1:1000. β-Actin secondary antibody was an anti-mouse phosphatase alkaline conjugate diluted 1:300.
RNA isolation and cDNA synthesis.
The glial cultures from WT and PK-KO mice were homogenized in 1 ml of TRI Reagent (Invitrogen) per 10 cm2 of dish area and centrifuged at 12,000 × g for 10 min at 4°C. Chloroform was added to the supernatant, mixed well, and incubated at room temperature for 5 min. The mix was centrifuged at 12,000 × g for 10 min at 4°C, and the aqueous phase was mixed with isopropanol, vortexed for 5–10 s, and incubated at room temperature for 10 min. After centrifugation at 12,000 × g for 8 min at 4°C, the supernatant was discarded, and 1 ml of 75% ethanol was added. To remove the ethanol, it was centrifuged at 7,500 × g for 5 min, and the RNA pellet was briefly air dried. Total RNA was dissolved in DEPC water, and the integrity was verified by electrophoresis.
After the quantification in NanoDrop ND-1000 Spectrophotometer (NanoDrop Technologies, Wilmington, DE), 2 μg of total RNA, 1 μl of 100 μm oligo-dT, and water DEPC until 16 μl were incubated at 70°C for 5 min in the 2720 Thermal Cycler (Applied Biosystems, Warrington, UK). After cooling on ice, 9 μl of the reaction mixture [5 μl of 5× buffer, 2 μl of 10 mm dNTPs, 0.5 μl of RNasin (Roche, Indianapolis, IN), and 1.5 μl of avian myeloblastosis virus reverse transcriptase (Roche)] were added to each sample. The reverse transcription (RT) cycles were 70°C 5 min, 42°C 1 h, and 90°C 3 min in the 2720 Thermal Cycler.
Real-time quantitative PCR.
Expression levels of γ-glutamylcysteine synthetase (γ-GCS) mRNA were examined by iQ SybrGreen qPCR (Bio-Rad, Hercules, CA), on reverse-transcribed total RNA isolated from the glial cultures. Amplification reactions were performed in triplicate with 40 ng of cDNA sample, 1.5 μm gene specific primers, and 1× iQ SybrGreen Supermix (Bio-Rad), in 25 μl final volume. The primers were designed with PrimerBank, and the sequences 5′ to 3′ were as follows: glyceraldehyde-3-phosphate dehydrogenase (GAPDH) forward, TGACCACAGTCCATGCCATC; GAPDH reverse, GACGGACACATTGGGGGTAG; γ-GCS forward, GGGGTGACGAGGTGGAGTA; and γ-GCS reverse, GTTGGGGTTTGTCCTCTCCC. RT-quantitative PCR (qPCR) was performed on an iCycler detector (Bio-Rad) with the following thermal profile conditions: 95°C for 10 min, 45 cycles of 95°C for 30 s, and 59°C for 1 min. To differentiate specific amplicons from nonspecific products using SybrGreen, a DNA dissociation curve was generated after each reaction with the iCycler sequence detection system. γ-GCS mRNA was quantified relative to GAPDH mRNA using the comparative threshold cycle number (Ct) method. The Ct difference (δCt = Ct γ-GCS × Ct GAPDH) was taken as a relative quantity of the transcript, and the δCt from each PK-KO and WT glial cell well was compared with the mean of the WT δCt and expressed as 2ΔΔCt. The amplification efficiency was checked and found to be similar for both genes.
Statistical analysis.
The results were statistically evaluated for significance with one-way ANOVA followed by Newman–Keuls multiple comparison test. The interactions between the genotype and the treatment or between genotype and the age of the cells were analyzed by two-way ANOVA. Differences were considered statistically significant when p < 0.05. Analysis of data were performed using the GraphPad Software (San Diego, CA) Prism 4 software.
Results
Characterization of fetal mesencephalic glial cultures from parkin null mice
WT and PK-KO glial mesencephalic cultures used in these studies were kept in culture for different periods of time from 15 d up to 9 months in DMEM–FCS. After 15–20 d in culture, the glial cells reached confluence. The cultures from both WT and PK-KO mice had the same morphology. The cellular characterization of glial cultures (15–20 DIV) by immunocytochemistry showed that they were predominantly composed by type 2 astrocytes (GFAP+) and by a small percentage of microglial cells (Cd11b+) (Fig. 1A). PK-KO glial cultures had a reduced proportion of astrocytes, as measured by the levels of GFAP protein analyzed by Western blot (Fig. 1B), which were ∼20% lower in PK-KO with respect to WT glial cultures, and higher percentage of microglial cells, visualized by CD11b+ or isolectin B4 staining (Fig. 1C) (3.89% CD11b+ cells in WT vs 5.86% in PK-KO cultures). PK-KO glial cultures (15–20 DIV) present a lower cell proliferation ratio than those of WT, as shown by the BrdU+ incorporation (Fig. 1D,E).
Figure 1.

Characterization of glial mesencephalic cultures from WT and parkin null mice after 20 DIV. Glial cultures were maintained in DMEM–FCS medium. A, Photomicrographs of glial cells staining for type 2 astrocytes, with anti-GFAP+, microglial cells (CD11b+), and nuclei (bis-benzimide) in PK-KO midbrain glial cultures. Scale bar, 30 μm. B, Immunodetection and densitometric analysis of astroglial (GFAP) protein by Western blot. C, Percentage of microglial cells present in WT and PK-KO cultures. Photomicrographs (D) and percentage of proliferating cells (BrdU+) and total nuclei (E) stained with bis-benzimide of WT and PK-KO cells present in glial cultures incubated, with BrdU for 24 h, 3 d after reseeding. Scale bar, 20 μm. F, Immunodetection and densitometric analysis of the proapoptotic and antiapoptotic proteins, BclxL/S present in WT and PK-KO glial cultures. Values for immunocytochemistry studies are expressed as the mean ± SEM from six replicates of four independent cultures. Values for Western blotting experiment are the mean ± SEM from four replicates of two independent cultures. Statistical analysis was performed by one-way ANOVA, followed by Newman–Keuls multiple comparison test. +p < 0.05; ++p < 0.01, PK-KO versus WT cultures.
The expression of BclxL/S proteins, considered an index of apoptotic activity because BclxL is a protein of survival and BclxS is a proapoptotic protein, shows a significant increase of proapoptotic activity in PK-KO glial cultures (Fig. 1F).
We measured the intracellular GSH level and detoxification enzyme activities. As shown in Figure 2A, the level of intracellular GSH was 39% higher in glial PK-KO cultures than in WT. Furthermore, PK-KO young glial cultures have higher γ-glutamylcysteine synthetase, the rate-limiting GSH synthesis enzyme, mRNA levels than their age-matched WT (Fig. 2B). The specific activity of GPx was reduced in PK-KO cultures with respect to that of WT (Fig. 2C) and that of catalase was unchanged. To investigate the redox state in the parkin null glial cultures, we also measured glutathione S-transferase (GST) activity in WT and PK-KO glial cultures. GST activity was increased in PK-KO cultures with respect to WT (Fig. 2D).
Figure 2.

Glutathione homeostasis and detoxification enzyme activities in WT and PK-KO glial cultures. Glial cultures at 20–30 DIV were assayed for glutathione levels, γ-glutamylcysteine synthetase mRNA, and detoxification enzyme activities. A, Intracellular glutathione content, expressed as nanograms of GSH per microgram of protein. B, γ-GCS mRNA levels in WT and PK-KO glial cultures. C, Specific activities of GPx and catalase enzymes. D, GST activity in WT and PK-KO glial cultures. The activities of the detoxification enzymes were normalized to the total protein content. Values are the mean ± SEM of two or four independent cultures with six replicates each. Statistical analysis was performed by one-way ANOVA, followed by Newman–Keuls multiple comparison test. +p < 0.05; ++p < 0.01, PK-KO versus WT cultures.
Differential effects of oxidative stress in WT and PK-KO glial cultures
To determine whether the loss of parkin protein has an effect on the response of glial cultures to oxidative stress, we investigated the effects of serum deprivation and exposure to MPP+ in serum-free medium in WT and PK-KO cultures. As shown in Figure 3, the incubation of glial cultures with a chemically defined serum-free medium [EF12 (DM)] (Mena et al., 1993; Pardo et al., 1997) for different periods of time led to an elevation of intracellular GSH levels, greater in WT than in PK-KO cultures, 24 h after withdrawal of serum (Fig. 3A). In addition, there was a greater H2O2 production in PK-KO cultures (Fig. 3H). Furthermore, after 52 and 72 h of incubation in serum-free defined medium, the number of necrotic (propidium iodide+) (Fig. 3B) and apoptotic (TUNEL+) (Fig. 3C) cells and the levels of LDH released to the medium (Fig. 3D) were increased in both types of cultures, significantly higher in PK-KO than in WT (Fig. 3B–D). In addition, the incubation of glial cells in EF12 for 24 h increased the intensity and area of GFAP+ cells, more in PK-KO than WT glial cultures (Fig. 3E,F).
Figure 3.

Effects of oxidative stress inductors on WT and PK-KO glial cultures. WT and PK-KO cultures of 20–30 DIV growing in DMEM plus 15% FCS were used. A, Levels of GSH in WT and PK-KO glial cultures incubated in growth medium (DMEM–FCS) or 24 h incubation in a chemically defined serum free medium (EF12). Percentage of necrotic (propidium iodide+) cells (B), percentage of apoptotic (TUNEL+) cells (C), and LDH activity (D) in WT and PK-KO glial cultures incubated for 24, 52, and 72 h in EF12 medium. Photomicrographs (E) and optical intensity (F) showing the immunoreactivity of astroglial (GFAP+) cells in WT and PK-KO cultures incubated in growth medium or 24 h incubation in EF12 medium. Scale bar, 30 μm. G, LDH activity in WT and PK-KO glial cultures incubated with MPP+ (30 μm) for 24, 52, and 72 h in EF12 medium. H, Hydrogen peroxide released after 24 h incubation with EF12 or MPP+ (30 μm) in defined medium. Values are the mean ± SEM of two independent cultures with six replicates each. Statistical analysis was performed by two-way ANOVA (the interaction between genotype and change of medium or treatment was p < 0.01), followed by Bonferroni's post hoc test. +p < 0.05; ++p < 0.01; +++p < 0.001, PK-KO versus WT cultures. *p < 0.05; **p < 0.01; ***p < 0.001, treated cultures versus controls.
Treatment with MPP+ (30 μm), a compound that selectively inhibits complex I of the mitochondrial respiratory chain (Nicklas et al., 1985; Ramsay and Singer, 1986; Ramsay et al., 1986), for 24 h, in defined medium, led to a greater release of H2O2 to the medium in PK-KO than WT glial cultures (Fig. 3H) and to greater elevation of LDH in PK-KO than in WT cultures (Fig. 3G).
Parkin null glial cultures are more resistant to hydrogen peroxide-induced toxicity
We investigated whether WT and PK-KO glial cultures respond in a different manner to a direct mediator of oxidative stress as H2O2. To evaluate the concentration-dependent effect of H2O2 on cell viability, 20–30 DIV cells maintained in growth medium (DMEM–FCS) were reseeded in 24-well plates, and, after 6–7 DIV, the medium was replaced by EMEM plus d-glucose (6 mg/ml), the most appropriate medium for the H2O2 stability. The cultures were then treated with H2O2, from 50 to 200 μm, for 2–3 h. As shown in Figure 4, the exposure to H2O2 produced a dose-dependent reduction of cell viability in WT and PK-KO glial cultures. PK-KO glial cultures were more resistant than WT to the effects of 100 μm H2O2, but the differences in susceptibility disappeared at concentrations of 200 μm H2O2. Viability curves obtained by MTT assay are shown in Figure 4A and LDH levels in the medium in Figure 4B.
Figure 4.

Resistance to oxidative stress. WT and PK-KO cultures of 30 DIV growing in DEM plus 15% FCS were used; 6–7 d after reseeding WT and PK-KO glial cultures were treated with increasing doses (50–200 μm) of H2O2 for 3 h in EMEM plus d-glucose medium. Mitochondrial (A) and LDH activities (B) were measured. C, Glutathione levels measured after 10, 30, and 60 min of H2O2 (200 μm) treatment. D, Effect of inhibitors of hydrogen peroxide metabolization on the cell death induced by H2O2. The cultures were preexposed to the GSH synthesis inhibitor BSO (40 μm) for 24 h, the catalase activity inhibitor 3AT (10 mm) for 2 h, or a combination of both agents, then H2O2 was added for 3 h at 100 μm, and mitochondrial activity were measured by MTT assay. Values are the mean ± SEM of three independent cultures with six replicates each. Statistical analysis was performed by two-way ANOVA (the interaction between genotype and treatment was p < 0.05), followed by Bonferroni's post hoc test. +p < 0.05; ++p < 0.01, PK-KO versus WT cultures. *p < 0.05; **p < 0.01; ***p < 0.001, H2O2-treated cultures versus controls. ΔΔΔp < 0.001 versus the corresponding H2O2 treatment without inhibitors. δδδp < 0.001 BSO plus 3AT treatment versus BSO or 3AT treatment alone.
The intracellular levels of GSH after incubation with 200 μm H2O2 for 10, 30, and 60 min are shown in Figure 4C. The GSH content decreases with the length of exposure to H2O2 in WT and PK-KO glial cells; the GSH levels were always higher in PK-KO than in the WT cultures.
To elucidate the relative contribution of the GSH system and of the catalase to H2O2-induced cell death, we preincubated PK-KO and WT glial cultures, maintained in DMEM–FCS, with BSO at 40 μm, an inhibitor of the GSH synthesis, and with 3AT at 10 mm, a catalase inhibitor. BSO reduced the normally high content of GSH of both PK-KO and WT cultures (Casarejos et al., 2005; Solano et al., 2006). Treatment with 3AT for 2 h completely inhibited catalase activity (Dringen and Hamprecht, 1997). Preincubation of glial cultures for 24 h with BSO followed by 3 h of incubation with 100 μm H2O2 increased the cell death observed with H2O2 alone in PK-KO and WT (Fig. 4D). Similar findings were observed in the treatment with 3AT. The combination of treatments, BSO plus 3AT, produced similar but not additive effects. The inhibition of GSH synthesis by BSO or that of catalase by 3AT, or both, suppressed the differential susceptibility of PK-KO and WT glial cultures to H2O2 at 100 μm (Fig. 4D).
Signaling pathways involved in the H2O2-induced cell death in WT and PK-KO glial cultures
The role of ERK 1/2 and PKB in H2O2-induced cell death was investigated in WT and PK-KO glial cultures pretreated with the specific inhibitor of ERK upstream kinase MAP kinase kinase 1/2, PD98059 at 15 μm (Dudley et al., 1995; Favata et al., 1998; Canals et al., 2003a; de Bernardo et al., 2004) and with the PI-3K inhibitor LY-294002 at 25 μm (de Bernardo et al., 2004). Both inhibitors of the signaling pathways were given 30 min before the treatment with H2O2 at 200 μm. Both PD98059 and LY-294002 significantly reduced, but did not completely prevent, the cell death triggered by H2O2 (Fig. 5A). The protective effects of the kinase inhibitors were greater in WT than in PK-KO glial cultures.
Figure 5.

Signaling pathways involved in the H2O2-induced cell death in WT and PK-KO glial cultures. Glial cultures maintained during 20–30 DIV in DMEM plus 15% FCS were used for these experiments; 6–7 d after reseeding, the medium was changed to EMEM plus d-glucose. Then the cultures were treated with H2O2 for 3 h. A, Thirty minutes before H2O2 (200 μm) treatment, preestablished groups received the ERK 1/2 inhibitor PD 98059 (15 μm), the PI3K inhibitor LY-294002 (25 μm), or solvent, and cell viability was measured by MTT assay and presented as a percentage versus control. B, Western blot and densitometric analysis showing the time course activation of p-ERK 1/2 in WT and PK-KO glial cultures treated with H2O2 (200 μm) for the indicated times. C, Mitochondrial activity measured by MTT assay of WT and PK-KO glial cultures incubated with H2O2 (100 μm) for 3 h; at the time of the peroxide treatment, preestablished groups received FeSO4 (50 μm). D, Two hours before H2O2 (200 μm) treatment, preestablished groups received the iron-chelator DFO (2 and 4 mm). Values are the mean ± SEM of three independent cultures with six replicates each. Statistical analysis was performed by two-way ANOVA (the interaction between genotype and treatment was p < 0.01), followed by Bonferroni's post hoc test. +p < 0.05; ++p < 0.01, PK-KO versus WT cultures. *p < 0.05; ***p < 0.001, treated cultures versus controls. ΔΔp < 0.01; ΔΔΔp < 0.001 versus the corresponding H2O2 treatment without the inhibitors FeSO4 or DFO.
We also tested the specific p38 MAPK inhibitor SB203580 [4-(4-fluorophenyl)-2-(4-methylsulfinylphenyl)-5-(4-pyridyl)-1H-imidazole] at 20 μm and the broad-spectrum caspase inhibitor Boc-D-FMK at 30 μm, but the two inhibitors did not have a significant effect on the loss of cell viability induced by H2O2 at 200 μm in neither WT nor PK-KO glial cultures (data not shown).
We studied the temporal profile of activation of ERK 1/2 proteins at 5, 10, 20, 30, 60, and 90 min after stressing the glial cultures with 200 μm H2O2. Western blot analysis of p-ERK revealed that PK-KO glial cells had a higher increase of p-ERK after 10 min and more persistent activation than WT cultures (Fig. 5B).
Furthermore, we investigated the role of iron in H2O2 toxicity in WT and PK-KO glial cultures. For this purpose, we used two paradigms: the addition of FeSO4 at 50 μm to increase the intracellular iron stores and the membrane-permeable iron chelator DFO to reduce the iron that can be catalyst in the hydroxyl radical formation by the Fenton reaction. Cotreatment of WT and PK-KO glial cultures with FeSO4 potentiate H2O2 effect in both types of cultures, as shown by the MTT assay (Fig. 5C), but PK-KO glia was more resistant to this insult than WT cells. DFO, at 2 or 4 mm, 2 h before the treatment with H2O2 substantially reduced but did not completely prevent the toxic effects of H2O2 at 200 μm (Fig. 5D). The protection provided by DFO was slightly greater in WT than PK-KO glial cultures.
Cell types affected by H2O2-induced cell death in WT and PK-KO glial cultures
We investigated whether H2O2 at 100 μm modifies the number of cells and the cellular phenotype in PK-KO and WT glial cultures. H2O2 at 100 μm for 3 h induces cell death by necrosis (Fig. 6A,E,F) and apoptosis (Fig. 6B–D). PK-KO glial cells are more resistant than WT to both mechanisms of cell death. Our study shows that the total number of cells (Fig. 7A,B) was reduced in WT. However, the astroglial immunoreactivity (Fig. 7C,D), expressed as integrated optical intensity of GFAP+ cells, and the percentage of microglial cells (Fig. 7E,F) was significantly increased in H2O2-treated WT cultures. These changes did not take place in PK-KO glial cultures treated with H2O2 at 100 μm.
Figure 6.
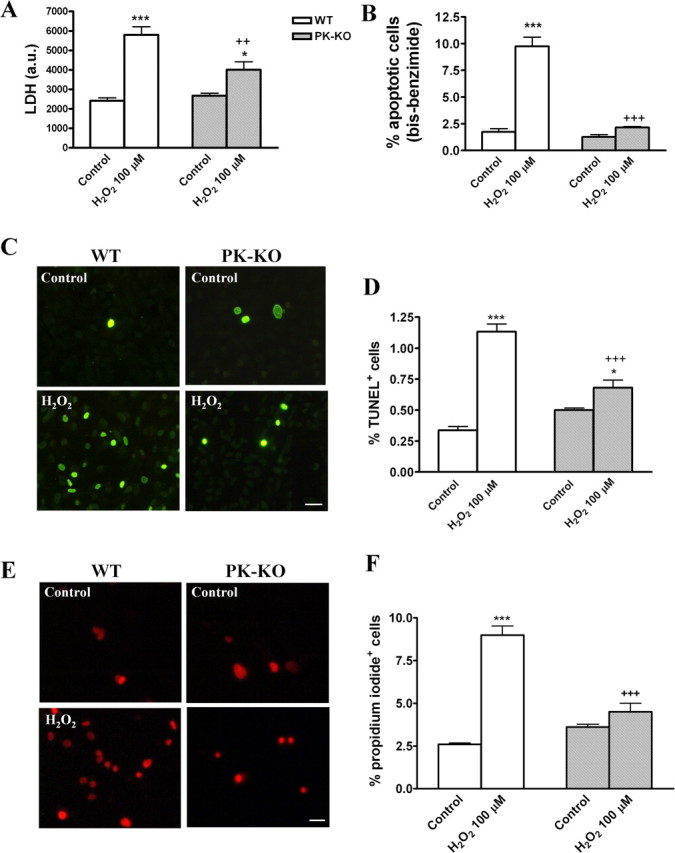
Effects of hydrogen peroxide on glial cell viability in WT and PK-KO cultures. At 6–7 d after reseeding, the cells were treated with 100 μm H2O2 for 3 h in EMEM plus d-glucose. A, LDH activity. B, Percentage of cells with the chromatin condensed or fragmented. C, Photomicrographs of TUNEL+ cells in WT and PK-KO from control and H2O2 (100 μm) treated cells. Scale bar, 30 μm. D, Percentage of TUNEL+ cells. Photomicrographs (E) and percentage of PI+ cells (F). Scale bar, 30 μm. The values express the mean ± SEM of six replicates each. Statistical analysis was performed by two-way ANOVA (the interaction between genotype and treatment was p < 0.05), followed by Bonferroni's post hoc test. ++p < 0.01; +++p < 0.001, PK-KO versus WT cultures. *p < 0.05; ***p < 0.001, H2O2 treated cultures versus controls.
Figure 7.
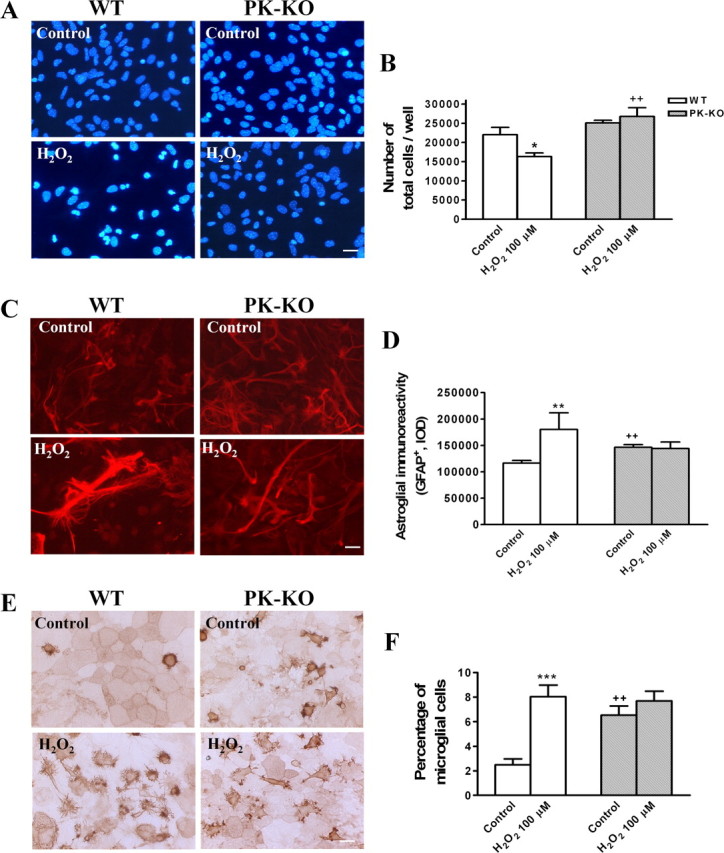
Effects of hydrogen peroxide on glial cell phenotypes in WT and PK-KO cultures. At 6–7 d after reseeding, the cells were treated with 100 μm H2O2 for 3 h in EMEM plus d-glucose. A, Photomicrographs of total nuclei stained with bis-benzimide in WT and PK-KO from control and H2O2 (100 μm) treated cells. Scale bar, 30 μm. B, Number of total cells present in the cultures. C, Photomicrographs showing type 2 astrocytes (GFAP+) in WT and PK-KO from control and H2O2 (100 μm) treated cells. Scale bar, 30 μm. D, Astroglial immunoreactivity (GFAP+) in the cultures. Photomicrographs (E) and percentage of microglial cells (F) (isolectin B4+ cells) in WT and PK-KO from cultures treated with H2O2 (100 μm) or solvent. Scale bar, 30 μm. Values are the mean ± SEM of six replicates each. Statistical analysis was performed by two-way ANOVA (the interaction between genotype and treatment was p < 0.05), followed by Bonferroni's post hoc test. ++p < 0.01, PK-KO versus WT cultures. *p < 0.05; **p < 0.01; ***p < 0.001, H2O2-treated cultures versus controls.
Effects of aging in WT and PK-KO glial cultures
Midbrain glial cultures of WT and PK-KO mice were maintained in growth medium (DMEM–FCS) for different periods of time, from 15 d to 9 months, in culture. The effects of aging in these cultures was analyzed according to the index of proliferation, expression of proteins, GSH levels, and resistance to oxidative stress assays, performed in young cultures (1–3 months in vitro) and in aged WT and PK-KO cultures (6–9 months in vitro).
GFAP protein levels were higher in WT than in PK-KO and in young than in old cultures (Fig. 8A). With respect to microglia, we found the opposite: the number of microglial cells was increased with aging and it was greater in PK-KO than in WT cultures (Fig. 8B). BrdU incorporation was greater in young than in old cultures. In young cultures, it was higher in WT, whereas in the old ones, it was greater in PK-KO cultures (Fig. 8C).
Figure 8.

Effects of aging on WT and PK-KO glial cultures. Glial cultures of WT and PK-KO mice were maintained in DMEM plus 15% FCS for different periods of time. A, Immunodetection and densitometric analysis of astroglial (GFAP) protein by Western blot of young (1–3 months) and aged (6–9 months) WT and PK-KO glial cultures. Percentage of microglial cells (B) (Cd11b+) and proliferating (BrdU+) (C) cells present at 1–3 and 6–9 months of culture. D, GSH levels in young and aged WT and PK-KO glial cultures. Protein expression (E) and densitometric analysis (F) of HSP-70 protein in young and aged WT and PK-KO glial cultures. Percentage of microglial cells and GSH levels are expressed as the mean ± SEM from six replicates of four and two independent cultures, respectively. Values for Western blotting experiment are the mean ± SEM from four replicates of four independent cultures. Statistical analysis was performed by two-way ANOVA (the interaction between genotype and treatment and genotype and aging were p < 0.05), followed by Bonferroni's post hoc test. +p < 0.05; ++p < 0.01; +++p < 0.001, PK-KO versus WT cultures. ***p < 0.001 old versus young cultures.
Intracellular GSH was stable during aging in WT cultures. Young PK-KO cultures had a greater level of GSH than WT cultures of the same age, but this difference was inverted in old cultures (Fig. 8D).
We have shown recently that the expression of the heat shock protein HSP-70 changes in the striatum and midbrain of aged parkin knock-out mice (Rodriguez-Navarro et al., 2007). Here we show that the expression of HSP-70 increases in aged cultures from both WT and PK-KO mice but much more in the first than in the second (Fig. 8E,F).
We also studied how age affects the vulnerability of WT and PK-KO glial cultures to the H2O2 treatment. As shown in Figure 9, A and B, old PK-KO glial cells were more sensitive than WT of a similar age to H2O2-induced loss of viability at a dose that the young PK-KO glial culture did not show any vulnerability (H2O2, 50 μm). Aged PK-KO glial cultures had a greater reduction of GSH content in response to a small dose of H2O2 at 50 μm (Fig. 9C) than did younger PK-KO cultures to 200 μm H2O2.
Figure 9.
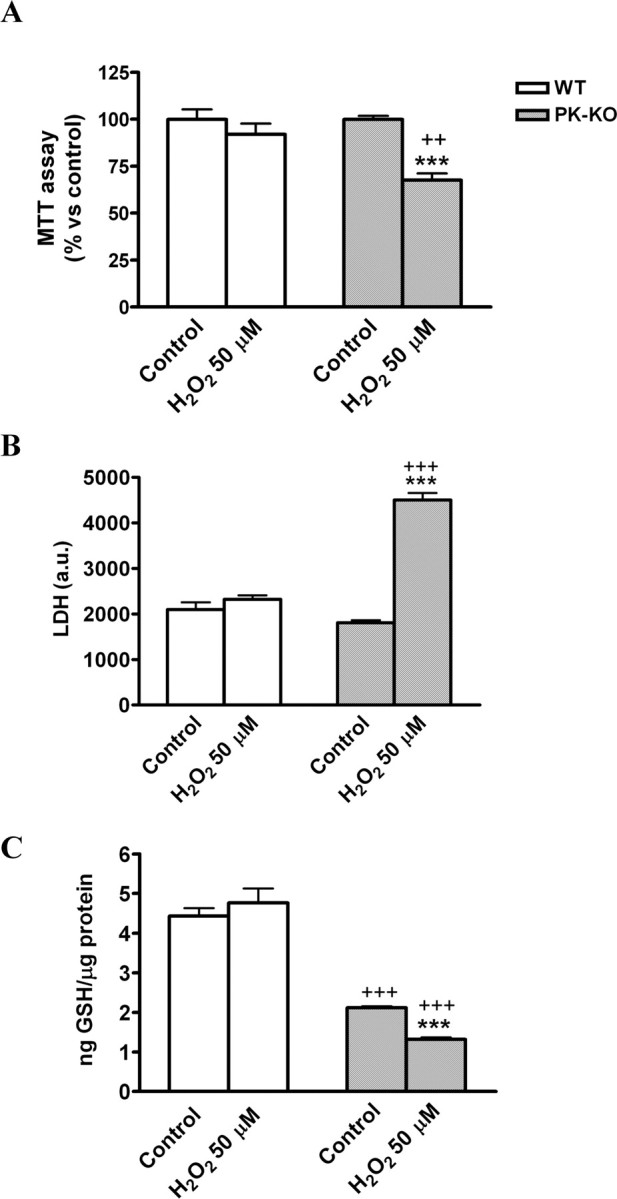
Aged PK-KO midbrain glia is more sensitive to hydrogen peroxide treatment. Glia cultures maintained for 6 months in DMEM plus 15% FCS were used for these experiments. Before H2O2 treatment, the medium of the cultures (6 d after seeding) was changed to EMEM plus glucose. Mitochondrial activity (A), LDH activity (B), and GSH levels (C) in 6-month-old WT and PK-KO cultures after treatment with H2O2 at 50 μm for 3 h. Values are the mean ± SEM of six replicates each of two independent cultures. Statistical analysis was performed by two-way ANOVA (the interaction between genotype and treatment and genotype and aging were p < 0.05), followed by Bonferroni's post hoc test. ++p < 0.01; +++p < 0.001, PK-KO versus WT cultures. ***p < 0.001, H2O2-treated cultures versus controls.
Effects of WT and PK-KO glia-conditioned medium on fetal midbrain neuronal-enriched cultures
We have shown previously that GCM from mesencephalic rat astrocytes is neuroprotective for neuronal-enriched mesencephalic cultures (Mena et al., 1997a, 1998b, 1999, 2002; Canals et al., 2001a; Rodriguez-Martin et al., 2001). In this study, we investigated the differential effects of PK-KO- and WT-GCM on WT midbrain neuronal cultures. The treatment of these cultures with GCM from WT or PK-KO for 24 h greatly increased the number of TH+ cells (Fig. 10A,B) and [3H]DA uptake (Fig. 10C), but it did not change the total number of nuclei (data not shown). The neurotrophic effect observed with GCM from WT astrocytes was significantly greater than that of PK-KO. Similarly, WT-GCM was more effective than PK-KO-GCM in the rescue from the neuronal apoptosis induced by the incubation of the neuronal cultures with the EF12 serum-free defined medium (Fig. 10D,E). The percentage of microglial cells present in the WT neuronal-enriched midbrain culture was greatly diminished by the incubation in the GCM, but again, the WT GCM was more effective than the PK-KO one (Fig. 10F). We know that PK-KO glia cultured in stressful conditions, such as EF12, has lower intracellular GSH levels than WT cultures (Fig. 3A) and that the neurotrophic and neuroprotective effects of GCM on DA neurons are dose dependent of the GSH levels (Mena et al., 1997a). However, GSH is not the only neuroprotective GCM compound (Mena et al., 2002). We also tested the neuroprotective effects of WT- and PK-KO-GCM obtained in a second conditioning of the glial cultures, but in this case neither WT- nor PK-KO-GCM had any neuroprotective effect on the WT midbrain neuronal cultures.
Figure 10.

Effects of WT and PK-KO GCM on neuronal-enriched mesencephalic cultures from WT mice. WT neuronal-enriched midbrain cultures were treated after 6 DIV with GCM (from WT or PK-KO), defined medium (EF12), or maintained in B27/Neurobasal TM medium (control) for 24 h. A, Photomicrographs showing DA cells (TH+) in control, EF12, WT-GCM, and PK-KO-GCM treated cultures. Scale bar, 30 μm. B, Number of DA neurons expressed as TH+ cells per well. C, High-affinity [3H]DA uptake. D, Photomicrographs of total nuclei stained with bis-benzimide in control, EF12, WT-GCM, and PK-KO-GCM treated cultures. Scale bar, 30 μm. E, Chromatin condensed and fragmented nuclei were counted and expressed as a percentage of apoptotic cells with respect to the total cell number. F, Percentage of microglial cells present in the culture. Values are the mean ± SEM of three independent cultures with six replicates each. Statistical analysis was performed by one-way ANOVA, followed by Newman–Keuls multiple comparison test. +p < 0.05; ++p < 0.01; +++p < 0.001, PK-KO-GCM versus WT glia-conditioned medium. *p < 0.05; **p < 0.01; ***p < 0.001, GCM or EF12 versus controls cultures.
GCM from PK-KO has lower concentration of GSH than WT-GCM (Fig. 11A). For that reason, we studied the dose-dependent GSH effects on midbrain neuronal cultures (Fig. 11B) and the effect of GSH supplementation to the PK-KO GCM on WT neuronal midbrain cultures (Fig. 11C). The treatment with GSH has a dose-dependent effect on the [3H]DA uptake levels, and the addition of GSH to GCM from PK-KO abolished the differences between WT and PK-KO glia conditioned mediums on [3H]DA uptake (Fig. 11B,C).
Figure 11.

Characterization of WT and PK-KO glia-conditioned mediums. A, GSH concentration in GCM from WT or PK-KO. B, Dose-dependent GSH effects on WT midbrain neuronal cultures. C, [3H]DA uptake in WT midbrain neurons treated with PK-KO-GCM and GSH. Values are the mean ± SEM of two independent cultures with six replicates each. Statistical analysis was performed by one-way ANOVA, followed by Newman–Keuls multiple comparison test. +p < 0.05; ++p < 0.01; +++p < 0.001, PK-KO-GCM versus WT glia-conditioned medium. *p < 0.05; **p < 0.01; ***p < 0.001, GCM versus EF12 incubated cultures. Δp < 0.05 PK-KO-GCM plus GSH versus PK-KO-GCM.
We investigated changes in high-affinity DA uptake between WT and PK-KO astrocytes, because some studies suggest that astrocytic uptake is also important in regulating extracellular dopamine levels (Karakaya et al., 2007). Both WT and PK-KO midbrain astrocytes had, however, very low levels of high-affinity [3H]DA uptake, similar to blanks with the DA transporter inhibitor. WT and PK-KO mice midbrain astrocytes lack high-affinity [3H]DA uptake (at 19 and 38 nm DA concentration, 37°C incubation for 20 min, and for blank blocked by DA transporter inhibitor at nanomolar concentration, even at 10 and 15 μm). In rat cortical astroglia, DA transport is mediated by norepinephrine transport (Inazu et al., 1999; Takeda et al., 2002). However, astrocytes play a role in the clearance of DA from the extracellular space, when DA is at micromolar concentration (Karakaya et al., 2007), and, of course, astrocytes play a very important role in the DA metabolism by monoamine oxidase B (MAO-B). It is important to notice that PK-KO mice have higher MAO-B activity that their corresponding WT (Itier et al., 2003; Casarejos et al., 2005).
Discussion
Parkin suppression produces AR-PD in humans and abnormalities of dopamine function in mice (Itier et al., 2003). Previous studies (Ledesma et al., 2002) suggested that glial abnormalities could mediate AR-PD, and, in this study, we found that parkin suppression increases the levels of GSH, diminishes the proliferation of astroglia, increases that of microglia, and increases the expression of proapoptotic proteins.
GSH, which is synthesized mostly in glia, is critical for scavenging free radicals related to the metabolism of dopamine. GSH regulates the neurotoxic or neurotrophic effects of catecholamines on dopamine neurons (Mena et al., 1997a,b, 1998b; Canals et al., 2001a, 2003a,b; Rodriguez-Martin et al., 2001). GSH is neuroprotective for dopamine neurons (Mena et al., 1998a; Canals et al., 2001b). PK-KO mice have reduced dopamine release and, therefore, increased intracellular, MAO-related metabolism of dopamine (Itier et al., 2003), with a subsequently increased production of H2O2 that is compensated by high levels of GSH.
PK-KO glia had greater levels of GSH than WT, but the opposite happened in PK-KO glia cultured in DM or for long periods of time in DMEM–FCS. PK-KO glia was more susceptible than WT to stress, such as transference to DM, blockade of GSH synthesis or catalase activity, blockade of the ERK 1/2 and PI3K, and aging of the culture or to neurotoxins such as MPP+. PK-KO glia was, however, less susceptible to the neurotoxicity of Fe2+ plus H2O2 than WT glia and also less responsive to neuroprotection against H2O2 by deferoxamine. In addition, PK-KO glia failed to increase the expression of HSP-70, in aged cultures, as happen in WT glia. GCM from PK-KO was less protective for dopamine neurons than GCM obtained from WT glia. PK-KO GCM restored the loss of TH+ neurons and [3H]DA high-affinity uptake sites less efficiently in midbrain neuronal cultures. PK-KO-GCM suppressed apoptosis and microglial proliferation less efficiently in these cultures. These findings were previously unknown.
GSH is critical for dopamine survival in PK-KO mice. Midbrain neuronal cultures from PK-KO mice are resistant to l-3,4-dihydroxyphenylalanine and NO-induced toxicity, but this resistance disappears when GSH synthesis is inhibited by BSO (Casarejos et al., 2005; Solano et al., 2006), which switches the effects of catecholamines from neuroprotective to neurotoxic. GPx and GSH protect mouse astrocytes from iron-mediated H2O2 toxicity (Liddell et al., 2006). GSH levels decrease with aging in vivo (Rodriguez-Navarro et al., 2007). Young PK-KO mice had high levels of GSH in striatum (Itier et al., 2003; Serrano et al., 2005), but they decreased with age. Reduced GSH, as happens in striatum or in aged glial cultures, may become lethal for nigrostriatal neurons because these cells have a high dopamine-related production of free radicals, and they are protected by a smaller proportion of astrocytes than neurons in other brain areas (Damier et al., 1993).
GSH depletion inhibits mitochondrial complex I, mediated via nitric oxide (Hsu et al., 2005). N-acetyl-cysteine, a GSH precursor, increases complex I activity in mitochondria from aged mice (Martinez Banaclocha, 2000). Increased glutathione S-transferase rescues dopamine neurons in Drosophila (Whitworth et al., 2005). The redox status modulates protein ubiquitinylation via reversible S-thiolation, presumably by GSH, of E1 and E2 enzymes (Jahngen-Hodge et al., 1997). GPx has a protective role against neuronal death in PD (Damier et al., 1993), whereas depletion of GSH decreases glutathione reductase activity (Barker et al., 1996). GSH depletion, in addition, might also accelerate the buildup of defective proteins, leading to cell death of dopamine neurons by impairing the ubiquitin-proteasome processing (Bharath et al., 2002; Jha et al., 2002). PK-KO mice have mitochondrial deficits (Palacino et al., 2004) and are more sensitive than WT to the complex I inhibitor rotenone (Casarejos et al., 2006).
The role of GSH in PK-KO glia is further supported by our experiments with iron and H2O2 in the presence or absence of deferoxamine. Iron accumulation in patients with PD might also contribute to oxidative stress (Bharath et al., 2002). Iron staining is more intense in AR-PD than in controls and sporadic PD (Takanashi et al., 2001). We found that PK-KO glial cultures are more resistant to H2O2 and Fe2+ plus H2O2 than wild type and that this resistance is independent of deferoxamine. This suggests that young PK-KO glia has more potent antioxidants, such as GSH. We also found that the p-ERK response to H2O2 was more pronounced and more persistent in PK-KO than in WT glia. This is an unexpected but consistent finding because other studies in whole mouse PK-KO brain have shown that EGF signaling via the PI3K–Akt pathway is reduced (Fallon et al., 2006). Another animal model of PD, such as suppression of DJ-1 in Drosophila, leads to impairment of PI3K–Akt (Yang et al., 2005).
Structural deterioration of microglia might contribute to age-related neurodegeneration (Streit, 2006). We found that microglia enhances the dopamine cell death in PK-KO mice (Casarejos et al., 2006).We here demonstrate that, in aged PK-KO glial cultures, there is increased proliferation and a greater number of microglial cells than in WT, which enhances the release of proinflammatory cytokines (Teismann and Schulz, 2004; Casarejos et al., 2006). Microglia-mediated inflammation increases the toxicity of complex I inhibitors (Hirsch and Hunot, 2000; Beal, 2003; Zoccarato et al., 2005) and the abnormality of mitochondrial function that takes place in deprivation of GSH, closing the vicious circle, which leads to cell death.
Glia is more sensitive to cell death when the levels of parkin are reduced (MacCormac et al., 2004). We found a shift of antiapoptotic/proapoptotic proteins toward apoptosis and a reduced expression of HSP-70. The expression of HSPs in rat brain increases during aging (Calabrese et al., 2004). The pattern of HSP-70 changes in dopamine neurons in parkinsonian midbrains (Andringa et al., 2006), suggesting a role for this chaperone in this disease (Xu and Giffard, 1997). Parkin interacts with HSP-70 and channel-interacting protein, two proteins that play a role in neurodegeneration (Zhang et al., 2000; Imai et al., 2002; Kalia et al., 2004; Petrucelli et al., 2004; Menendez et al., 2006).
The key role of GSH in PK-KO glia was underlined after incubation of glia in DM for 24 h. That increased the levels of intracellular GSH, more in WT than in PK-KO glia, despite the fact that the levels of GSH in glia cultured in growth medium were greater in PK-KO cells, suggesting that PK-KO glia is unable to respond to stressful conditions. In addition, switching to DM increases H2O2 levels and cell death more in PK-KO than in WT glia.
WT-GCM has more potent neurotrophic effects than PK-KO-GCM on neuronal-enriched WT mesencephalic cultures. Astrocytes secrete neurotrophic factors (Muller et al., 1995; Engele et al., 1996; Kinor et al., 2001). We described previously that GCM from rat mesencephalic astrocytes greatly increases the number of TH+ cells, TH mRNA, TH protein expression, TH neurite arborization, [3H]DA uptake, as well as intracellular DA levels. GCM protects DA neurons from apoptosis, MPP+-induced cell death (Mena et al., 1999), and nitric oxide (Canals et al., 2001b). In addition, GCM greatly increases astrocytic GFAP+ processes. GCM is rich in antioxidants, such as GSH and ascorbic acid, and neurotrophic factors, such as glial-derived neurotrophic factor, brain-derived neurotrophic factor, nerve growth factor, and basic fibroblast growth factor, as well as novel neurotrophic proteins (Mena et al., 1998b, 2002). Ventral mesencephalic type 1 astrocytes secrete a soluble factor required for the induction of TH+ neurons from Nurr1 neural stem cells (Wagner et al., 1999; Arenas, 2002). Astroglia induces neurogenesis from adult neuronal stem cells (Song et al., 2002) and guides the dopaminergic neuritic growth in vitro (Johansson and Stromberg, 2002) and in vivo (Moon et al., 2002). We have shown that GCM induces de novo synthesis of TH and increases DA cell survival (Mena et al., 2002; de Bernardo et al., 2003, 2004). Astrocytes are a key part of PD and other neurodegenerative disorders (Di Giorgio et al., 2007; Nagai et al., 2007).
In conclusion, the combined effect of the parkin suppression and aging of glial cells may determine the death of the dopamine neurons. Intermediate mechanisms of this process include a reduction of astrocytes, proliferation of microglia, decompensation of free radical scavenging, a shift of the expression of proteins of survival and death, changes in neuroprotective chaperones, and loss of neurotrophic properties of glia from PK-KO mice. We hope that our findings help to create new tools for neuroprotective drugs for patients with PD.
Footnotes
This work was supported in part by grants from the Spanish Ministry of Health and by Fondo de Investigación Sanitaria (FIS) Grants CP04/00180, 2004/PI040360, and 2007/PI07037, Comunidad Autonoma de Madrid Grant 0202/2006, and Centro de Investigación Biomédica en Red Grant 2006/05/0059. J.M.-C. and J.A.R.-N. have FIS predoctoral fellowships. We thank M. Serrano, Ana Gomez, and I. Rodal for excellent technical assistance, Claire Marsden for editorial help, and Dr. I. Ampuero for his help with the qPCR.
References
- Abbas N, Lucking CB, Ricard S, Durr A, Bonifati V, De Michele G, Bouley S, Vaughan JR, Gasser T, Marconi R, Broussolle E, Brefel-Courbon C, Harhangi BS, Oostra BA, Fabrizio E, Bohme GA, Pradier L, Wood NW, Filla A, Meco G, Denefle P, Agid Y, Brice A. A wide variety of mutations in the parkin gene are responsible for autosomal recessive parkinsonism in Europe. French Parkinson's Disease Genetics Study Group and the European Consortium on Genetic Susceptibility in Parkinson's Disease. Hum Mol Genet. 1999;8:567–574. doi: 10.1093/hmg/8.4.567. [DOI] [PubMed] [Google Scholar]
- Andringa G, Bol JG, Wang X, Boekel A, Bennett MC, Chase TN, Drukarch B. Changed distribution pattern of the constitutive rather than the inducible HSP70 chaperone in neuromelanin-containing neurones of the Parkinsonian midbrain. Neuropathol Appl Neurobiol. 2006;32:157–169. doi: 10.1111/j.1365-2990.2006.00714.x. [DOI] [PubMed] [Google Scholar]
- Arenas E. Stem cells in the treatment of Parkinson's disease. Brain Res Bull. 2002;57:795–808. doi: 10.1016/s0361-9230(01)00772-9. [DOI] [PubMed] [Google Scholar]
- Ashwell K. The distribution of microglia and cell death in the fetal rat forebrain. Brain Res Dev Brain Res. 1991;58:1–12. doi: 10.1016/0165-3806(91)90231-7. [DOI] [PubMed] [Google Scholar]
- Barker JE, Heales SJ, Cassidy A, Bolanos JP, Land JM, Clark JB. Depletion of brain glutathione results in a decrease of glutathione reductase activity; an enzyme susceptible to oxidative damage. Brain Res. 1996;716:118–122. doi: 10.1016/0006-8993(96)00003-0. [DOI] [PubMed] [Google Scholar]
- Beal MF. Mitochondria, oxidative damage, and inflammation in Parkinson′s disease. Ann NY Acad Sci. 2003;991:120–131. doi: 10.1111/j.1749-6632.2003.tb07470.x. [DOI] [PubMed] [Google Scholar]
- Bharath S, Hsu M, Kaur D, Rajagopalan S, Andersen JK. Glutathione, iron and Parkinson's disease. Biochem Pharmacol. 2002;64:1037–1048. doi: 10.1016/s0006-2952(02)01174-7. [DOI] [PubMed] [Google Scholar]
- Calabrese V, Scapagnini G, Ravagna A, Colombrita C, Spadaro F, Butterfield DA, Giuffrida Stella AM. Increased expression of heat shock proteins in rat brain during aging: relationship with mitochondrial function and glutathione redox state. Mech Ageing Dev. 2004;125:325–335. doi: 10.1016/j.mad.2004.01.003. [DOI] [PubMed] [Google Scholar]
- Canals S, Casarejos MJ, Rodriguez-Martin E, de Bernardo S, Mena MA. Neurotrophic and neurotoxic effects of nitric oxide on fetal midbrain cultures. J Neurochem. 2001a;76:56–68. doi: 10.1046/j.1471-4159.2001.00010.x. [DOI] [PubMed] [Google Scholar]
- Canals S, Casarejos MJ, de Bernardo S, Rodriguez-Martin E, Mena MA. Glutathione depletion switches nitric oxide neurotrophic effects to cell death in midbrain cultures: implications for Parkinson's disease. J Neurochem. 2001b;79:1183–1195. doi: 10.1046/j.1471-4159.2001.00635.x. [DOI] [PubMed] [Google Scholar]
- Canals S, Casarejos MJ, de Bernardo S, Solano RM, Mena MA. Selective and persistent activation of extracellular signal-regulated protein kinase by nitric oxide in glial cells induces neuronal degeneration in glutathione-depleted midbrain cultures. Mol Cell Neurosci. 2003a;24:1012–1026. doi: 10.1016/j.mcn.2003.08.004. [DOI] [PubMed] [Google Scholar]
- Canals S, Casarejos MJ, de Bernardo S, Rodriguez-Martin E, Mena MA. Nitric oxide triggers the toxicity due to glutathione depletion in midbrain cultures through 12-lipoxygenase. J Biol Chem. 2003b;278:21542–21549. doi: 10.1074/jbc.M213174200. [DOI] [PubMed] [Google Scholar]
- Casarejos MJ, Solano RM, Menendez J, Rodriguez-Navarro JA, Correa C, Garcia de Yebenes J, Mena MA. Differential effects of L-DOPA on monoamine metabolism, cell survival and glutathione production in midbrain neuronal-enriched cultures from parkin knock-out and wild-type mice. J Neurochem. 2005;94:1005–1014. doi: 10.1111/j.1471-4159.2005.03249.x. [DOI] [PubMed] [Google Scholar]
- Casarejos MJ, Menendez J, Solano RM, Rodriguez-Navarro JA, Garcia de Yebenes J, Mena MA. Susceptibility to rotenone is increased in neurons from parkin null mice and is reduced by minocycline. J Neurochem. 2006;97:934–946. doi: 10.1111/j.1471-4159.2006.03777.x. [DOI] [PubMed] [Google Scholar]
- Damier P, Hirsch EC, Zhang P, Agid Y, Javoy-Agid F. Glutathione peroxidase, glial cells and Parkinson's disease. Neuroscience. 1993;52:1–6. doi: 10.1016/0306-4522(93)90175-f. [DOI] [PubMed] [Google Scholar]
- de Bernardo S, Canals S, Casarejos MJ, Rodriguez-Martin E, Mena MA. Glia-conditioned medium induces de novo synthesis of tyrosine hydroxylase and increases dopamine cell survival by differential signaling pathways. J Neurosci Res. 2003;73:818–830. doi: 10.1002/jnr.10704. [DOI] [PubMed] [Google Scholar]
- de Bernardo S, Canals S, Casarejos MJ, Solano RM, Menendez J, Mena MA. Role of extracellular signal-regulated protein kinase in neuronal cell death induced by glutathione depletion in neuron/glia mesencephalic cultures. J Neurochem. 2004;91:667–682. doi: 10.1111/j.1471-4159.2004.02744.x. [DOI] [PubMed] [Google Scholar]
- Di Giorgio FP, Carrasco MA, Siao MC, Maniatis T, Eggan K. Non-cell autonomous effect of glia on motor neurons in an embryonic stem cell-based ALS model. Nat Neurosci. 2007;10:608–614. doi: 10.1038/nn1885. [DOI] [PMC free article] [PubMed] [Google Scholar]
- Dringen R, Hamprecht B. Involvement of glutathione peroxidase and catalase in the disposal of exogenous hydrogen peroxide by cultured astroglial cells. Brain Res. 1997;759:67–75. doi: 10.1016/s0006-8993(97)00233-3. [DOI] [PubMed] [Google Scholar]
- Dudley DT, Pang L, Decker SJ, Bridges AJ, Saltiel AR. A synthetic inhibitor of the mitogen-activated protein kinase cascade. Proc Natl Acad Sci USA. 1995;92:7686–7689. doi: 10.1073/pnas.92.17.7686. [DOI] [PMC free article] [PubMed] [Google Scholar]
- Engele J, Schubert D, Bohn MC. Conditioned media derived from glial cell lines promote survival and differentiation of dopaminergic neurons in vitro: role of mesencephalic glia. J Neurosci Res. 1991;30:359–371. doi: 10.1002/jnr.490300212. [DOI] [PubMed] [Google Scholar]
- Engele J, Rieck H, Choi-Lundberg D, Bohn MC. Evidence for a novel neurotrophic factor for dopaminergic neurons secreted from mesencephalic glial cell lines. J Neurosci Res. 1996;43:576–586. doi: 10.1002/(SICI)1097-4547(19960301)43:5<576::AID-JNR7>3.0.CO;2-F. [DOI] [PubMed] [Google Scholar]
- Fallon L, Belanger CM, Corera AT, Kontogiannea M, Regan-Klapisz E, Moreau F, Voortman J, Haber M, Rouleau G, Thorarinsdottir T, Brice A, van Bergen En Henegouwen PM, Fon EA. A regulated interaction with the UIM protein Eps15 implicates parkin in EGF receptor trafficking and PI (3) K-Akt signalling. Nat Cell Biol. 2006;8:834–842. doi: 10.1038/ncb1441. [DOI] [PubMed] [Google Scholar]
- Favata MF, Horiuchi KY, Manos EJ, Daulerio AJ, Stradley DA, Feeser WS, Van Dyk DE, Pitts WJ, Earl RA, Hobbs F, Copeland RA, Magolda RL, Scherle PA, Trzaskos JM. Identification of a novel inhibitor of mitogen-activated protein kinase kinase. J Biol Chem. 1998;273:18623–18632. doi: 10.1074/jbc.273.29.18623. [DOI] [PubMed] [Google Scholar]
- Flohe L, Gunzler WA. Assays of glutathione peroxidase. Methods Enzymol. 1984;105:114–121. doi: 10.1016/s0076-6879(84)05015-1. [DOI] [PubMed] [Google Scholar]
- Gavrieli Y, Sherman Y, Ben-Sasson SA. Identification of programmed cell death in situ via specific labeling of nuclear DNA fragmentation. J Cell Biol. 1992;119:493–501. doi: 10.1083/jcb.119.3.493. [DOI] [PMC free article] [PubMed] [Google Scholar]
- Goldberg MS, Fleming SM, Palacino JJ, Cepeda C, Lam HA, Bhatnagar A, Meloni EG, Wu N, Ackerson LC, Klapstein GJ, Gajendiran M, Roth BL, Chesselet MF, Maidment NT, Levine MS, Shen J. Parkin-deficient mice exhibit nigrostriatal deficits but not loss of dopaminergic neurons. J Biol Chem. 2003;278:43628–43635. doi: 10.1074/jbc.M308947200. [DOI] [PubMed] [Google Scholar]
- Griffith OW. Determination of glutathione and glutathione disulfide using glutathione reductase and 2-vinylpyridine. Anal Biochem. 1980;106:207–212. doi: 10.1016/0003-2697(80)90139-6. [DOI] [PubMed] [Google Scholar]
- Habig WH, Pabst MJ, Jakoby WB. Glutathione S-transferases. The first enzymatic step in mercapturic acid formation. J Biol Chem. 1974;249:7130–7139. [PubMed] [Google Scholar]
- Hirsch EC, Hunot S. Nitric oxide, glial cells and neuronal degeneration in parkinsonism. Trends Pharmacol Sci. 2000;21:163–165. doi: 10.1016/s0165-6147(00)01471-1. [DOI] [PubMed] [Google Scholar]
- Hirsch EC, Hunot S, Damier P, Brugg B, Faucheux BA, Michel PP, Ruberg M, Muriel MP, Mouatt-Prigent A, Agid Y. Glial cell participation in the degeneration of dopaminergic neurons in Parkinson's disease. Adv Neurol. 1999;80:9–18. [PubMed] [Google Scholar]
- Hsu M, Srinivas B, Kumar J, Subramanian R, Andersen J. Glutathione depletion resulting in selective mitochondrial complex I inhibition in dopaminergic cells is via an NO-mediated pathway not involving peroxynitrite: implications for Parkinson's disease. J Neurochem. 2005;92:1091–1103. doi: 10.1111/j.1471-4159.2004.02929.x. [DOI] [PubMed] [Google Scholar]
- Imai Y, Soda M, Hatakeyama S, Akagi T, Hashikawa T, Nakayama KI, Takahashi R. CHIP is associated with Parkin, a gene responsible for familial Parkinson's disease, and enhances its ubiquitin ligase activity. Mol Cell. 2002;10:55–67. doi: 10.1016/s1097-2765(02)00583-x. [DOI] [PubMed] [Google Scholar]
- Inazu M, Kubota N, Takeda H, Zhang J, Kiuchi Y, Oguchi K, Matsumiya T. Pharmacological characterization of dopamine transport in cultured rat astrocytes. Life Sci. 1999;64:2239–2245. doi: 10.1016/s0024-3205(99)00175-7. [DOI] [PubMed] [Google Scholar]
- Itier JM, Ibanez P, Mena MA, Abbas N, Cohen-Salmon C, Bohme GA, Laville M, Pratt J, Corti O, Pradier L, Ret G, Joubert C, Periquet M, Araujo F, Negroni J, Casarejos MJ, Canals S, Solano R, Serrano A, Gallego E, et al. Parkin gene inactivation alters behaviour and dopamine neurotransmission in the mouse. Hum Mol Genet. 2003;12:2277–2291. doi: 10.1093/hmg/ddg239. [DOI] [PubMed] [Google Scholar]
- Jahngen-Hodge J, Obin MS, Gong X, Shang F, Nowell TR, Jr, Gong J, Abasi H, Blumberg J, Taylor A. Regulation of ubiquitin-conjugating enzymes by glutathione following oxidative stress. J Biol Chem. 1997;272:28218–28226. doi: 10.1074/jbc.272.45.28218. [DOI] [PubMed] [Google Scholar]
- Jha N, Kumar MJ, Boonplueang R, Andersen JK. Glutathione decreases in dopaminergic PC12 cells interfere with the ubiquitin protein degradation pathway: relevance for Parkinson's disease? J Neurochem. 2002;80:555–561. doi: 10.1046/j.0022-3042.2001.00009.x. [DOI] [PubMed] [Google Scholar]
- Johansson LH, Borg LA. A spectrophotometric method for determination of catalase activity in small tissue samples. Anal Biochem. 1988;174:331–336. doi: 10.1016/0003-2697(88)90554-4. [DOI] [PubMed] [Google Scholar]
- Johansson S, Stromberg I. Guidance of dopaminergic neuritic growth by immature astrocytes in organotypic cultures of rat fetal ventral mesencephalon. J Comp Neurol. 2002;443:237–249. doi: 10.1002/cne.10119. [DOI] [PubMed] [Google Scholar]
- Kalia SK, Lee S, Smith PD, Liu L, Crocker SJ, Thorarinsdottir TE, Glover JR, Fon EA, Park DS, Lozano AM. BAG5 inhibits parkin and enhances dopaminergic neuron degeneration. Neuron. 2004;44:931–945. doi: 10.1016/j.neuron.2004.11.026. [DOI] [PubMed] [Google Scholar]
- Karakaya S, Kipp M, Beyer C. Oestrogen regulates the expression and function of dopamine transporters in astrocytes of the nigrostriatal system. J Neuroendocrinol. 2007;19:682–690. doi: 10.1111/j.1365-2826.2007.01575.x. [DOI] [PubMed] [Google Scholar]
- Kinor N, Geffen R, Golomb E, Zinman T, Yadid G. Dopamine increases glial cell line-derived neurotrophic factor in human fetal astrocytes. Glia. 2001;33:143–150. doi: 10.1002/1098-1136(200102)33:2<143::aid-glia1013>3.0.co;2-3. [DOI] [PubMed] [Google Scholar]
- Kitada T, Asakawa S, Hattori N, Matsumine H, Yamamura Y, Minoshima S, Yokochi M, Mizuno Y, Shimizu N. Mutations in the parkin gene cause autosomal recessive juvenile parkinsonism. Nature. 1998;392:605–608. doi: 10.1038/33416. [DOI] [PubMed] [Google Scholar]
- Ledesma MD, Galvan C, Hellias B, Dotti C, Jensen PH. Astrocytic but not neuronal increased expression and redistribution of parkin during unfolded protein stress. J Neurochem. 2002;83:1431–1440. doi: 10.1046/j.1471-4159.2002.01253.x. [DOI] [PubMed] [Google Scholar]
- Liberatore GT, Jackson-Lewis V, Vukosavic S, Mandir AS, Vila M, McAuliffe WG, Dawson VL, Dawson TM, Przedborski S. Inducible nitric oxide synthase stimulates dopaminergic neurodegeneration in the MPTP model of Parkinson disease. Nat Med. 1999;5:1403–1409. doi: 10.1038/70978. [DOI] [PubMed] [Google Scholar]
- Liddell JR, Hoepken HH, Crack PJ, Robinson SR, Dringen R. Glutathione peroxidase 1 and glutathione are required to protect mouse astrocytes from iron-mediated hydrogen peroxide toxicity. J Neurosci Res. 2006;84:578–586. doi: 10.1002/jnr.20957. [DOI] [PubMed] [Google Scholar]
- Litvan I, Halliday G, Hallett M, Goetz CG, Rocca W, Duyckaerts C, Ben-Shlomo Y, Dickson DW, Lang AE, Chesselet MF, Langston WJ, Di Monte DA, Gasser T, Hagg T, Hardy J, Jenner P, Melamed E, Myers RH, Parker D, Jr, Price DL. The etiopathogenesis of Parkinson disease and suggestions for future research. I. J Neuropathol Exp Neurol. 2007a;66:251–257. doi: 10.1097/nen.0b013e3180415e42. [DOI] [PubMed] [Google Scholar]
- Litvan I, Chesselet MF, Gasser T, Di Monte DA, Parker D, Jr, Hagg T, Hardy J, Jenner P, Myers RH, Price D, Hallett M, Langston WJ, Lang AE, Halliday G, Rocca W, Duyckaerts C, Dickson DW, Ben-Shlomo Y, Goetz CG, Melamed E. The etiopathogenesis of Parkinson disease and suggestions for future research. II. J Neuropathol Exp Neurol. 2007b;66:329–336. doi: 10.1097/nen.0b013e318053716a. [DOI] [PubMed] [Google Scholar]
- Lucking CB, Durr A, Bonifati V, Vaughan J, De Michele G, Gasser T, Harhangi BS, Meco G, Denefle P, Wood NW, Agid Y, Brice A. Association between early-onset Parkinson's disease and mutations in the parkin gene. N Engl J Med. 2000;342:1560–1567. doi: 10.1056/NEJM200005253422103. [DOI] [PubMed] [Google Scholar]
- MacCormac LP, Muqit MM, Faulkes DJ, Wood NW, Latchman DS. Reduction in endogenous parkin levels renders glial cells sensitive to both caspase-dependent and caspase-independent cell death. Eur J Neurosci. 2004;20:2038–2048. doi: 10.1111/j.1460-9568.2004.03659.x. [DOI] [PubMed] [Google Scholar]
- Makar TK, Nedergaard M, Preuss A, Gelbard AS, Perumal AS, Cooper AJ. Vitamin E, ascorbate, glutathione, glutathione disulfide, and enzymes of glutathione metabolism in cultures of chick astrocytes and neurons: evidence that astrocytes play an important role in antioxidative processes in the brain. J Neurochem. 1994;62:45–53. doi: 10.1046/j.1471-4159.1994.62010045.x. [DOI] [PubMed] [Google Scholar]
- Martinez Banaclocha M. N-acetylcysteine elicited increase in complex I activity in synaptic mitochondria from aged mice: implications for treatment of Parkinson's disease. Brain Res. 2000;859:173–175. doi: 10.1016/s0006-8993(00)02005-9. [DOI] [PubMed] [Google Scholar]
- Mena MA, Pardo B, Paino CL, De Yebenes JG. Levodopa toxicity in foetal rat midbrain neurones in culture: modulation by ascorbic acid. NeuroReport. 1993;4:438–440. doi: 10.1097/00001756-199304000-00025. [DOI] [PubMed] [Google Scholar]
- Mena MA, Casarejos MJ, Carazo A, Paino CL, Garcia de Yebenes J. Glia protect fetal midbrain dopamine neurons in culture from L-DOPA toxicity through multiple mechanisms. J Neural Transm. 1997a;104:317–328. doi: 10.1007/BF01277654. [DOI] [PubMed] [Google Scholar]
- Mena MA, Khan U, Togasaki DM, Sulzer D, Epstein CJ, Przedborski S. Effects of wild-type and mutated copper/zinc superoxide dismutase on neuronal survival and L-DOPA-induced toxicity in postnatal midbrain culture. J Neurochem. 1997b;69:21–33. doi: 10.1046/j.1471-4159.1997.69010021.x. [DOI] [PubMed] [Google Scholar]
- Mena MA, Davila V, Bogaluvsky J, Sulzer D. A synergistic neurotrophic response to l-dihydroxyphenylalanine and nerve growth factor. Mol Pharmacol. 1998a;54:678–686. [PubMed] [Google Scholar]
- Mena MA, Casarejos MJ, Alcazar A, Herranz A, Paino CL, Garcia de Yebenes J. The critical factor for L-DOPA toxicity on dopamine neurons is glia. In: Castellano B, Gonzalez B, Nieto-Sampedro M, editors. Understanding glial cells. Boston: Kluwer Academic; 1998b. pp. 213–229. [Google Scholar]
- Mena MA, Casarejos MJ, Garcia de Yebenes J. The effect of glia-conditioned medium on dopamine neurons in culture. Modulation of apoptosis, tyrosine hydroxylase expression and 1-methyl-4-phenylpyridinium toxicity. J Neural Transm. 1999;106:1105–1123. doi: 10.1007/s007020050227. [DOI] [PubMed] [Google Scholar]
- Mena MA, de Bernardo S, Casarejos MJ, Canals S, Rodriguez-Martin E. The role of astroglia on the survival of dopamine neurons. Mol Neurobiol. 2002;25:245–263. doi: 10.1385/MN:25:3:245. [DOI] [PubMed] [Google Scholar]
- Menendez J, Rodriguez-Navarro JA, Solano RM, Casarejos MJ, Rodal I, Guerrero R, Sanchez MP, Avila J, Mena MA, de Yebenes JG. Suppression of Parkin enhances nigrostriatal and motor neuron lesion in mice over-expressing human-mutated tau protein. Hum Mol Genet. 2006;15:2045–2058. doi: 10.1093/hmg/ddl129. [DOI] [PubMed] [Google Scholar]
- Moon CJ, Lee YD, Shin TK. Immunohistochemical localization of Bcl-2 in the spinal cords of rats with experimental autoimmune encephalomyelitis. J Vet Sci. 2002;3:279–283. [PubMed] [Google Scholar]
- Moore DJ. Parkin: a multifaceted ubiquitin ligase. Biochem Soc Trans. 2006;34:749–753. doi: 10.1042/BST0340749. [DOI] [PubMed] [Google Scholar]
- Muller HW, Junghans U, Kappler J. Astroglial neurotrophic and neurite-promoting factors. Pharmacol Ther. 1995;65:1–18. doi: 10.1016/0163-7258(94)00047-7. [DOI] [PubMed] [Google Scholar]
- Nagai M, Re DB, Nagata T, Chalazonitis A, Jessell TM, Wichterle H, Przedborski S. Astrocytes expressing ALS-linked mutated SOD1 release factors selectively toxic to motor neurons. Nat Neurosci. 2007;10:615–622. doi: 10.1038/nn1876. [DOI] [PMC free article] [PubMed] [Google Scholar]
- Nicklas WJ, Vyas I, Heikkila RE. Inhibition of NADH-linked oxidation in brain mitochondria by 1-methyl-4-phenyl-pyridine, a metabolite of the neurotoxin, 1-methyl-4-phenyl-1,2,5,6-tetrahydropyridine. Life Sci. 1985;36:2503–2508. doi: 10.1016/0024-3205(85)90146-8. [DOI] [PubMed] [Google Scholar]
- Palacino JJ, Sagi D, Goldberg MS, Krauss S, Motz C, Wacker M, Klose J, Shen J. Mitochondrial dysfunction and oxidative damage in parkin-deficient mice. J Biol Chem. 2004;279:18614–18622. doi: 10.1074/jbc.M401135200. [DOI] [PubMed] [Google Scholar]
- Pardo B, Paino CL, Casarejos MJ, Mena MA. Neuronal-enriched cultures from embryonic rat ventral mesencephalon for pharmacological studies of dopamine neurons. Brain Res Brain Res Protoc. 1997;1:127–132. doi: 10.1016/s1385-299x(96)00020-7. [DOI] [PubMed] [Google Scholar]
- Perez FA, Palmiter RD. Parkin-deficient mice are not a robust model of parkinsonism. Proc Natl Acad Sci USA. 2005;102:2174–2179. doi: 10.1073/pnas.0409598102. [DOI] [PMC free article] [PubMed] [Google Scholar]
- Petrucelli L, Dickson D, Kehoe K, Taylor J, Snyder H, Grover A, De Lucia M, McGowan E, Lewis J, Prihar G, Kim J, Dillmann WH, Browne SE, Hall A, Voellmy R, Tsuboi Y, Dawson TM, Wolozin B, Hardy J, Hutton M. CHIP and Hsp70 regulate tau ubiquitination, degradation and aggregation. Hum Mol Genet. 2004;13:703–714. doi: 10.1093/hmg/ddh083. [DOI] [PubMed] [Google Scholar]
- Raff MC, Fields KL, Hakomori SI, Mirsky R, Pruss RM, Winter J. Cell-type-specific markers for distinguishing and studying neurons and the major classes of glial cells in culture. Brain Res. 1979;174:283–308. doi: 10.1016/0006-8993(79)90851-5. [DOI] [PubMed] [Google Scholar]
- Raff MC, Miller RH, Noble M. A glial progenitor cell that develops in vitro into an astrocyte or an oligodendrocyte depending on culture medium. Nature. 1983;303:390–396. doi: 10.1038/303390a0. [DOI] [PubMed] [Google Scholar]
- Ramsay RR, Singer TP. Energy-dependent uptake of N-methyl-4-phenylpyridinium, the neurotoxic metabolite of 1-methyl-4-phenyl-1,2,3,6-tetrahydropyridine, by mitochondria. J Biol Chem. 1986;261:7585–7587. [PubMed] [Google Scholar]
- Ramsay RR, Salach JI, Singer TP. Uptake of the neurotoxin 1-methyl-4-phenylpyridine (MPP+) by mitochondria and its relation to the inhibition of the mitochondrial oxidation of NAD+-linked substrates by MPP+ Biochem Biophys Res Commun. 1986;134:743–748. doi: 10.1016/s0006-291x(86)80483-1. [DOI] [PubMed] [Google Scholar]
- Riederer P, Sofic E, Rausch WD, Schmidt B, Reynolds GP, Jellinger K, Youdim MB. Transition metals, ferritin, glutathione, and ascorbic acid in parkinsonian brains. J Neurochem. 1989;52:515–520. doi: 10.1111/j.1471-4159.1989.tb09150.x. [DOI] [PubMed] [Google Scholar]
- Rodriguez-Martin E, Canals S, Casarejos MJ, de Bernardo S, Handler A, Mena MA. L-DOPA and glia-conditioned medium have additive effects on tyrosine hydroxylase expression in human catecholamine-rich neuroblastoma NB69 cells. J Neurochem. 2001;78:535–545. doi: 10.1046/j.1471-4159.2001.00440.x. [DOI] [PubMed] [Google Scholar]
- Rodriguez-Navarro JA, Casarejos MJ, Menendez J, Solano RM, Rodal I, Gomez A, Yebenes JG, Mena MA. Mortality, oxidative stress and tau accumulation during ageing in parkin null mice. J Neurochem. 2007;103:98–114. doi: 10.1111/j.1471-4159.2007.04762.x. [DOI] [PubMed] [Google Scholar]
- Serrano A, Menendez J, Casarejos MJ, Solano RM, Gallego E, Sanchez M, Mena MA, Garcia de Yebenes J. Effects of cinnarizine, a calcium antagonist that produces human parkinsonism, in parkin knock out mice. Neuropharmacology. 2005;49:208–219. doi: 10.1016/j.neuropharm.2005.03.003. [DOI] [PubMed] [Google Scholar]
- Solano RM, Menendez J, Casarejos MJ, Rodriguez-Navarro JA, Garcia de Yebenes J, Mena MA. Midbrain neuronal cultures from parkin mutant mice are resistant to nitric oxide-induced toxicity. Neuropharmacology. 2006;51:327–340. doi: 10.1016/j.neuropharm.2006.03.027. [DOI] [PubMed] [Google Scholar]
- Song H, Stevens CF, Gage FH. Astroglia induce neurogenesis from adult neural stem cells. Nature. 2002;417:39–44. doi: 10.1038/417039a. [DOI] [PubMed] [Google Scholar]
- Streit WJ. Microglial senescence: does the brain's immune system have an expiration date? Trends Neurosci. 2006;29:506–510. doi: 10.1016/j.tins.2006.07.001. [DOI] [PubMed] [Google Scholar]
- Streit WJ, Kreutzberg GW. Lectin binding by resting and reactive microglia. J Neurocytol. 1987;16:249–260. doi: 10.1007/BF01795308. [DOI] [PubMed] [Google Scholar]
- Takanashi M, Mochizuki H, Yokomizo K, Hattori N, Mori H, Yamamura Y, Mizuno Y. Iron accumulation in the substantia nigra of autosomal recessive juvenile parkinsonism (ARJP) Parkinsonism Relat Disord. 2001;7:311–314. doi: 10.1016/s1353-8020(00)00050-x. [DOI] [PubMed] [Google Scholar]
- Takeda H, Inazu M, Matsumiya T. Astroglial dopamine transport is mediated by norepinephrine transporter. Naunyn Schmiedebergs Arch Pharmacol. 2002;366:620–623. doi: 10.1007/s00210-002-0640-0. [DOI] [PubMed] [Google Scholar]
- Takuma K, Baba A, Matsuda T. Astrocyte apoptosis: implications for neuroprotection. Prog Neurobiol. 2004;72:111–127. doi: 10.1016/j.pneurobio.2004.02.001. [DOI] [PubMed] [Google Scholar]
- Teismann P, Schulz JB. Cellular pathology of Parkinson's disease: astrocytes, microglia and inflammation. Cell Tissue Res. 2004;318:149–161. doi: 10.1007/s00441-004-0944-0. [DOI] [PubMed] [Google Scholar]
- Tietze F. Enzymatic method for quantitative determination of nanogram amounts of total and oxidized glutathione: application to mammalian blood and other tissue. Anal Biochem. 1969;27:502–522. doi: 10.1016/0003-2697(69)90064-5. [DOI] [PubMed] [Google Scholar]
- Vila M, Jackson-Lewis V, Guegan C, Wu DC, Teismann P, Choi DK, Tieu K, Przedborski S. The role of glial cells in Parkinson's disease. Curr Opin Neurol. 2001;14:483–489. doi: 10.1097/00019052-200108000-00009. [DOI] [PubMed] [Google Scholar]
- Von Coelln R, Thomas B, Savitt JM, Lim KL, Sasaki M, Hess EJ, Dawson VL, Dawson TM. Loss of locus coeruleus neurons and reduced startle in parkin null mice. Proc Natl Acad Sci USA. 2004;101:10744–10749. doi: 10.1073/pnas.0401297101. [DOI] [PMC free article] [PubMed] [Google Scholar]
- Wagner J, Akerud P, Castro DS, Holm PC, Canals JM, Snyder EY, Perlmann T, Arenas E. Induction of a midbrain dopaminergic phenotype in Nurr1-overexpressing neural stem cells by type 1 astrocytes. Nat Biotechnol. 1999;17:653–659. doi: 10.1038/10862. [DOI] [PubMed] [Google Scholar]
- Whitworth AJ, Theodore DA, Greene JC, Benes H, Wes PD, Pallanck LJ. Increased glutathione S-transferase activity rescues dopaminergic neuron loss in a Drosophila model of Parkinson's disease. Proc Natl Acad Sci USA. 2005;102:8024–8029. doi: 10.1073/pnas.0501078102. [DOI] [PMC free article] [PubMed] [Google Scholar]
- Wu DC, Jackson-Lewis V, Vila M, Tieu K, Teismann P, Vadseth C, Choi DK, Ischiropoulos H, Przedborski S. Blockade of microglial activation is neuroprotective in the 1-methyl-4-phenyl-1,2,3,6-tetrahydropyridine mouse model of Parkinson disease. J Neurosci. 2002;22:1763–1771. doi: 10.1523/JNEUROSCI.22-05-01763.2002. [DOI] [PMC free article] [PubMed] [Google Scholar]
- Xu L, Giffard RG. HSP70 protects murine astrocytes from glucose deprivation injury. Neurosci Lett. 1997;224:9–12. doi: 10.1016/s0304-3940(97)13444-9. [DOI] [PubMed] [Google Scholar]
- Yang Y, Gehrke S, Haque ME, Imai Y, Kosek J, Yang L, Beal MF, Nishimura I, Wakamatsu K, Ito S, Takahashi R, Lu B. Inactivation of Drosophila DJ-1 leads to impairments of oxidative stress response and phosphatidylinositol 3-kinase/Akt signaling. Proc Natl Acad Sci USA. 2005;102:13670–13675. doi: 10.1073/pnas.0504610102. [DOI] [PMC free article] [PubMed] [Google Scholar]
- Zhang Y, Gao J, Chung KK, Huang H, Dawson VL, Dawson TM. Parkin functions as an E2-dependent ubiquitin-protein ligase and promotes the degradation of the synaptic vesicle-associated protein, CDCrel-1. Proc Natl Acad Sci USA. 2000;97:13354–13359. doi: 10.1073/pnas.240347797. [DOI] [PMC free article] [PubMed] [Google Scholar]
- Zoccarato F, Toscano P, Alexandre A. Dopamine-derived dopaminochrome promotes H2O2 release at mitochondrial complex I: stimulation by rotenone, control by Ca2+, and relevance to Parkinson disease. J Biol Chem. 2005;280:15587–15594. doi: 10.1074/jbc.M500657200. [DOI] [PubMed] [Google Scholar]