

Abstract
The primate prefrontal cortex (PFC) plays a cardinal role in forming abstract categories and concepts. However, it remains elusive how this is accomplished and to what extent the interaction of functionally distinct neuron classes underlies this representation. Here, we inferred the major cortical cell types, putative pyramidal cells, and interneurons by characterizing the waveforms of action potentials recorded in monkeys performing a cognitively demanding numerosity categorization task. Putative interneurons responded much faster than cells classified as pyramidal neurons and exhibited a higher reliability of category discrimination, whereas putative pyramidal cells showed a higher degree of category selectivity. An analysis of the numerosity tuning profiles and the temporal interactions of adjacent neurons indicated that inhibitory input by putative interneurons shapes the tuning to numerical categories of putative PFC pyramidal cells. These findings favor feedforward mechanisms subserving cognitive categorization and help to clarify cellular interactions in PFC microcircuits.
Keywords: prefrontal cortex, monkey, interneurons, pyramidal cells, single units, numerical categorization
Introduction
The prefrontal cortex (PFC) at the apex of the cortical processing hierarchy (Miller and Cohen, 2001) plays a dominant role in categorization; its neurons readily reflect perceptual (Freedman et al., 2001) and numerical categories (Nieder et al., 2002; Diester and Nieder, 2007). Neurons in the PFC are selectively tuned to preferred numerosities, i.e., the quantity of a stimulus is encoded by the maximum response rate of a particular neuron and the tuning function is a peak function with the preferred numerosity represented at the maximum of discharge (Nieder et al., 2002; Nieder and Merten, 2007). To avoid extensively overlapping tuning curves and to increase discrimination precision between numerosities, neurons should exhibit relatively sharp tuning behavior. How tuning functions to abstract categories are shaped by neuronal computations remains elusive. It is known, however, that local microcircuits between functional types of neurons within the PFC play an important role in shaping other representations, such as spatial locations (Goldman-Rakic, 1996). We thus hypothesized that the local interactions between neuron classes in the PFC could also help to shape numerical representations.
The two main types of neurons in the neocortex are pyramidal cells and interneurons, which differ in biochemical and anatomical aspects (Markram et al., 2004; Shepherd, 2004; Wonders and Anderson, 2006). Pyramidal cells are the more abundant cell type and constitute ∼80% of all neocortical neurons. They are excitatory and can project across brain areas. Interneurons, however, are mainly inhibitory and their axons remain within a circumscribed cortical area, indicating that interneurons function as local processing units.
In combination with histology, intracellular recordings have established distinct electrophysiological characteristics for pyramidal cells and interneurons. One of the most obvious differences is related to the electrical profile of their action potentials. Pyramidal cells typically show longer action potential wavelengths than interneurons (Connors and Gutnick, 1990; Markram et al., 2004). Because the duration of extracellularly recorded spike waveforms is directly related to the duration of intracellularly recorded waveforms (Henze et al., 2000; Gold et al., 2006), narrow-spiking (NS; putative interneurons) and broad-spiking neurons (BS; putative pyramidal cells) can also be discriminated with extracellular recording techniques. This approach has proven successful in several studies in the somatosensory (Simons, 1978; McCormick et al., 1985; Swadlow and Gusev, 2002), visual (Swadlow and Weyand, 1987; Gur et al., 1999; Shapley et al., 2003; Mitchell et al., 2007; Nowak et al., 2008), auditory (Atencio and Schreiner, 2008), and prefrontal cortices (Wilson et al., 1994; Rao et al., 1999; Constantinidis and Goldman-Rakic, 2002) of different mammalian species.
To test whether and to what extent distinct cell classes contribute to abstract category representations in behaving monkeys, we separated the signals of single cells recorded extracellularly based on their waveform profiles. Putative pyramidal cells and interneurons showed specific response properties and functional interactions, implicating distinct roles in shaping abstract quantity representations. These data suggest mainly feedforward interactions between putative inhibitory and excitatory neurons and allow for a refinement of current models of prefrontal circuitry.
Materials and Methods
Behavioral protocol.
The monkeys judged the number of items in a delayed match-to-sample task (see Fig. 1). Numerosities one to four were tested. A trial started when the monkeys grasped the response lever; the monkeys were required to maintain their gaze within 1.75° of visual angle of the fixation point during sample presentation and the memory delay (monitored with an infrared eye-tracking system, ISCAN, at a sample rate of 120 Hz). After the fixation period, an array of dots was presented for 800 ms as sample stimulus (sample period). The monkeys had to memorize the numerosity until the end of a delay period (1000 ms), after which the test stimulus (1200 ms) was presented. In a match trial, the first test stimulus contained the same number of items as the sample stimulus. The monkeys were required to indicate a match by a lever release. In nonmatch trials, the first test stimulus was either larger or smaller in numerical value than the sample stimulus. In this case, the monkeys had to hold the lever until the second test stimulus came up, which was always a match. After correct responses, a fluid reward was delivered. False responses led to a short time out. Fixation breaks and lever releases during sample or delay led to an abortion of the trial. Match and nonmatch trials appeared in a pseudorandom order and with equal probability (p = 0.5). Trials were randomized and balanced across all relevant features.
Figure 1.
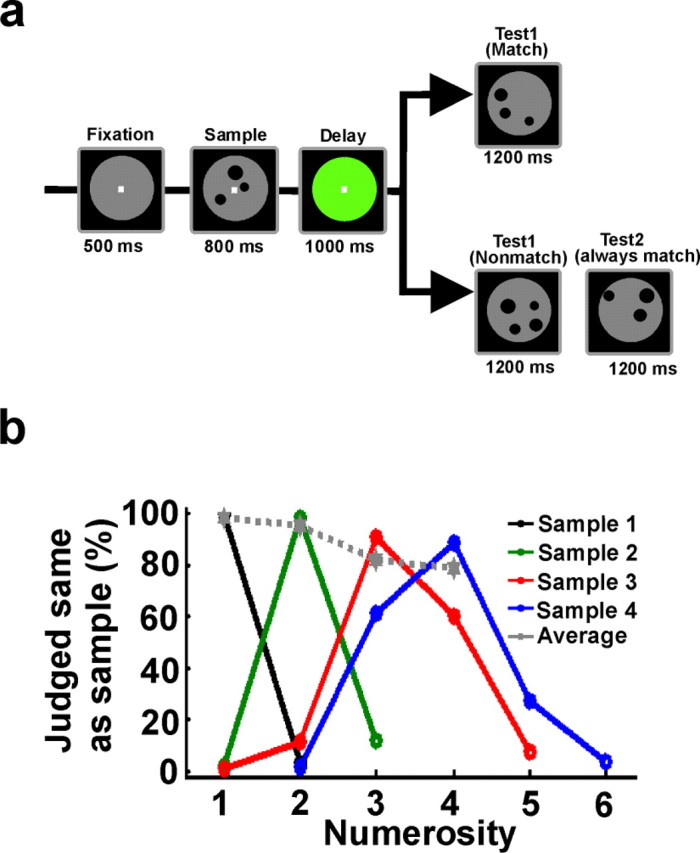
Delayed match to numerosity task and behavioral performance. a, Behavioral protocol. The monkeys held a lever and fixated a small fixation spot at the center of the computer monitor to start a trial. The first display (sample) contained one to four items. During a 1000 ms memory delay, the monkeys had to memorize this numerosity and match it to the subsequent test display. There was a 50% probability that the test contained the same number of items as the sample (a match). In a match trial, the monkeys released the lever to receive a reward. In a nonmatch trial, the monkeys continued holding the lever until a second test display appeared, which was always a match and required a lever release to receive a reward. b, Behavioral performance. The curves show how often the monkeys judged the first test as being equal to the sample numerosity. The numerical value in the first test display is shown on the x-axis. Each color represents a specific sample numerosity. The average performance for each numerosity is shown in gray as the percentage correct (chance level, 50%).
Stimuli.
The stimuli were randomly arranged black dots displayed on a gray background (diameter, 6° of visual angle). Low-level visual features were controlled for to ensure that the monkeys were indeed using the numerical value of the arrays of dots to solve the task. For each session, 100 different images per numerosity were generated with pseudorandomly varied visual features: the diameter of the dots ranged from 0.5 to 0.9° of visual angle and their positions were only restricted by the border of the gray background circle and the fact that they were not allowed to overlap each other. Sample and test stimuli were never identical. All four quantities were presented in each session with one standard and one control condition. Standard and control trials were randomly intermingled and appeared with equal probability (p = 0.5). Controls included displays with constant circumference (and, thus, decreasing total area as opposed to increasing total area in the standard condition), linear configuration (i.e., all dots were linearly arranged), and constant density (i.e., constant mean distance between dots) across all presented quantities. These measures prevented the monkeys from memorizing visual patterns instead of using the numerical information to solve the task.
Recording method.
Recordings were made from the PFC of four hemispheres in four adult rhesus monkeys (Macaca mulatta) in accordance with the guidelines for animal experimentation approved by the Regierungspräsidium Tübingen (Tübingen, Germany). Arrays of varnish-insulated tungsten microelectrodes (1 MΩ; FHC) or glass-insulated tungsten microelectrodes (1 MΩ; Alpha Omega) attached to screw microdrives were inserted by using a grid with 1 mm spacing (see Fig. 4). The frequency distribution of NS and BS cells recorded with these two types of electrodes were not different (χ2 test, two-sided, p < 0.001), nor was any other characteristic. Recording sites were anatomically reconstructed by using structural magnetic resonance images taken from each monkey before implantation. Neurons were selected at random; no attempt was made to search for task related activity. Waveform separation was performed off-line by applying mainly principal component analysis (Plexon Systems).
Figure 4.

Location of recording sites in PFC. a, Left and right hemispheric views of a monkey brain indicating the gross anatomy of the recording sites in the PFC (circles represent location of recording well). b, Reconstruction of recording sites (indicated by dots and crosses) in the PFC of the four monkeys. Numerosity-selective narrow-spiking (NS) and broad-spiking (BS) cells are shown in red and blue, respectively. The dot size reflects the proportion of selective units found at each recording site. Sites lacking numerosity-selective neurons are marked by crosses. There was no apparent topographical arrangement or clustering of BS and NS neurons. ar, Arcuate sulcus; ps, principal sulcus.
Exclusion of waveforms.
Only neurons characterized by mean waveforms with a downward voltage deflection followed by an upward voltage deflection with a clear peak were included. The selection criteria were as follows: the minimum of the waveform had to occur between 200 and 400 μs after reaching the initial threshold, and the maximum was not allowed to occur before 300 μs after crossing of the threshold. Neurons that did not fulfill these criteria were excluded from additional analysis. In total, 45 neurons were excluded; 2 of them had their minimum before 200 μs and 43 had their maximum before 300 μs.
Classification of narrow- and broad-spiking neurons.
A linear classifier (k-means, k = 2, squared Euclidean distance) categorized single units as narrow or broad-spiking cells based on their waveforms. In a preprocessing step, waveforms were normalized by the difference between their peak and trough values and aligned by their minimum to remove irrelevant and possibly misleading features (i.e., amplitude and time of minimum). By this, we ensured that only relevant features (i.e., spike width and shape of the waveform, in particular the slope of the peak after the initial trough) (Henze et al., 2000) were used by the classifier. The cluster with the smaller mean spike width was defined as the population of narrow-spiking neurons, the cluster with the larger mean spike width as the population of broad-spiking neurons. We evaluated the classification by calculating an index of discriminability of the two classified distributions. d′ is a measure derived from signal detection theory, given by the difference between the means (or separation between the peaks) of the distribution A and the distribution B, divided by the SD of distribution B. It indicates by how many SDs the two distributions are separated. Because the classification was based on waveforms of 800 μs duration sampled at a frequency of 40 kHz (one entry every 25 μs), the averaged waveforms were saved as a 32-element vector. We calculated d′ as the difference between the means of the broad- and narrow-spiking neurons across all elements divided by the variance across all elements of the narrow-spiking neurons. The centroids of the two classified distributions were separated by 7 SDs (d′ = 7.22).
Calculation of slope during rising activity.
The change of firing rate during the fixation period was normalized by the firing rate measured at 200 ms after fixation onset. The slope was defined as the relative change of firing rate from 200 to 500 ms after fixation onset divided by the temporal difference of 300 ms.
Visual response latency analysis.
To determine the neuronal response latencies, averaged spike density histograms were derived with a 1 ms resolution, smoothed by a sliding window with a kernel bin width of 10 ms for all sample stimuli. A 200 ms time window before stimulus onset was used as baseline. If five consecutive time bins after stimulus onset reached a value higher than the maximum of the baseline period, response latency was defined by the first of these time bins. A default latency of 100 ms was used if no value could be calculated.
ANOVA.
Numerosity-selective neurons were defined based on a two-factor ANOVA. To account for different temporal response phases, spike rates were tested in four adjacent, nonoverlapping time windows (Diester and Nieder, 2007). The first window (400 ms) started at the beginning of the sample period and was shifted by the neurons' response latencies. The second window (400 ms) followed the first one, covering the rest of the sample period. The next two windows (450 ms each) covered the first and second part of the delay period. Selectivity for numerosities was calculated based on these discharge rates using a two-way ANOVA with main factors numerosity (1–4) and stimulus condition (standard and control). Cells were considered to be numerosity selective only if they showed a significant main effect of numerosity, but no significant stimulus condition or interaction effect in one of the four analysis windows.
Population peristimulus time histograms.
Neuronal responses were averaged across cells sorted in the order of preferred numerical values: we calculated the mean of all responses to the preferred numerosity, of all responses to the second most preferred numerosity, etc. The responses were averaged and smoothed with a 200 ms Gaussian kernel for illustrative purposes only.
Population tuning curves.
To derive averaged numerosity-filter functions, the tuning functions of individual neurons were normalized by dividing all spike rates by the maximum activity, thus setting the activity at the preferred numerosity to 100%. Pooling the resulting normalized tuning curves across the entire population of numerosity-selective cells resulted in averaged numerosity-filter functions. The population tuning functions were calculated for the entire sample or delay period for neurons classified as numerosity selective by the two-way ANOVA during the sample or delay period, respectively.
Modulation index.
The modulation index was calculated as the ratio of raw firing rates for the most- and least-preferred stimuli (Swadlow, 1989, 2003). (Note that the normalization of this index might also be achieved in different ways.) Firing rates obtained during the sample period were used for neurons classified as numerosity selective during the sample period by the two-way-ANOVA. Firing rates obtained during the delay period were used for neurons classified as numerosity selective during the delay period.
Fano factor.
The Fano factor was calculated as the mean spike count within the sample or delay period divided by the variance of spike counts in that period.
ROC analysis.
The reliability of numerosity discrimination and its time course was examined by using a sliding receiver operating characteristic (ROC) analysis (Green and Sweets, 1966). For each neuron, the two spike rate distributions for the preferred (true-positive rate) and least-preferred numerosity (false-positive rate) were compared. To obtain the ROC curve, the probability of true positives were plotted as a function of the probability of false positives in 1 spike/s bins. The area under the ROC curve (AUC) was taken as a quantitative measure of how reliably the two distributions were separated, and, in other words, how well a neuron discriminated between the preferred and the least-preferred numerosity. An AUC of 0.5 represents identical distributions (no discrimination), and an AUC of 1.0 indicates completely separated distributions (perfect discrimination). The sliding ROC analysis (kernel width 50 ms, 1 ms increments) was performed to derive the AUC of a neuron at each time point during the trial. The threshold was calculated as the mean AUC plus 3 SDs derived in a 200 ms interval (pure fixation) before sample onset. The latency of numerosity discrimination was defined as the time after sample onset at which this threshold was exceeded. Average AUC values for the entire sample and delay period were compared across cell classes to test differences in numerosity discrimination reliability.
Cross correlation between tuning curves of neuron pairs.
To compare the tuning properties of adjacent neurons, we obtained their tuning curves and calculated the cross-correlation coefficient (CCTuning). The CCTuning takes the entire tuning functions of two cells, i.e., tneuron1(n) and tneuron2(n) for the numerical values n ∈ [1,2,3,4] into account. It is scale invariant, because the means t̄neuron1 and t̄neuron2 are subtracted from each spike rate, and has the advantage of normalization, which allows comparison across all cell pairs. The normalized cross-correlation coefficient CCTuning was calculated as follows:
 |
where tneuron1 is the tuning function for neuron 1, tneuron2 is the tuning function for neuron 2, t̄neuron1 and t̄neuron2 are the means of the tuning functions, and n ∈[1,2,3,4] is the numerosity. The means were calculated as follows:
 |
Negative CCTuning values indicate inversely tuned cells, whereas positive CCTuning values suggest similar tuning. Note that only neurons that were significantly tuned to numerosity (as tested by the two-way ANOVA), and in addition had been recorded at the same electrode, were included in the cross-correlation analysis.
Cross correlation between spike trains of neuron pairs.
We used custom-made Matlab algorithms for calculating temporal cross-correlations between neurons (CCTiming) (de Oliveira et al., 1997). All stimulus conditions were analyzed together, and the entire trial was taken into account. The algorithm for estimation of cross-correlations was as follows: of a given pair, one neuron was designated the trigger. For each of the spikes fired by this neuron, the temporal delays to each of the spikes of the other neuron were calculated and plotted in a histogram with a bin width of 1 ms. This procedure was repeated for all spikes and all trials, summing up all entries and yielding the “raw cross-coincidence histogram” (RCCH). We normalized the RCCHs to a score that was independent of firing rates of the two units.
We calculated the shuffle predictor (derived by correlating subsequent trials with each other and the last trial with the first one). The shuffle predictor is generally interpreted as an estimate of correlogram features induced by an influence repeating itself identically for all trials (typically, the stimulus). We calculated the Z score by subtracting the shuffle predictor and dividing by the SD of the predictor. We chose the Z score for normalization because it has been shown to produce estimates of correlation strength that are independent from firing rates and reliably reflect the actual functional connectivity in a given neural architecture (Aertsen et al., 1989). Z scores >3 were considered statistically significant deviations from the null hypothesis (of two independent random Poisson processes). To further avoid false positives, we performed two additional tests: (1) false positives often consist of single bins exceeding the confidence limits. We smoothed correlograms by a three-point averaging filter, and only if the resulting correlograms still had peak heights of >3 SD were they scored as significant correlations. (2) We divided the trials into two groups. Only if a significant correlation occurred within ± 25 ms in both groups, the pair was considered significantly correlated.
Results
Classification of narrow- and broad-spiking neurons
PFC neurons were recorded extracellularly in four rhesus monkeys performing a cognitively demanding delayed match-to-sample task on visually displayed numerosities (Fig. 1a). The monkeys maintained fixation while judging the number of items. After an initial 500 ms fixation period, an array of dots was presented as sample stimulus for 800 ms. In the following 1000 ms (delay period), the monkeys were required to memorize the numerosity to match it to the number of dots during the subsequent test phase. Low-level visual features were controlled for to ensure that the monkeys were indeed using the numerical value of the arrays of dots to solve the task. All four quantities were presented in each session with one standard and one control condition. Different control conditions were applied day by day. Controls included displays with constant circumference, linear configuration, and constant density across all presented quantities. For each session, 100 different images per numerosity were generated with pseudorandomly varied visual properties. Sample and test stimulus were never identical (see Materials and Methods). All monkeys performed the task 80–90% correct (Fig. 1b) and showed the behavioral characteristics of numerical discrimination as described previously (Nieder et al., 2002, 2006; Nieder and Miller, 2004; Diester and Nieder, 2007; Nieder and Merten, 2007; Merten and Nieder, 2008).
Neuronal signals were sorted based on waveform characteristics using principle components and other characteristic features (using Offline Sorter software; Plexon), taking the refractory period into account. A total of 1081 single units were isolated (214 from monkey B, 512 from monkey H, 203 from monkey R, and 152 from monkey W). The amplitude threshold for spike detection was set below baseline (negative relative to baseline) to account for the fact that the largest amplitude deflection was expected downward in extracellular recordings without signal inversion. All PFC neurons (1036 of 1081) with a downward voltage deflection followed by an upward voltage deflection with a clear peak in their waveforms were analyzed. The remaining 45 PFC neurons with deviating waveforms were excluded from additional analysis (for details of exclusion criteria, see Materials and Methods).
According to our hypothesis of two separable neuron types, the distribution of spike waveforms was expected to be bimodal. To test this, we calculated the average action potential waveform of each neuron. Waveforms had similar biphasic shapes but varied in duration, as defined by the interval between the waveforms' troughs and peaks (Fig. 2a) (Bartho et al., 2004). The distribution of waveform durations (Fig. 2b) was significantly bimodal [p < 0.001; Hartigan and Hartigan's (1985) dip test, not influenced by the exclusion of atypical waveforms]. A linear classifier was used to objectively separate narrow- and broad-spiking neurons based on waveforms. Figure 2c shows the mean spike waveforms of a random subset of 130 classified PFC neurons. The classification results corresponded to the two modes of the bimodal distribution, with 13% (137 of 1036) showing narrow waveforms clustering at ∼200 ms and 87% (899 of 1036) showing broad waveforms clustering at ∼500 ms duration (Fig. 2b). Because our cell classification is based on waveform criteria, we use the descriptive terms “narrow-spiking neurons” and “broad-spiking neurons” in the following to denote putative interneurons and pyramidal cells. Based on the discharge rate, NS and BS neurons have also been termed “fast-spiking neurons” and “regular-spiking neurons,” respectively (Wilson et al., 1994).
Figure 2.

Classification of broad- and narrow-spiking neurons. a, Mean waveforms of one narrow and one broad-spiking neuron recorded from the same electrode. Waveform duration was defined as the time from waveform valley to peak. b, Bimodal distribution of waveform durations. c, Normalized average waveforms of a random subset of 130 neurons aligned by their minimum. Red and blue waveforms correspond to narrow- and broad-spiking neurons, respectively.
General response properties of narrow- and broad-spiking neurons
We found several physiological properties that differed systematically between NS and BS cells. First, the overall firing rates for all task periods differed strongly between neuron classes (Fig. 3a). NS neurons exhibited a higher level of activity during the fixation period when no stimulus was present (meanNS, 13.7 Hz; meanBS, 3 Hz; Mann–Whitney U test, p < 0.001). Second, NS neurons also showed a prominent ramping activity during fixation with positive slopes (mean change of firing rate from baseline, 30%; sign test, two-sided, p < 0.01), possibly reflecting stimulus expectation. Slopes of BS cells were not different from zero (mean change of firing rate from baseline, 12%; p = 0.24), but differed significantly from those of putative interneurons (Mann–Whitney U test, p < 0.01). Third, NS neurons showed stronger stimulus-evoked responses than did BS neurons (meanNS, 17 Hz; meanBS, 3.2 Hz; Mann–Whitney U test, p < 0.001). Fourth, NS neurons showed shorter visual response latencies than BS neurons (medians, 87 and 123 ms for NS and BS neurons, respectively; p < 0.001, Mann–Whitney U test) (Fig. 3b). The distinct properties of NS and BS neurons and their clearly separable distributions strongly suggest classification into putative interneurons and pyramidal cells as discussed below.
Figure 3.

Characterization of broad- and narrow-spiking neurons. a, Mean temporal response profile for NS (red) and BS neurons (blue) across the trial. Shaded areas represent the SEM. b, Cumulative histogram of visual response latencies.
Category-dependent firing rate modulation of NS and BS cells
To determine whether neurons were selective to numerical categories, we first calculated a two-way ANOVA [with factors numerosity (i.e., 1,2,3, and 4) × stimulus condition (i.e., standard vs control); p < 0.05]. During the sample period, 30% (309 of 1036) of the PFC neurons were numerosity selective (only significant for factor numerosity, no other main effects or interactions). During the delay period, 38% (396 of 1036) of the neurons were significantly tuned to numerosities. Numerosity-selective neurons showed peaked tuning curves with maximum discharge at their respective preferred numerosities (Nieder et al., 2002, 2006; Nieder and Miller, 2004; Diester and Nieder, 2007; Nieder and Merten, 2007) (see Figs. 6a,c, 8a). Figure 4 shows the exact recording locations of all numerosity-selective neurons in the four monkeys. There was no clustering of NS and BS neurons. We found a slight but not significant tendency of NS neurons toward deeper recording sites in three of the four monkeys (difference between mean recording depth of BS and NS cells: monkey H, −66 μm; monkey B, −320 μm; monkey R, −214 μm, monkey W, 117 μm).
Figure 6.
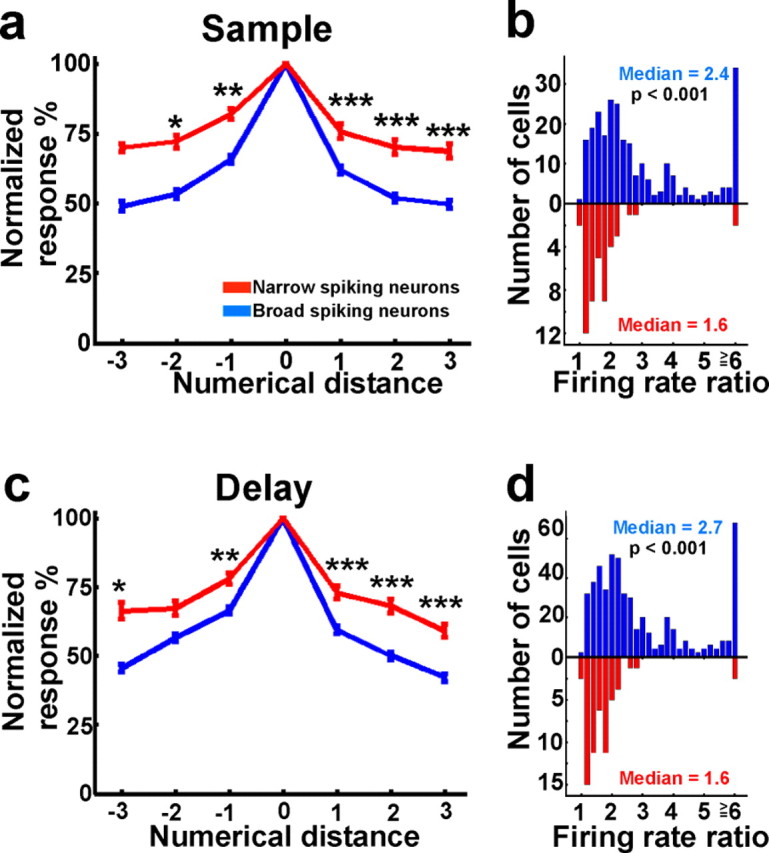
Numerosity-selectivity of broad- and narrow-spiking neurons. a, Population tuning curves of NS (red) and BS neurons (blue) that were selective during the sample period. The differences between the tuning curves for NS and BS neurons were significant for almost all numerical distances (*p < 0.05; **p < 0.01; ***p < 0.001). b, Tuning modulation index for the same neurons. c, d, Population tuning curves (c) and modulation indices (d) for neurons tuned during the delay period. The same layout as in a and b is used. Error bars indicate SEM.
Figure 8.

Tuning properties of adjacent numerosity-selective neurons. a, Tuning curves of exemplary neuron pairs recorded at the same electrode. Tuning curves of BS cells with preferred numerosities of 1, 2, 3, and 4 are shown in blue and tuning of neighboring NS cells in red. CCTuning, Correlation coefficient of tuning curves. b, Histogram of CCTuning values of all numerosity-encoding NS–BS cell pairs recorded at the same electrode. c, Histogram of CCTuning values of all numerosity-encoding BS–BS pairs recorded at the same electrode. Error bars indicate SEM.
To clarify the contributions of NS and BS cells to numerical categorization, we compared their involvement in the task (Table 1). Overall, the proportion of numerosity-selective neurons in the sample period did not differ between cell classes (BS cells, 29%; NS cells, 35%; χ2 test, two-sided, p > 0.05). During the delay period, however, proportionally more numerosity-selective NS neurons were found (BS cells 37%, NS cells 46%, p < 0.05). Preferred numerosities were equally distributed across NS and BS cells (χ2 test of homogeneity, p > 0.05). Figure 5a shows the average response of the 261 putative pyramidal neurons that were numerosity selective during the sample period. Responses to the preferred numerosity of each BS cell (ranging from numerosity 1–4 in this data set) are shown in dark blue. Responses to less preferred numerosities (i.e., the numerosities at the flanks of the tuning curves) are shown in faded color (decreasing saturation with decreasing preference). The average firing rates of 48 numerosity-selective NS cells are shown in red. Responses to the preferred numerosity are given in dark red, responses to the least-preferred numerical value in light red. A prominent phasic component in NS cells is clearly visible during the first 250 ms of the sample period for all numerical stimuli. Even for the least-preferred numerosity, the discharges were elevated relative to the baseline rate obtained during pure fixation (mean baseline discharge rate, 15.6 Hz; mean discharge rate during first 250 ms of sample, 22.5 Hz; signed rank test, p < 0.001). In contrast, responses of BS cells to less preferred stimuli did not show any significant elevation of firing rates (mean baseline discharge rate, 4.4 Hz; mean discharge rate during first 250 ms of sample, 4.1 Hz; signed rank test, p = 0.2). The changes between baseline and early sample period were highly significant between neuron classes (meanNS increase, 7 Hz; meanBS decrease, −0.3 Hz; Mann–Whitney U test, p < 0.001). During the second half of the sample period (last 400 ms), both neuron classes were characterized by a significant depression of firing rates for the least-preferred numerosities (NS cells: mean baseline, 15.6 Hz; mean late sample, 11.8 Hz; signed rank test, p < 0.05; BS cells: mean baseline, 4.4 Hz; mean late sample, 2.4 Hz; signed rank test, p < 0.001). During this period, no significant differences between neuron classes were found (meanNS decrease, −3.8 Hz; meanBS decrease, −1.9 Hz; Mann–Whitney U test, p = 0.8).
Table 1.
Frequency of broad- and narrow-spiking neurons and numerosity selectivity in different cell classes
| Neuron class | n | Sample |
Delay |
Average (%) |
||
|---|---|---|---|---|---|---|
| Numerosity selective | % | Numerosity selective | % | |||
| Broad spiking | 899 | 261 | 29 | 333 | 37 | 33 |
| Narrow spiking | 137 | 48 | 35 | 63 | 46 | 41 |
Figure 5.

Firing rate modulation of broad- and narrow-spiking numerosity-selective neurons. a, b, Average firing rates of BS (blue) and NS (red) neurons that were selective for numerosity during the sample (a) and delay (b) period to the preferred (dark colors) and less preferred (light colors) numerosities.
During the delay period, only BS cells showed significant deviations from baseline firing rate for the least-preferred numerosities. Discharges relative to their baseline decreased for least-preferred numerosities during early delay (first 300 ms: mean baseline, 4 Hz, mean early delay, 3 Hz; signed rank test, p < 0.001) and middle delay (starting 400 ms after delay onset and lasting 400 ms: mean, 2.5 Hz; signed rank test, p < 0.001) (Fig. 5b). NS cells did not show any significant changes in discharge rates for least-preferred numerosities (mean baseline, 13.4 Hz; mean early delay period, 13.5 Hz; mean middle delay period, 11.5 Hz; signed rank test, p > 0.2). The differences between NS and BS cells' firing rate changes were significant during the early delay phase (meanNS increase, 0.1 Hz; meanBS decrease, −1 Hz; Mann–Whitney U test, p < 0.05).
Selectivity of numerosity encoding for NS and BS cells
To investigate the category selectivity of NS and BS cells, we calculated tuning curves (with numerosity as the independent variable) and modulation indices (calculated as the ratio of firing rates elicited by the most- and least-preferred numerosity) (see also Materials and Methods). We found that NS neurons exhibited much broader tuning curves than BS cells (Fig. 6a,c). The differences between the tuning curves for both cell classes were significant for almost all numerical distances (Mann–Whitney U test, p < 0.05). Moreover, the modulation indices were significantly larger in BS cells (Fig. 6b,d), with some cells showing particularly strong modulation (median, 2.4 and 1.6 for BS and NS cells, respectively, during the sample period, p < 0.001; median, 2.7 and 1.6 for BS and NS cells, respectively, during the delay period, p < 0.001).
The tuning curves and modulation indices take the differences in absolute firing rates into account. They describe how selective a neuron responds on average, ignoring trial-by-trial variability and, thus, reliability. To test variability and reliability of categorical representations, we derived Fano factors for the discharges to the preferred numerosities and calculated the AUC for the discharges to the most- and least-preferred numerosities (see Materials and Methods). Whereas Fano factors did not differ between NS and BS cells (median Fano factors ranged between 1.1 and 1.2; p > 0.4), the AUC values describing the reliability of stimulus discrimination revealed a significant difference between neuron classes. Figure 7 shows the time course of the average sliding ROC analyses. The AUC differences between most- and least-preferred numerosities were significantly higher in NS than in BS cells during the entire sample period (mean, 0.58 and 0.55; p < 0.001, two-tailed Mann–Whitney U test) (Fig. 7a). Also during the delay period, NS neurons discriminated more reliably between best- and least-preferred numerosities than BS neurons (mean, 0.59 and 0.56; p < 0.001, two-tailed Mann–Whitney U test) (Fig. 7b). The ROC analysis also revealed that neuronal classes differed in latency to become selectively tuned to the quantity categories (note the earlier rise of the red curve corresponding to NS cells in Fig. 7a). Numerosity information was first coded by NS neurons (median selectivity latency, 117 ms) (see Materials and Methods) and later by BS cells (median, 168 ms; p < 0.001, two-tailed Mann–Whitney U test).
Figure 7.

Reliability of numerosity discrimination for broad- and narrow-spiking neurons. Average AUC derived from the sliding ROC analysis for NS (red) and BS neurons (blue) that were numerosity selective during the sample (a) and delay (b) period. Red and blue shaded areas indicate SEM. The differences between the AUCs were significant for both trial periods (***p < 0.001).
Tuning properties and temporal interactions of adjacent NS and BS cells
If adjacent NS and BS cells constitute elements of microcircuits operating with inhibition and excitation, differences in category tuning for these cell classes might be expected. To test this, we investigated the response properties of single cells recorded simultaneously at the same electrode. Such juxtaposed neurons may interact more frequently than neurons recorded at different sites. As depicted in Figure 8a, NS and BS neurons recorded at the same electrode often showed opposite tuning preferences. For instance, an NS neuron may show a preferred numerosity 1 and a progressive drop-off of activity toward numerosity 4, whereas the corresponding BS neuron may discharge maximally to numerosity 4 and respond least to numerosity 1, and vice versa. To quantify this observation, we calculated cross-correlations of the tuning profiles of adjacent neurons and evaluated the cross-correlation coefficients (CCTuning) (see Materials and Methods) as a measure of similarity or dissimilarity in tuning between cells; a CCTuning of 1 would indicate identical tuning profiles for the cell pair, whereas a CCTuning of −1 would be expected for exactly inverted tuning functions. For the cell pairs of neighboring NS and BS neurons characterized by an inversion of tuning (Fig. 8a), negative CCTuning values were obtained. Across the population of NS–BS cell pairs, both highly positive and highly negative CCTuning values were most frequent (Fig. 8b). For comparison, we also calculated CCTuning values for BS–BS pairs (Fig. 8c) and NS–NS pairs (data not shown). CCTuning values smaller than −0.5 were significantly more frequent in NS–BS cell pairs than in BS–BS pairs (χ2 test, p < 0.02; nNS = 64, nBS = 179; only 1 of 10 NS–NS pairs had a CCTuning <−0.5) (Fig. 8b,c). In other words, inverted tuning was more frequent between adjacent NS and BS neurons than between two neighboring BS cells.
To test whether such inverse tuning of adjacent NS and BS neurons was caused by inhibition, we performed a cross-correlation analysis on spike timing and derived the cross-correlation coefficients (CCTiming) between 44 NS–BS neuron pairs recorded simultaneously at the same electrode (see Materials and Methods). If two cells are functionally connected and one cell provides inhibitory input to the other, synchronous spiking should be suppressed, resulting in a negative correlation in the cross-correlogram at zero time lag. Although correlations between single neurons in the PFC are typically rare (Constantinidis et al., 2001; Constantinidis and Goldman-Rakic, 2002), five NS–BS cell pairs showed significant CCTiming. Negative correlations were found in three of those NS–BS cell pairs (Fig. 9a,c). Remarkably, all three NS-BS cell pairs with negative CCTiming showed inverted tuning profiles (CCTuning < −0.5) (Fig. 9b,d). Of the remaining pairs with significantly positive CCTiming, one pair showed inverse tuning (CCTuning = −0.72), the other more or less identical tuning (CCTuning = 0.98).
Figure 9.

Synchronization patterns of adjacent numerosity-selective neurons. a–d, NS–BS cell pairs displaying significant CCTiming-histogram troughs. a, CCTiming histogram (smoothed by a three-point averaging filter) (see Materials and Methods) of one example NS–BS cell pair. The dotted line indicates the significance threshold. b, Tuning curves for the neurons used for the CCTiming calculation in a. c, d, CCTiming histogram and tuning properties for a second example NS–BS neuron pair. e–h, Two pairs of two BS cells that displayed significant CCTiming-histogram peaks (same layout as in a–d). Error bars indicate SEM.
In contrast to NS–BS cell pairs, functional interactions were very different in BS–BS cell pairs. We found six BS–BS cell pairs with significantly positive CCTiming values (of a total of 103 tested pairs) (Fig. 9e,g) and only one pair with a significantly negative CCTiming. Except for one BS–BS pair with a positive CCTiming, which showed unrelated tuning functions (CCTuning = 0), all other BS–BS pairs exhibited highly similar tuning profiles (CCTuning > 0.75) (Fig. 9f,h). We did not find any significant temporal correlation effects between NS–NS pairs (n = 7).
In summary, NS–BS pairs were mainly characterized by inverse numerosity tuning and negative cross-correlations of spike timing, indicating inhibitory interactions. BS–BS cell pairs, however, exhibited similar numerosity tuning and positive cross-correlations of spike occurrence. This confirms excitatory connections causing spiking synchronization in neighboring BS cells.
Discussion
In this study, we characterized the contributions of two classes of PFC neurons. Extracellularly recorded neurons can be divided into BS and NS neurons based on the width of their action potentials, and several physiological response properties suggest these cell types represent pyramidal cells and interneurons, respectively. Both cell types were tuned to numerosity, but putative pyramidal cells showed a higher degree of category selectivity, whereas putative interneurons exhibited higher reliability of category discrimination. Furthermore, putative interneurons were characterized by fast response kinetics. An analysis of the numerosity tuning profiles and the temporal interactions of adjacent neurons indicated that inhibitory input by putative interneurons sharpens the categorical numerosity tuning of possible PFC pyramidal cells. As discussed below, our results are in line with previous findings in a variety of cortical areas in different mammalian species, thus arguing for conserved mechanisms across cortical areas and species.
NS and BS neurons resemble putative interneurons and pyramidal cells
Several response features argue that NS and BS neurons corresponded to interneurons and pyramidal cells, respectively. First, the higher average firing rate of NS neurons is a typical characteristic of interneurons (Connors and Gutnick, 1990; Markram et al., 2004). The mean spike rates of NS and BS neurons (Fig. 5) corresponded exactly to values that have been reported in the literature: 10.6–19 spikes/s for putative interneurons and 4–8 spikes/s for possible pyramidal cells (Swadlow, 2003). Second, the short visual latencies are in agreement with the finding that interneurons react very rapidly to electrical stimulation (Swadlow, 2003). Third, the ratio of BS (85–90%) versus NS neurons (10–15%) that we found is identical to previous extracellular recordings in the macaque (Wilson et al., 1994) and rat PFC (Homayoun and Moghaddam, 2007), and in agreement with the overrepresentation of pyramidal cells observed with intracellular and anatomical studies in monkey and rat PFC (Kawaguchi, 1995; Gabbott and Bacon, 1996; Gabbott et al., 1997). Fourth, interactions between adjacent NS and BS neurons were predominantly inhibitory, the typical connection pattern between interneurons and pyramidal cells (Shepherd, 2004). Neighboring BS–BS neuron pairs, however, showed mainly excitatory interactions.
Temporal response characteristics of putative pyramidal cells and interneurons
Compared with BS neurons, NS neurons exhibited distinct temporal response characteristics. First, putative inhibitory cells showed a more pronounced phasic component after stimulus onset. Such a phasic response caused by intense temporal summation would allow increased efficiency and temporal precision in driving postsynaptic pyramidal cells (Fricker and Miles, 2000; Povysheva et al., 2006; Mann and Paulsen, 2007). Second, putative interneurons responded faster to visual stimulation and also discriminated numerical categories earlier than putative pyramidal cells, providing strong evidence for a role of interneurons in disynaptic feedforward inhibition of pyramidal cells. This effect can be explained by significantly larger and faster EPSPs of fast-spiking interneurons than of pyramidal cells (Povysheva et al., 2006). This causes lower thresholds for action potential generation and shorter latencies for EPSP–spike coupling in interneurons. The ramping activity we found during the fixation period in putative interneurons may reflect this increased propensity to fire, preparing the ensemble of possible interneurons to rapidly integrate excitatory inputs.
Coding selectivity versus coding reliability
Putative pyramidal cells were more selective for numerical categories. Compared with putative interneurons, their tuning curves were sharper and showed higher modulation indices. Our results complement previous studies in sensory and cognitive domains in which putative interneurons showed broader tuning than putative pyramidal cells in the visual, somatosensory, and auditory cortices (Swadlow and Weyand, 1987; Swadlow and Gusev, 2002; Swadlow, 2003; Wu et al., 2008) as well as in the prefrontal cortex (Rao et al., 1999, 2000; Constantinidis and Goldman-Rakic, 2002). As argued below, broader tuning of inhibitory putative interneurons may have a critical role in sharpening the tuning functions of possible pyramidal cells.
We derived the AUC as a measure of the cells' coding reliability. The AUC values in putative interneurons were higher than in putative pyramidal cells, indicating a more reliable discrimination of quantity categories in putative interneurons. In V4, Mitchell et al., 2007) reported a similar finding in an attention task based on Fano factors. This superior reliability could be the result of the convergence of many input neurons on interneurons, because a broad range of unselective inputs is more reliable when averaged than few selective inputs (Swadlow, 2003). The higher reliability of putative interneurons could also be explained by their lower membrane threshold rendering them more likely to fire in response to an input (Povysheva et al., 2006).
Together, our results indicate that category selectivity is higher in putative pyramidal cells, but discriminability is more reliable in putative interneurons. We speculate that reliability is more important for extraction and sharpening numerosity representations within the local PFC microcircuitry, whereas selectivity may play a more prominent role in downstream decision-related processing (Medalla et al., 2007).
Interactions between neighboring NS and BS neurons
Previous studies have shown that neighboring NS and BS cells in the primate PFC can exhibit opposite spatial response properties. When comparing the responses of fast-spiking neurons (NS neurons) and regular-spiking neurons (BS neurons) that were recorded within 400 μm of each other, Wilson et al. (1994) observed inverted spatial direction selectivity of NS and BS cell pairs. Rao et al. (1999), however, found similar spatial preferences and visual field biases of NS and BS neurons recorded at the same electrode. Moreover, Constantinidis et al. (2002) reported that inhibition was primarily present in cell pairs with dissimilar spatial tuning profiles.
In the current study, we found inverted category tuning between adjacent NS and BS neurons at the same electrode tip and, thus, at minimum anatomical distance. With reference to tuning characteristics of neighboring BS–BS cell pairs, inverse tuning between NS and BS cells occurred significantly more often. This finding is suggestive of the inhibitory effects of NS cells on BS cells (note that NS cells showed shorter latencies), resulting in sharpening of the tuning curves of BS cells via feedforward inhibition provided by NS neurons. Indeed, in some cases we were able to demonstrate a functional connection between NS and BS cell pairs with inverted numerosity tuning, showing that the temporal discharge of adjacent NS and BS cells was negatively correlated; if one neuron discharged, the other neuron was significantly inhibited, and vice versa. Such inhibitory effects were absent between neighboring BS cells. Rather, BS–BS cell pairs were excited synchronously, possibly reflecting shared excitatory input (Rao et al., 1999).
Modeling category selectivity
Recurrent network models have tried to describe the interactions between populations of excitatory pyramidal cells and inhibitory interneurons in monkey PFC and lateral intraparietal area (Compte et al., 2000; Wang, 2002; Renart et al., 2003; Fusi et al., 2007). These models make two basic assumptions. First, the population of inhibitory neurons does not receive direct input (from other cortical processing stages), but is recruited via local pyramidal cells. Second, the responses of model interneurons are not tuned to the stimulus parameter of interest.
In contrast to the fundamental assumptions of these network models, we find that putative interneurons have significantly shorter response latencies than putative pyramidal cells, which suggests a predominantly feedforward mechanism rather than exclusively recurrent circuitry. Abstract categories might first be processed by broadly tuned putative interneurons, which convey this representation to putative pyramidal cells to cause further sharpening of their tuning behavior. Wang et al. (2004) proposed a feedforward model to explain how inhibition by broadly tuned inhibitory interneurons could increase the selectivity of pyramidal cells. In this model, interneurons inhibit pyramidal cells if a stimulus is presented at a location that deviates from the pyramidal cells' preferred one. Because the nonpreferred stimuli are represented at the flanks of the tuning function, the curve's shoulders are lowered by this inhibition, thus sharpening the tuning curve. This mechanism has recently been confirmed in the rat primary auditory cortex (Wu et al., 2008). Without this inhibition, the tuning of pyramidal cells becomes broader. This has been verified experimentally: blockade of GABAergic inhibition broadened the tuning properties of neurons in a spatial working memory task in the monkey PFC (Rao et al., 2000).
Similarly, and consistent with our findings in the PFC, numerosity-selective putative interneurons may sharpen the tuning functions of putative pyramidal cells to increase categorical selectivity. In that respect, abstract categorical tuning may be governed by the same feedforward and recurrent mechanisms as proposed for tuning to stimulus properties in sensory cortices (Shapley et al., 2003; Swadlow, 2003; Teich and Qian, 2006). We propose that both mechanisms occur sequentially in a numerosity discrimination task. Putative interneurons and pyramidal cells may receive excitatory inputs simultaneously, but faster channel kinetics allow interneurons to respond earlier. Hence, putative interneurons are able to disynaptically inhibit possible pyramidal cells with inverse tuning properties (Fig. 9) and even prevent them from reaching spiking threshold (as indicated by the suppression of firing rates; see Fig. 5a). Later during the trial, the responses of putative interneurons are modified by a recurrent multisynaptic network (Wang et al., 2004).
In conclusion, our data provide evidence for dissociable response properties of putative pyramidal cells and interneurons. We propose that a disynaptic feedforward inhibitory network consisting of fast-acting, broadly tuned, and highly reliable putative interneurons suppresses nonoptimal excitatory input to putative pyramidal cells. This may lead to a refinement of response accuracy in putative pyramidal cells subserving a more precise distinction between categories, a process likely to take place in the PFC (Miller et al., 2003).
Footnotes
This work was supported by Junior Research Group Grant SFB 550/C11 from the German Research Foundation and a Career Development Award by the International Human Frontier Science Program Organization to A.N. We thank S. Jacob for critical reading of this manuscript.
References
- Aertsen AM, Gerstein GL, Habib MK, Palm G. Dynamics of neuronal firing correlation: modulation of “effective connectivity.”. J Neurophysiol. 1989;61:900–917. doi: 10.1152/jn.1989.61.5.900. [DOI] [PubMed] [Google Scholar]
- Atencio CA, Schreiner CE. Spectrotemporal processing differences between auditory cortical fast-spiking and regular-spiking neurons. J Neurosci. 2008;28:3897–3910. doi: 10.1523/JNEUROSCI.5366-07.2008. [DOI] [PMC free article] [PubMed] [Google Scholar]
- Barthó P, Hirase H, Monconduit L, Zugaro M, Harris KD, Buzsáki G. Characterization of neocortical principal cells and interneurons by network interactions and extracellular features. J Neurophysiol. 2004;92:600–608. doi: 10.1152/jn.01170.2003. [DOI] [PubMed] [Google Scholar]
- Compte A, Brunel N, Goldman-Rakic PS, Wang XJ. Synaptic mechanisms and network dynamics underlying spatial working memory in a cortical network model. Cereb Cortex. 2000;10:910–923. doi: 10.1093/cercor/10.9.910. [DOI] [PubMed] [Google Scholar]
- Connors BW, Gutnick MJ. Intrinsic firing patterns of diverse neocortical neurons. Trends Neurosci. 1990;13:99–104. doi: 10.1016/0166-2236(90)90185-d. [DOI] [PubMed] [Google Scholar]
- Constantinidis C, Goldman-Rakic PS. Correlated discharges among putative pyramidal neurons and interneurons in the primate prefrontal cortex. J Neurophysiol. 2002;88:3487–3497. doi: 10.1152/jn.00188.2002. [DOI] [PubMed] [Google Scholar]
- Constantinidis C, Franowicz MN, Goldman-Rakic PS. Coding specificity in cortical microcircuits: a multiple-electrode analysis of primate prefrontal cortex. J Neurosci. 2001;21:3646–3655. doi: 10.1523/JNEUROSCI.21-10-03646.2001. [DOI] [PMC free article] [PubMed] [Google Scholar]
- de Oliveira SC, Thiele A, Hoffmann KP. Synchronization of neuronal activity during stimulus expectation in a direction discrimination task. J Neurosci. 1997;17:9248–9260. doi: 10.1523/JNEUROSCI.17-23-09248.1997. [DOI] [PMC free article] [PubMed] [Google Scholar]
- Diester I, Nieder A. A Semantic associations between signs and numerical categories in the prefrontal cortex. PLoS Biol. 2007;5:e294. doi: 10.1371/journal.pbio.0050294. [DOI] [PMC free article] [PubMed] [Google Scholar]
- Freedman DJ, Riesenhuber M, Poggio T, Miller EK. Categorical representation of visual stimuli in the primate prefrontal cortex. Science. 2001;291:312–316. doi: 10.1126/science.291.5502.312. [DOI] [PubMed] [Google Scholar]
- Fricker D, Miles R. EPSP amplification and the precision of spike timing in hippocampal neurons. Neuron. 2000;28:559–569. doi: 10.1016/s0896-6273(00)00133-1. [DOI] [PubMed] [Google Scholar]
- Fusi S, Asaad WF, Miller EK, Wang XJ. A neural circuit model of flexible sensorimotor mapping: learning and forgetting on multiple timescales. Neuron. 2007;54:319–333. doi: 10.1016/j.neuron.2007.03.017. [DOI] [PMC free article] [PubMed] [Google Scholar]
- Gabbott PL, Bacon SJ. Local circuit neurons in the medial prefrontal cortex (areas 24a,b,c, 25 and 32) in the monkey: II. Quantitative areal and laminar distributions. J Comp Neurol. 1996;364:609–636. doi: 10.1002/(SICI)1096-9861(19960122)364:4<609::AID-CNE2>3.0.CO;2-7. [DOI] [PubMed] [Google Scholar]
- Gabbott PL, Dickie BG, Vaid RR, Headlam AJ, Bacon SJ. Local-circuit neurones in the medial prefrontal cortex (areas 25, 32 and 24b) in the rat: morphology and quantitative distribution. J Comp Neurol. 1997;377:465–499. doi: 10.1002/(sici)1096-9861(19970127)377:4<465::aid-cne1>3.0.co;2-0. [DOI] [PubMed] [Google Scholar]
- Gold C, Henze DA, Koch C, Buzsáki G. On the origin of the extracellular action potential waveform: a modeling study. J Neurophysiol. 2006;95:3113–3128. doi: 10.1152/jn.00979.2005. [DOI] [PubMed] [Google Scholar]
- Goldman-Rakic PS. Regional and cellular fractionation of working memory. Proc Natl Acad Sci U S A. 1996;93:13473–13480. doi: 10.1073/pnas.93.24.13473. [DOI] [PMC free article] [PubMed] [Google Scholar]
- Green D, Sweets JA. Signal detection theory and psychophysics. New York: Krieger; 1966. [Google Scholar]
- Gur M, Beylin A, Snodderly DM. Physiological properties of macaque V1 neurons are correlated with extracellular spike amplitude, duration, and polarity. J Neurophysiol. 1999;82:1451–1464. doi: 10.1152/jn.1999.82.3.1451. [DOI] [PubMed] [Google Scholar]
- Hartigan JA, Hartigan PM. The dip test of unimodality. Ann Stat. 1985;13:70–84. [Google Scholar]
- Henze DA, Borhegyi Z, Csicsvari J, Mamiya A, Harris KD, Buzsáki G. Intracellular features predicted by extracellular recordings in the hippocampus in vivo. J Neurophysiol. 2000;84:390–400. doi: 10.1152/jn.2000.84.1.390. [DOI] [PubMed] [Google Scholar]
- Homayoun H, Moghaddam B. NMDA receptor hypofunction produces opposite effects on prefrontal cortex interneurons and pyramidal neurons. J Neurosci. 2007;27:11496–11500. doi: 10.1523/JNEUROSCI.2213-07.2007. [DOI] [PMC free article] [PubMed] [Google Scholar]
- Kawaguchi Y. Physiological subgroups of nonpyramidal cells with specific morphological characteristics in layer II/III of rat frontal cortex. J Neurosci. 1995;15:2638–2655. doi: 10.1523/JNEUROSCI.15-04-02638.1995. [DOI] [PMC free article] [PubMed] [Google Scholar]
- Mann EO, Paulsen O. Role of GABAergic inhibition in hippocampal network oscillations. Trends Neurosci. 2007;30:343–349. doi: 10.1016/j.tins.2007.05.003. [DOI] [PubMed] [Google Scholar]
- Markram H, Toledo-Rodriguez M, Wang Y, Gupta A, Silberberg G, Wu C. Interneurons of the neocortical inhibitory system. Nat Rev Neurosci. 2004;5:793–807. doi: 10.1038/nrn1519. [DOI] [PubMed] [Google Scholar]
- McCormick DA, Connors BW, Lighthall JW, Prince DA. Comparative electrophysiology of pyramidal and sparsely spiny stellate neurons of the neocortex. J Neurophysiol. 1985;54:782–806. doi: 10.1152/jn.1985.54.4.782. [DOI] [PubMed] [Google Scholar]
- Medalla M, Lera P, Feinberg M, Barbas H. Specificity in inhibitory systems associated with prefrontal pathways to temporal cortex in primates. Cereb Cortex. 2007;17(Suppl 1):i136–i150. doi: 10.1093/cercor/bhm068. [DOI] [PubMed] [Google Scholar]
- Merten K, Nieder A. Compressed scaling of abstract numerosity representations in adult humans and monkeys. J Cogn Neurosci. 2008 doi: 10.1162/jocn.2008.21032. in press. [DOI] [PubMed] [Google Scholar]
- Miller EK, Cohen JD. An integrative theory of prefrontal cortex function. Annu Rev Neurosci. 2001;24:167–202. doi: 10.1146/annurev.neuro.24.1.167. [DOI] [PubMed] [Google Scholar]
- Miller EK, Nieder A, Freedman DJ, Wallis JD. Neural correlates of categories and concepts. Curr Opin Neurobiol. 2003;13:198–203. doi: 10.1016/s0959-4388(03)00037-0. [DOI] [PubMed] [Google Scholar]
- Mitchell JF, Sundberg KA, Reynolds JH. Differential attention-dependent response modulation across cell classes in macaque visual area V4. Neuron. 2007;55:131–141. doi: 10.1016/j.neuron.2007.06.018. [DOI] [PubMed] [Google Scholar]
- Nieder A, Merten K. A labeled-line code for small and large numerosities in the monkey prefrontal cortex. J Neurosci. 2007;27:5986–5993. doi: 10.1523/JNEUROSCI.1056-07.2007. [DOI] [PMC free article] [PubMed] [Google Scholar]
- Nieder A, Miller EK. A parieto-frontal network for visual numerical information in the monkey. Proc Natl Acad Sci U S A. 2004;101:7457–7462. doi: 10.1073/pnas.0402239101. [DOI] [PMC free article] [PubMed] [Google Scholar]
- Nieder A, Freedman DJ, Miller EK. Representation of the quantity of visual items in the primate prefrontal cortex. Science. 2002;297:1708–1711. doi: 10.1126/science.1072493. [DOI] [PubMed] [Google Scholar]
- Nieder A, Diester I, Tudusciuc O. Temporal and spatial enumeration processes in the primate parietal cortex. Science. 2006;313:1431–1435. doi: 10.1126/science.1130308. [DOI] [PubMed] [Google Scholar]
- Nowak LG, Sanchez-Vives MV, McCormick DA. Lack of orientation and direction selectivity in a subgroup of fast-spiking inhibitory interneurons: cellular and synaptic mechanisms and comparison with other electrophysiological cell types. Cereb Cortex. 2008;18:1058–1078. doi: 10.1093/cercor/bhm137. [DOI] [PMC free article] [PubMed] [Google Scholar]
- Povysheva NV, Gonzalez-Burgos G, Zaitsev AV, Kröner S, Barrionuevo G, Lewis DA, Krimer LS. Properties of excitatory synaptic responses in fast-spiking interneurons and pyramidal cells from monkey and rat prefrontal cortex. Cereb Cortex. 2006;16:541–552. doi: 10.1093/cercor/bhj002. [DOI] [PubMed] [Google Scholar]
- Rao SG, Williams GV, Goldman-Rakic PS. Isodirectional tuning of adjacent interneurons and pyramidal cells during working memory: evidence for microcolumnar organization in PFC. J Neurophysiol. 1999;81:1903–1916. doi: 10.1152/jn.1999.81.4.1903. [DOI] [PubMed] [Google Scholar]
- Rao SG, Williams GV, Goldman-Rakic PS. Destruction and creation of spatial tuning by disinhibition: GABA(A) blockade of prefrontal cortical neurons engaged by working memory. J Neurosci. 2000;20:485–494. doi: 10.1523/JNEUROSCI.20-01-00485.2000. [DOI] [PMC free article] [PubMed] [Google Scholar]
- Renart A, Song P, Wang XJ. Robust spatial working memory through homeostatic synaptic scaling in heterogeneous cortical networks. Neuron. 2003;38:473–485. doi: 10.1016/s0896-6273(03)00255-1. [DOI] [PubMed] [Google Scholar]
- Shapley R, Hawken M, Ringach DL. Dynamics of orientation selectivity in the primary visual cortex and the importance of cortical inhibition. Neuron. 2003;38:689–699. doi: 10.1016/s0896-6273(03)00332-5. [DOI] [PubMed] [Google Scholar]
- Shepherd GM. The synaptic organization of the brain. Ed 5. New York: Oxford UP; 2004. [Google Scholar]
- Simons DJ. Response properties of vibrissa units in rat SI somatosensory neocortex. J Neurophysiol. 1978;41:798–820. doi: 10.1152/jn.1978.41.3.798. [DOI] [PubMed] [Google Scholar]
- Swadlow HA. Efferent neurons and suspected interneurons in S-1 vibrissa cortex of the awake rabbit: receptive fields and axonal properties. J Neurophysiol. 1989;62:288–308. doi: 10.1152/jn.1989.62.1.288. [DOI] [PubMed] [Google Scholar]
- Swadlow HA. Fast-spike interneurons and feedforward inhibition in awake sensory neocortex. Cereb Cortex. 2003;13:25–32. doi: 10.1093/cercor/13.1.25. [DOI] [PubMed] [Google Scholar]
- Swadlow HA, Gusev AG. Receptive-field construction in cortical inhibitory interneurons. Nat Neurosci. 2002;5:403–404. doi: 10.1038/nn847. [DOI] [PubMed] [Google Scholar]
- Swadlow HA, Weyand TG. Corticogeniculate neurons, corticotectal neurons, and suspected interneurons in visual cortex of awake rabbits: receptive-field properties, axonal properties, and effects of EEG arousal. J Neurophysiol. 1987;57:977–1001. doi: 10.1152/jn.1987.57.4.977. [DOI] [PubMed] [Google Scholar]
- Teich AF, Qian N. Comparison among some models of orientation selectivity. J Neurophysiol. 2006;96:404–419. doi: 10.1152/jn.00015.2005. [DOI] [PubMed] [Google Scholar]
- Wang XJ. Probabilistic decision making by slow reverberation in cortical circuits. Neuron. 2002;36:955–968. doi: 10.1016/s0896-6273(02)01092-9. [DOI] [PubMed] [Google Scholar]
- Wang XJ, Tegnér J, Constantinidis C, Goldman-Rakic PS. Division of labor among distinct subtypes of inhibitory neurons in a cortical microcircuit of working memory. Proc Natl Acad Sci U S A. 2004;101:1368–1373. doi: 10.1073/pnas.0305337101. [DOI] [PMC free article] [PubMed] [Google Scholar]
- Wilson FA, O'Scalaidhe SP, Goldman-Rakic PS. Functional synergism between putative gamma-aminobutyrate-containing neurons and pyramidal neurons in prefrontal cortex. Proc Natl Acad Sci U S A. 1994;91:4009–4013. doi: 10.1073/pnas.91.9.4009. [DOI] [PMC free article] [PubMed] [Google Scholar]
- Wonders CP, Anderson SA. The origin and specification of cortical interneurons. Nat Rev Neurosci. 2006;7:687–696. doi: 10.1038/nrn1954. [DOI] [PubMed] [Google Scholar]
- Wu GK, Arbuckle R, Liu BH, Tao HW, Zhang LI. Lateral sharpening of cortical frequency tuning by approximately balanced inhibition. Neuron. 2008;58:132–143. doi: 10.1016/j.neuron.2008.01.035. [DOI] [PMC free article] [PubMed] [Google Scholar]