

Abstract
Topographically ordered projections are established by molecular guidance cues and refined by neuronal activity. Retinal input to a primary visual center, the superior colliculus (SC), is bilateral with a dense contralateral projection and a sparse ipsilateral one. Both projections are topographically organized, but in opposing anterior–posterior orientations. This arrangement provides functionally coherent input to each colliculus from the binocular visual field, supporting visual function. When guidance cues involved in contralateral topography (ephrin-As) are absent, crossed retinal ganglion cell (RGC) axons form inappropriate terminations within the SC. However, the organization of the ipsilateral projection relative to the abnormal contralateral input remains unknown, as does the functional capacity of both projections. We show here that in ephrin-A−/− mice, the SC contains an expanded, diffuse ipsilateral projection. Electrophysiological recording demonstrated that topography of visually evoked responses recorded from the contralateral superior colliculus of ephrin-A−/− mice displayed similar functional disorder in all genotypes, contrasting with their different degrees of anatomical disorder. In contrast, ipsilateral responses were retinotopic in ephrin-A2−/− but disorganized in ephrin-A2/A5−/− mice. The lack of integration of binocular input resulted in specific visual deficits, which could be reversed by occlusion of one eye. The discrepancy between anatomical and functional topography in both the ipsilateral and contralateral projections implies suppression of inappropriately located terminals. Moreover, the misalignment of ipsilateral and contralateral visual information in ephrin-A2/A5−/− mice suggests a role for ephrin-As in integrating convergent visual inputs.
Keywords: ephrin-A, topography, ipsilateral, retina, neuronal activity, visuomotor response, knock-out mouse
Introduction
Topography is a key organizing principle of the nervous system, facilitating transfer and integration of information between brain regions (Lund, 1978). Within the visual system, the projection of retinal ganglion cells (RGCs) in the eyes to a primary visual center, the superior colliculus (SC) is topographically organized (Sefton et al., 2004). Precise point-to-point mapping between the two structures enables a continuous representation of the visual field across the surface of the SC and facilitates control of visually evoked behavior (Sefton et al., 2004; Thivierge and Marcus, 2007). In mammals, the majority of RGCs project to the contralateral SC, but a proportion located in the ventrotemporal retina project ipsilaterally, forming terminal clusters in rostromedial SC that are strictly segregated from contralateral input (Godement et al., 1984; Sefton et al., 2004). For ipsilateral and contralateral visual information to be in register and allow binocular vision, the topography of the horizontal retinal axis within the ipsilateral projection is reversed relative to the contralateral one (Dräger and Hubel, 1976).
As in other central neural projections, retinocollicular topography is established by guidance molecules and refined by neuronal activity (Cline, 2003). Cell surface proteins, Eph receptors and ephrin ligands (McLaughlin and O'Leary, 2005), are expressed as complementary gradients in the developing retina and SC and guide contralateral RGC axons to their appropriate termination zones (Cheng et al., 1995; Feldheim et al., 2000). However, their role in the ipsilateral projection has not been assessed. Furthermore, ipsilateral retinocollicular axons may not need specific guidance cues, but may be guided by their contralateral counterparts, because the normal “reversed” orientation of ipsilateral topography requires the presence of contralateral RGC axons (Lund and Lund, 1976; Finlay et al., 1979; Reese, 1986). Nonetheless, both the contralateral and ipsilateral projections are refined by spontaneous retinal and visually driven neuronal activity, which strengthen topographically appropriate terminations and weaken inappropriate ones (Cline, 2003; McLaughlin et al., 2003). However, this refinement requires spatially and chronologically correlated activity, making it relevant for refining the dense contralateral projection, and segregating contralateral and ipsilateral input. The ability of neuronal activity to refine the sparse ipsilateral projection remains unknown.
In mice lacking ephrin-A2 and/or ephrin-A5, neuronal tracing studies of the contralateral projection have shown that although topographically appropriate projections are present, topographically inappropriate terminations are also observed (Frisen et al., 1998; Feldheim et al., 2000; Pfeiffenberger et al., 2006). Moreover, when spontaneous neuronal activity is prevented in ephrin-A2/A5−/− mice, the retinocollicular projection is completely disordered (Pfeiffenberger et al., 2006), suggesting that neuronal activity significantly refines the abnormal anatomical substrate. Here, we use neuronal tracing and electrophysiological mapping of visually evoked responses to characterize the organization of the ipsilateral retinocollicular projection and its integration with the contralateral projection in ephrin-A2−/− and ephrin-A2/A5−/− mice. We also investigated the impact of abnormal retinocollicular topography on visual behavior using tests of visuomotor response, pupillary reflexes, and visual acuity. Our results reveal a role for ephrin-As in establishing and integrating ipsilateral and contralateral visual maps within the SC, resulting in visual-specific behavioral deficits in ephrin-A−/− mice.
Materials and Methods
Experimental animals
Ephrin-A2−/− and ephrin-A2/A5−/− mice were a generous gift from Professor David Feldheim at the University of California (Santa Cruz, CA) and were originally created as described (Frisen et al., 1998; Feldheim et al., 2000). Mice were rederived on arrival in Western Australia and backcrossed onto a wild-type (WT) C57BL/6J line to maintain the same genetic background as the original mice [Animal Resource Centre, Murdoch University, and Animal Care Unit, University of Western Australia (UWA)]. Mice used in the experiments described here were bred from heterozygous parents (A2−/−; A5−/+). WT mice were obtained from a separate breeding line that was derived from the original backcrosses. We confirmed that ephrin-A2 and ephrin-A5 expression in our WT mice conformed with previous studies (Allen Brain Atlas) (Frisen et al., 1998; Feldheim et al., 2000). Furthermore, presence or absence of expression of ephrin-A2 and ephrin-A5 was appropriate in the knock-out mice (supplemental Fig. 1, available at www.jneurosci.org as supplemental material). Mice were bred at the University of Western Australia and genotyped at weaning (ephrin-A2: 5′CCG CTT CCT CGT GCT TTA CGG TAT C3′; 5′ATA CCG TGG AGG TGA GCA TC3′; 5′AAA AGG GGG TGA AGA GTT GG3′; ephrin-A5: 5′TCC AGC TGT GCA GTT CTC CAA AAC A3′; 5′ATT CCA GAG GGG TGA CTA CCA CAT T3′; 5′AGC CCA GAA AGC GAA GGA GCA AAG C3′).
Mice were maintained in cages with three to five animals and on a 12 h light/dark cycle at 22°C ± 1.5°C and provided with food and water ad libitum. All mice were between 3 and 6 months of age at the time of testing. Experiments were approved by the UWA animal Ethics and Experimentation committee, which conforms to the guidelines of the National Health and Medical Research Council of Australia in accord with National Institutes of Health policies on animal testing. To minimize the effects of stress on behavioral results, all mice were handled daily and habituated to human contact for 1 week before any testing. All behavioral experiments were performed during the second half of the “day” cycle.
Anesthesia
For surgical procedures, mice were deeply anesthetized with xylazine (10 mg/kg, i.p.) and ketamine (70 mg/kg, i.p.). For electrophysiological recording, anesthesia was with 20% Urethane (Sigma; 0.085 ml/10 g mouse; i.p.) and 0.1 ml of buprenorphine (0.3 mg/ml). Terminal anesthesia was with Valabarb (pentobarbitone) 150 mg/kg.
Anatomical tracing of the ipsilateral retinal projection
Retrograde tracing.
Mice were deeply anesthetized and a craniotomy was performed, followed by aspiration of the cortex to expose the SC. A piece of gelfoam soaked in fluorogold (4%) was applied to the rostral SC, labeling RGC axons terminating in rostral SC as well as axons of passage. To confirm that the procedure labeled all axons projecting to the SC, we performed immunohistochemistry on a separate series of retinal whole mounts with anti-βIII-tubulin, a neurofilament antibody shown previously to label all RGCs in rat (Cui et al., 2003). We obtained similar results for total RGC numbers by both techniques (p > 0.05) (data not shown). Mice were terminally anesthetized 3 d after the tracing procedure and were transcardially perfused with 4% paraformaldehyde. Both eyes were dissected and the retinas whole-mounted on slides and coverslipped with Fluoromount G. Counts of RGC somata were undertaken in 12 nonoverlapping rectangular sample fields of 250 × 250 μm; three fields were analyzed in each retinal quadrant (dorsal, ventral, nasal, and temporal) at three equidistant eccentricities between the optic disk and the periphery. Cell counts were made at 400× magnification and RGC densities per square millimeter were calculated (King et al., 2007). Analysis was performed by two independent observers blind to genotype. The retinal area was measured for each mouse (n = 3–8 mice/genotype) using ImageJ and the total number of contralaterally and ipsilaterally projecting RGCs was estimated by proportionality (Dräger, 1985).
Anterograde.
Cholera toxin-B (CTB; 1% in sterile 0.9% NaCl) was injected intravitreally into each eye (n = 3–5 mice/genotype). To allow comparison of the ipsilateral and contralateral projections, the left eye received CTB labeled with AlexaFluor 488 nm, and the right eye CTB labeled with AlexaFluor 555 nm (Invitrogen). Mice were allowed to recover, and after 2 d were terminally anesthetized and transcardially perfused with 4% paraformaldehyde. Brains were removed and postfixed in 4% paraformaldehyde overnight, rinsed, and cryoprotected with 30% sucrose in PBS. The cortex and cerebellum were removed and serial sections (50 μm) were cut coronally, from the optic chiasm rostrally to the inferior colliculus caudally. Sections were photographed on a Bio-Rad Confocal microscope. The rostrocaudal extent of the pretectum and SC occupied by contralateral and ipsilateral projections was assessed from counting the total number of sections containing labeled axons from each projection. The area occupied by ipsilateral projections was measured in Photoshop by thresholding low-power (10×) images to remove background and quantifying the number of pixels above threshold. Pixel number was then converted to area, and eventually volume, by proportionality. The density of ipsilateral projections outside of the concentrated terminal zones was quantified by thresholding high-power images (40×) until ipsilateral axons were accurately detected (Nicol et al., 2006). Images were taken using random systematic sampling in the stratum griseum superficiale (sgs) throughout the entire SC. There were no significant differences in the density of diffuse projections across the depth of the SC and values were pooled for rostral, middle, and caudal SC. Pixels above threshold were expressed as a proportion of the total number of pixels to give an estimate of density. Retinal projections to the pretectum are shown in supplemental Figure 2 (available at www.jneurosci.org as supplemental material).
Electrophysiology
Adult mice (n = 3–6 per genotype) were anesthetized and a craniotomy performed to expose the cortex overlying the superior colliculus (Dräger and Hubel, 1976). The mouse was placed in a head stabilizing support so that the eyes were at the center of a hemisphere used to measure the visual field. A tungsten-in-glass electrode was lowered into the superficial layers of the SC using a micromanipulator to allow spatial measurements of recording locations. A light stimulus was presented to the opposite eye and was moved across the entire visual field to determine the location and size of the receptive field that projects to the electrode location in the SC. Light-evoked responses using this technique have been reported to be a combination of potentials generated by the terminal arbors of RGC axons in the vicinity of the neurons that they innervate and by the postsynaptic neurons themselves, but not by axons of passage (Sauvé et al., 2001). To record from the ipsilateral projection, the electrode was lowered by a further 100–200 μm to penetrate the border of the stratum opticum/stratum griseum superficiale (Godement et al., 1984) and the light stimulus was applied to the ipsilateral eye. Because contralateral responses were significantly stronger than ipsilateral ones, the contralateral eye was occluded with an opaque patch to maximize sensitivity. We ensured that responses were not evoked via the contralateral eye by confirming that a light stimulus applied directly to the occluded contralateral eye gave no response. Only responses with latencies of <80 ms were included in our analysis to avoid measuring polysynaptic responses. The electrode was moved to an adjacent position, the eye patch removed, and the procedure repeated for up to 30 locations in the SC. After completion of mapping, mice were euthanized.
Analysis of topography of the contralateral retinocollicular projection was performed as described previously in goldfish (Rodger et al., 2005a). Too few points in the ipsilateral projection were recorded from individual animals to allow quantification. Briefly, to quantify abnormalities in topography, SC recording loci (x–y distances on the micromanipulator) and stimulus location within the visual field hemisphere were overlain by Cartesian grids, aligning the midpoint of the SC with the corresponding appropriate visual field location. Mapped points were allocated x and y coordinates expressed as a percentage of total SC dimensions. We then calculated the difference between the predicted and actual location of the visual response(s) (Rodger et al., 2005a). Estimates of disorder were broken down into horizontal (nasotemporal) and vertical (dorsoventral) components. In addition, the total disorder for each point was estimated by the distance between the predicted and actual point. For each mouse, disorder was averaged across all points for horizontal, vertical, and total disorder. Low values indicate normal, and high values abnormal, topography. Data were analyzed using one-way ANOVA (Bonferroni–Dunn post hoc test; Statview).
Behavioral testing
To confirm that ephrin-A knock-out mice were not functionally blind, we used a modified version of the visual placing response (Crawley, 1999). Each mouse (n = 10 per genotype) was suspended by the base of the tail and lowered from a height of ∼15 cm toward a horizontal bar. Contact with the whiskers was avoided at all times. The normal visual placing response is characterized by an extension of both forelimbs and hindlimbs before contact. A score was given to each animal: 0 = no observable placing response (blindness); 1 = weak placing response; 2 = clear placing reaction (vision).
Pupillary response
Mice were acclimatized in the dark (4 lux) for a minimum of 30 min to allow maximum pupillary dilatation and were video recorded using an infrared light source camera. While recording, bright light was introduced (1000 lux) or removed instantaneously using a DC light source and the pupillary reaction was recorded for 5 min after the stimulus. Images from the video were digitized and stills were captured every 40 ms. Measurements of pupil and iris areas were taken using ImageJ software and the iris/pupil ratio was plotted against time to show pupillary movement.
Visual acuity
Visual acuity was tested in WT (n = 5), ephrin-A2−/− (n = 4), and ephrin-A2/A5−/− (n = 3) mice in a forced-choice discrimination task (Crawley, 1999). Mice were trained to discriminate between a grating and a gray stimulus of the equivalent mean luminance, and between patterns of horizontal and vertical stripes using positive food reinforcement. Spatial frequencies [0.30, 0.37, 0.44, 0.51, and 0.65 cycles/degree (cpd)] spanned the behavioral estimate of visual acuity in the house mouse (Prusky et al., 2000) and were included in the range tested for optomotor function. Mice were placed at the end of Y-shaped maze and discriminanda (gray vs vertical stripes or horizontal vs vertical stripes) were placed at the end of each arm. The choice was made at a distance of 30 cm and vertical stripes were rewarded in either choice. Each animal was tested five to seven times at each spatial frequency, with a test session comprising 10 choices at a given spatial frequency. The criterion performance at each spatial frequency was considered to be 70% (Prusky et al., 2000). Tests were performed at 1000 lux illumination with a combination of natural daylight and overhead lighting, and groups were compared to assess the effects of spatial frequency and genotype on choice accuracy.
Visuomotor response
Apparatus.
Response to image motion was investigated using an optokinetic drum fitted with a moving stimulus pattern (Jellali et al., 2005). The optokinetic drum consisted of a motorized perspex cylinder (30 cm diameter), rotating clockwise or anticlockwise around a central pedestal. Mice (n = 8–10 per genotype) were placed in a nonreflective transparent container positioned on the central pedestal.
Moving stimulus pattern.
Each stimulus consisted of a square wave grating with vertical black and white stripes of equal width placed against the inside wall of the drum. Test spatial frequencies were calculated using the formula π × 2 × (h/360)/d, where h is the distance of the mouse from the grating (radius of drum) and d is the width of one cycle (one black and one white stripe). We used the following frequencies: 0.03 (wide), 0.13, 0.26, 0.52, and 1.25 (narrow) cpd, which encompassed the behavioral estimate of visual acuity in the house mouse (0.50–0.60 cpd) (Prusky et al., 2000). For each session, the spatial frequency of the stripes was selected using a randomization table and movement speed was set at two revolutions per minute, the optimal rate for eliciting an optokinetic response in mice (Jellali et al., 2005).
Testing.
Stripes of a given spatial frequency were presented to each mouse on different days over a period of 2 months. After 5 min acclimatization in the drum, the stripes were rotated clockwise for 2 min, then anticlockwise for 2 min, with a 30 s pause for the change of direction. Tests were performed under two light levels within the mesopic range (low, 300–400 lux; high, 900–1000 lux), and video recorded. Mice received four trials per day for a total of 5 d. Head-tracking movements following the direction and angular speed of the rotating stripes and lasting for more than one second were considered to be tracking movements in response to the moving stimulus. The number of tracking movements during the 2 × 2 min tests was averaged for each mouse.
Statistical analysis
Data for anatomical distribution and electrophysiological mapping showed homogeneity of variance and were analyzed by ANOVA and the Bonferroni–Dunn post hoc test where appropriate. Behavioral data for pupil reflex and visual acuity were compared using repeated-measures ANOVA. Optomotor head tracking also displayed homogeneity of variance (after transformation, log e) and were analyzed by a p × q ANOVA followed by post hoc Dunnett's T3 test in the absence of normality.
Results
An expanded and diffuse ipsilateral projection in ephrin-A−/− mice
To investigate the organization of the ipsilateral retinocollicular projections in ephrin-A−/− mice, we used retrograde and anterograde tracing to reveal the distribution of contralaterally and ipsilaterally projecting RGCs and the extent and segregation of their terminals within the SC.
RGC distribution
Retinal area and the number and distribution of contralaterally projecting RGCs were similar in WT and ephrin-A−/− mice (Table 1). RCG distribution was uniform across the four retinal quadrants with a density of ∼3000 cells/mm2. There was a trend for increased RCG densities in ventral compared with dorsal retina as previously reported (data not shown) (Dräger and Olsen, 1980; Godement et al., 1984).
Table 1.
Contralateral retinal projections
| WT (n = 5) | ephrin-A2−/− (n = 6) | ephrin-A2/A5−/− (n = 4) | |
|---|---|---|---|
| Retina | |||
| Retinal area (mm2) | 16.05 ± 0.16 | 15.79 ± 0.46 | 15.39 ± 0.25 |
| RGC density (per mm2) | 3373 ± 32 | 3640 ± 82 | 3477 ± 58 |
| RGC number | 54,198 ± 1216 | 56,053 ± 787 | 54,113 ± 110 |
| Superior colliculus | |||
| Length SC (mm) | 1783.33 ± 0.06 | 2.016 ± 0.03* | 1.975 ± 0.03* |
| Volume of contralateral terminals (×10−6 mm3) | 401.06 ± 15.44 | 578.44 ± 8.69* | 565.87 ± 15.88* |
Values are means for each genotype ± SEM are shown.
*p < 0.05; values are significantly different compared with WT.
In contrast, there were significant differences in the distribution of ipsilaterally projecting RGCs in ephrin-A−/− compared with WT mice. In all mice, ipsilaterally projecting RGCs were restricted to a temporoventral crescent within the retina (Fig. 1A) (Dräger, 1985); however, the area was significantly larger in ephrin-A2−/− and ephrin-A2/A5−/− mice compared with WT (Fig. 1A, Table 2). Cell densities were higher in the peripheral compared with central retina as described previously (Dräger, 1985) and in the periphery were consistently higher in ephrin-A−/− mice compared with WT (Fig. 1A). Thus, the total number of ipsilaterally projecting RGCs was significantly increased in ephrin-A2−/− and ephrin-A2/A5−/− (Table 2).
Figure 1.
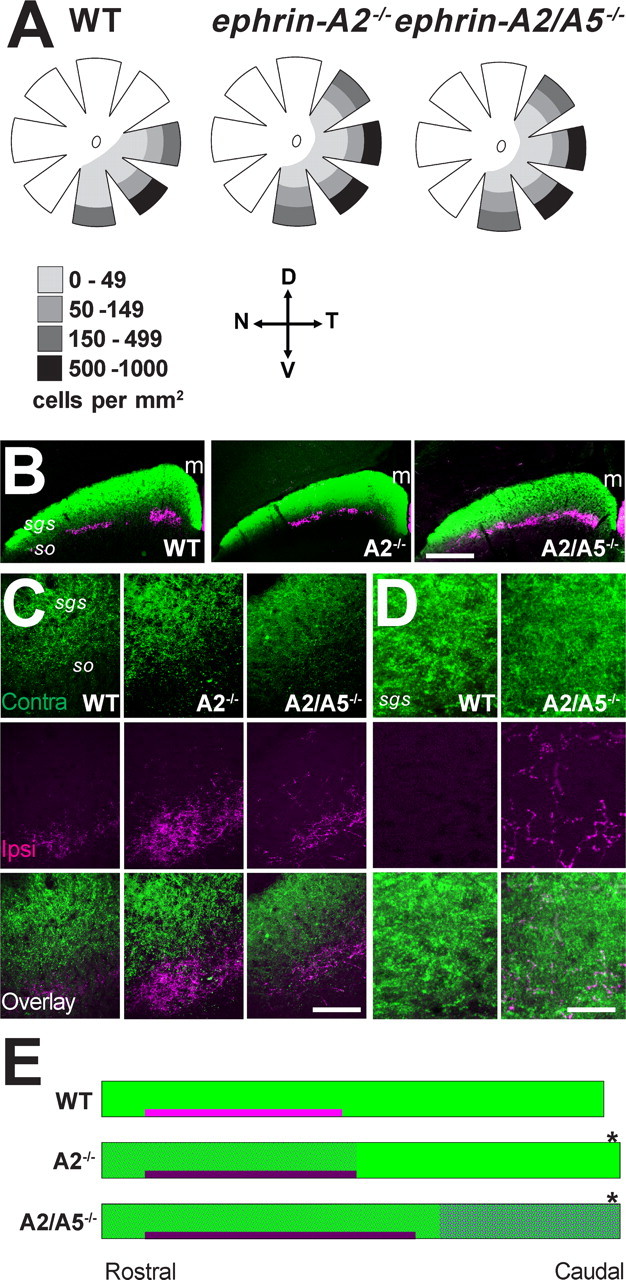
Anatomy of bilateral retinocollicular projections in ephrin-A−/− mice. A, Diagrams of retinal wholemounts retrogradely labeled with fluorogold to characterize the ipsilateral projection. Data are taken from Tables 1 and 2. Ipsilaterally projecting RGCs are distributed within a ventrotemporal crescent and are more densely packed in peripheral compared with central retina. In ephrin-A−/− mice the distribution of the ipsilaterally projecting RCGs extended into the dorso-lateral retina. Legend shows the density of cells per 1 mm2. D, Dorsal retina; V, ventral retina; T, temporal retina; N, nasal retina. B–D, Coronal sections of the rostral SC showing anterogradely labeled axon terminals of contralateral (green) and ipsilateral (magenta) retina projections to the SC. m, Midline. Sections containing the highest density of ipsilateral terminals are shown at low (B) and high (C) magnification. D, Caudal-most section of the SC, note diffuse ipsilateral projections in ephrin-A2/A5−/− mice. Scale bars: B, 500 μm; C, 100 μm; D, 50 μm. E, A schematic diagram representing the rostrocaudal extent (left to right) of the superficial layers of the SC. Data from Tables 1 and 2 were used to create the diagram. The green bar represents terminals from the contralateral eye and the magenta bar, the more deeply placed terminations of ipsilateral RCGs. The darker shade of magenta in ephrin-A−/− mice reflects the more dense projections. Magenta shading in ephrin-A−/− SCs represents the distribution and density of diffuse ipsilateral terminals illustrated in C and quantified in Table 2. Note the total length of the SC is greater in ephrin-A−/− mice (asterisk) and the rostrocaudal extent of the SC occupied by ipsilateral terminals is extended in ephrin-A2/A5−/− mice.
Table 2.
Ipsilateral retinal projections
| WT (n = 5) | ephrin-A2−/− (n = 6) | ephrin-A2/A5−/− (n = 4) | |
|---|---|---|---|
| Retina | |||
| Area occupied by ipsilateral RGCs (mm2) | 3.16 ± 0.07 | 3.85 ± 0.11* | 4.18 ± 0.25* |
| RCG density (per mm2) | 244 ± 17 | 262 ± 13 | 243 ± 21 |
| Number ipsilateral RCGs | 734 ± 44 | 994 ± 64* | 1005 ± 48* |
| Percentage of ipsilateral RGCs in total RGC population | 1.39 ± 0.09 | 1.71 ± 0.11 | 1.93 ± 0.12* |
| Superior colliculus | |||
| Caudal limit of dense projection (% of SC length) | 46.42 ± 1.49 | 51.54 ± 0.69 | 55.61 ± 1.07* |
| Volume of ipsilateral terminals (×10−6 mm3) | 9.83 ± 0.11 | 7.76 ± 0.14 | 21.78 ± 0.16* |
| Density of ipsilateral terminals (% pixels) | |||
| Dense patches in deep sgs | 29.05 ± 11.5 | 57.53 ± 5.88* | 53.27 ± 7.81* |
| Diffuse terminals throughout sgs | |||
| Rostral | 0.27 ± 0.07 | 3.41 ± 1.76* | 3.27 ± 1.70* |
| Medial | 0.43 ± 0.25 | 2.41 ± 0.49* | 2.01 ± 0.34* |
| Caudal | 0.00 ± 0.00 | 0.00 ± 0.00 | 13.83 ± 2.91* |
Values are means ± SEM for each genotype. The density of ipsilateral terminals is shown for the dense patches of terminal clusters (appropriate distribution) as well as for the diffuse terminals observed in ephrin-A−/− mice (inappropriate distribution). The density of diffuse terminals is shown separately for the rostral, medial, and caudal SC. Values in rostral and medial SC in WT are not significantly above background.
*Values are significantly different compared with WT.
RGC terminal distribution
Within the SC, contralateral terminal labeling was dense and continuous in the sgs in all mice (Fig. 1B–D). However, the rostrocaudal length of the SC was significantly increased in ephrin-A2−/− and ephrin-A2/A5−/− compared with WT mice (Table 1, Fig. 1E). Ipsilaterally projecting terminals in WT mice were as described previously (Godement et al., 1984), with small dense patches rostrally, located deep to the contralateral input (Fig. 1B–D). Labeled terminals were not detected outside the patches within the superficial retinorecipient layers, or within the caudal half of the SC (Table 1, Fig. 1C,D), A small cluster of ipsilateral terminals was detected at the caudal SC tip as described previously (Lund and Lund, 1976). In ephrin-A2−/− mice, the patches of ipsilaterally labeled terminals were significantly denser than in WT (Table 2, Fig. 1B,C,E), although volumetric analysis did not reveal a significant increase of their terminal fields (Table 2). In addition, inappropriate diffuse and sparse labeled terminals were detected in the stratum opticum and sgs throughout the rostral half of the SC, but did not extend past the mid-SC into caudal regions (Table 2, Fig. 1C–E). These diffuse terminals did not display any lamination or foci within the sgs and are not included in the volumetric analyses shown in Table 2. In ephrin-A2/A5−/− mice, the patches of ipsilaterally labeled terminals were significantly larger than in WT and ephrin-A2−/− mice (Table 2, Fig. 1B,C,E) and extended caudally beyond the mid-SC (Table 2, Fig. 1E). There was also inappropriate diffuse labeling in ephrin-A2/A5−/− mice that was more prominent than in ephrin-A2−/− mice but still lacked any laminar organization. Diffuse labeling was detected in the stratum opticum and sgs throughout the entire rostrocaudal extent of the SC, most prominently in caudal SC (Table 2, Fig. 1C–E).
Functional retinocollicular maps are disordered with binocular discordance in ephrin-A−/− mice
To identify the functional output of these normal and abnormal retinocollicular projections, we used multiunit electrophysiological recording of both contralateral and ipsilateral projections (Dräger and Hubel, 1976).
Contralateral
Robust visually evoked responses to both on and off stimuli were reliably elicited in the contralateral SC in WT and ephrin-A−/− mice (Fig. 2A). Topography was ordered in all WT mice (Dräger and Hubel, 1976), but significantly disordered in ephrin-A−/− mice (compared with WT, ephrin-A2−/−, p = 0.016; ephrin-A2/A5−/−, p = 0.0021) (Fig. 2B,C). However, there was no significant difference in the amount of disorder between knock-out genotypes (p > 0.05) (Fig. 2C). When order within the horizontal and vertical axes of the visual field were examined separately, significant disorder was observed only in the horizontal axis (Fig. 2C). Receptive fields were significantly enlarged in all ephrin-A−/− mice compared with WT (ephrin-A2−/−, p = 0.0037; ephrin-A2/A5−/−, p = 0.0091) (Fig. 2B,C) and were sometimes irregularly shaped, suggesting overlapping and larger less-accurate RGC terminal arbors (Fig. 2C). In all of the ephrin-A−/− but none of the WT mice, a small number of SC points received input from more than one visual field location (multiple points) (Fig. 2B,C). The mean percentage of multiple points was variable between animals (mean ± SEM, ephrin-A2−/−, 20.78 ± 6.48; ephrin-A2/A5−/−, 18.85 ± 3.99), but with no significant differences between genotypes (p > 0.05) (Fig. 2B,C). Most of the inappropriate supernumerary points were recorded from caudal SC and responded to stimuli in nasal visual field (corresponding to temporal retina, which normally projects rostrally) (Fig. 2B).
Figure 2.

Functional topography of the contralateral retinocollicular projection. A, Traces showing typical multiunit responses to lights-on and lights-off recorded from the superficial contralateral SC of WT and ephrin-A−/− mice. i–iii, Responses from topographically appropriate locations in WT (i), ephrin-A2−/−, (ii) and ephrin-A2/A5−/− mice (iii). iv, Response from a topographically inappropriate location in an ephrin-A2/A5−/− mouse (point 3b in the ephrin-A2/A5−/− map in B). B, The representation of the contralateral visual field in the SC of WT and ephrin-A−/− mice. Diagrams are representative maps recorded from a single animal. The visual field is viewed as if facing the mouse and the projection of the optic disc (asterisk) was at the center (the intersection of the vertical and horizontal axes). Meridians and parallels are shown at 30° intervals. D, Dorsal visual field; V, ventral visual field; T, temporal visual field; N, nasal visual field. Filled squares represent the center of visual fields recorded via the contralateral eye. In ephrin-A−/− mice, some SC locations received input from more than one receptive field. The strongest input is represented by a filled square. The weaker inputs are represented by hollow squares and are identified by a number and letter to denote the relative strength (B > C). The locations of the corresponding electrode penetrations in the SC are shown as an inset below and to the left of each map. Locations that received a single input are shown by filled diamonds, whereas those with multiple inputs are represented by hollow diamonds. SC locations are plotted from stereotaxic coordinates and are shown in relation to the borders of the SC, and the predicted location of the optic disc (asterisk). M, Medial; L, lateral; R, rostral; C, caudal. Receptive fields and SC locations are joined by colored lines to facilitate qualitative assessment of topographic order. When multiple receptive fields are present, the most topographically appropriate input is included in the rows regardless of strength. Note that the topographically appropriate point, when present, does not always elicit the strongest response (e.g., ephrin-A2−/−, point 1; ephrin-A2/A5−/−, point 11). C, Histograms showing quantitative analysis of topographic maps, averaged for three to six animals per genotype. The amount of disorder was analyzed for each map as a whole (overall values) and for the nasotemporal retinal/rostrocaudal SC and dorsoventral retinal/mediolateral SC axes separately. Overall disorder represents the absolute distance between the predicted location of a visual field point (based on the SC location) and its actual location (overall values). Axis-specific measurements assess only the differences in that axis. High values represent high disorder. Receptive field size was averaged for all points recorded in each animal, and then averaged between animals to obtain the graphed value. The “overall” value represents the angle in visual space that would be occupied by a circle of the same area as the receptive field. The nasotemporal retinal/rostrocaudal SC and dorsoventral retinal/mediolateral SC measurements show the average RF span for each axis. The number of multiple points is expressed as a percentage of the total points recorded from each animal in that group. Error bars indicate SEM. Significant differences compared with WT are shown with an asterisk.
Ipsilateral
As described previously for WT mice and rats (Dräger and Hubel, 1976; Diao et al., 1983), ipsilateral responses were obtained only within rostromedial SC for all ephrin-A−/− mice. Responses were of smaller amplitude compared with contralateral ones and were more reliable to lights-off than lights-on stimulation (Fig. 3A–C). Although we could consistently record responses elicited by a light flash to the whole eye, only a subset of these were successfully mapped to a defined point in visual space (Fig. 3D–F). In WT and ephrin-A2−/− mice, ipsilateral responses were elicited from most areas of the binocular field, with the strongest and most reliable responses coming from 15 to 20° contralateral to the midline, as reported previously in the rat (Fig. 3D,E) (Diao et al., 1983). Ipsilateral and contralateral maps were in alignment in WT (Fig. 3D) but showed minor discrepancies in ephrin-A2−/− mice (Fig. 3E, point 10). In contrast, in ephrin-A2/A5−/− mice, ipsilateral responses were less reliable and could not be elicited from all areas of the binocular field (Fig. 3F). Furthermore, the visual field locations of ipsilateral responses were not in alignment with the contralateral ones, although their organization was not consistently reversed or rotated. We also detected one SC location which received input from two distinct visual field locations for both the ipsilateral and contralateral eye (point 18) (Fig. 3F).
Figure 3.
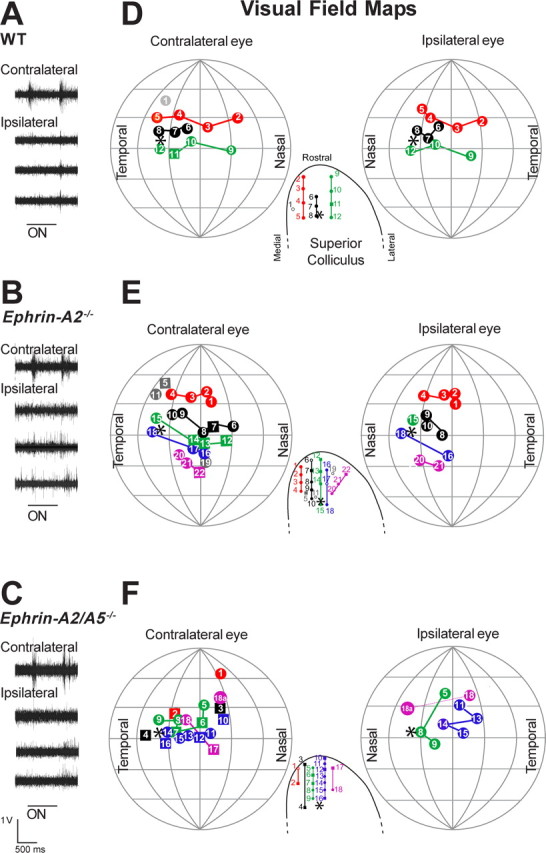
Functional topography of the ipsilateral retinocollicular projection. A–C, Traces showing typical multiunit responses to lights-on and lights-off recorded from the superficial rostral ipsilateral SC of WT (A), ephrin-A2−/− (B) and ephrin-A2/A5−/− (C) mice. D–F, Representation of the frontal visual field in the SC of WT and ephrin-A−/− mice. Diagrams show composite maps recorded from three animals per genotype. To allow comparison between animals, receptive fields of individual mice were translated to bring the optic disk of each eye to a standard position of 40° lateral and 0° vertical. The lateral translation enabled the binocular fields of both eyes to be optimally represented across the full extent of the projection sphere. The organization of receptive fields is shown separately for each eye with contralateral on the left and ipsilateral on the right. For both, the field coordinate system is as in Figure 1, but the mouse was oriented with the nose pointing directly at the center of the hemisphere to map the frontal visual field. Meridians and parallels are shown at 30° intervals. D, Dorsal visual field; V, ventral visual field; T, temporal visual field; N, nasal visual field. Insets representing the SC are the same as in Figure 1 but enlarged to represent the rostral region. The optic disc and its projection are indicated by an asterisk. Receptive fields and SC locations are joined by colored lines to facilitate qualitative assessment of topographic order. Electrode penetrations that fell outside of a row are in gray. Individual receptive fields are numbered to show the relative locations of contralateral and ipsilateral fields, and to allow identification of the corresponding electrode penetration in the SC. Solid squares represent receptive fields that were purely contralateral. Solid circles with the same number represent contralateral and ipsilateral responses recorded from the same SC penetration, but at different depths (see Materials and Methods). Empty circles in the SC represent electrode penetrations from which an ipsilateral response was recorded, but could not be accurately mapped because of the weakness of the response, or habituation. A secondary receptive field was detected in one ephrin-A2/A5−/− mouse (point 18). Secondary fields were present in both contralateral and ipsilateral projections and are indicated by the letter “a” and joined to the stronger point by a dotted line.
Ephrin-A−/− mice have reduced optomotor function that is rescued by monocular occlusion
Given that retinocollicular topography is abnormal and that binocular coherence is reduced or lost in ephrin-A −/− mice, we tested for behavioral sequelae of these abnormalities.
Visual placing response
WT, ephrin-A2−/− and ephrin-A2/A5−/− mice (n = 8–10 per genotype) displayed a normal visual placing response (a score of 2 for all animals) (data not shown), indicating that animals were not blind and additional visual testing could be performed.
Pupil reflex
Pupillary constriction in response to increased illumination of the retina is a reflex mediated by retinal projections to the pretectum and does not require learning or topography (Sefton et al., 2004). Accordingly, pupil responses to lights-on and lights-off were not significantly different in ephrin-A−/− mice compared with WT (Fig. 4A). Maximal constriction (∼10% of total iris area) and dilatation (55% of total iris area) were reached, respectively, within 2 s (on) and 6 s (off) of the onset of the stimulus (Fig. 4A).
Figure 4.

Visually evoked behavior. A, Pupillary response to lights on and off stimuli in WT, ephrin-A2−/−, and ephrin-A2/A5−/− mice. Light stimulus was given at time 0. Complete pupil constriction and dilatation occurred within 5–6 s for all genotypes. B, Visual acuity in WT, ephrin-A2−/−, and ephrin-A2/A5−/− mice shown as the percentage (mean ± SEM) of correct choices in the Y-shaped maze. The x-axis shows the spatial frequencies (cycles per degree) tested. All mice performed to criterion (70%) up to the spatial frequency of 0.51 cpd, when performance dropped to ∼50% (performance at 0.44 cpd compared with 0.51 cpd: WT, p < 0.0001; ephrin-A2−/−, p = 0.0001; ephrin-A2/A5, p = 0.0008). There were no significant differences between genotypes for the limit of visual acuity (p > 0.05). C, Histograms showing head tracking response (mean ± SEM) of control (WT), ephrin-A2−/−, and double ephrin-A2/A5−/− mice in an optokinetic drum rotating at 2 rpm. The x-axis shows the spatial frequencies (cycyles per degree) tested. Under light conditions (1000 lux), significant differences were observed between genotypes: knock-out genotypes displayed significantly fewer tracking movements compared with WT at all spatial frequencies except 0.52 cpd. *Significant differences (p < 0.05) compared with WT. Ephrin-A2−/− mice were also significantly more responsive than ephrin-A2/A5−/−. In reduced light conditions (300 lux), when all mice had suboptimal visual conditions, the number of tracking movements was significantly reduced compared with light conditions in WT at all spatial frequencies and in ephrin-A2−/− mice at 0.03 and 0.13 cpd. #Significant differences (p < 0.05) compared with light conditions. In contrast, responses in ephrin-A2/A5−/− mice were similar under dim and bright light conditions (p > 0.05). Monocular tracking responses at 0.13 cpd in light conditions were normal for WT mice, but ephrin-A−/− mice made significantly more tracking movements than their binocular counterparts so that they were no longer different from WT controls. ∼Significant differences between monocular and binocular responses of the same genotype (intact).
Visual acuity
Our electrophysiological experiments revealed that SC neurons in ephrin-A−/− mice had increased receptive field sizes compared with WT. Increased receptive field size reduces the precision of the topographic projection, compromising the resolving power of the visual system (Northmore and Celenza, 1992). We therefore assessed discrimination between vertical stripes and solid gray patterns (data not shown) and between horizontal and vertical stripes (Fig. 4B). Visual acuity was identical in all mice for both tasks and was estimated to be between 0.44 and 0.51 cpd (Fig. 4B).
Visuomotor response
Because our data revealed significant abnormalities in topography and laterality of retinocollicular projections, we assessed visuomotor behavior, which is thought to be mediated within the SC and requires topographic input from both eyes to integrate visual input and motor output (Schneider, 1969; Balkema et al., 1981). We measured head tracking responses to moving stimuli using an optokinetic drum (Jellali et al., 2005). Neither gender nor direction of drum rotation affected the number or duration of head tracking movements at any spatial frequency; consequently, results were averaged for direction and genders pooled. ANOVA showed that at spatial frequencies 0.03, 0.13, and 0.26 cpd there was a significant effect of genotype (F(3,31) = 20.7; p = 0.000) with WT mice making more tracking movements than ephrin-A2−/− (p < 0.05 for all spatial frequencies) and both WT and ephrin-A2−/− mice making more movements than ephrin-A2/A5−/− mice (p < 0.05) (Fig. 4C). In contrast, there were no differences between genotype for the highest spatial frequency that elicited any response (0.52 cpd, narrow stripe), as performance declined significantly in all genotypes (p < 0.01) to <2.5 tracking movements in 2 min. No responses were observed at 1.25 cpd for any genotype (data not shown). These data are consistent with the limit of visual acuity between 0.5 and 0.6 cpd (Prusky et al., 2000).
To clarify whether impaired optomotor responses in knock-out animals were associated with visual disability, or might be caused by abnormal motor output, we repeated the optomotor tests in reduced light conditions, when all mice had suboptimal visual conditions and responses should be correspondingly decreased. In WT mice, the number of tracking movements at each frequency was significantly lower under dark compared with light conditions (0.03 and 0.26 cpd, p < 0.001; 0.13 and 0.52 cpd, p < 0.01) (Fig. 4C). In contrast, ephrin-A2−/− mice were only affected at the lower frequencies (wider stripes, 0.03 cpd, p < 0.01; 0.13 cpd, p < 0.001) (Fig. 4C) and ephrin-A2/A5−/− made the same number of tracking movements at all stripe widths, but remained worse than WT mice at the lower frequencies (0.03 and 0.13 cpd, p < 0.05) (Fig. 4C).
To further determine whether the incoherent binocular input was responsible for the deficit in optomotor response, we sutured one eyelid shut and evaluated monocularly elicited tracking movements in response to 0.13 cpd under light conditions (the spatial frequency and level of illumination at which we observed the most difference between genotypes). In WT mice, occluding one eye had no effect on the number of tracking movements compared with intact mice. In contrast, in ephrin-A2−/− and ephrin-A2/A5−/− mice, occluding one eye resulted in a significantly increased number of tracking movements compared with intact ephrin-A−/− mice (p < 0.05) (Fig. 4C), restoring normal tracking behavior (Figs. 4C, 5).
Figure 5.

Summary diagram. Diagrammatic representation of the relationship between the ipsilateral and contralateral retinal projections, and the resulting representation of visual field information in WT (left) and ephrin-A−/− mice. Letters represent visual field information and numbers represent RGCs within the retina and their terminations within the SC. In WT mice, the ipsilateral and contralateral retinal axons (numbers) project in reverse orientation relative to each other within the SC, providing a continuous representation of the binocular visual field (letters). In contrast, in mice lacking ephrin-A2 and ephrin-A5, the contralateral and ipsilateral projections are disordered within themselves and relative to each other: the contralateral projection retains gross topographic order, but shows some errors and the presence of weaker multiple projections (small numbers) (Feldheim et al., 2000; present study). The ipsilateral projection is also disordered with duplicated projections. The functional representation of the visual field within the SC is thus incorrect with contralateral and ipsilateral input no longer aligned (different letters at the same SC location) and duplicated information (small letters).
Discussion
Ephrin-As in ipsilateral retinocollicular topography
The discrepancy between visual information originating from each retina requires differential orientation of retinal projections to integrate ipsilateral and contralateral visual information within the SC. Thus, the ipsilateral projection is reversed across its nasotemporal axis with respect to input from the contralateral eye: far temporal axons project more caudally than midtemporal ones. The ability of ipsilateral axons to assume this reversed topography raises the question of how the same SC molecular guidance cues direct ipsilateral and contralateral RGC axons.
In ephrin-A−/− mice, the ipsilateral retinocollicular projection displayed similar patterns of projection errors to the contralateral one: more diffuse with inappropriate terminations mainly located outside of rostral SC and these were more prominent in double compared with single knock-out mice (Frisen et al., 1998; Feldheim et al., 2000). The ectopic projections may reflect a reduction in repulsive cues, allowing increased searching within the SC (Feldheim et al., 2000), and/or less pressure on temporal axons to withdraw to rostral SC during early postnatal development (Land and Lund, 1979). Thus, inappropriate terminations in ephrin-A−/− mice may represent unpruned branches of axons that terminate in an appropriate location in the same or opposite SC (Nicol et al., 2006, 2007), or even in a different visual brain region (Kondo et al., 1993). Such aberrant branching has been described in the hamster geniculocortical projection after enucleation (Trevelyan et al., 2007).
Alternatively, the greater volume and diffuse distribution of ipsilateral terminations in the SC may be a consequence of the higher number of ipsilaterally projecting RGCs. In addition, the retinal distribution of these cells extended centrally and dorsally, which may aggravate guidance errors. Mechanisms for the increased number of ipsilaterally projecting RGCs remain unclear. The increase was small and was restricted to temporal retina, which projects to rostral SC; both regions express low levels of ephrin-A (McLaughlin and O'Leary, 2005), arguing against a direct effect of ephrin-As in regulating cell death and/or proliferation, as recently described in cortex (Depaepe et al., 2005). In addition, the restriction of ipsilaterally projecting RGCs to a temporal crescent and no evidence for abnormal chiasm choice (Feldheim et al., 2000), argues against a developmental switch from a contralateral to ipsilateral phenotype. An alternative possibility is that the attenuation of repulsive cues in ephrin-A−/− mice may reduce RGC axon competition for terminal space within the SC, reducing developmental cell death (Fawcett et al., 1984; Godement et al., 1984).
In addition to diffuse inappropriate terminations within each projection, the absence of ephrin-As results in a lack of concordance between ipsilateral and contralateral input. Previous studies have suggested that the ipsilateral projection uses the convergent contralateral projection as a topographic template (Land and Lund, 1979; Reese, 1986). When this template is removed by monocular enucleation, ipsilateral RGC axons establish an inappropriate “mirror image” topography that is consistent with a normal response to SC guidance cues: far temporal axons project more rostrally than midtemporal ones (Land and Lund, 1979; Reese, 1986). However, the lack of alignment between contralateral and ipsilateral projections, rather than convergent disorganization imposed by the crossed path, suggests that in the absence of ephrin-As, ipsilateral RGC axons can no longer “read” their template. Because ephrin-A5 promotes axon–axon interactions (Caras, 1997), the misalignment of the ipsilateral and contralateral projections in ephrin-A2/A5−/− mice, with only minimal disruption in ephrin-A2−/− mice, is consistent with this hypothesis.
The role of axon–axon interactions in aligning convergent projections highlights the importance of other topographically ordered visual projections that terminate within the SC, including the corticotectal and parabigeminal ones (Sefton et al., 2004). The role of ephrin-As in ordering these projections has not been investigated and their possible disruption in ephrin-A−/− mice may further contribute to disorder within and between retinal inputs (Withington and McCrossan, 1996; Tu et al., 2000; Rodger et al., 2005b).
Differences between anatomy and physiology: role of activity
Within the contralateral projection, functional topography is similar in ephrin-A2−/− and ephrin-A2/A5−/− genotypes and, if multiple points are excluded, it is essentially normal in all ephrin-A−/− mice. Thus, the functional topography observed here contrasts with anatomical topography in ephrin-A−/− mice, which becomes more disordered as additional ephrin-A genes are knocked out (Pfeiffenberger et al., 2006). This discrepancy between anatomical and functional topography is also observed in the visual cortex of ephrin-A−/− mice (Cang et al., 2008), which implies that even in the absence of ephrin-As, retinal projections can be topographically refined by neuronal activity. Although inappropriate terminals remain, the majority of these become “silent” physiologically (Kaas and Guillery, 1973; Huberman et al., 2002).
The important role of neuronal activity in refining abnormal retinocollicular projections is illustrated in ephrin-A2/A5−/− mice that additionally lack the β2 subunit of the nicotinic acetylcholine receptor and, thus, spontaneous retinal activity during development (ephrin-A2/A5/β2 triple knock-out) (Pfeiffenberger et al., 2005, 2006). In these triple knock-out animals, in contrast to some topographic organization in our double knock-out ephrin-A2/A5−/− mice (Feldheim et al., 2000), the contralateral retinocollicular projection was completely disordered, suggesting that activity-dependent refinement compensates for the absence of normal guidance cues. The remaining functional disorder in ephrin-A2/A5−/− mice may thus represent the maximal accuracy that can be reached when neuronal activity, both spontaneous and visually driven, is the major remaining mechanism responsible for refining topography.
In contrast to the contralateral projection, the functional disorder of the ipsilateral projection increases as additional ephrin-As are knocked out. A possible explanation is that the two projections undergo different amounts of activity-dependent refinement. The strength of activity-dependent refinement has been shown to depend on the density of the projection (Lund and Lund, 1976; Land and Lund, 1979). The process requires spatially and chronologically correlated electrical activity and is thus optimal in a densely packed cell population such as contralaterally projecting RGCs. In contrast, greater distances between RCG somata, e.g., between ipsilaterally projecting RGCs, reduce temporospatial electrical synchrony and, thus, the impact of activity-dependent processes so that, at the extreme, a single-neuron projection with no activity-dependent competition has enlarged unpruned axon terminal fields (Gosse et al., 2008). Therefore, the lack of ephrin-As in our mice is likely to have a more severe impact on the ipsilateral compared with the contralateral projection because of weaker activity-dependent refinement. Nonetheless, most of the diffuse expanded ipsilateral projection in ephrin-A2/A5−/− mice was silent, reminiscent of hamster enucleation studies (Finlay et al., 1979). Although it is possible that visually evoked responses were present in our ephrin-A2/A5−/− mice, but below our detection threshold, it seems more likely that these terminals are too diffuse to generate sufficient postsynaptic activity to fire collicular neurons, and are therefore silent. However, their continued presence aligns with the hypothesis that both ephrin-As and neuronal activity are required for axon retraction (Nicol et al., 2006, 2007) but additionally suggests that ephrin-As may be required for the removal of functionally silent ectopic terminations.
Contralateral and ipsilateral SC input contributes to visuomotor behavior
Visuomotor responses require spatial and movement information from the retina to be transmitted topographically to the superficial layers of the SC (Dräger and Hubel, 1975, 1976; Sefton et al., 2004) and collicular outflow to motor centers (Isa and Sasaki, 2002). However, the rescue of visuomotor behavior when one eye was occluded removes motor dysfunction as the cause of abnormal responses in ephrin-A−/− mice. Moreover, normal pupil reflexes and visual acuity exclude abnormal responses to light and poor resolving power as confounding factors. Normal visual acuity in ephrin-A−/− mice was consistent with its dependence on the retino-geniculo-cortical pathway (Schneider, 1969) and visual cortex (Sefton et al., 2004), which are less disordered than the retinocollicular pathway in these knock-out mice (Cang et al., 2005, 2008; Huberman et al., 2005). The crucial difference between the abnormal binocular and normal monocular visuomotor responses is activation (or not, respectively) of the incoherent input from the misaligned ipsilateral and contralateral projections. Because mismatch of eye-specific input may induce interocular suppression (Sherman, 1974; Leamey et al., 2007), occluding one eye presumably removes one incompatible source, and therefore suppression, allowing the remaining contralateral input to mediate normal optomotor responses. The result is consistent with studies showing impaired visuomotor behavior in albino mice which have reduced ipsilateral projections (Balkema et al., 1981), and in rabbits when the anterior visual field is masked (Collewijn et al., 1978).
Conclusions
In conclusion, our data indicate a role for ephrin-As in integrating topography of the contralateral and ipsilateral retinocollicular projections, suggesting that these repellent cues are crucial for correctly aligning binocular inputs within the SC and supporting vision. The mismatch between anatomical and functional retinocollicular topography highlights that topography can be refined by altering synaptic efficacy as well as by pruning extraneous connections. In addition, such refinement is less efficient in the ipsilateral projection despite RGCs in both eyes receiving similar visual stimuli and sharing retinal and SC guidance cues.
Footnotes
This work was supported by the Neurotrauma Research Program, a University of Western Australia (UWA) Small Grant to J.R., and a Western Australian Institute for Medical Research vacation scholarship to D.H. Ephrin-A knock-out mice were a generous gift from David Feldheim, were rederived by the Animal Resources Centre, Western Australia, and maintained by Helen Moulder and Simone Ross at the UWA Animal Care Unit. Confocal images were acquired at the Centre for Microscopy, Characterisation and Analysis, UWA. We thank Alan Harvey for his invaluable comments on various drafts of this manuscript, and Lyn Beazley for guidance and support throughout the project. We are grateful to Chris O'Brien and Ian Dadour for loan of the infrared light source and camera, and to Marissa Penrose for assistance with animal handling and software programming. The following students contributed to experimental procedures: Katherine Chuk, Celeste de Haas, Emily Polla, John Rowlands, Michelle Swann, and Charles Werren. J.R. and D.H. performed the electrophysiological recording. S.S.L., C.A.B., and J.R. studied the anatomy of retinocollicular projections. D.H., G.T.C., C.A.A., and J.R. tested visual behavior. S.A.D., C.A.A., R.M.S., and J.R. cosupervised the experiments. All authors contributed to the experimental design, data analysis, and appropriate sections of this manuscript. R.M.S. and J.R. performed the final data analysis and wrote this manuscript.
References
- Balkema GW, Jr, Pinto LH, Dräger UC, Vanable JW., Jr Characterisation of abnormalities in the visual system of the mutant mouse pearl. J Neurosci. 1981;1:1320–1329. doi: 10.1523/JNEUROSCI.01-11-01320.1981. [DOI] [PMC free article] [PubMed] [Google Scholar]
- Cang J, Kaneko M, Yamada J, Woods G, Stryker MP, Feldheim DA. Ephrin-As guide the formation of functional maps in the visual cortex. Neuron. 2005;48:577–589. doi: 10.1016/j.neuron.2005.10.026. [DOI] [PMC free article] [PubMed] [Google Scholar]
- Cang J, Niell CM, Liu X, Pfeiffenberger C, Feldheim DA, Stryker MP. Selective disruption of one Cartesian axis of cortical maps and receptive fields by deficiency in ephrin-As and structured activity. Neuron. 2008;57:511–523. doi: 10.1016/j.neuron.2007.12.025. [DOI] [PMC free article] [PubMed] [Google Scholar]
- Caras IW. A link between axon guidance and axon fasciculation suggested by studies of the tyrosine kinase receptor EphA5/REK7 and its ligand ephrin-A5/AL-1. Cell Tissue Res. 1997;290:261–264. doi: 10.1007/s004410050930. [DOI] [PubMed] [Google Scholar]
- Cheng HJ, Nakamoto M, Bergemann AD, Flanagan JG. Complementary gradients in expression and binding of ELF-1 and Mek4 in development of the topographic retinotectal projection map. Cell. 1995;82:371–381. doi: 10.1016/0092-8674(95)90426-3. [DOI] [PubMed] [Google Scholar]
- Cline H. Sperry and Hebb: oil and vinegar? Trends Neurosci. 2003;26:655–661. doi: 10.1016/j.tins.2003.10.005. [DOI] [PubMed] [Google Scholar]
- Collewijn H, Winterson BJ, Dubois MFW. Optokinetic eye movements in albino rabbits: inversion in anterior visual field. Science. 1978;199:1351–1353. doi: 10.1126/science.628845. [DOI] [PubMed] [Google Scholar]
- Crawley JN. Behavioral phenotyping of transgenic and knock-out mice: experimental design and evaluation of general health, sensory functions, motor abilities, and specific behavioral tests. Brain Res. 1999;18:18–26. doi: 10.1016/s0006-8993(98)01258-x. [DOI] [PubMed] [Google Scholar]
- Cui Q, Yip HK, Zhao RC, So KF, Harvey AR. Intraocular elevation of cyclic AMP potentiates ciliary neurotrophic factor-induced regeneration of adult rat retinal ganglion cell axons. Mol Cell Neurosci. 2003;22:49–61. doi: 10.1016/s1044-7431(02)00037-4. [DOI] [PubMed] [Google Scholar]
- Depaepe V, Suarez-Gonzalez N, Dufour A, Passante L, Gorski JA, Jones KR, Ledent C, Vanderhaeghen P. Ephrin signalling controls brain size by regulating apoptosis of neural progenitors. Nature. 2005;435:1244–1250. doi: 10.1038/nature03651. [DOI] [PubMed] [Google Scholar]
- Diao YC, Wang YK, Xiao YM. Representation of the binocular visual field in the superior colliculus of the albino rat. Exp Brain Res. 1983;52:67–72. doi: 10.1007/BF00237150. [DOI] [PubMed] [Google Scholar]
- Dräger U. Birth dates of retinal ganglion cells giving rise to the crossed and uncrossed optic projections in the mouse. Proc R Soc Lond B Biol Sci. 1985;224:57–77. doi: 10.1098/rspb.1985.0021. [DOI] [PubMed] [Google Scholar]
- Dräger U, Hubel D. Responses to visual stimulation and relationship between visual, auditory and somatosensory inputs in mouse superior colliculus. J Neurophysiol. 1975;38:690–713. doi: 10.1152/jn.1975.38.3.690. [DOI] [PubMed] [Google Scholar]
- Dräger U, Hubel D. Topography of visual and somatosensory projections to mouse superior coliculus. J Neurophysiol. 1976;39:91–101. doi: 10.1152/jn.1976.39.1.91. [DOI] [PubMed] [Google Scholar]
- Dräger UC, Olsen JF. Origins of crossed and uncrossed retinal projections in pigmented and albino mice. J Comp Neurol. 1980;191:383–412. doi: 10.1002/cne.901910306. [DOI] [PubMed] [Google Scholar]
- Fawcett JW, O'Leary DD, Cowan WM. Activity and the control of ganglion cell death in the rat retina. Proc Natl Acad Sci U S A. 1984;81:5589–5593. doi: 10.1073/pnas.81.17.5589. [DOI] [PMC free article] [PubMed] [Google Scholar]
- Feldheim DA, Kim YI, Bergemann AD, Frisén J, Barbacid M, Flanagan JG. Genetic analysis of ephrin-A2 and ephrin-A5 shows their requirement in multiple aspects of retinocollicular mapping. Neuron. 2000;25:563–574. doi: 10.1016/s0896-6273(00)81060-0. [DOI] [PubMed] [Google Scholar]
- Finlay BL, Wilson KG, Schneider GE. Anomalous ipsilateral retinotectal projections in syrian hamsters with early lesions: topography and functional capacity. J Comp Neurol. 1979;183:721–740. doi: 10.1002/cne.901830404. [DOI] [PubMed] [Google Scholar]
- Frisén J, Yates PA, McLaughlin T, Friedman GC, O'Leary DD, Barbacid M. Ephrin-A5 (AL-1/RAGS) is essential for proper retinal axon guidance and topographic mapping in the mammalian visual system. Neuron. 1998;20:235–243. doi: 10.1016/s0896-6273(00)80452-3. [DOI] [PubMed] [Google Scholar]
- Godement P, Salaün J, Imbert M. Prenatal and postnatal development of retinogeniculate and retinocollicular projections in the mouse. J Comp Neurol. 1984;230:552–575. doi: 10.1002/cne.902300406. [DOI] [PubMed] [Google Scholar]
- Gosse NJ, Nevin LM, Baier H. Retinotopic order in the absence of axon competition. Nature. 2008;452:892–895. doi: 10.1038/nature06816. [DOI] [PMC free article] [PubMed] [Google Scholar]
- Huberman AD, Stellwagen D, Chapman B. Decoupling eye-specific segregation from lamination in the lateral geniculate nucleus. J Neurosci. 2002;22:9419–9429. doi: 10.1523/JNEUROSCI.22-21-09419.2002. [DOI] [PMC free article] [PubMed] [Google Scholar]
- Huberman AD, Murray KD, Warland DK, Feldheim DA, Chapman B. Ephrin-As mediate targeting of eye-specific projections to the lateral geniculate nucleus. Nat Neurosci. 2005;8:1013–1021. doi: 10.1038/nn1505. [DOI] [PMC free article] [PubMed] [Google Scholar]
- Isa T, Sasaki S. Brainstem control of head movements during orienting: organisation of the premotor circuits. Prog Neurobiol. 2002;66:205–241. doi: 10.1016/s0301-0082(02)00006-0. [DOI] [PubMed] [Google Scholar]
- Jellali A, Hamid M, Abdel-Mouttalib O, Stéphane R, Raymond R, Johan A, José S, Pierre C, Serge P. The optomotor response: a robust first-line visual screening method for mice. Vision Res. 2005;45:1439–1446. doi: 10.1016/j.visres.2004.12.015. [DOI] [PubMed] [Google Scholar]
- Kaas JH, Guillery RW. The transfer of abnormal visual field representations from lateral geniculate nucleus to the visual cortex in siamese cats. Brain Res. 1973;59:61–95. doi: 10.1016/0006-8993(73)90253-9. [DOI] [PubMed] [Google Scholar]
- King CE, Rodger J, Bartlett C, Esmaili T, Dunlop SA, Beazley LD. Erythropoietin is both neuroprotective and neuroregenerative following optic nerve transection. Exp Neurol. 2007;205:48–55. doi: 10.1016/j.expneurol.2007.01.017. [DOI] [PubMed] [Google Scholar]
- Kondo Y, Takada M, Honda Y, Mizuno N. Bilateral projections of single retinal ganglion cells to the lateral geniculate nuclei and superior colliculi in albino rat. Brain Res. 1993;608:204–215. doi: 10.1016/0006-8993(93)91460-a. [DOI] [PubMed] [Google Scholar]
- Land PW, Lund RD. Development of the rat's uncrossed retinotectal pathway and its relation to plasticity studies. Science. 1979;205:698–700. doi: 10.1126/science.462177. [DOI] [PubMed] [Google Scholar]
- Leamey CA, Merlin S, Lattouf P, Sawatari A, Zhou X, Demel N, Glendining KA, Oohashi T, Sur M, Fässler R. Ten_m3 regulates eye-specific patterning in the mammalian visual pathway and is required for binocular vision. PLoS Biol. 2007;5:e241. doi: 10.1371/journal.pbio.0050241. [DOI] [PMC free article] [PubMed] [Google Scholar]
- Lund RD. Development and plasticity of the brain. New York: Oxford UP; 1978. The correlation of maps in the brain; pp. 222–249. [Google Scholar]
- Lund RD, Lund JS. Plasticity in the developing visual system: the effects of retinal lesions made in young animals. J Comp Neurol. 1976;169:133–154. doi: 10.1002/cne.901690202. [DOI] [PubMed] [Google Scholar]
- McLaughlin T, O'Leary DD. Molecular gradients and development of retinotopic maps. Annu Rev Neurosci. 2005;28:327–355. doi: 10.1146/annurev.neuro.28.061604.135714. [DOI] [PubMed] [Google Scholar]
- McLaughlin T, Torborg CL, Feller MB, O'Leary DD. Retinotopic map refinement requires spontaneous retinal waves during a brief critical period of development. Neuron. 2003;40:1147–1160. doi: 10.1016/s0896-6273(03)00790-6. [DOI] [PubMed] [Google Scholar]
- Nicol X, Muzerelle A, Rio JP, Métin C, Gaspar P. Requirement of Adenylate Cyclase 1 for the ephrin-A5-dependent retraction of exuberant retinal axons. J Neurosci. 2006;26:862–872. doi: 10.1523/JNEUROSCI.3385-05.2006. [DOI] [PMC free article] [PubMed] [Google Scholar]
- Nicol X, Voyatzis S, Muzerelle A, Narboux-Nême N, Südhof TC, Miles R, Gaspar P. cAMP oscillations and retinal activity are permissive for ephrin signalling during the establishment of the retinotopic map. Nat Neurosci. 2007;10:340–347. doi: 10.1038/nn1842. [DOI] [PubMed] [Google Scholar]
- Northmore DP, Celenza MA. Recovery of contrast sensitivity during optic nerve regeneration in fish. Exp Neurol. 1992;115:69–72. doi: 10.1016/0014-4886(92)90224-e. [DOI] [PubMed] [Google Scholar]
- Pfeiffenberger C, Cutforth T, Woods G, Yamada J, Rentería RC, Copenhagen DR, Flanagan JG, Feldheim DA. Ephrin-As and neural activity are required for eye-specific patterning during retinogeniculate mapping. Nat Neurosci. 2005;8:1022–1027. doi: 10.1038/nn1508. [DOI] [PMC free article] [PubMed] [Google Scholar]
- Pfeiffenberger C, Yamada J, Feldheim DA. Ephrin-As and patterned retinal activity act together in the development of topographic maps in the primary visual system. J Neurosci. 2006;26:12873–12884. doi: 10.1523/JNEUROSCI.3595-06.2006. [DOI] [PMC free article] [PubMed] [Google Scholar]
- Prusky GT, West PW, Douglas RM. Behavioral assessment of visual acuity in mice and rats. Vision Res. 2000;40:2201–2209. doi: 10.1016/s0042-6989(00)00081-x. [DOI] [PubMed] [Google Scholar]
- Reese BE. The topography of expanded uncrossed retinal projections following neonatal enucleation of one eye: differing effects in dorsal lateral geniculate nucleus and superior colliculus. J Comp Neurol. 1986;250:8–32. doi: 10.1002/cne.902500103. [DOI] [PubMed] [Google Scholar]
- Rodger J, Goto H, Cui Q, Chen PB, Harvey AR. cAMP regulates axon outgrowth and guidance during optic nerve regeneration in goldfish. Mol Cell Neurosci. 2005a;30:452–464. doi: 10.1016/j.mcn.2005.08.009. [DOI] [PubMed] [Google Scholar]
- Rodger J, Symonds AC, Springbett J, Shen WY, Bartlett CA, Rakoczy PE, Beazley LD, Dunlop SA. Eph/ephrin expression in the adult rat visual system following localized retinal lesions: localized and transneuronal up-regulation in the retina and superior colliculus. Eur J Neurosci. 2005b;22:1840–1852. doi: 10.1111/j.1460-9568.2005.04381.x. [DOI] [PubMed] [Google Scholar]
- Sauvé Y, Sawai H, Rasminsky M. Topological specificity in reinnervation of the superior colliculus by regenerated retinal ganglion cell axons in adult hamsters. J Neurosci. 2001;21:951–960. doi: 10.1523/JNEUROSCI.21-03-00951.2001. [DOI] [PMC free article] [PubMed] [Google Scholar]
- Schneider GE. Two visual systems. Science. 1969;163:895–902. doi: 10.1126/science.163.3870.895. [DOI] [PubMed] [Google Scholar]
- Sefton AJ, Dreher B, Harvey A. Visual system. In: Paxinos G, editor. The rat nervous system. San Diego: Elsevier; 2004. pp. 1083–1165. [Google Scholar]
- Sherman SM. Monocularly deprived cats: improvement of the deprived eye's vision by visual decortication. Science. 1974;186:267–269. doi: 10.1126/science.186.4160.267. [DOI] [PubMed] [Google Scholar]
- Thivierge JP, Marcus G. The topographic brain: from neural connectivity to cognition. Trends Neurosci. 2007;30:251–259. doi: 10.1016/j.tins.2007.04.004. [DOI] [PubMed] [Google Scholar]
- Trevelyan AJ, Upton AL, Cordery PM, Thompson ID. An experimentally induced duplication of retinotopic mapping within the hamster primary visual cortex. Eur J Neurosci. 2007;26:3277–3290. doi: 10.1111/j.1460-9568.2007.05941.x. [DOI] [PubMed] [Google Scholar]
- Tu S, Butt CM, Pauly JR, Debski EA. Activity-dependent regulation of substance P expression and topographic map maintenance by a cholinergic pathway. J Neurosci. 2000;20:5346–5357. doi: 10.1523/JNEUROSCI.20-14-05346.2000. [DOI] [PMC free article] [PubMed] [Google Scholar]
- Withington DJ, McCrossan D. Severing the intercollicular commissure prevents bilateral disruption of the map of auditory space in the superior colliculi following monocular enucleation. Neurosci Lett. 1996;220:29–32. doi: 10.1016/s0304-3940(96)13223-7. [DOI] [PubMed] [Google Scholar]