

Abstract
The input–output transform performed by mitral cells, the principal projection neurons of the olfactory bulb, is one of the key factors in understanding olfaction. We used combined calcium and voltage imaging from the same neuron and computer modeling to investigate signal processing in the mitral cells, focusing on the glomerular dendritic tuft. The main finding was that the dendritic tuft functions as a single electrical compartment for subthreshold signals within the range of amplitudes detectable by voltage-sensitive dye recording. These evoked EPSPs had uniform characteristics throughout the glomerular tuft. The Ca2+ transients associated with spatially uniform subthreshold synaptic potentials were comparable but not equal in amplitude in all regions. The average range of normalized amplitudes of the EPSP-driven Ca2+ signals from different locations on dendritic branches in the glomerular tuft was relatively narrow and appeared to be independent of the dendritic surface-to-volume ratio. The computer simulations constrained by the imaging data indicated that a synchronized activation of ∼100 synapses randomly distributed on tuft branches was sufficient to generate spatially homogenous EPSPs. This number of activated synapses is consistent with the data from anatomical studies. Furthermore, voltage attenuation of the EPSP along the primary dendrite at physiological temperature was weak compared with other cell types. In the model, weak attenuation of the EPSP along the primary dendrite could be accounted for by passive electrical properties of the mitral cell.
Keywords: olfactory bulb, mitral cell, dendritic tuft, voltage imaging, calcium imaging, synaptic integration
Introduction
A fundamental limitation in studying the input–output relationship of principal mammalian neurons is that the natural input (the spatiotemporal pattern of synaptic activity) to the dendritic arbor of these cells is not known (Mel, 1993; Williams, 2005; Losonczy and Magee, 2006). Thus, the conclusions from these studies depend on an unknown correlation between experimentally designed input patterns and the spatial and temporal structure of the natural input. The mitral cell of the olfactory bulb offers a unique opportunity to mitigate this problem because (1) the excitatory synaptic contacts are spatially restricted to a well defined dendritic subregion and (2) the pattern of the presynaptic activity of the olfactory receptor neurons is known. Mitral cells receive the excitatory synaptic input from the olfactory receptor neurons exclusively on the terminal dendritic tuft (Pinching and Powell, 1971). The innervation and the functional structure of the dendritic tuft is one of the key factors that determine the input–output function of mitral cells. Another critical factor is the mechanism that controls voltage attenuation along the primary dendrite. Neither one of these two parameters has been fully explored.
The direct measurement of membrane potentials (Vm) signals from the dendritic tuft branches is not possible because these structures are too small to tolerate the use of electrodes. Thus, other methods were used to probe the functional organization of the tuft. A notable study based on in vivo two-photon Ca2+ measurements of presynaptic activity with a spatial resolution of several micrometers demonstrated that, within single glomeruli, the spatial pattern of activity of presynaptic terminals was invariable and indistinguishable for odorant stimuli of different duration, identity, and concentration, from near-threshold to near-saturating levels (Wachowiak et al., 2004). Although these data concern presynaptic activity, the results imply directly that the dendritic tuft of individual output neurons, by receiving spatially invariable input, will act as a functional unit. At the same time, Ca2+ measurements from dendritic tufts in brain slices indicated regional differences in EPSP-related Ca2+ responses (Urban and Castro, 2005). Additionally, the spatial pattern of Ca2+ responses (Ca2+ hotspots) was shown to vary with intensity of electrical stimulation in olfactory bulb slices (Yuan and Knopfel, 2006a), suggesting that terminal dendritic branches may act as independent functional subunits. Similar subdivisions of the dendritic arbor into independent processing units have also been suggested for neocortical (Polsky et al., 2004) and hippocampal (Losonczy and Magee, 2006) pyramidal neurons. Together, these results leave the possibility open that the anatomically complex structure of the dendritic tuft is functionally subdivided into multiple compartments. There is, however, no direct evidence to support this hypothesis. We explored the electrical structure of the tuft using combined calcium and voltage imaging. The results, interpreted with the aid of a multicompartmental model, showed that the EPSP response within a range of subthreshold intensities is uniform throughout the dendritic tuft, indicating a single electrical compartment. At physiological temperature, a near-threshold EPSP originating in the tuft attenuated along the primary dendrite according to a model prediction based on passive electrical structure of the mitral cell.
Materials and Methods
Slices, patch-clamp recording, and intracellular application of dyes.
Experiments were performed on olfactory bulb slices from 21- to 35-d-old Sprague Dawley rats prepared according to methods approved by the Yale University Animal Care and Use Committee. All measurements were done at 32–36°C. The rats were decapitated after halothane anesthesia, and 400-μm-thick horizontal slices were cut in ice-cold solution using a custom made rotary slicer with ceramic circular blade (Specialty Blades, Staunton, VA) rotating at 70 rpm. Slices were incubated at 37°C for 30 min and then maintained at room temperature (23–25°C) before recording. Mitral cells were identified using infrared differential interference contrast (DIC) video microscopy on an upright microscope (model BX51WI; Olympus, Tokyo, Japan). The extracellular solution used during slicing and recording contained the following (in mm): 125 NaCl, 26 NaHCO3, 20 glucose, 2.3 KCl, 1.26 NaH2PO4, 2 CaCl2, and 1 MgCl2, pH 7.4 when bubbled with gas mixture (95% O2, 5% CO2). Somatic and dendritic whole-cell recordings were made with 3–8 MΩ patch pipettes using a Multiclamp 700A amplifier (Molecular Devices, Sunnyvale, CA). Electrical signals were digitized using Digidata 1322A (Molecular Devices) and stored and analyzed with pClamp software (Molecular Devices). Membrane potential measurements were not corrected for a liquid junction potential, calculated to be 8.1 mV at 35°C. The pipette solution for intracellular staining contained the following: 105 mm KMeSO4 or CH3KO3S, 30 mm KCl, 10 mm HEPES, 0.05 mm EGTA, 4 mm Mg2ATP, 0.3 mm NaGTP, 10 mm Na2-phosphocreatine, pH 7.3 adjusted with KOH, 0.5 mg/ml of the voltage-sensitive dye JPW3028 and 300 μm of the calcium indicator dye bis-fura-2 (KD of 525 nm at 1 mm Mg2+; Invitrogen, Carlsbad, CA). Glass pipettes were first filled from the tip with dye-free solution by applying negative pressure for ∼1 min and then backfilled with the solution containing the two indicator dyes. The dye JPW3028 was obtained from Leslie Loew and Joe Wuskell (University of Connecticut Health Center, Farmington, CT). This is a doubly positively charged analog of the ANEP series of lipophilic styryl dyes that is still sufficiently water soluble to be used for microinjection. Its close analog [JPW1114 (Zecevic, 1996)] is available from Invitrogen as D6923. Dye-free solution in the tip was necessary to prevent the leakage of the dye into the extracellular medium before the electrode is attached to the neuron. Intracellular staining was accomplished by free diffusion of the pipette solution into the soma in 15–60 min, depending on electrode resistance. After diffusion of the dyes into the soma was completed, as determined by measuring the resting light intensity from the soma, the patch electrode with dyes was detached from the neuron by forming an outside-out patch, and the preparation was typically incubated for additional 1.5 h at room temperature to allow the voltage-sensitive dye to spread into distal processes. The spread of JPW3028 is relatively slow and apparently limited by its high affinity for lipid membranes. To obtain electrical recordings from the soma, the cell body was repatched before making optical measurements.
The presynaptic axons in the olfactory nerve layer were stimulated by either a monopolar tungsten electrode (A-M Systems, Sequim, WA) or a 1 MΩ patch electrode filled with extracellular solution. The stimulating electrode was positioned, under visual control, on the main axon bundle entering the glomerulus containing the dendritic tuft of the stained mitral cell.
Optical recording.
We used a stationary stage upright microscope equipped with two camera ports. One camera port had a standard high spatial resolution CCD camera for infrared DIC video microscopy. The other camera port had a fast data acquisition camera with relatively low spatial resolution but outstanding dynamic range (NeuroCCD-SM; RedShirtImaging, Decatur, GA). The analysis and display of data were made using the NeuroPlex program (RedShirtImaging) written in IDL (Interactive Data Language; Research Systems, Boulder, CO) running on a Windows-based computer. The brain slice was placed on the stage of the microscope, and the fluorescent image of the stained cell was projected by a water immersion objective (60×/1.0 numerical aperture; Nikon, Tokyo, Japan) via an optical coupler (0.09–0.11 X; RedShirtImaging) onto the CCD chip. This objective was selected as a compromise between imaging area, spatial resolution, and the signal-to-noise ratio (S/N). A 250 W xenon, short-gap arc lamp (XBO 250 W/CR ORF; Osram, Munich, Germany) powered by a low ripple power supply (model 1700XT/A, Opti-Quip, Highland Mills, NY) was used as a source for excitation light.
In voltage imaging, the best signals were obtained using an excitation interference filter of 520 ± 45 nm, a dichroic mirror with the central wavelength of 570 nm, and a 610 nm barrier filter (a Schott RG610). Slow changes in light intensity attributable to bleaching of the dye were corrected by subtracting an appropriate exponential function derived from the recording trials with no stimulation. The study of voltage attenuation in the dendritic arbor required absolute calibration of the optical EPSP signals in terms of membrane potential at multiple locations. This was performed using a dendritic action potential (AP) that has the same amplitude at all locations (Bischofberger and Jonas; 1997; Chen et al., 1997; Djurisic et al., 2004), as a calibration standard. To provide an accurate optical measurement of fast action potential signals at physiological temperature (time-to-peak of ∼0.3 ms), the imaging frame rate had to be increased from the frequency of 2 kHz used previously (Djurisic et al., 2004) to 10 kHz. The increase in sampling rate was accomplished by a partial readout of the CCD chip covering a section of 80 × 12 pixels. The higher sampling rate resulted in the reduced signal-to-noise ratio. Nevertheless, with the sensitivity of the intracellular voltage-sensitive dyes used (1–6% ΔF/F per 100 mV in recording from dendritic processes), relatively good signal-to-noise ratio was obtained in single-trial recordings with modest spatial averaging. Multiple trials averaging (four to nine trials) was used when possible to improve the signal-to-noise ratio further.
Ca2+ signals were recorded at the frame rate of 500 Hz using an excitation interference filter of 380 ± 15 nm, a dichroic mirror with central wavelength of 400 nm, and a 450 nm barrier filter. Calcium fluorescence transients are expressed as −ΔF/F = (F0 − F)/F0, where F is the fluorescence, and F0 is the resting fluorescence. The value of F was calculated after subtracting autofluorescence determined for an area far from the loaded dendrite. Bis-fura-2 (300 μm) was chosen to maximize the S/N of Ca2+ fluorescence signals and because its excitation wavelength lies outside of the absorption spectrum of the styryl voltage-sensitive dye.
A direct comparison of Ca2+ signals from different dendritic locations is valid only under an assumption that typical Ca2+ transients [in this study, single EPSP or single backpropagating AP (bAP)-driven Ca2+ signals] do not saturate the indicator. Moreover, the relationship between the change in intracellular calcium and fluorescence intensity of the indicator must be close to linear. The linearity requirement in calcium measurements is satisfied if all signals fall within the lowest 20% of the dynamic range of the calcium dye (defined as the ratio between Fmax/Fmin; fluorescence intensities at saturating and 0 Ca2+ concentrations, respectively). In this range, in which [Ca2+] ≪ KD (dye dissociation constant), the deviation from the linear relationship is small and can be neglected (Yasuda et al., 2004, their Fig. 5). We performed control experiments (n = 6) to confirm that our measurements were within the linear range of the indicator. In a typical experiment shown in Figure 1, we measured dendritic Ca2+ signals related to a single bAP and compared these signals with the fluorescence intensity at saturating Ca2+ concentration reached during high-frequency AP trains (Maravall et al., 2000). The mean saturating response to AP train was (ΔF/F)sat = 69.7 ± 4.5%, whereas the mean Ca2+ transient associated with a single bAP was (ΔF/F)bAP = 6.4 ± 1.1% (n = 6). This result shows that bAP-driven Ca2+ influx was within the linear range of the indicator. The Ca2+ influx associated with the near-threshold EPSP evoked at the resting membrane potential was approximately two times smaller and, thus, also in the linear range.
Figure 5.

Spatial distribution of small subthreshold EPSP signals is uniform in thin terminal dendritic branches of the tuft. A, Fluorescence image of a mitral cell tuft obtained with a conventional high-resolution CCD camera. B, Fluorescence image of the same tuft in recording position obtained with a fast, low-resolution (80 × 80 pixels) CCD camera used for voltage imaging. Six color-coded recording locations correspond to traces in C. C, Trace display of Vm signals. Bottom black traces, Electrical recordings from soma. Left traces, Single-trial recordings of the small EPSP signal are at the limit of amplitude resolution. Middle traces, Nine averages of the EPSP signals shown on the left improved the signal-to-noise ratio. Right traces, Nine averages of the EPSP four times larger in amplitude.
Figure 1.

Fluorescence transient in response to a single bAP compared with a saturating response evoked by high-frequency train of bAPs. A, Fluorescence image of a mitral cell tuft loaded with bis-fura-2. B, Electrical recordings from the soma (bottom 2 traces) and optical recordings of related Ca2+ signals from a dendritic branch in the tuft. Optical signals are spatial averages of pixels indicated in A. All signals are single-trial recordings.
Pooled data are presented as arithmetic mean ± SEM unless otherwise stated. Statistical comparisons were performed using Student's t test (two-sample assuming equal variances) with the null hypothesis that the means of both datasets are equal.
Pharmacological effects and photodynamic damage.
For the [Ca2+]i indicator, we showed previously, in CA1 pyramidal neurons, that intracellular loading with bis-fura-2 did not have detectable pharmacological effects (toxicity of the indicator dye in the absence of excitation light), nor did it cause photodynamic damage (toxicity induced by the interaction of the indicator dye with high intensity light) after 50–100 recording trials that were typically collected during one experiment (Canepari et al., 2007). Analogous results were obtained in the present study.
For the membrane potential indicator, we have shown previously, in mitral cells (Djurisic et al., 2004) and in CA1 pyramidal neurons (Canepari et al., 2007), that pharmacological effects of the voltage-sensitive dye and photodynamic damage during optical recording were not detected if the exposures to excitation light were kept relatively short (100–200 ms) and if successive trials were separated by dark intervals lasting several minutes. Analogous results were obtained in the present study. We routinely acquired 10–20 recording trials (illumination time, 100–150 ms/trial) without detecting any deterioration of the stained neuron.
Modeling.
All simulations were performed with NEURON 6.0 (http://www.neuron.yale.edu); the source code for our models is available from ModelDB (http://modeldb.yale.edu). Parameter optimization was done with the NEURON MultipleRunFitter using the praxis method.
A morphometrically detailed reconstruction of a biocytin-labeled mitral cell was obtained with Neurolucida (MBF Bioscience, Williston, VT) and imported with the NEURON Import3D tool (supplemental Fig. 1A, available at www.jneurosci.org as supplemental material). Passive model parameters were those used by Popovic et al. (2005): specific membrane resistance Rm, 9600 Ωcm2; specific membrane capacitance Cm, 1.18 μF/cm2; and cytoplasmic resistivity Ri, 54 Ω cm. Our Rm is smaller than that reported by Shen et al. (1999) but yields a τm of 11.3 ms that is very close to the ∼12 ms seen in a hyperpolarizing current step in the study of Chen and Shepherd (1997, their Fig. 2A). It should be noted that Rm has little effect on the spread of PSPs and action potentials; such brief signals are dominated by high-frequency components that lie well above one-half τm (Jaffe and Carnevale, 1999) and are far more sensitive to Ri and Cm. Our values are similar to the 70 Ωcm and 1.2 μF/cm2 reported by Shen et al. (1999). Active models of retrograde spike invasion of the tuft used the membrane and cytoplasm properties described by Shen et al. (1999) (source code available from ModelDB).
Figure 2.

Action potential signals recorded optically from multiple locations on thin terminal dendritic branches of the glomerular tufts of two mitral cells. A, C, CCD images of two dendritic tufts in recording position (inverse gray scale). B, D, Recordings of AP signals from multiple locations; signals are temporal averages of nine trials and spatial averages from indicated color-coded pixels.
Synaptic inputs were modeled with time-varying conductance changes based on an EPSP recorded optically from the tuft. The time course of the observed waveform was closely approximated by the biexponential function A (e−t/(τ1) − e−t/(τ2)), where τ1 and τ2 are 5.99 and 2.84 ms (supplemental Fig. 1B, available at www.jneurosci.org as supplemental material). To generate a 16 mV EPSP with the same time course at the origin of the tuft in the passive model, we tried attaching a model of a fast excitatory synapse to that point: an α function conductance change with reversal potential 70 mV depolarized from rest. Optimization achieved a good match from EPSP onset into the early part of its falling phase with gpeak of 8.6516 nS, and τ of 1.6094 ms. To replicate the later falling phase, it was necessary to introduce a model inhibitory synapse at the same location, with a slower α function conductance change (gpeak of 2.2126 nS; τ of 5.6631 ms), delayed onset (7.6337 ms after onset of the excitatory component), and reversal potential 10 mV hyperpolarized from rest.
Some passive model simulations were bracketed, i.e., repeated after doubling Ri and/or Cm; results were qualitatively similar to those produced with our “control” values. Changing Ri and/or Cm from their control values required adjustment of synaptic gpeak and τ to preserve the time course of the compound EPSP (supplemental Table 1, available at www.jneurosci.org as supplemental material).
Models were discretized by setting nseg to an odd value according to the d_lambda rule so that no compartment was longer than 0.1 length constant at 100 Hz (Hines and Carnevale, 2001). To ensure consistent synapse placement across bracketed simulations, all passive models used nseg appropriate for 2× control Ri and Cm. Numerical integration used adaptive integration with absolute error tolerance 0.001.
Results
Membrane potential signals related to near-threshold EPSP
Voltage imaging at high spatial resolution was used to monitor the evoked EPSPs in the terminal dendritic branches of the glomerular tuft of individual mitral cells. To standardize the recording conditions in measurements from different cells, the stimulus intensity applied to the olfactory nerve bundle innervating the appropriate glomerulus was adjusted to produce an EPSP of the size sufficient to evoke an action potential in ∼50% of trials (near-threshold EPSP). Similar results were obtained with subthreshold EPSPs that were approximately four times smaller in amplitude (smallest detectable signals; see below). The data were analyzed to determine whether subthreshold voltage signals are localized to dendritic subcompartments similar to Ca2+ hotspots (Urban and Castro, 2005; Yuan and Knopfel, 2006a) or instead the EPSPs are distributed uniformly throughout the dendritic arbor. Although the timing information is derived directly from optical signals, the comparison of signal amplitudes recorded from different dendritic regions requires calibration of optical signals in terms of membrane potential (in millivolts). The calibration of optical signals was accomplished by using a dendritic AP as a calibration standard. This is possible because, in mitral cells, an action potential has the same amplitude at all locations in the primary dendrite (Bischofberger and Jonas; 1997; Chen et al., 1997). Figure 2 illustrates action potential signals recorded optically from multiple locations on the dendritic tuft of two representative mitral cells. The spike signals from individual locations shown in B and D are spatial averages of ∼10 pixels covering a length of ∼20 μm on terminal dendritic branches (indicated in A and C). For comparison, signals were normalized to the largest regional AP signal (Fig. 2, yellow trace). As shown in the figure, the peak-to-peak amplitude of the optical signals (ΔF/F) corresponding to a spike assumed to have constant size was not identical at all locations. This variability indicates that the sensitivity of the optical measurement from different regions was not exactly the same. The sensitivity could vary because the amplitude of optical signals from dendritic branches was proportional to the change in the membrane potential but, to a smaller extent, also depended on the unknown distribution of the intracellular voltage-sensitive dye between the plasma membrane that changes potential and the internal membranes that do not contribute to the Vm signal. The contribution of this factor can be different at different locations depending on the surface-to-volume ratio of different dendritic branches (Djurisic et al., 2004). In our measurements, this contribution appeared to be modest, probably because the variation in the diameter and, hence, the surface-to-volume ratio of terminal dendritic branches in the tuft is relatively small (Kasowski et al., 1999). Typically, the differences in spike signal amplitudes measured at different locations were <10% of the largest signal (Fig. 2). In the case of out-of-focus branches, the reduction in sensitivity from particular locations sometimes exceeded 10% of the largest AP signal, and these regions were excluded from the analysis. Under the conditions of low light levels from the out-of-focus branches, the background fluorescence becomes a significant determinant of the ΔF/F signal size, but its contribution cannot be determined reliably. Also, the signal-to-noise ratio in recordings from out-of-focus regions is degraded by a low light level. The sensitivity profile determined by comparing AP signal amplitudes was used to scale the size of subthreshold optical signals from a given location. This calibration procedure rests on the assumption that the amplitude of an action potential in the thin dendritic branches in the tuft (in which electrical recording is not possible) is uniform and has the same value as in the trunk of the primary dendrite. There is no direct evidence that this is true, but an upper limit for the possible errors introduced by this assumption can be estimated using a numerical simulation. The computer model indicated that possible errors in calibrating EPSP signals are likely to be underestimates of <10% (see below).
The stimulation of the olfactory nerve that evoked a near-threshold EPSP induced voltage transients that were similar throughout the tuft in 26 of 26 cells tested. We have never observed an EPSP responses that would be localized and restricted to a subset of dendritic branches and absent from other regions of the tuft. Figure 3 illustrates a result from a typical experiment in which an evoked near-threshold EPSP was monitored optically from multiple subregions on the dendritic tuft. In this experiment, the mean value for the subregion EPSP amplitude (normalized to the biggest signal) was 0.854 ± 0.09 (mean ± SD). The summary result from 137 subregions on 26 dendritic tufts indicated the mean relative EPSP amplitude value of 0.874 ± 0.12 (mean ± SD). The histogram of individual values (data not shown) indicated that 95.3% of observations fall within ±2 SD of the mean, a result that strongly implies a normal statistical distribution of the sample. Together, these results suggest that small regional variations in the EPSP response amplitude were likely caused by a random process. Additionally, qualitative examination did not indicate any distinguishable pattern in the data.
Figure 3.
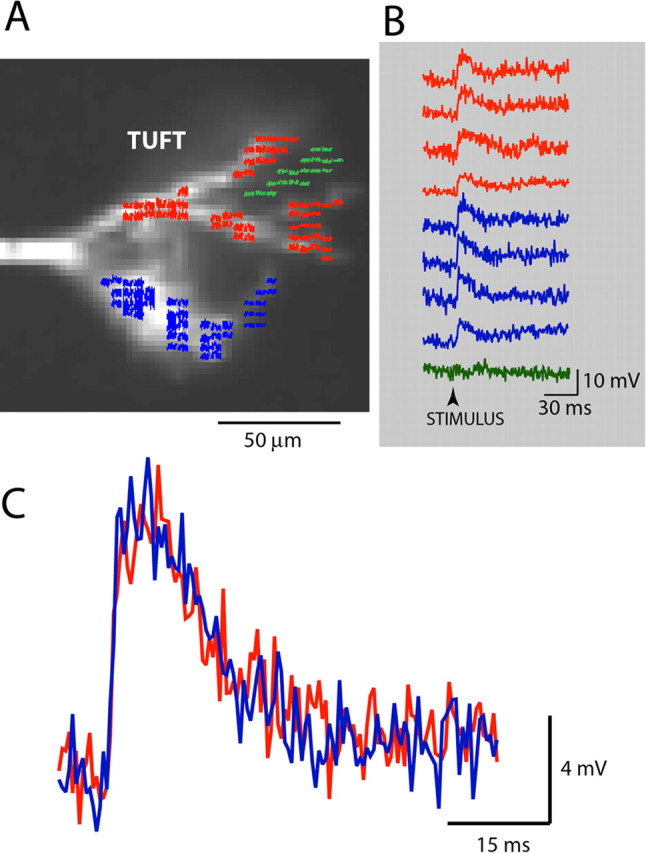
EPSP-related optical signals from multiple locations on dendritic branches of a glomerular tuft were similar in amplitude. A, Fluorescence image of a mitral cell tuft obtained with a fast, low-resolution (80 × 80 pixels) CCD camera used for voltage imaging. Red, blue, and green pixels show nine areas of interest. B, EPSP signals in response to near-threshold synaptic stimulation recorded optically from nine locations indicated in A. The green trace with no signal is recorded from a region that did not receive light from the tuft, indicating low level of light scattering. EPSP signals were calibrated in terms of millivolts using AP signals as calibration standard. C, The spatial average of EPSP signals from red and blue pixels on two sides of the tuft. The shape and the size (calibrated in millivolts) of two signals are almost identical.
The results were further analyzed to provide a statistical test for the hypothesis that the EPSP response was spatially uniform. Initially, the data were grouped into two sets corresponding to the left and the right part of the tuft. Each of the two main regions (left and right) included all secondary and higher-order dendrites connected to one of the two main tuft branches originating from the initial bifurcation of the primary dendrite in the glomerulus (Fig. 3A, red and blue regions). The two main regions were further divided into four to six subregions, and two datasets were created by determining the amplitude of the EPSP signals from each subregion (spatial average of subregion pixels). An example of EPSP signals from different locations on the dendritic tuft (four locations from each of the two main regions) is shown in Figure 3B. For the cell shown in Figure 3, the mean signal amplitudes (normalized to the biggest signal) in the two main regions were 0.85 ± 0.04 (left) and 0.84 ± 0.06 (right). These values were not significantly different at p > 0.7. Furthermore, this result implies that the EPSP signals generated as the spatial average of the whole region on one side of the tuft should overlap with the signal from the other main region (allowing for small differences caused by the noise in the recording). Such an overlap was clear for the dendritic tuft shown in Figure 2C. The same analysis was applied to all mitral cells tested (n = 26), and the same result was obtained in all cases.
It is possible that arbitrary grouping of data into two sets corresponding to the left and the right part of the tuft introduced a systematic bias that could mask the variability between subregions. For example, an anatomical study suggested, on the basis of qualitative evidence, that olfactory nerve terminal synapses are spatially segregated to the most distal tips of the dendritic tuft (Kasowski et al., 1999). Such anatomical organization could result in a spatially nonuniform EPSP response along the proximal–distal axis of the dendritic tree, which might be masked by the relatively crude comparison of the left and the right part of the tuft. Unfortunately, testing this hypothesis on a finer spatial grid is presently precluded by the available signal-to-noise ratio. It is, however, possible to make a more general comparison between proximal and distal subregions of the tuft. For this test, the subregion signal amplitude data were grouped into two sets, one that included observations from distal locations (<40 μm from the tips of dendritic branches) and the other that included more proximal parts of the dendritic tuft branches. Statistical comparison showed that the means of two datasets were equal for all individual tufts. We also analyzed the summary data for all neurons (all distal and all proximal amplitude values pooled together) and found that the means of two datasets were not significantly different (proximal, 0.856 ± 0.016; distal, 0.857 ± 0.017; p > 0.8; n = 67). The statistical analysis, thus, confirmed that the evoked near-threshold EPSP signal amplitude was consistently homogenous in the dendritic tuft. This finding is in agreement with the more recent anatomical studies suggesting, on the bases of qualitative analysis, a mosaic and even distribution of excitatory synapses between distal and proximal parts of dendritic branches in the tuft (Kosaka et al., 2001; Kosaka and Kosaka, 2005). The spatial distribution of the EPSP amplitude was linked to a computer simulation of the electrical structure of the tuft and used to infer the synaptic innervation pattern that would be consistent with a uniform EPSP response (see below).
Calcium signals related to near-threshold EPSP
Before the measurements reported here, no information was available about the spatial distribution of subthreshold electrical signals in the glomerular tuft. Ca2+ transients, however, have been measured from both the presynaptic axon terminals in the glomeruli (Wachowiak et al., 2004) and from postsynaptic mitral cell dendritic tufts (Charpak et al., 2001; Debarbieux et al., 2003; Urban and Castro, 2005; Yuan and Knopfel, 2006a). Both the presynaptic (Wachowiak et al., 2004) and the postsynaptic (Urban and Castro, 2005; Yuan and Knopfel, 2006a) intraglomerular calcium signals were found to be spatially heterogeneous, showing a clear patchy distribution. It is difficult to correlate the results on Ca2+-signal distribution from these studies with our measurements of subthreshold membrane potential signals because the experimental conditions are not directly comparable. To compare directly the spatial distribution of Vm signals and Ca2+ signals related to the evoked EPSP, we performed combined Vm and Ca2+ measurements from dendritic tufts of mitral cells loaded with two indicators. Figure 4 illustrates a typical experiment. First, an evoked near-threshold EPSP was monitored from multiple sites on the dendritic tuft in voltage-imaging mode (Fig. 4A,B,E,F) as described above for the experiment shown in Figure 3. B shows the recordings of EPSP Vm signals from five selected regions on the dendritic tuft. The bottom optical trace (black) is the recording of the ΔF/F signal from a region ∼10 μm away from the edge of the dendritic tuft, indicating the degree of light scattering. It is clear that light scattering from neighboring regions did not influence significantly our recordings with a 60×/1.0 numerical aperture objective. As described above, the comparison of EPSP signals from different locations showed that the tuft arbor was essentially equipotential during an evoked response; the signals calibrated in terms of membrane potential were similar within the limits of recording resolution set by the shot noise in the light intensity measurements. The characteristics of the EPSP signal are shown as a temporal sequence of color-coded spatial maps (F) of the Vm transient determined at four time points indicated by arrows in the trace display shown in E. The results show that the peak of the Vm signal was reached uniformly throughout the tuft within 4 ms.
Figure 4.
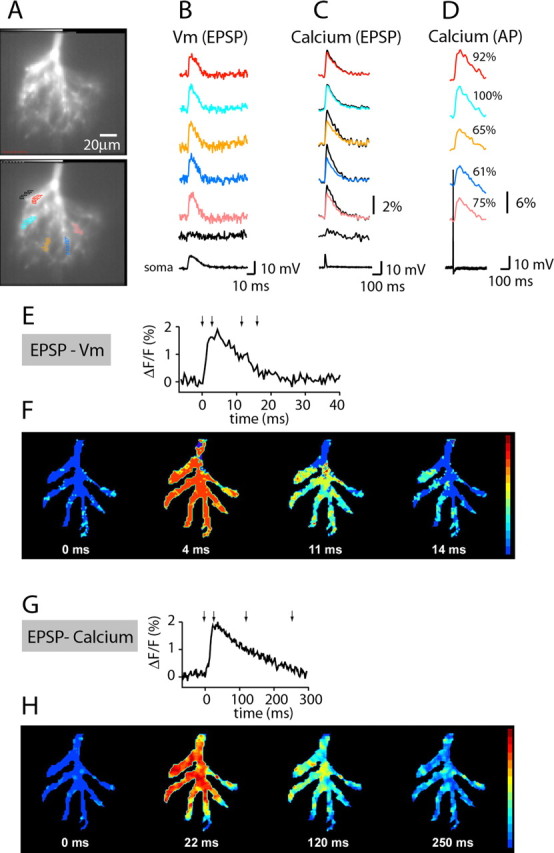
Spatial distribution of near-threshold EPSP signals and associated Ca2+ transients derived from combined Vm and Ca2+ measurements from thin terminal dendritic branches of the glomerular tuft of a mitral cell. A, The fluorescent image of the glomerular tuft in recording position. B, EPSP-related Vm signals from multiple locations as indicated in the bottom frame in A. C, EPSP-driven Ca2+ signals from the same locations (superimposed black trace are normalized to AP-related calcium signals). D, AP-driven Ca2+ signals from the same locations. E, Trace display of the Vm signal. F, The EPSP signal shown as a temporal sequence of color-coded spatial maps determined at four time points indicated by arrows in E. The peak of the Vm signal was reached uniformly throughout the tuft within 4 ms. G, Trace display of the Ca2+ signal. H, The spatial characteristics of the Ca2+ response shown as a temporal sequence of color-coded spatial maps determined at four time points indicated by arrows in G.
After the measurements of Vm transients, EPSP-related Ca2+ signals were recorded from the same dendritic locations in response to identical stimulation. The trace display of signals is shown in Figure 4C, and the spatial and temporal characteristics of the Ca2+ response are shown as a temporal sequence of color-coded spatial maps determined at four time points indicated by arrows in the trace display (G,H).
In this experiment and in measurements from an additional 12 mitral cells, Ca2+ signals were comparable but not identical in amplitude in all regions. To quantify region-specific differences in signal size, the signals from selected locations were normalized to the largest signal in the tuft. In the measurement shown in Figure 4, the smallest subregion Ca2+-signal amplitude was 90% of the largest signal. It is possible that this small variation is caused solely by regional differences in dendritic diameter resulting in differences in the surface-to-volume ratio (Yuan and Knopfel, 2006a; Zhou et al., 2006). To probe for this effect, we recorded bAP-driven Ca2+ transients from the same tuft locations. Because it is likely that the AP has the same amplitude at all tuft locations (Djurisic et al., 2004), the associated regional Ca2+ signals should mainly reflect differences in the surface-to-volume ratio (assuming that the distribution of voltage-sensitive calcium channels is uniform in the dendritic tuft). D shows that, in this experiment, the smallest AP-related Ca2+ signals normalized to the largest response was 60%. We used this information to correct EPSP-related Ca2+ transients for the effect of the surface-to-volume ratio; in Figure 4C, black traces superimposed on color traces represent corrected signals. In this particular experiment, the correction procedure increased the range of relative signal amplitudes so that the smallest regional transient was 70% of the largest signal in the tuft. The summary result from these types of measurements in 13 mitral cells showed that the arithmetic mean for the smallest relative amplitude of the EPSP-driven Ca2+ signals from different locations on dendritic branches in the glomerular tuft was 0.73 ± 4% (n = 13). After the data were corrected for the effect of the surface-to-volume ratio, the smallest relative amplitude remained unaltered (74 ± 5%). These results indicate that regional differences in Ca2+ transients related to near-threshold EPSP are relatively small and appear to be determined by a factor different from the dendritic surface-to-volume ratio.
Spatial profile of small subthreshold EPSP signals
The results showing spatially homogenous response in the tuft were obtained with the near-threshold EPSP characterized by relatively large amplitude (16.2 ± 0.7 mV; n = 21) that implies activation of many synapses. We performed additional measurements (n = 14) to determine whether weaker subthreshold stimulation of the olfactory nerve that activates fewer synapses could generate spatially heterogeneous responses. The amplitude of the smallest EPSP signals that could be detected optically was limited by the sensitivity of recording. Thus, the stimulus intensity was gradually increased until the EPSP-related optical signal averaged spatially over the entire glomerular tuft could just be resolved (S/N of ∼1). The amplitude of these EPSPs in the soma recorded with a patch electrode varied between 3 and 8 mV in different experiments. After the minimal detectable EPSP was determined, we used signal averaging (9–25 trials) to improve the S/N so that signals from smaller subregions could be resolved and compared. A typical experiment is shown in Figure 5. First, an optical signal related to the evoked EPSP of minimal detectable amplitude was recorded from multiple sites on the dendritic tuft. Figure 5C shows the recordings of EPSP Vm signals from six selected regions indicated on the fluorescence image of the tuft (B). Because the amplitude of the subthreshold EPSP in this experiment was approximately four times smaller compared with the near-threshold EPSP response, regional optical signals in single-trial recordings were at the limit of resolution and could not be quantified reliably (Fig. 5C, left traces). After averaging nine trials (Fig. 5C, middle traces), the results indicated that EPSP signals were present and comparable in size throughout the glomerular tuft. As was the case with the larger, near-threshold EPSP, small subthreshold responses were never restricted to a subset of locations and absent from other regions of the tuft. We estimated that the quantification of signal amplitudes for small EPSPs was characterized by relatively large error limits of ±10% because of the low signal-to-noise ratio. The small EPSP signals were contaminated by both high-frequency noise in light intensity (shot noise) and by slow variation in the resting light intensity (vibrational noise). Nevertheless, within these error limits, the variations in subthreshold EPSP signal amplitudes from different dendritic regions were small and likely to be random. The mean relative EPSP amplitude from a total of 84 subregions on 14 dendritic tufts was 0.912 ± 0.11 (mean ± SD). The histogram of individual values (data not shown) indicated that than 96.2% of the observations fall within ±2 SD of the mean, suggesting a normal statistical distribution of the sample. As with near-threshold EPSPs, qualitative examination did not indicate any distinguishable pattern in the data. We performed a statistical test for the hypothesis that the small subthreshold EPSP response was spatially uniform. The subregion signal amplitude data were grouped into two sets, for every experiment, one for distal subregions and the other for proximal locations. With smaller EPSP signals, in most experiments, the subregions over which the signals were spatially averaged had to be increased in size to improve the signal-to-noise ratio. This, in turn, reduced the number of subregions, making the statistical test applied to individual tufts unreliable. To compensate for this effect, we combined the data for distal and proximal subregions from all 14 dendritic tufts. The t test indicated that the mean EPSP amplitude of both distal and proximal dendritic subregions were equal (proximal, 0.90 ± 0.02; distal, 0.91 ± 0.01; p > 0.8; n = 42). After the recording of the smallest detectable EPSPs, in the same experiments, we typically increased the stimulus intensity to monitor larger subthreshold signals from same dendritic locations (Fig. 5C, right traces). The spatial distribution of small and large EPSPs in the tuft was invariably the same.
Attenuation of near-threshold EPSP in the primary dendrite
We previously determined (Djurisic et al., 2004) that the attenuation of the EPSP in the primary dendrite is surprisingly weak at room temperature (22–24°C). This result cannot be simply extrapolated to physiological temperature because voltage-sensitive conductances are temperature sensitive (Hodgkin and Huxley, 1952). Thus, the role of voltage-sensitive conductances in shaping subthreshold potentials and their attenuation in mitral cells remained unresolved, requiring additional measurements at physiological temperature (32–36°C). At this temperature, the rising phase of AP signal was completed in ∼0.3 ms, and the imaging frame rate had to be increased to 10 kHz to accurately determine signal amplitude (see Materials and Methods). A series of optical measurements at physiological temperature was performed simultaneously with patch-electrode recordings from the cell body (n = 21). A typical experiment is shown in Figure 6. A stimulating electrode was positioned in the olfactory nerve layer, and the nerve was stimulated to produce a near-threshold EPSP in the postsynaptic mitral cell (Fig. 6B,C, bottom traces). The near-threshold EPSP evoked an action potential in the mitral cell in ∼50% of cases. When initiated, the spike was always triggered in the soma–axon region characterized by the lower excitation threshold compared with the dendritic tuft (Chen et al., 1997; Djurisic et al., 2004). The spike signal backpropagated from the soma into the primary dendrite arriving in the glomerular tuft with the delay of several milliseconds after the peak of the local, optically recorded EPSP (Fig. 6B, top red trace). In this way, a single-trial recording from the tuft contained both an EPSP signal and an AP signal necessary for the calibration of EPSP amplitude in terms of membrane potential. Once recorded, AP signal can be used as a calibration standard for all subsequent Vm signals from a given location because of the strictly linear relationship between fluorescence changes and membrane potential within a wide range (−100 to +100 mV) (Ross et al., 1977; Loew et al., 1992; Wu and Cohen, 1993).
Figure 6.

Simultaneous optical and electrical recordings of the near-threshold EPSP signal and an evoked spike in a mitral cell. A, A composite fluorescence image of a mitral cell. Optical signals are spatial average of pixels marked in red. The white rectangle indicates partial readout area of 12 × 80 pixels sampled at 10 kHz frame rate. B, Optical signal of a subthreshold EPSP (bottom red trace) and a spike evoked by two sequential weak stimuli (top red trace) applied to the olfactory nerve. Optical signals acquired at a frame rate of 10 kHz. Corresponding signals recorded electrically from the soma are shown below (black traces). Note the delay between bAP signals recorded in the soma and in the dendritic tuft, indicating soma–axon initiation site.
In some experiments in which the glomerular tuft was situated deeper in the slice causing the reduction in the signal-to-noise ratio, we used signal averaging (4–16 trials). In these measurements, AP signals were averaged separately using the peak of the spike as the reference data point for averaging to avoid the effect of temporal jitter. In these experiments, after averaging spike signals for calibration purposes, we blocked action potentials by intracellular application of 10 mm QX314 [N-(2,6-dimethylphenyl carbamoylmethyl) triethylammonium bromide]. The blockade of sodium channels facilitated subsequent averaging of EPSPs and also allowed us to determine whether voltage-gated sodium channels participated in the EPSP generation and spread. The ratio between the EPSP amplitude recorded optically and calibrated in millivolts at the site of origin in the tuft and the amplitude of the EPSP signal recorded electrically in the soma determines directly the degree of voltage attenuation along the primary dendrite. The attenuation of EPSPs was determined, for the same mitral cells, under control conditions and with 10 mm QX314 introduced intracellularly from the patch pipette. The results showed that the EPSP shape and size as well as the level of attenuation along the primary dendrite recorded under control conditions were not affected by QX314 and were, therefore, independent of voltage-sensitive sodium channels (Fig. 7) (t test, p > 0.1; n = 21). The average size of the near-threshold EPSP in the tuft was 16.2 ± 0.7 mV, the time to peak was 3.0 ± 0.3 ms, and the time at which EPSP falls to one half of its amplitude was 12.2 ± 0.8 ms (n = 21). The summary result, shown in Figure 7A, indicates that the peak amplitude of the EPSP decreased on average by ∼30% in 300 μm. Because the average length of the primary dendrite was 350 μm, it is clear that the EPSP evoked in the tuft reached the cell body with modest attenuation. This level of attenuation, corresponding to mean apparent “length constant” of ∼1200 μm, was not different from the attenuation determined previously (Djurisic at al., 2004) at room temperature (Fig. 7B).
Figure 7.

Attenuation of the EPSP along the primary dendrite. A, Relative EPSP peak amplitude in the primary dendrite as a function of distance from the center of the tuft for control and QX314-treated cells. The prediction from the passive model is included on the same graph. B, Comparison of EPSP attenuation between control and QX314 measurements at 22–24°C and at 33–36°C. Differences are not significant (t test; for control vs QX314 at 22–24°C, p > 0.7; for control vs QX314 at 33–36°C, p > 0.1; for control 22–24°C vs 33–36°C, p > 0.4; for QX314 22–24°C vs 33–36°C, p > 0.8).
Modeling
AP amplitude in the dendritic tuft
The calibration of optical EPSP signals in terms of membrane potential rests on the assumption that the amplitude of an action potential in thin dendritic branches in the tuft (in which electrical recording is not possible) is uniform and has the same value as in the trunk of the primary dendrite. We used modeling to determine the upper limits for possible errors that could be introduced if this assumption is not valid. The results of the present simulation improved our previous analysis (Djurisic et al., 2004) by including optimized passive parameters (Popovic et al., 2005) and by modeling synaptic inputs with time-varying conductance changes based on an EPSP recorded optically from the tuft at near-physiological temperature (see Materials and Methods). The amplitude of the action potential in the tuft was determined in the model for two extreme cases: fully passive (no voltage-sensitive channels included) and fully excitable dendritic tuft branches (uniform distribution of the full complement of both sodium and potassium channels) (supplemental Fig. 2, available at www.jneurosci.org as supplemental material). In the hypothetical case of fully passive tuft branches, the action potential amplitude declined with distance from the origin of the tuft, but the attenuation of the spike was relatively weak (the peak AP amplitude declined by less 20% of the control amplitude in most of tuft compartments). In the case of fully excitable tuft branches, the model showed that, despite the uniform distribution of voltage-sensitive channels, the action potential amplitude in some regions of the tuft was up to 10% larger than the control spike at the origin of the tuft. This was an effect of an action potential propagating into the fully excitable sealed cables. We conclude that the spike amplitude is likely to be augmented in the tuft and that this effect is likely to be smaller than 10% of the control value in the most distal branches and substantially smaller in more proximal tuft regions. This effect would cause a relatively small underestimate in calibrating optical signals and was neglected.
Spatial distribution of the near-threshold EPSP in the dendritic tuft
We modeled the synaptic innervation pattern of the tuft to analyze the implications of the experimental result that activation of a subset of input synapses at subthreshold intensity resulted in a uniform EPSP response in the entire dendritic tuft. We started by estimating the total number of excitatory synapses made by olfactory receptor neuron axon terminals on the dendritic tuft of a mitral cell. There are no quantitative data on this subject in the literature. We estimated, using indirect anatomical data, that the total number of excitatory synapses on one tuft is in the range of 460–1500. This range is derived from reported approximate values for the total number of olfactory receptor axons per glomerulus (5000–12,000 in rodents), the total number of synapses formed by an individual axon (15–20), and the total number of dendritic tufts (∼160), including all mitral and tufted cells and 20% of periglomerular neurons innervated by olfactory nerve axons in a single glomerulus (Halasz and Greer, 1993; Klenoff and Greer, 1998; Shepherd, 2004; Wachowiak and Shipley, 2006) (Charles Greer, personal communication). These numbers should be considered as a first approximation because anatomical data are incomplete and in some cases inconsistent (Shepherd, 2004). Also, anatomical data concerning synaptic organization of the dendritic tuft are qualitative and, thus far, could not provide definitive support for the existence of functional subcompartments. The evidence that olfactory nerve terminals forming synaptic contacts on the dendritic tuft of mitral cells are spatially segregated to the most distal tips of dendritic branches (Kasowski et al., 1999) has been contradicted by more recent studies indicating mosaic distribution (Kosaka et al., 2001; Kosaka and Kosaka, 2005). In the absence of direct evidence for inhomogeneous distribution of synapses, we assumed that synapses are distributed uniformly on all dendritic branches in the tuft.
Despite these uncertainties, it is clear that the convergence of the olfactory nerve axons onto individual glomerular tufts is very high. Thus, it is plausible to assume that electrical stimulation of the ON nerve could activate a relatively large number of individual synapses on a dendritic tuft.
The olfactory nerve stimulation applied in our measurements activated an unknown number of synapses innervating one tuft; thus, this was a free parameter in the model. To determine how spatial distribution of the EPSP peak amplitude depends on the number and spatial distribution of activated synapses, we generated six sets of 1000 simulations, each set with a different number of activated synapses (10, 20, 40, 100, 200, or 400). The standard number of simulations (1000) was determined empirically as the number of runs that, when repeated many times, produced a stable average result with 95% confidence interval for the mean. The activated synapses were randomly distributed over the whole tuft in each individual run within a series. The probability of innervation of each of 111 tuft compartments in the model was proportional to the surface area of the compartment, so some compartments may have multiple innervations. The random distribution of synapses is justified by the fact that we had no control over which synapses are activated in an individual experiment. Each simulation within a series resulted in a specific spatial distribution of EPSP amplitudes in the tuft.
The purpose of modeling was to (1) determine the fraction of simulation runs with random distribution of a given number of synapses that show uniform distribution of the EPSP peak amplitude (within limits of our resolution) and (2) determine how fraction of simulations with uniform EPSP distribution depends on the number of activated synapses. The rationale of this approach is based on the experimental result showing uniform EPSP distribution in all measurements. We wanted to determine the number of synapses in the model that will produce a similar result.
In each individual run, the model randomly determined the position of a given number of synapses (Fig. 8A,B, dots on the morphological reconstruction of the tuft and on the dendrogram derived from that reconstruction). The synapses were simultaneously activated and the EPSP signal was calculated for each dendritic compartment. As an example, signals from multiple compartments are shown in Figure 8C. From these data, the cumulative membrane area plot (D) shows, for any point (x, y), the fraction of the total dendritic membrane area (y) that has peak depolarization less than x.
Figure 8.

Modeling of the spatial distribution of EPSP amplitudes in mitral cell glomerular tuft. A, Anatomical reconstruction of a dendritic tuft with random distribution of synapses. B, Location of randomly distributed synapses on the dendrogram of a mitral cell tuft obtained in one simulation run. C, Time course of an EPSP from multiple locations. D, Cumulative membrane area versus EPSP amplitude plot for one simulation run. E, Fraction of runs with 90% of membrane area within a given peak depolarization range span versus peak depolarization range span. F, The percentage of random synaptic distribution patterns with uniform EPSP amplitude distribution versus the number of activated synapses.
After these data were generated for all random patterns of a given number of activated synapses, we determined the percentage of simulation runs in which 90% of membrane area had the peak depolarization within a certain voltage range. This relationship is plotted for simulation series with 10, 40, and 100 synapses in Figure 8E. We classified the distribution of the peak EPSP amplitude in an individual simulation as uniform if >90% of the membrane area was within a voltage range span of 3 mV, because this was the limit of signal amplitude resolution in our measurements. The results showed that the random innervation of the tuft with 10 synapses (Fig. 8E) produced uniform distribution of the EPSP amplitude in only 59% of runs. This result clearly indicated that the uniform EPSP distribution found experimentally cannot be explained by synchronous activation of a relatively small number (∼10) of synapses. Increasing the number of activated synapses increased the percentage of runs with uniform EPSP distribution. Random innervation with 20, 40, and 100 synapses increased the percentage of runs with uniform distribution to 79, 89, and 98%, respectively. Further increase in the number of synapses (200 and 400) had very little additional effect. The relationship between the percentage of runs with uniform EPSP distribution and the number of activated synapses is shown in Figure 8F. From the combined experimental results and modeling data, we conclude that the glomerular tuft can best be described as a single electrical compartment when activated by an EPSP of the amplitude sufficiently large to be detected by voltage imaging. The uniform distribution of the EPSP in the tuft is mediated by simultaneous activation of a large number of synapses, conditionally estimated at 100 or more (see Discussion).
Attenuation of the subthreshold EPSP in the primary dendrite
Computer simulations were used to test whether the geometry and passive electrical properties of the primary dendrite would account for the recorded attenuation of the EPSP in the primary dendrite. An EPSP signal of near-threshold intensity was simulated in the tuft and the peak EPSP depolarization plotted as a function of distance along the primary dendrite (Fig. 7, open squares). The results show that the model prediction based on passive spread of the EPSP approximated very closely experimentally recorded attenuation. In the model, the degree of voltage attenuation was sensitive to the diameter of the primary dendrite and to the number, position, and diameter of secondary dendrites (data not shown). The variability in these parameters could account for recorded cell-to-cell variations in the degree of EPSP attenuation.
Discussion
The main finding of our study is that the glomerular tuft of the primary dendrite functions as a uniform electrical compartment when activated by a single subthreshold EPSP within a wide range of amplitudes starting with the smallest EPSP detectable by voltage imaging. The computer model indicated that the uniform spatial distribution of the EPSP required a synchronized activation of ∼100 synapses randomly distributed in the tuft. Furthermore, we found that the dendritic voltage attenuation of the EPSP at near-physiological temperature is weak compared with other neuronal classes and could be accounted for by the geometry and passive electrical properties of the mitral cell.
Uniform distribution of subthreshold EPSP
Before our measurements, no information was available about spatial distribution of the evoked EPSPs in the dendritic tuft. We determined that the single subthreshold EPSP within a wide range of amplitudes depolarizes the whole dendritic tuft uniformly; no evidence was found for independent electrical subcompartments. For technical reasons, it was not possible to test experimentally the likely possibility that even weaker stimulation of the sensory input, down to several unitary synaptic responses, would result in spatially restricted subthreshold Vm transients. This possibility would be important to explore in the future with improved sensitivity because the dynamic range of olfactory receptor neurons spans many orders of magnitude, and a wide range of odor concentrations support olfactory discrimination behavior (Wilson and Mainen, 2006). Thus, the possibility that, in vivo, many asynchronous, small, and localized EPSPs can summate in the tuft to produce spiking in response to near-threshold odor concentrations cannot be excluded by our study.
We used modeling techniques to show that uniform distribution of the EPSP implies simultaneous activation of a large number of synapses, estimated at 100 or more. This modeling result depends on the assumption that the biophysical properties of the dendritic arbor and the number and the spatial distribution of activated synapses are the only determinants of the subthreshold electrical response in the dendritic tuft. In the case of single subthreshold EPSP, this assumption is probably justified. Two additional mechanisms, however, might contribute to the spatial uniformity of the tuft response. First, the glutamate spillover from activated synapses mediates a diffuse action of the transmitter that tends to synchronize mitral cells by recurrent intraglomerular interactions among dendritic tufts (Jahr and Nicoll, 1980; Isaacson, 1999; Carlson et al., 2001; Schoppa and Westbrook, 2001). Second, several gap junction connexins are expressed in mitral cells (Belluardo et al., 2000; Zhang and Restrepo, 2002; Bennett and Zukin, 2004), and direct coupling through electrical connections on dendritic tufts of mitral cells that project to the same glomerulus has been reported (Schoppa and Westbrook, 2002; Bennett and Zukin, 2004). Both of these mechanisms tend to synchronize the responses of all mitral cells in the same glomerulus and could also make the response of individual dendritic tufts more spatially uniform. Thus, qualitatively, the addition of these mechanisms to the model would reduce the number of activated synapses that are necessary to produce a uniform electrical response in the tuft. However, the quantitative contribution of these mechanisms to the spatial uniformity of a single subthreshold EPSP is likely to be subtle and difficult to measure with presently available tools. At the same time, the electrical response in the tuft evoked by high-frequency repetitive activation of the olfactory nerve (Yuan and Knopfel, 2006b) would probably be influenced more by intraglomerular interactions between mitral cells. The repetitive stimulation of the olfactory nerve, however, evoked complex responses (data not shown) that vary from trial to trial and could not be averaged coherently to improve the signal-to-noise ratio. These events can only be studied by recording individual trials. Such measurements, presently precluded by insufficient sensitivity of voltage imaging, must await further methodological improvements.
Our results emphasize how functional structure of a dendritic tree depends critically on the number and spatial distribution of synapses that constitute the natural input to a neuron. A number of studies on signal processing in dendrites indicated that the division of the dendritic arbor into functional subcompartments might be of primary importance (Hausser and Mel, 2003; Spruston and Kath, 2004). For example, a set of elegant experiments on basal dendrites of neocortical pyramidal neurons (Schiller et al., 2000; Ariav et al., 2003) provided strong evidence that each terminal dendritic branch, under their experimental conditions, acts as a computational subunit summing synaptic inputs in a nonlinear manner (Polsky et al., 2004). Similar results were reported recently for the oblique dendrites of hippocampal CA1 pyramidal neurons (Losonczy and Magee, 2006). Also, experiments on CA1 pyramidal neurons suggested that changes in the synaptic strength and dendritic excitability can be highly localized if the input is localized (Magee and Johnston, 1997; Wei et al., 2001; Cai et al., 2004; Canepari et al., 2007). By analogy, these results suggest that the anatomically complex dendritic tuft of mitral cells might be functionally subdivided. Our experiments, however, showed that subthreshold EPSP Vm signals in the tuft are spatially uniform. In agreement with our results, in vivo experiments demonstrated clearly that, under physiological conditions, practically all inputs to the tuft are always activated in unison if a given glomerulus responds to an odor applied at a near-threshold to near-saturating concentration. Thus, it seems plausible that the innervation pattern is designed so that the dendritic tuft of every mitral cell in a given glomerulus is essentially “space clamped” when the synaptic input of threshold intensity is activated by an odor.
It is interesting to consider the possibility that the differences between mitral cell dendritic tuft and the dendrites of other neurons in which independent processing units have been identified (Schiller et al., 2000; Ariav et al., 2003; Gasparini and Magee, 2006; Losonczy and Magee, 2006) might actually be based more on differences in the spatiotemporal pattern of input synaptic activity than on differences in dendritic properties. The experimental evidence in support of this view, however, is not available because the spatiotemporal pattern of synaptic activity that constitute the natural input to cortical and hippocampal pyramidal neurons is not known.
Our results, showing that the anatomically complex dendritic tufts function as a single electrical compartment for the subthreshold input, have implications for the overall organization of the glomeruli. The available evidence indicates that the glomeruli are the smallest functional units in the representation of odor information at the level of input activity of olfactory receptor neurons (Aungst et al., 2003; Wachowiak and Shipley, 2006). It was not clear, however, whether the glomeruli are functionally subdivided at the level of postsynaptic components. Our results argue against this possibility, at least for a range of subthreshold EPSPs that are large enough to be detectable optically.
Spatial distribution of EPSP-related Ca2+ signal
We found that Ca2+ signals related to spatially uniform membrane potential transients were also widespread and present in all parts of the tuft. This result is in agreement with in vivo measurements showing widespread activation of synapses whenever a given glomerulus responds to an odor (Wachowiak et al., 2004). It appears that the electrical stimulation of the main axonal bundle innervating the appropriate glomerulus in our experiments approximated these in vivo conditions.
In our experiments, Ca2+ signals in the tuft were comparable but not identical in amplitude in all regions. The average range of normalized Ca2+-signal amplitudes from different locations on distal dendritic branches was relatively narrow (73–100%). This range was not affected in a systematic way by correcting the data for differences in the surface-to-volume ratio between different tuft branches. This result indicates that the diameter of distal dendritic branches is relatively uniform, a conclusion well supported by anatomical studies (Kasowski et al., 1999). Substantially larger regional differences in Ca2+-signal amplitudes were reported for mitral cells in mice in both the accessory olfactory bulb (Urban and Castro, 2005) and in the main olfactory bulb (Yuan and Knopfel, 2006a). The reasons for this discrepancy are unclear, but differences in methodological details could conceivably be important. First, species-related variations (rat vs mice) in the anatomy of the primary dendrite and its tuft may play an important role. Second, possible differences in the intensity and localization of the olfactory nerve stimulus combined with complex differences in calcium measurements with different concentrations of different indicators [bis-fura-2 vs Calcium Orange (Urban and Castro, 2005) vs Oregon Green-488 BAPTA-1 (Yuan and Knopfel, 2006a)] make the comparison of the results from different studies difficult. Clearly, additional experiments are needed to clarify this point.
Attenuation of EPSPs in the primary dendrite
The recorded EPSP attenuation in the primary dendrite (apparent length constant of ∼1200 μm) is weak compared with other classes of neurons and likely to play a significant role in signal processing, as discussed by Djurisic et al. (2004).
Footnotes
This work was supported by National Institutes of Health Grant NS4273. We are grateful to Leslie Loew and Joe Wuskel for kindly providing dyes and to Larry Cohen and Brad Baker for helpful comments on this manuscript.
References
- Ariav G, Polsky A, Schiller J. Submillisecond precision of the input-output transformation function mediated by fast sodium dendritic spikes in basal dendrites of CA1 pyramidal neurons. J Neurosci. 2003;23:7750–7758. doi: 10.1523/JNEUROSCI.23-21-07750.2003. [DOI] [PMC free article] [PubMed] [Google Scholar]
- Aungst JL, Heyward PM, Puche AC, Karnup SV, Hayar A, Szabo G, Shipley MT. Centre–surround inhibition among olfactory bulb glomeruli. Nature. 2003;426:623–629. doi: 10.1038/nature02185. [DOI] [PubMed] [Google Scholar]
- Belluardo N, Mudò G, Trovato-Salinaro A, Le Gurun S, Charollais A, Serre-Beinier V, Amato G, Haefliger JA, Meda P, Condorelli DF. Expression of connexin36 in the adult and developing rat brain. Brain Res. 2000;865:121–138. doi: 10.1016/s0006-8993(00)02300-3. [DOI] [PubMed] [Google Scholar]
- Bennett MV, Zukin RS. Electrical coupling and neuronal synchronization in the mammalian brain. Neuron. 2004;41:495–511. doi: 10.1016/s0896-6273(04)00043-1. [DOI] [PubMed] [Google Scholar]
- Bischofberger J, Jonas P. Action potential propagation into the presynaptic dendrites of rat mitral cells. J Physiol (Lond) 1997;504:359–365. doi: 10.1111/j.1469-7793.1997.359be.x. [DOI] [PMC free article] [PubMed] [Google Scholar]
- Cai X, Liang CW, Muralidharan S, Kao YP, Tang CM, Thompson SM. Unique roles of SK and Kv4.2 potassium channels in dendritic integration. Neuron. 2004;44:351–364. doi: 10.1016/j.neuron.2004.09.026. [DOI] [PubMed] [Google Scholar]
- Canepari M, Djurisic M, Zecevic D. Dendritic signals from rat hippocampal CA1 pyramidal neurons during coincident pre- and post-synaptic activity: a combined voltage- and calcium-imaging study. J Physiol (Lond) 2007;580:463–484. doi: 10.1113/jphysiol.2006.125005. [DOI] [PMC free article] [PubMed] [Google Scholar]
- Carlson GC, Shipley MT, Keller A. Long-lasting depolarizations in mitral cells of the rat olfactory bulb. J Neurosci. 2001;20:2011–2021. doi: 10.1523/JNEUROSCI.20-05-02011.2000. [DOI] [PMC free article] [PubMed] [Google Scholar]
- Charpak S, Mertz J, Beaurepaire E, Moreaux L, Delaney K. Odor-evoked calcium signals in dendrites of rat mitral cells. Proc Natl Acad Sci USA. 2001;98:1230–1234. doi: 10.1073/pnas.021422798. [DOI] [PMC free article] [PubMed] [Google Scholar]
- Chen WR, Shepherd GM. Membrane and synaptic properties of mitral cells in slices of rat olfactory bulb. Brain Res. 1997;745:189–196. doi: 10.1016/s0006-8993(96)01150-x. [DOI] [PubMed] [Google Scholar]
- Chen WR, Midtgaard J, Shepherd GM. Forward and backward propagation of dendritic impulses and their synaptic control in mitral cells. Science. 1997;278:463–467. doi: 10.1126/science.278.5337.463. [DOI] [PubMed] [Google Scholar]
- Debarbieux F, Audinat E, Charpak S. Action potential propagation in dendrites of rat mitral cells in vivo. J Neurosci. 2003;23:5553–5560. doi: 10.1523/JNEUROSCI.23-13-05553.2003. [DOI] [PMC free article] [PubMed] [Google Scholar]
- Djurisic M, Antic S, Chen WR, Zecevic D. Voltage imaging from dendrites of mitral cells: EPSP attenuation and spike trigger zones. J Neurosci. 2004;24:6703–6714. doi: 10.1523/JNEUROSCI.0307-04.2004. [DOI] [PMC free article] [PubMed] [Google Scholar]
- Gasparini S, Magee JC. State-dependent dendritic computation in hippocampal CA1 pyramidal neurons. J Neurosci. 2006;26:2088–2100. doi: 10.1523/JNEUROSCI.4428-05.2006. [DOI] [PMC free article] [PubMed] [Google Scholar]
- Halasz N, Greer CA. Terminal arborizations of olfactory nerve fibers in the glomeruli of the olfactory bulb. J Comp Neurol. 1993;337:307–316. doi: 10.1002/cne.903370211. [DOI] [PubMed] [Google Scholar]
- Hausser M, Mel B. Dendrites: bug or feature? Curr Opin Neurobiol. 2003;13:372–383. doi: 10.1016/s0959-4388(03)00075-8. [DOI] [PubMed] [Google Scholar]
- Hines ML, Carnevale NT. NEURON: a tool for neuroscientists. The Neuroscientist. 2001;7:123–135. doi: 10.1177/107385840100700207. [DOI] [PubMed] [Google Scholar]
- Hodgkin AL, Huxley AF. Currents carried by sodium and potassium ions through the membrane of the giant axon of Loligo. J Physiol (Lond) 1952;116:449–472. doi: 10.1113/jphysiol.1952.sp004717. [DOI] [PMC free article] [PubMed] [Google Scholar]
- Isaacson JS. Glutamate spillover mediates excitatory transmission in the rat olfactory bulb. Neuron. 1999;23:377–384. doi: 10.1016/s0896-6273(00)80787-4. [DOI] [PubMed] [Google Scholar]
- Jaffe DB, Carnevale NT. Passive normalization of synaptic integration influenced by dendritic architecture. J Neurophysiol. 1999;82:3268–3285. doi: 10.1152/jn.1999.82.6.3268. [DOI] [PubMed] [Google Scholar]
- Jahr CE, Nicoll RA. Dendrodendritic inhibition: demonstration with intracellular recording. Science. 1980;207:1473–1475. doi: 10.1126/science.7361098. [DOI] [PubMed] [Google Scholar]
- Kasowski HJ, Kim H, Greer CA. Compartmental organization of the olfactory bulb glomerulus. J Comp Neurol. 1999;407:261–274. [PubMed] [Google Scholar]
- Klenoff JR, Greer CA. Postnatal development of olfactory receptor cell axonal arbors. J Comp Neurol. 1998;390:256–267. [PubMed] [Google Scholar]
- Kosaka K, Kosaka T. Synaptic organization of the glomerulus in the main olfactory bulb: compartments of the glomerulus and heterogeneity of the periglomerular cells. Anat Sci Int. 2005;80:80–90. doi: 10.1111/j.1447-073x.2005.00092.x. [DOI] [PubMed] [Google Scholar]
- Kosaka K, Aika Y, Toida K, Kosaka T. Structure of intraglomerular dendritic tufts of mitral cells and their contacts with olfactory nerve terminals and calbindin-immunoreactive type 2 periglomerular neurons. J Comp Neurol. 2001;440:219–235. doi: 10.1002/cne.1381. [DOI] [PubMed] [Google Scholar]
- Losonczy A, Magee JC. Integrative properties of radial oblique dendrites in hippocampal CA1 pyramidal neurons. Neuron. 2006;50:291–307. doi: 10.1016/j.neuron.2006.03.016. [DOI] [PubMed] [Google Scholar]
- Loew LM, Cohen LB, Dix J, Fluhler EN, Montana V, Salama G, Wu JY. A naphthyl analog of the aminostyryl pyridinium class of potentiometric membrane dyes shows consistent sensitivity in a variety of tissue, cell and model membrane preparations. J Membr Biol. 1992;130:1–10. doi: 10.1007/BF00233734. [DOI] [PubMed] [Google Scholar]
- Magee JC, Johnston D. A synaptically controlled, associative signal for Hebbian plasticity in hippocampal neurons. Science. 1997;275:209–213. doi: 10.1126/science.275.5297.209. [DOI] [PubMed] [Google Scholar]
- Maravall M, Mainen ZF, Sabatini BL, Svoboda K. Estimating intracellular calcium concentrations and buffering without wavelength ratioing. Biophys J. 2000;78:2655–2667. doi: 10.1016/S0006-3495(00)76809-3. [DOI] [PMC free article] [PubMed] [Google Scholar]
- Mel BW. Synaptic integration in an excitable dendritic tree. J Neurophysiol. 1993;70:1086–1101. doi: 10.1152/jn.1993.70.3.1086. [DOI] [PubMed] [Google Scholar]
- Pinching AJ, Powell TP. The neuropil of the glomeruli of the olfactory bulb. J Cell Sci. 1971;9:347–377. doi: 10.1242/jcs.9.2.347. [DOI] [PubMed] [Google Scholar]
- Polsky A, Mel BW, Schiller J. Computational subunits in thin dendrites of pyramidal cells. Nat Neurosci. 2004;7:621–627. doi: 10.1038/nn1253. [DOI] [PubMed] [Google Scholar]
- Popovic M, Djurisic M, Zecevic D. Determinants of low EPSP attenuation in primary dendrites of mitral cells: modeling study. Ann NY Acad Sci. 2005;1048:344–348. doi: 10.1196/annals.1342.033. [DOI] [PubMed] [Google Scholar]
- Ross WN, Salzberg BM, Cohen LB, Grinvald A, Davila HV, Waggoner AS, Wang CH. Changes in absorption, fluorescence, dichroism, and birefringence in stained giant axons: optical measurement of membrane potential. J Membr Biol. 1977;33:141–183. doi: 10.1007/BF01869514. [DOI] [PubMed] [Google Scholar]
- Schiller J, Major G, Koester HJ, Schiller Y. NMDA spikes in basal dendrites of cortical pyramidal neurons. Nature. 2000;404:285–289. doi: 10.1038/35005094. [DOI] [PubMed] [Google Scholar]
- Schoppa NE, Westbrook GL. Glomerulus-specific synchronization of mitral cells in the olfactory bulb. Neuron. 2001;31:639–651. doi: 10.1016/s0896-6273(01)00389-0. [DOI] [PubMed] [Google Scholar]
- Schoppa NE, Westbrook GL. AMPA autoreceptors drive correlated spiking in olfactory bulb glomeruli. Nat Neurosci. 2002;5:1194–1202. doi: 10.1038/nn953. [DOI] [PubMed] [Google Scholar]
- Shen GY, Chen WR, Midtgaard J, Shepherd GM, Hines ML. Computational analysis of action potential initiation in mitral cell soma and dendrites based on dual patch recordings. J Neurophysiol. 1999;82:3006–3020. doi: 10.1152/jn.1999.82.6.3006. [DOI] [PubMed] [Google Scholar]
- Shepherd G. In: The synaptic organization of the brain. Shepherd GM, editor. New York: Oxford UP; 2004. [Google Scholar]
- Spruston N, Kath W. Dendritic arithmetic. Nat Neurosci. 2004;7:567–569. doi: 10.1038/nn0604-567. [DOI] [PubMed] [Google Scholar]
- Urban NN, Castro JB. Tuft calcium spikes in accessory olfactory bulb mitral cells. J Neurosci. 2005;25:5024–5028. doi: 10.1523/JNEUROSCI.0297-05.2005. [DOI] [PMC free article] [PubMed] [Google Scholar]
- Wachowiak M, Shipley MT. Coding and synaptic processing of sensory information in the glomerular layer of the olfactory bulb. Semin Cell Dev Biol. 2006;17:411–423. doi: 10.1016/j.semcdb.2006.04.007. [DOI] [PubMed] [Google Scholar]
- Wachowiak M, Denk W, Friedrich RW. Functional organization of sensory input to the olfactory bulb glomerulus analyzed by two-photon calcium imaging. Proc Natl Acad Sci USA. 2004;101:9097–9102. doi: 10.1073/pnas.0400438101. [DOI] [PMC free article] [PubMed] [Google Scholar]
- Wei DS, Mei YA, Bagal A, Kao JP, Thompson SM, Tang CM. Compartmentalized and binary behavior of terminal dendrites in hippocampal pyramidal neurons. Science. 2001;293:2272–2275. doi: 10.1126/science.1061198. [DOI] [PubMed] [Google Scholar]
- Williams SR. Encoding and decoding of dendritic excitation during active states in pyramidal neurons. J Neurosci. 2005;25:5894–5902. doi: 10.1523/JNEUROSCI.0502-05.2005. [DOI] [PMC free article] [PubMed] [Google Scholar]
- Wilson RI, Mainen ZF. Early events in olfactory processing. Annu Rev Neurosci. 2006;29:163–201. doi: 10.1146/annurev.neuro.29.051605.112950. [DOI] [PubMed] [Google Scholar]
- Wu JY, Cohen LB. Fast multisite optical measurement of membrane potential. In: Mason WT, editor. A practical guide to technology for quantitative real-time analysis. New York: Academic; 1993. pp. 389–404. [Google Scholar]
- Yasuda R, Nimchinsky EA, Scheuss V, Pologruto TA, Oertner TG, Sabatini BL, Svoboda K. Imaging calcium concentration dynamics in small neuronal compartments. Sci STKE. 2004;219:l5. doi: 10.1126/stke.2192004pl5. [DOI] [PubMed] [Google Scholar]
- Yuan Q, Knopfel T. Olfactory nerve stimulation-induced calcium signaling in the mitral cell distal dendritic tuft. J Neurophysiol. 2006a;95:2417–2426. doi: 10.1152/jn.00964.2005. [DOI] [PubMed] [Google Scholar]
- Yuan Q, Knopfel T. Olfactory nerve stimulation-evoked mGluR1 slow potentials, oscillations, and calcium signaling in mouse olfactory bulb mitral cells. J Neurophysiol. 2006b;95:3097–3104. doi: 10.1152/jn.00001.2006. [DOI] [PubMed] [Google Scholar]
- Zecevic D. Multiple spike-initiation zones in single neurons revealed by voltage-sensitive dyes. Nature. 1996;381:322–325. doi: 10.1038/381322a0. [DOI] [PubMed] [Google Scholar]
- Zhang C, Restrepo D. Expression of connexin 45 in the olfactory system. Brain Res. 2002;929:37–47. doi: 10.1016/s0006-8993(01)03372-8. [DOI] [PubMed] [Google Scholar]
- Zhou Z, Xiong W, Zeng S, Xia A, Shepherd GM, Greer CA, Chen WR. Dendritic excitability and calcium signalling in the mitral cell distal glomerular tuft. Eur J Neurosci. 2006;24:1623–1632. doi: 10.1111/j.1460-9568.2006.05076.x. [DOI] [PubMed] [Google Scholar]