

Abstract
Our ability to perceive weak signals is correlated among consecutive trials and fluctuates slowly over time. Although this “streaking effect” has been known for decades, the underlying neural network phenomena have remained largely unidentified. We examined the dynamics of human behavioral performance and its correlation with infraslow (0.01–0.1 Hz) fluctuations in ongoing brain activity. Full-band electroencephalography revealed prominent infraslow fluctuations during the execution of a somatosensory detection task. Similar fluctuations were predominant also in the dynamics of behavioral performance. The subjects' ability to detect the sensory stimuli was strongly correlated with the phase, but not with the amplitude of the infraslow EEG fluctuations. These data thus reveal a direct electrophysiological correlate for the slow fluctuations in human psychophysical performance. We then examined the correlation between the phase of infraslow EEG fluctuations and the amplitude of 1–40 Hz neuronal oscillations in six frequency bands. Like the behavioral performance, the amplitudes in these frequency bands were robustly correlated with the phase of the infraslow fluctuations. These data hence suggest that the infraslow fluctuations reflect the excitability dynamics of cortical networks. We conclude that ongoing 0.01–0.1 Hz EEG fluctuations are prominent and functionally significant during execution of cognitive tasks.
Keywords: slow oscillation, EEG, alpha, attention, gamma, somatosensory, synchrony
Introduction
The psychophysical performance of human subjects often fluctuates in time scales exceeding 10 s (Verplanck et al., 1952; Gilden et al., 1995). These slow fluctuations are seen as trial-to-trial correlations and clustering in behavioral performance. The variance of several behavioral measures also increases in larger time scales, which is typical of 1/f-type or scale-free dynamics (Gilden et al., 1995). So far, the neuronal network phenomena underlying slow behavioral fluctuations have remained unidentified.
Many cognitive functions are often correlated with >1 Hz neuronal oscillatory activity (Tallon-Baudry and Bertrand, 1999; Palva and Palva, 2007). The amplitudes of 5–20 Hz oscillations are autocorrelated over tens to hundreds of seconds (Linkenkaer-Hansen et al., 2001; Linkenkaer-Hansen et al., 2005), and their amplitude dynamics show 1/f-type power distributions both in human (Linkenkaer-Hansen et al., 2001) and monkey (Leopold et al., 2003) cortex. These oscillations thus have slow fluctuations and autocorrelations similar to those found for human psychophysical performance.
Whereas the slow modulation of EEG activities is readily detected using conventional EEG technology, oscillatory activities in the time scales of psychophysical performance fluctuations, i.e., at frequencies <0.1 Hz, can be measured with direct-current-coupled full-band electroencephalography (FbEEG) (Vanhatalo et al., 2005). So far, infraslow (0.01–0.1 Hz) EEG fluctuations (ISFs) have been described in adult subjects during sleep (Marshall et al., 1998; Vanhatalo et al., 2004). These fluctuations were suggested to reflect gross cortical excitability akin to the alternating active and silent states described in in vivo recordings of experimental animals (Steriade et al., 1993). Infraslow EEG shifts can be induced in awake humans with voluntary hyperventilation (Voipio et al., 2003) or using maneuvers affecting brain hemodynamics (Vanhatalo et al., 2003). Infraslow EEG shifts are also associated with epileptic activity (Ikeda et al., 1999). However, the functional significance of ISFs in task-engaged subjects has remained unexplored.
We asked whether the endogenous 0.01–0.1 Hz ISFs could underlie the slow fluctuations in human psychophysical performance. In this study, we quantify behavioral dynamics in an uncued somatosensory detection task, and use concurrent FbEEG recordings to address the presence of ISFs and explore their temporal correlation with behavioral performance. Finally, we assess the physiological significance of ISFs by characterizing their correlation with the amplitude dynamics of 1–40 Hz neuronal oscillations.
Materials and Methods
Data acquisition and task.
Eleven subjects (seven female; 22–34 years) participated in the study with written informed consent. The study was approved by the Ethical Committee of the Helsinki University Central Hospital.
We recorded EEG with a direct-current-coupled amplifier (Elekta Neuromag) at Fpz and Cz locations of the 10–20 system and at the right mastoid, referenced to the left mastoid. We used custom-made Ag/AgCl electrodes placed on short-circuited skin; for details of the recording procedure, see Voipio et al. (2003) and Vanhatalo et al. (2004). Each subject participated in two 30 min sessions. In addition to EEG, we recorded electromyography (EMG) above abductor/flexor pollicis brevis. The data were low-pass filtered at 200 Hz and sampled at 600 Hz.
We delivered somatosensory stimuli with a constant-current stimulator (Lucius and Baer) and plate electrodes at random 1.5–4.5 s intervals to the distal part of the right index finger. Subjects were instructed to respond to detected stimuli by twitching the right thumb, and keep eyes closed during the measurement. We adjusted the stimulus current iteratively before each session so that the detection rate was ∼50% (stimulus current, 4.3 ± 0.6 mA, mean ± SD; stimulus duration, 0.2 ms).
Data analysis.
We extracted the subjects' responses and reaction times by bandpass filtering the EMG data to 50–150 Hz, transforming the amplitude of the signal to a z-score, and finding the first poststimulus crossing of z = 2 threshold. We classified the trials with a response in 0.1–1.5 s poststimulus interval as hits and the rest as misses. Clustering of performance was evaluated with analysis of “runs,” i.e., time periods with responses of one type. The length and number of runs was contrasted to random data. We also computed the probability of a run as a function of its length. Furthermore, we evaluated behavioral autocorrelations with the autocorrelation function, and with detrended fluctuation analysis (DFA), which is a method to quantify long-range temporal correlations and power-law scaling in complex nonstationary time series (Peng et al., 1995). For these analyses, the hit–miss time series was coded to a signal of ones and zeros. Statistical significance between measured and random data were assessed with the nonparametric paired Wilcoxon signed-rank test, and was Bonferroni corrected. Random behavioral data were prepared by both a parameter-matched Bernoulli process and data shuffling.
The real part, ReISF, of ISF was extracted from the FbEEG recordings by using bandpass filtering at 0.01–0.1 Hz (see Fig. 2A). Its amplitude, AISF, and phase, θISF, (see Fig. 2B) were obtained with the Hilbert transform H so that AISF = [ReISF2 + H(ReISF)2]1/2 and θISF = atan2[ReISF, H(ReISF)]. We computed for each subject 10-bin histograms separately for the ISF amplitude, phase, and real part values obtained at the onsets of the stimuli. The numbers of hits and misses were equalized, and the bins were selected to make their common histograms uniform. The grand average detection probability was obtained by normalizing and averaging individual histograms of hits. We derived limits of 0.5, 5, 95, and 99.5% for the detection probability by chance in any single bin from the cumulative binomial distribution and assessed the statistical significance in each bin with the paired Wilcoxon signed-rank test.
Figure 2.

Infraslow EEG is correlated with task performance. A, Hits (blue) and misses (red) overlaid on FbEEG data (0–200 Hz; gray) and bandpass-filtered ISF (0.01–0.1 Hz; black) from Cz. B, The ISF real part, amplitude (top), and phase (bottom) are shown for part of the data in A. C, Individual power spectra (gray) and the mean power spectrum (black) from Cz in double-logarithmic coordinates.
We addressed the presence of a nested relationship between ISF and 1–40 Hz oscillations in six frequency bands. The center frequencies fc were 1.25, 2.5, 5, 10, 20, and 40 Hz, and the stop frequencies (40 dB attenuation) were 0.5fc and 2fc. The amplitude envelope A(t, fc) of a filtered signal x(t, fc) was estimated using the Hilbert transform H, as above. The phase of A(t, fc), θA(t, fc), was obtained by using bandpass filtering with the ISF filter and by the Hilbert transform as above for θISF. Nested oscillations were quantified as 1:1 phase synchrony between θISF and θA and estimated with the phase-locking factor PLF = |N−1Σeiφ|, where i is the imaginary unit, φ is the phase difference φ = θISF − θA, and N is the number of samples (Vanhatalo et al., 2004; Palva et al., 2005). The statistical significance of PLF was determined by normalizing it with the PLF computed from time-shifted surrogate data, PLFsurr: nPLF = PLF/PLFsurr. Values of nPLF > 1.95 equal to p < 0.05, and nPLF > 2.42 equal to p < 0.01 (Palva et al., 2005). The group-level significance was estimated with the paired Wilcoxon signed-rank test.
Results
We electrically stimulated the subjects' index finger at the threshold of detection and recorded scalp potentials with FbEEG at Fpz, Cz, and the right mastoid. The subjects responded to each detected stimulus with a thumb twitch. The hit rate (HR) across all sessions was 40 ± 14%. Figure 1A displays a representative sample of behavioral data with intermittent clusters of detected (hits) and undetected (misses) stimuli.
Figure 1.

Dynamics of behavioral performance in the detection task is clustered, autocorrelated, and scale-free. A, A representative series of responses with “runs” of consecutive detected (hits; blue) and undetected (misses; red) stimuli. B, Run probability as a function of run length (top) shows that runs of ∼15–100 s are more abundant in real data (black line) than in random data (gray line). The run-length probability follows power-law scaling for runs longer than three trials. The p value (bottom; paired Wilcoxon signed-rank test) is for the difference between real and random data. Gray lines indicate the uncorrected (p = 0.05) and Bonferroni-corrected (n = 6) significance levels. C, Subjects' responses (grand average, black line, top) have stronger autocorrelations than randomized data (gray line). The difference between measured and random data is significant up to the time lag of ∼170 s (bottom; gray line, p = 0.05, paired Wilcoxon signed-rank test). D, DFA reveals that behavioral data display robust scale-free dynamics. The scaling exponent averaged across all sessions is α = 0.71 ± 0.11 (mean ± SD; thin gray lines). For the grand-average data, αμ = 0.65 (black line). For uncorrelated noise, αref = 0.5 (thick gray line).
Dynamics of psychophysical performance
To quantify the fluctuations in task performance, we first estimated the degree of clustering in the behavioral data (12,600 stimuli). We denote an uninterrupted series of hits or misses a “run” (Fig. 1A) and compare the number and length of runs in measured against random data. The number of runs was lower in real than in random data (real, 11.9 ± 3.8 runs per 100 s; random, 14.5 ± 2.9/100 s; p < 0.0002). In addition, the mean run lengths were longer in real than in random data (real, 17.6 ± 6.1 s; random, 14.4 ± 3.5 s; p < 0.0005). The run probability decayed log-log linearly as a function of run length for lengths >15 s, whereas for random data it decreased more steeply (Fig. 1B).
We then estimated the autocorrelation function of the hit–miss time series. The autocorrelations were stronger in real than in random data for time lags up to ∼170 s (Fig. 1C). Additionally, DFA revealed robust autocorrelations and scale-free dynamics in behavioral responses (scaling exponent α = 0.71 ± 0.11, mean ± SD; different at p < 0.001 from the α = 0.5 of white noise, paired Wilcoxon signed-rank test) (Fig. 1D). These data indicate that human performance in a somatosensory detection task exhibits clustering, scale-free dynamics, and autocorrelations in time periods up to at least 100 s.
Infraslow EEG fluctuations are correlated with behavior
We used FbEEG to investigate brain activity fluctuations during task execution. In all recordings, slow large-amplitude fluctuations were conspicuous in full-band data (Fig. 2A). To isolate the ISFs, we bandpass filtered the FbEEG data from 0.01 to 0.1 Hz (Fig. 2A,B) and evaluated the continuous ISF amplitude and phase using the Hilbert transform (Fig. 2B). The total amount of analyzed artifact-free epochs was 444 min (8236 trials) for Fpz and 423 min (7654 trials) for Cz (10 subjects, 18 sessions). We first computed the power spectra of all FbEEG data. In every subject, the EEG power decreased as a function of frequency in an approximately log-log linear (1/fα) manner from 0.005 Hz to 5 Hz, i.e., across three orders of magnitude (Fig. 2C). ISFs are thus a lucid component of the ongoing human EEG during task execution.
To quantify the correlations between behavioral performance and ISF, we estimated the hit probability as a function of ISF and its phase and amplitude, recorded at Fpz (Fig. 3), Cz, and the nonreference mastoid (supplemental Fig. S1, available at www.jneurosci.org as supplemental material). Group statistics, confidence limits from random data, and the data distribution measures (Fig. 3A) indicate that behavioral performance was strongly correlated with the phase of the ISF (Fig. 2). The probability of a hit was greatest during ISF phases of approximately −π/2 (the rising phase) and smallest at ∼π/2 (the falling phase). For the rising and falling phase quartiles, respectively, the grand average HR was 48 ± 5% and 33 ± 4% (mean ± SEM) at Fpz, and 46 ± 7% and 37 ± 7% at Cz. The opposing ISF phases were thus associated with a HR modulation as large as 55 ± 12% (mean ± SEM, at Fpz). The reaction times were not significantly (p > 0.17) different between these ISF phases (rising, 513 ± 120 ms; falling, 549 ± 152 ms).
Figure 3.

Modulation of the detection probability as a function of phase (A), amplitude (B), and real part (C) of ISFs from Fpz. Top, The change in hit probability relative to mean (black line) with ±SEM (gray lines) across subjects. We estimated the statistical significance of hit probability changes for each bin with cumulative binomial distribution values (right, thin horizontal lines). Statistical significance across subjects was estimated with the paired Wilcoxon signed-rank test (bottom). Horizontal lines indicate uncorrected (p = 0.05) and Bonferroni-corrected (n = 10) significance levels. The bins are consecutive 10 percentiles of phase (A), amplitude (B), and real part (C) of ISFs. The axes range from −π to π (A), from zero to the maximum amplitude (B), and from the minimum to the maximum of 0.01–0.1 Hz EEG (C).
Contrary to the ISF phase and HR, the correlation between the ISF amplitude and hit probability was very limited at Fpz (Fig. 3B) and absent at Cz (supplemental Fig. S1, available at www.jneurosci.org as supplemental material). Similarly, the real part of ISF was not significantly correlated with hit probability (Fig. 3C; supplemental Fig. S1, available at www.jneurosci.org as supplemental material). Thus, in these data, the phase was the only prominent EEG correlate in the 0.01–0.1 Hz frequency band for the dynamics of psychophysical performance. However, the behavioral variance unexplained by the ISF phase may be accounted for by >1 Hz oscillations that are well known to be correlated with psychophysical performance.
ISFs are correlated with the amplitude of 1–40 Hz oscillations
Nested oscillations are characterized by a correlation between the phase of a slower and the amplitude of a faster oscillation. We addressed the presence of nested oscillations in our data by estimating phase locking between ISF and the amplitude of neuronal oscillations in six frequencies between 1 and 40 Hz.
The correlations between the ISF phase and the 1–40 Hz amplitudes were highly significant at Fpz (Fig. 4A). Moreover, the phase differences between the ISF and 1–40 Hz amplitude envelopes were consistently approximately −π/2 (Fig. 4B), indicating that the amplitudes were largest in the rising phase of ISF. These data indicate that 1–40 Hz oscillations are nested with the ISF.
Figure 4.
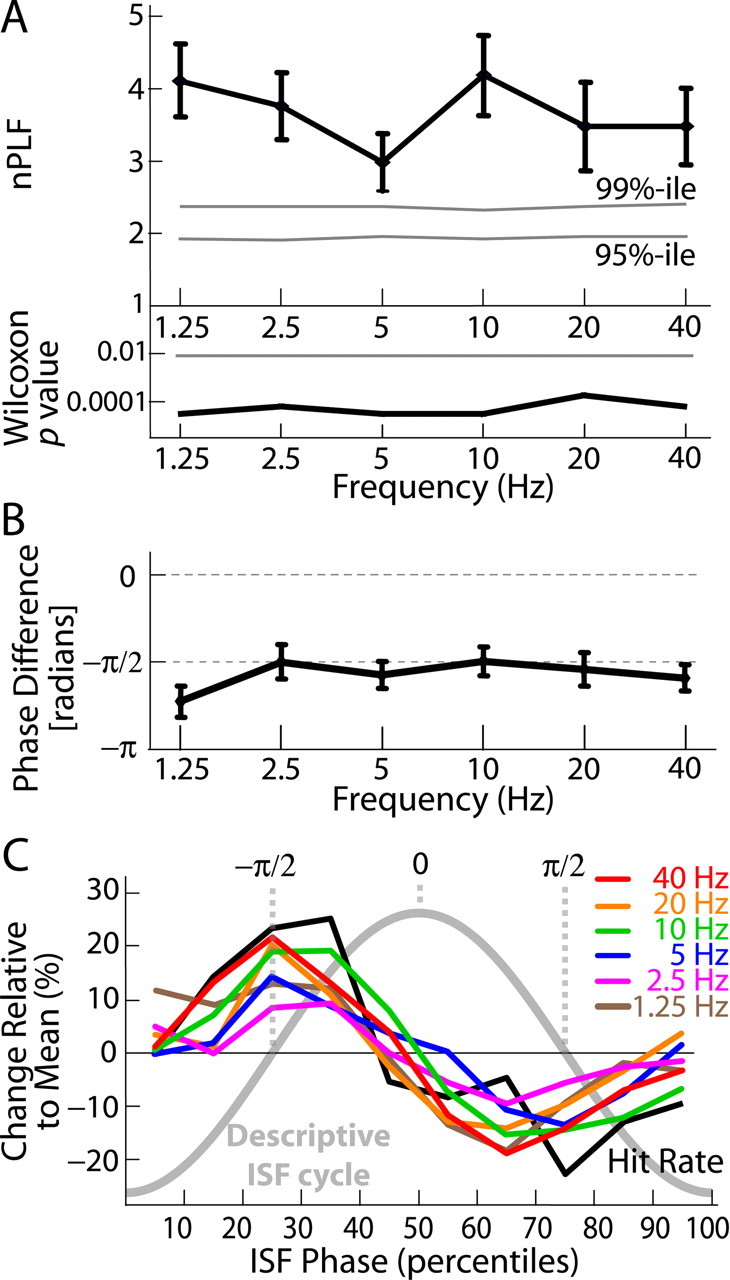
EEG oscillations (1–40 Hz) are nested in ISF. A, The amplitude envelopes of six frequency bands from 1.25 to 40 Hz are synchronized with the ISF (top). The normalized phase-locking factors (nPLF ± SEM; black) are well above the distribution of surrogate data (mean = 1; gray lines indicate the 95th and 99th percentiles of surrogates). The statistical significance of nPLFs was estimated with the paired Wilcoxon signed-rank test (bottom). The horizontal line indicates Bonferroni-corrected p = 0.05 (n = 6). B, The phase difference (mean ± SEM) between the amplitude envelope of the faster oscillations and the ISF is consistently at approximately −π/2. C, The correlation of 1–40 Hz oscillation amplitudes (colored lines) with the ISF phase is similar to that of the behavioral data (black line) (compare with Fig. 3A). The ISF phase ranges from −π to π in bins of 10 percentiles. The thick gray line denotes a descriptive ISF cycle.
To compare the nested oscillations with the HR modulation characterized above, we computed the mean amplitude in each frequency as a function of the ISF phase. The correlation between 1–40 Hz amplitudes and ISF phase was similar to the correlation between HR and ISF phase (Fig. 4C). ISF cycles thus represent both behaviorally and physiologically significant time windows in ongoing brain activity.
Discussion
Our study advances four principal findings. First, the FbEEG recordings revealed ongoing large-amplitude 0.01–0.1 Hz electrical fluctuations, ISFs, in task-engaged humans. Second, the correlation of task performance with the phase of ISF indicates that the ISFs are functionally significant; the stimulus detection probability was 55% larger in the rising phase than in the falling phase of the ISF cycle. Third, the amplitudes of 1–40 Hz EEG oscillations were strongly correlated with the phase of the ISF. Notably, these correlations were highly similar to that between ISF and task performance, which corroborates the physiological relevance of ISFs and suggests that they reflect fluctuations in cortical excitability and/or brain state transitions. Fourth, we show that the behavioral performance in the detection task is clustered, follows scale-free dynamics, and is autocorrelated for time lags >100 s. Together, our data reveal a tight link among behavioral performance, the phase of ISF, and fast (1–40 Hz) cortical activities. The ISFs and the 1–40 Hz oscillations nested therein thus might underlie the slow fluctuations and clustering in human behavioral performance.
Similar dynamics in psychophysical performance and ISFs
Our interest was aroused by the common time scales observed in behavioral variability during cognitive tasks and in ongoing brain activity. The run length statistics show that the observed hit–miss cycle lengths coincide well with the ISF cycle lengths that range from 10 to 100 s. The clustering in behavioral data together with the phase locking of performance and ISF (Fig. 3A) imply that the hit–miss cycles are 1:1 synchronized with the ISF cycles.
The power spectra of EEG data were log-log linear over three orders of magnitude (Fig. 2C), demonstrating that the FbEEG displays scale-free power distribution even at very low frequencies. The scale-free nature of ISF cycle lengths is well in line with the observed scale-free behavioral dynamics (Fig. 1B,D) and has two interesting implications. First, although the ISFs are not oscillations in the classical sense of having a peak in the power spectrum, the locking of behavior and fast oscillations to the ISF phase indicates that the ISF reflects an oscillatory process, in which the phase indexes the state transitions. Indeed, our behavioral data provide a simple binary view to brain states, one associated with hits and the other with misses. Second, all observations above are in line with the notion that the human brain dynamics resemble those observed in systems that have self organized to a critical state and are characterized by nonlinear interactions, power-law scaling behavior, and long-range temporal correlations (Linkenkaer-Hansen et al., 2001).
Relationship between ISFs and ongoing intrinsic activity fluctuations revealed by functional magnetic resonance imaging
Spontaneous slow modulations of activity levels of cerebral networks appear as blood oxygenation level-dependent (BOLD) signal fluctuations in functional magnetic resonance imaging (fMRI) in the frequency range from 0.01 to 0.1 Hz (Fox and Raichle, 2007). Various task-related networks can be identified on the basis of tightly locked cofluctuations during task execution (Lowe et al., 2000). Specific task-related networks have also been found to be active during rest, in which they are anticorrelated with activity in the brain areas that typically decrease their activity during task execution and form the “default-mode network” (Greicius et al., 2003; Fox et al., 2005).
Ongoing intrinsic activity fluctuations in the somatomotor cortex are tightly correlated with behavioral fluctuations in a motor task (Fox et al., 2007) as well as with trial-to-trial variability in evoked responses (Fox et al., 2006). In our study, the ISF and the clustering of hits and misses therein could reflect these intrinsic activity fluctuations (Boly et al., 2007). On the other hand, task performance fluctuations in our study could be attributable to activations of the default-mode network that is associated with mind wandering (Mason et al., 2007) and involuntary attentional lapses (Weissman et al., 2006). In this light, the ISF phase could reflect transitions in task-related or default-mode activity (Fox et al., 2005; Fransson, 2006). Joint FbEEG–fMRI recordings would be necessary to address this question in detail.
Hierarchies of nested oscillations
Locking of the 1–40 Hz amplitude to the ISF phase parallels recent EEG data showing that neuronal oscillations from 0.5 to 18 Hz are nested within 0.02–0.2 Hz activity during sleep (Vanhatalo et al., 2004). Simultaneous recordings of fMRI and EEG have shown that 1–80 Hz oscillation amplitudes are correlated with <0.1 Hz BOLD signal fluctuations (Mantini et al., 2007). The slow covariation of neuronal oscillations supports the notion that the ISF phase and nested relationships reflect dynamics of large-scale cortical excitability (Vanhatalo et al., 2004; Lakatos et al., 2005).
Nested oscillations have been observed between 4–7 Hz and 20–30 Hz in the human EEG (Schack et al., 2002) and between 4–8 Hz and 80–150 Hz in the human electrocorticogram (Canolty et al., 2006), as well as among 1–4 Hz, 4–10 Hz, and 30–50 Hz frequency bands in the macaque auditory cortex (Lakatos et al., 2005). These and our data suggest that a hierarchy of cross-frequency relations among neuronal activities from 0.01 to 150 Hz and across distributed brain regions could underlie complex hierarchies of integrated brain states and coherent behavior in all temporal scales (Varela et al., 2001; Lakatos et al., 2005; Palva et al., 2005). Correlated excitability fluctuations facilitating and protecting neuronal communication (Fries, 2005) could also provide the mechanistic basis for hierarchies of cross-frequency interactions.
Footnotes
This work was supported by the Academy of Finland, Jenny and Antti Wihuri Foundation, Ella and Georg Ehrnrooth Foundation, Emil Aaltonen Foundation, Sigrid Juselius Foundation, the KAUTE Foundation, and University of Helsinki Research Funds. We thank Dr. Sampsa Vanhatalo for valuable discussions.
References
- Boly M, Balteau E, Schnakers C, Degueldre C, Moonen G, Luxen A, Phillips C, Peigneux P, Maquet P, Laureys S. Baseline brain activity fluctuations predict somatosensory perception in humans. Proc Natl Acad Sci U S A. 2007;104:12187–12192. doi: 10.1073/pnas.0611404104. [DOI] [PMC free article] [PubMed] [Google Scholar]
- Canolty RT, Edwards E, Dalal SS, Soltani M, Nagarajan SS, Kirsch HE, Berger MS, Barbaro NM, Knight RT. High gamma power is phase-locked to theta oscillations in human neocortex. Science. 2006;313:1626–1628. doi: 10.1126/science.1128115. [DOI] [PMC free article] [PubMed] [Google Scholar]
- Fox MD, Raichle ME. Spontaneous fluctuations in brain activity observed with functional magnetic resonance imaging. Nat Rev Neurosci. 2007;8:700–711. doi: 10.1038/nrn2201. [DOI] [PubMed] [Google Scholar]
- Fox MD, Snyder AZ, Vincent JL, Corbetta M, Van Essen DC, Raichle ME. The human brain is intrinsically organized into dynamic, anticorrelated functional networks. Proc Natl Acad Sci U S A. 2005;102:9673–9678. doi: 10.1073/pnas.0504136102. [DOI] [PMC free article] [PubMed] [Google Scholar]
- Fox MD, Snyder AZ, Zacks JM, Raichle ME. Coherent spontaneous activity accounts for trial-to-trial variability in human evoked brain responses. Nat Neurosci. 2006;9:23–25. doi: 10.1038/nn1616. [DOI] [PubMed] [Google Scholar]
- Fox MD, Snyder AZ, Vincent JL, Raichle ME. Intrinsic fluctuations within cortical systems account for intertrial variability in human behavior. Neuron. 2007;56:171–184. doi: 10.1016/j.neuron.2007.08.023. [DOI] [PubMed] [Google Scholar]
- Fransson P. How default is the default mode of brain function? Further evidence from intrinsic BOLD signal fluctuations. Neuropsychologia. 2006;44:2836–2845. doi: 10.1016/j.neuropsychologia.2006.06.017. [DOI] [PubMed] [Google Scholar]
- Fries P. A mechanism for cognitive dynamics: neuronal communication through neuronal coherence. Trends Cogn Sci. 2005;9:474–480. doi: 10.1016/j.tics.2005.08.011. [DOI] [PubMed] [Google Scholar]
- Gilden DL, Thornton T, Mallon MW. 1/f noise in human cognition. Science. 1995;267:1837–1839. doi: 10.1126/science.7892611. [DOI] [PubMed] [Google Scholar]
- Greicius MD, Krasnow B, Reiss AL, Menon V. Functional connectivity in the resting brain: a network analysis of the default mode hypothesis. Proc Natl Acad Sci U S A. 2003;100:253–258. doi: 10.1073/pnas.0135058100. [DOI] [PMC free article] [PubMed] [Google Scholar]
- Ikeda A, Taki W, Kunieda T, Terada K, Mikuni N, Nagamine T, Yazawa S, Ohara S, Hori T, Kaji R, Kimura J, Shibasaki H. Focal ictal direct current shifts in human epilepsy as studied by subdural and scalp recording. Brain. 1999;122:827–838. doi: 10.1093/brain/122.5.827. [DOI] [PubMed] [Google Scholar]
- Lakatos P, Shah AS, Knuth KH, Ulbert I, Karmos G, Schroeder CE. An oscillatory hierarchy controlling neuronal excitability and stimulus processing in the auditory cortex. J Neurophysiol. 2005;94:1904–1911. doi: 10.1152/jn.00263.2005. [DOI] [PubMed] [Google Scholar]
- Leopold DA, Murayama Y, Logothetis NK. Very slow activity fluctuations in monkey visual cortex: implications for functional brain imaging. Cereb Cortex. 2003;13:422–433. doi: 10.1093/cercor/13.4.422. [DOI] [PubMed] [Google Scholar]
- Linkenkaer-Hansen K, Nikouline VV, Palva JM, Ilmoniemi RJ. Long-range temporal correlations and scaling behavior in human brain oscillations. J Neurosci. 2001;21:1370–1377. doi: 10.1523/JNEUROSCI.21-04-01370.2001. [DOI] [PMC free article] [PubMed] [Google Scholar]
- Linkenkaer-Hansen K, Monto S, Rytsälä H, Suominen K, Isometsä E, Kähkönen S. Breakdown of long-range temporal correlations in theta oscillations in patients with major depressive disorder. J Neurosci. 2005;25:10131–10137. doi: 10.1523/JNEUROSCI.3244-05.2005. [DOI] [PMC free article] [PubMed] [Google Scholar]
- Lowe MJ, Dzemidzic M, Lurito JT, Mathews VP, Phillips MD. Correlations in low-frequency BOLD fluctuations reflect cortico-cortical connections. Neuroimage. 2000;12:582–587. doi: 10.1006/nimg.2000.0654. [DOI] [PubMed] [Google Scholar]
- Mantini D, Perrucci MG, Del Gratta C, Romani GL, Corbetta M. Electrophysiological signatures of resting state networks in the human brain. Proc Natl Acad Sci U S A. 2007;104:13170–13175. doi: 10.1073/pnas.0700668104. [DOI] [PMC free article] [PubMed] [Google Scholar]
- Marshall L, Mölle M, Fehm HL, Born J. Scalp recorded direct current brain potentials during human sleep. Eur J Neurosci. 1998;10:1167–1178. doi: 10.1046/j.1460-9568.1998.00131.x. [DOI] [PubMed] [Google Scholar]
- Mason MF, Norton MI, Van Horn JD, Wegner DM, Grafton ST, Macrae CN. Wandering minds: the default network and stimulus-independent thought. Science. 2007;315:393–395. doi: 10.1126/science.1131295. [DOI] [PMC free article] [PubMed] [Google Scholar]
- Palva JM, Palva S, Kaila K. Phase synchrony among neuronal oscillations in the human cortex. J Neurosci. 2005;25:3962–3972. doi: 10.1523/JNEUROSCI.4250-04.2005. [DOI] [PMC free article] [PubMed] [Google Scholar]
- Palva S, Palva JM. New vistas for alpha-frequency band oscillations. Trends Neurosci. 2007;30:150–158. doi: 10.1016/j.tins.2007.02.001. [DOI] [PubMed] [Google Scholar]
- Peng CK, Havlin S, Stanley HE, Goldberger AL. Quantification of scaling exponents and crossover phenomena in nonstationary heartbeat time series. Chaos. 1995;5:82–87. doi: 10.1063/1.166141. [DOI] [PubMed] [Google Scholar]
- Schack B, Vath N, Petsche H, Geissler HG, Möller E. Phase-coupling of theta-gamma EEG rhythms during short-term memory processing. Int J Psychophysiol. 2002;44:143–163. doi: 10.1016/s0167-8760(01)00199-4. [DOI] [PubMed] [Google Scholar]
- Steriade M, McCormick DA, Sejnowski TJ. Thalamocortical oscillations in the sleeping and aroused brain. Science. 1993;262:679–685. doi: 10.1126/science.8235588. [DOI] [PubMed] [Google Scholar]
- Tallon-Baudry C, Bertrand O. Oscillatory gamma activity in humans and its role in object representation. Trends Cogn Sci. 1999;3:151–162. doi: 10.1016/s1364-6613(99)01299-1. [DOI] [PubMed] [Google Scholar]
- Vanhatalo S, Tallgren P, Becker C, Holmes MD, Miller JW, Kaila K, Voipio J. Scalp-recorded slow EEG responses generated in response to hemodynamic changes in the human brain. Clin Neurophysiol. 2003;114:1744–1754. doi: 10.1016/s1388-2457(03)00163-9. [DOI] [PubMed] [Google Scholar]
- Vanhatalo S, Palva JM, Holmes MD, Miller JW, Voipio J, Kaila K. Infraslow oscillations modulate excitability and interictal epileptic activity in the human cortex during sleep. Proc Natl Acad Sci U S A. 2004;101:5053–5057. doi: 10.1073/pnas.0305375101. [DOI] [PMC free article] [PubMed] [Google Scholar]
- Vanhatalo S, Voipio J, Kaila K. In: Electroencephalography: basic principles, clinical applications, and related fields. Niedermeyer E, Lopes da Silva F, editors. Philadelphia: Lippincott Williams and Wilkins; 2005. pp. 489–493. [Google Scholar]
- Varela F, Lachaux JP, Rodriguez E, Martinerie J. The brainweb: phase synchronization and large-scale integration. Nat Rev Neurosci. 2001;2:229–239. doi: 10.1038/35067550. [DOI] [PubMed] [Google Scholar]
- Verplanck WS, Collier GH, Cotton JW. Nonindependence of successive responses in measurements of the visual threshold. J Exp Psychol. 1952;44:273–282. doi: 10.1037/h0054948. [DOI] [PubMed] [Google Scholar]
- Voipio J, Tallgren P, Heinonen E, Vanhatalo S, Kaila K. Millivolt-scale DC shifts in the human scalp EEG: evidence for a nonneuronal generator. J Neurophysiol. 2003;89:2208–2214. doi: 10.1152/jn.00915.2002. [DOI] [PubMed] [Google Scholar]
- Weissman DH, Roberts KC, Visscher KM, Woldorff MG. The neural bases of momentary lapses in attention. Nat Neurosci. 2006;9:971–978. doi: 10.1038/nn1727. [DOI] [PubMed] [Google Scholar]