

Abstract
The parietal regions implicated in spatially selective attention differ between patient lesion studies and functional imaging of the intact brain. We aimed to resolve this discordance. In a voxel-based lesion-symptom mapping study in 20 ischemic stroke patients, we applied the same cognitive subtraction approach as in 23 healthy volunteers who underwent functional magnetic resonance imaging (fMRI) using identical tasks and stimuli. An instructive central cue directed attention to one visual quadrant. After a brief delay, a grating appeared in that quadrant together with an irrelevant grating in an uncued quadrant. Subjects had to discriminate the orientation of the grating in the cued quadrant. Patients with a right inferior parietal lesion were significantly more impaired during contralesional versus ipsilesional orienting when stimuli were bilateral and symmetrical than when stimuli occupied diagonally opposite quadrants or two quadrants within the same hemifield. In one area, the lesion-volume map overlapped with the activity map obtained in healthy volunteers: the lower bank of the middle third of the right intraparietal sulcus (IPS). In an additional 37 healthy fMRI subjects, we disentangled the effects of symmetry, bilaterality, and spatial configuration between stimuli on activity in the volume of overlap. Only the axis of configuration between stimuli had a significant effect, with highest activity when the configuration axis was horizontal. This constitutes converging evidence from patients and cognitively intact subjects that the lower bank of the middle third of the right IPS critically contributes to attentive selection between competing stimuli in a spatially anisotropic manner.
Keywords: attention, neglect, extinction, fMRI, stroke, VLSM
Introduction
The middle segment of the intraparietal sulcus (IPS) is among the most consistently activated areas in functional imaging studies of spatially selective attention (Corbetta et al., 1993; Nobre et al., 1997; Corbetta and Shulman, 2002; Giesbrecht et al., 2003; Pollmann et al., 2003; Woldorff et al., 2004; Vandenberghe et al., 2005; Molenberghs et al., 2007; Serences and Yantis, 2007). Structural lesion mapping, however, of spatial-attentional deficits most commonly reveals more inferior parietal regions such as the right angular gyrus (Mort et al., 2003; Hillis et al., 2005) or the right temporoparietal junction (Posner et al., 1984; Corbetta and Shulman, 2002; Karnath et al., 2003) rather than the intraparietal sulcus. In healthy controls, the inferior parietal lobule is activated only under specific circumstances, such as breaches of expectancy (Corbetta et al., 2000) or sustained spatial attention (Pardo et al., 1991; Vandenberghe et al., 2001a,b; Husain and Rorden, 2003).
Discordance between patient lesion studies and functional imaging of the intact brain may arise for a number of nonexclusive reasons. Functional alterations extend beyond the structural lesion (e.g., because of disconnection) (Corbetta et al., 2005). Second, the clinical tests commonly used to dichotomize patient groups for the purpose of lesion mapping (Karnath et al., 2001; Mort et al., 2003; Hillis et al., 2006) do not map rigorously onto the specific attentional processes that are isolated by the subtraction method in functional magnetic resonance imaging (fMRI) in the intact brain (Husain and Rorden, 2003; Nachev and Husain, 2006). A classical test, such as target cancellation (Gauthier et al., 1989), calls after many different attentional processes (Nachev and Husain, 2006). In the current study, we applied the same contrastive approach in a voxel-based lesion-symptom mapping (VLSM) study in patients as that used with fMRI in healthy volunteers. Both patients and healthy volunteers underwent the same experimental conditions. Subjects had to perform an orientation discrimination task with a peripheral grating, which was presented simultaneously with an irrelevant grating (Geeraerts et al., 2005; Vandenberghe et al., 2005). In patients, we quantified the interaction between the direction of attention (contralesional vs ipsilesional) and the spatial configuration between stimuli and related this continuous variable to the lesion site (Bates et al., 2003; Tyler et al., 2005). Rather than comparing mathematical centers of gravity, we searched for the neuroanatomical overlap between the lesion-symptom map and the activity map obtained in the intact brain.
In a second step, we disentangled the effect of three spatial variables: symmetry, bilaterality, and configuration axis. Extinction case DG (di Pellegrino and de Renzi, 1995) did not detect the contralesional stimulus when the two simultaneously presented bilateral stimuli were on the horizontal meridian, regardless of display symmetry. Even when the two stimuli are presented on the horizontal meridian within the same hemifield, the leftmost of two stimuli may be extinguished (Kinsbourne, 1977; Ladavas, 1987; Posner et al., 1987; di Pellegrino and de Renzi, 1995; Smania et al., 1998; Vuilleumier and Rafal, 2000). Many tests in extinction and neglect patients (Bender, 1952; Posner et al., 1984; Milner and Harvey, 1995; Smania et al., 1998; Kerkhoff, 2000; Behrmann et al., 2001, 2002; Doricchi et al., 2002) define the spatial processing deficit along the horizontal axis. This led us to investigate whether the effect of symmetry, bilaterality, and/or configuration axis would be analogous in the area of overlap in normals to what is seen in patients.
Materials and Methods
All participants gave written informed consent in accordance with the Declaration of Helsinki. The ethical commission (University Hospital Gasthuisberg, Leuven) approved the experimental protocol. The cognitively intact volunteers were free of psychotropic or vasoactive medication, had no neurological or psychiatric history, had a normal structural brain magnetic resonance image, and were strictly right handed as tested by the Oldfield Inventory (Oldfield, 1971).
Voxel-based lesion-symptom mapping.
Twenty patients (Table 1) participated, who had suffered a unifocal cortical or a nonlacunar basal ganglia ischemic stroke within the last year, confirmed by clinical fluid attenuation inversion recovery (FLAIR) or diffusion-weighted imaging (DWI) MRI. Exclusion criteria were as follows: above 85 years of age, pre-existing periventricular or subcortical white matter lesions or a pre-existing focal cortical stroke on MRI, presence of hemianopia, insufficient balance to sit autonomously in front of a computer, and general inability to understand and perform a computerized perceptual discrimination task. We screened a consecutive series of 616 ischemic stroke patients during their hospitalization at the stroke unit or on occasion of their first follow-up visit to the outpatient clinic. Thirty-two of these patients fulfilled the study criteria, 20 of whom consented to the study. The anatomical distribution of the ischemic lesions is shown in Figure 1A. The most frequent reasons for exclusion were the presence of pre-existing cerebrovascular lesions that would have prevented us from attributing the deficit to the most recent infarction, infratentorial localization, lacunar infarctions, or clinical deficits hampering detailed psychophysical computerized assessment (e.g., diminished arousal, postural imbalance, hemiplegia).
Table 1.
Behavioral parameters
| Case | Age | Sex | Lesion | Lesion size (mm3) | Time | Extinction L/B/R | Bells L/M/R | Bisection (%) | DS | Hand used | Contralesional orienting |
Ipsilesional orienting |
LESS | ||
|---|---|---|---|---|---|---|---|---|---|---|---|---|---|---|---|
| B symm (%) | U vert (%) | B symm (%) | U vert (%) | ||||||||||||
| 20 | 80 | M | R | 64617 | 18 weeks | 10/5/10 | 3/1/0 | +6.3 | 5 | R | 64 | 94 | 94 | 97 | −27 |
| 17 | 62 | M | R | 89666 | 4 d | 10/3/10 | 2/0/0 | +5.3 | 5 | R | 47 | 58 | 58 | 42 | −27 |
| 11 | 54 | M | R | 30248 | 5 d | 10/8/10 | 2/0/0 | +6.6 | 5 | R | 65 | 76 | 98 | 85 | −24 |
| 10 | 42 | M | R | 43448 | 6 d | 4/3/10 | 4/3/1 | +18.7 | 7 | R | 46 | 60 | 79 | 70 | −23 |
| 5 | 61 | M | L | 18452 | 7 d | 10/10/10 | 0/0/1 | −5.2 | 7 | L | 89 | 97 | 94 | 92 | −10 |
| 16 | 35 | M | L | 64443 | 9 weeks | 10/10/10 | 0/0/0 | −1.0 | 4 | R | 97 | 100 | 100 | 94 | −9 |
| 12 | 79 | F | R | 40756 | 2 weeks | 10/10/10 | 2/1/1 | −3.8 | 5 | R | 86 | 91 | 97 | 97 | −5 |
| 3 | 68 | F | R | 10998 | 22 weeks | 10/10/10 | 0/0/0 | −3.0 | 7 | R | 89 | 97 | 97 | 100 | −5 |
| 19 | 44 | M | R | 161207 | 13 weeks | 10/10/10 | 0/0/0 | +5.0 | 6 | R | 86 | 94 | 97 | 100 | −5 |
| 1 | 60 | M | R | 29618 | 24 weeks | 10/10/10 | 1/1/0 | −1.8 | 7 | R | 97 | 100 | 100 | 100 | −3 |
| 4 | 64 | M | R | 107228 | 28 weeks | 10/10/10 | 3/0/1 | +4.1 | 5 | R | 58 | 64 | 64 | 67 | −3 |
| 15 | 62 | F | L | 17006 | 19 weeks | 10/10/10 | 0/0/0 | −0.4 | 6 | R | 92 | 89 | 92 | 86 | −3 |
| 14 | 66 | M | L | 95094 | 18 weeks | 10/10/10 | 1/1/2 | −0.5 | 7 | R | 100 | 96 | 100 | 96 | 0 |
| 2 | 55 | M | R | 2568 | 20 weeks | 10/10/10 | 1/0/0 | −3.6 | 5 | L | 93 | 92 | 86 | 86 | 1 |
| 7 | 37 | M | L | 11209 | 3 weeks | 10/10/10 | 0/0/0 | −0.4 | 5 | R | 100 | 95 | 100 | 97 | 2 |
| 9 | 37 | F | R | 8480 | 2 weeks | 10/10/10 | 2/0/1 | +0.9 | 9 | R | 76 | 76 | 78 | 80 | 2 |
| 18 | 61 | F | L | 1025 | 31 weeks | 10/10/10 | 0/0/0 | −2.0 | 6 | R | 94 | 89 | 94 | 94 | 5 |
| 8 | 76 | M | L | 3966 | 5 d | 10/10/10 | 1/1/2 | −4.6 | 4 | R | 92 | 97 | 83 | 97 | 9 |
| 13 | 65 | M | R | 49459 | 2 weeks | 10/10/10 | 1/1/1 | +4.0 | 6 | R | 97 | 92 | 92 | 97 | 10 |
| 6 | 52 | M | R | 14307 | 21 weeks | 10/10/10 | 2/1/0 | −5.9 | 5 | R | 83 | 72 | 94 | 97 | 14 |
Cases were numbered consecutively but are ranked in this table in increasing order of LESS index. Bold values indicate significant difference between individual's score on the experimental task and control group [modified ttest, statistical threshold two-tailed p< 0.05 (Crawford and Garthwaite, 2005)]. Bold and underlined values indicate statistical threshold two-tailed p< 0.005 (Crawford and Garthwaite, 2005). LESS, Difference in accuracy based on the contrast [contralesional orienting, symmetrical stimulation minus ipsilesional orienting, symmetrical stimulation] − [contralesional orienting, contralesional stimulation minus ipsilesional orienting, ipsilesional stimulation]; L, left; R, right; B, bilateral; M, middle; Bells, number of omissions on the Bells test; Bisection, positive values are deviations to the patient's right side; Hand used, hand used in the experimental task; DS, digit span forward; B symm, bilateral symmetrical; U vert, unilateral vertical.
Figure 1.
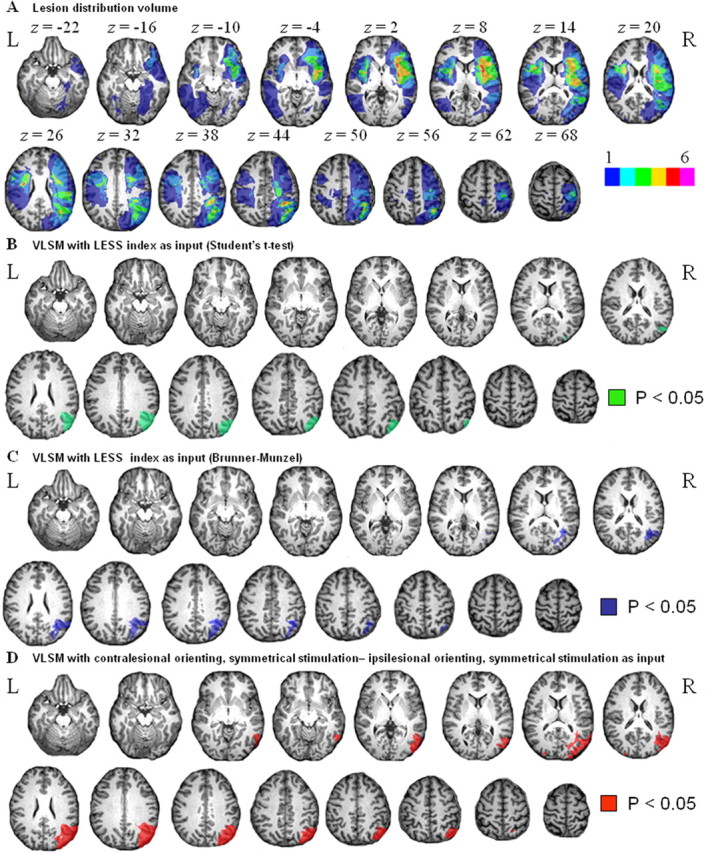
A, Lesion distribution volume. The color code indicates in how many individuals of our patient sample (n = 20) a given voxel was lesioned, in absolute numbers (ranging from 1 to 6). In our sample, a maximum of six of the patients had a same voxel lesioned. B, Lesion-symptom map. Green, Voxels that, when lesioned, are associated with a significantly higher accuracy cost during contralesional minus ipsilesional orienting trials when stimuli are presented bilaterally and symmetrically than with unilateral double stimulation (LESS index). Statistical test: Student's t test (corrected p < 0.05). C, Same analysis as in B except for the use of a Brunner-Munzel instead of a Student's t test (corrected p < 0.05). D, Lesion-symptom map. Red, Voxels that, when lesioned, are associated with a significant accuracy cost during contralesional versus ipsilesional orienting under bilateral symmetrical stimulation conditions. Student's t test (corrected p < 0.05). L, Left; R, right.
Our standard protocol consisted of digit span forwards, confrontation naming (Riddoch and Humphreys, 1993), target cancellation (Gauthier et al., 1989), line bisection (Schenkenberg et al., 1980), and visual extinction (Bender, 1952) (Table 1). To test for visual extinction, the examiner briefly wiggled the left or right index finger or both while seated at 1 m distance from the patient. We presented 10 trials of each type in random order. Each subject also underwent an extensive standard neuropsychological assessment of other cognitive domains.
Experimental stimuli and task.
The experiment was conducted using Superlab for personal computers, version 2.0 (Cedrus, Phoenix, AZ). Subjects were seated at 114 cm distance from a 19 inch computer screen. Eye movements were monitored using infrared eye movement recording (ViewPoint Eye Tracker; Arrington Research, Scottsdale, AZ). First, the integrity of the visual fields was mapped in each patient by presenting a white circular patch (2.21° diameter; 89 cd/m2; duration, 500 ms) at eight different positions with an interstimulus interval randomly varying between 500 and 4000 ms. Subjects were instructed to respond manually to the appearance of the stimulus while fixating a central 0.27° dot. The stimulus was presented at 8.54° eccentricity and could be located in the upper or lower field on the vertical meridian, in the right or left visual field on the horizontal meridian, or in the left or right upper or lower quadrant. A total of five trials was presented per stimulus position. Eye movements were monitored on-line. Only case 6 missed more than one of the stimuli for a given position (i.e., three of five targets in the left upper quadrant).
In the main experiment, trials of different types were randomly intermixed. The instructive cue, a central white triangle (base, 0.69°; height, 1.12°; duration, 200 ms), pointed to one of the four quadrants (Fig. 2). After a 200 ms delay, two circular square-wave gratings (4.29° diameter; 0.60 cycles/degree; mean luminance, 194 cd/m2; duration, 200 ms; contrast Michelson index, 38%) appeared at 9.46° eccentricity on the diagonal, one in the cued quadrant (the relevant grating), and one in an uncued quadrant (the irrelevant grating). Subjects were instructed to fixate a central 0.27° dot. The orientation of the relevant grating was pseudorandomly rotated 45° clockwise or counter-clockwise with respect to a 90° reference orientation, with the constraint that, per run, these two alternatives occurred with equal frequency. Subjects had to select an upper or lower button depending on the orientation of the relevant grating. Patients used the hand of their choice throughout the experiment. Our experimental manipulation concerned the position of the irrelevant grating relative to the relevant grating. The irrelevant grating was located either in the opposite hemifield symmetrically to the relevant grating (Fig. 2A) or in the same hemifield as the relevant grating in the uncued quadrant (Fig. 2B). As a third possibility in 16 of the patients (cases 1–6, 8, 12–20), the irrelevant grating could be in the quadrant diagonally opposite to that occupied by the relevant grating (Fig. 2C). This resulted in six different event types: contralesional versus ipsilesional orienting with bilateral symmetrical stimulation, unilateral double stimulation along a vertical axis, or bilateral stimulation along a diagonal axis. Cue direction to upper versus lower quadrant was matched between event types. The orientation of the irrelevant grating could be either the same as the that of the relevant grating or be rotated 90° with respect to the orientation of the relevant grating.
Figure 2.

Experimental paradigm applied in patients and during fMRI in healthy volunteers. A central instructive cue (200 ms) pointed to one of the four quadrants. After a 200 ms delay, a relevant grating was presented in the cued quadrant together with an irrelevant grating. Subjects were instructed to fixate a central fixation point and press a left-hand or right-hand key depending on the orientation of the target grating. A–C, The distracter could be either in the quadrant symmetrical to that occupied by the target (A), in the other quadrant of the same hemifield (B), or in the diagonally opposite quadrant (C). In this example, distracter and target have different orientations, but in reality, the orientation could be either the same or different.
Each patient underwent three experimental runs. Each run contained 12 trials of each type. A trial was initiated 2000 ms after the subject had responded to the previous trial. Accuracies and reaction times were stored for additional analysis.
The percentage of correct answers in each of the four conditions (Table 1) was used to calculate a lateralized effect of stimulus symmetry (LESS): [contralesional orienting, symmetrical stimulation minus ipsilesional orienting, symmetrical stimulation] minus [contralesional orienting, unilateral stimulation along the vertical axis minus ipsilesional orienting, unilateral stimulation along the vertical axis]. This contrast isolates the interaction between the direction of attention and the spatial configuration between stimuli. LESS is negative when the accuracy cost during contralesional versus ipsilesional orienting is larger under bilateral symmetrical than under unilateral double stimulus conditions.
We decomposed the LESS index and calculated each of its components: (1) contralesional orienting, symmetrical stimulation minus ipsilesional orienting, symmetrical stimulation; (2) contralesional orienting, unilateral stimulation along the vertical axis minus ipsilesional orienting, unilateral stimulation along the vertical axis. In each patient and for each of the event types, we examined whether accuracy differed from what was seen in a sample of 10 healthy elderly matched controls using a modified t test (Crawford and Garthwaite, 2005).
We also calculated a second index, LESS2: [contralesional orienting, symmetrical stimulation minus ipsilesional orienting, symmetrical stimulation] minus [contralesional orienting, bilateral stimulation along a diagonal axis minus ipsilesional orienting, bilateral stimulation along a diagonal axis].
In a secondary analysis, we looked for altitudinal effects: (1) upper field orienting, unilateral stimulation along the vertical axis minus lower field orienting, unilateral stimulation along the vertical axis; (2) contralesional, upper field orienting, unilateral stimulation along the vertical axis minus contralesional, lower field orienting, unilateral stimulation along the vertical axis. We also entered the LESS index as the dependent variable in a multiple linear regression analysis, with age, time-to-stroke-onset, and lesion size as regressors.
Finally, we examined how the LESS index relates to impairment on the conventional attentional tasks (Bells test, line bisection, extinction, digit span forward) in our neuropsychological protocol. The neuropsychological data were subjected to a principal components factor analysis with orthogonal rotation in SPSS (Chicago, IL). For each of the factors that had an Eigenvalue higher than 1, we calculated the individual factor scores and determined the Pearson correlation coefficient between the LESS index and the individual factor score.
Structural imaging.
A 3 tesla Philips Intera system (Best, The Netherlands) equipped with a head volume coil provided T1 images [repetition time (TR), 1975 ms; echo time (TE), 30 ms; in-plane resolution, 1 mm] as well as FLAIR three-dimensional images (TR, 10741 ms; TE, 150 ms). Using SPM2 (www.fil.ion.ucl.ac.uk; Welcome Department of Cognitive Neurology, London, UK), the T1 and FLAIR images were coregistered. The T1 scan was normalized to the Montreal Neurological Institute (MNI) T1 template in Talairach space (Talairach and Tournoux, 1988; Friston et al., 1995). The spatial normalization involved both linear (12 affine transformations) and nonlinear (7 × 9 × 7 basis functions; 16 reiterations) transformations (Ashburner and Friston, 1999). High regularization was used to constrain the nonlinear part of the algorithm and penalize unlikely deformations associated with the presence of lesions (Ashburner and Friston, 1999; Tyler et al., 2005). The same normalization matrix was applied to the FLAIR images. The match between each patient's normalized brain and the brain template was carefully evaluated through visual inspection, and use of a cross hair yoked between the template image and the normalized image. The quality of the normalization was satisfactory in each instance. Using MRIcro version 1.37 (http://www.sph.s.c.edu/comd/rorden/mricro.html), lesions were automatically delineated using manually set intensity thresholds (Rorden and Brett, 2000). Subsequently, the lesion volumes were imported into the VLSM software package, version 1.5 (voxel size, 1 × 1 × 1 mm3) (http://crl.ucsd.edu/vlsm/) (Bates et al., 2003). Using a one-tailed t test, we examined voxel-by-voxel whether lesions of that voxel were associated with a more severe LESS index (primary analysis). The threshold was set at a voxel-level threshold of p < 0.05, with a Bonferroni's correction for the search volume (Bates et al., 2003). We performed the same type of analysis with the LESS2 index and with their components. Our primary analysis was based on a Student's t test, but we verified our results by means of the Brunner and Munzel (BM) significance test (Rorden et al., 2007) (http://www.mricro.com/mricron/install.html). The BM rank-order test is free of the assumption of normality and incorporates permutation testing when one of the comparison groups is relatively small (Rorden et al., 2007). The BM map was thresholded at p < 0.05 with Bonferroni's correction for the search volume.
Results
The LESS index was significantly affected in those patients who had right-sided lesions of the lower bank of the horizontal segment of the intraparietal sulcus, the angular gyrus, and the ascending posterior branch of the superior temporal sulcus than in patients in whom these voxels were intact (p < 0.05, corrected) (Fig. 1B,C), regardless of the statistical test used, Student's t test (Fig. 1B) or BM (Fig. 1C). The effect was also present when we restricted the analysis to the nine patients studied within the first month poststroke. When we restricted the analysis to the bilateral symmetrical stimulation events, the contrast between contralesional versus ipsilesional orienting yielded the same results (p < 0.05, corrected) (Fig. 1D). When we restricted the analysis to the events with unilateral stimulation along the vertical axis, the contrast between contralesional versus ipsilesional orienting did not yield any significant differences, even when we lowered the threshold to uncorrected, p < 0.05. This demonstrates that the effect mainly arises from the contrast between contralesional and ipsilesional orienting under symmetrical stimulus conditions (Table 1).
When we used LESS2 as our cognitive parameter for VLSM instead of LESS, we obtained very similar results (p < 0.05, corrected). We did not find any effect when we restricted the analysis to the bilateral, diagonal stimulation events and contrasted contralesional versus ipsilesional orienting at uncorrected p < 0.05. We did not observe any altitudinal effects (upper versus lower field), even when we lowered the threshold to uncorrected p < 0.05. A multiple linear regression analysis did not reveal any relationship between the LESS index and lesion size (Fig. 3), age, or time-to-stroke onset (F(3,16) = 1.44; p = 0.27).
Figure 3.

Regression plot. x-axis, LESS index; y-axis, lesion size (in cubic centimeters).
Factor analysis extracted two factors that explained 75.9% of the total variance of the neuropsychological data set. The first factor explained 47.9% of the total variance (Eigenvalue 1.92) and clustered the Bells test (r = 0.86), line bisection (r = 0.77), and extinction test (r = 0.76). The second factor (Eigenvalue 1.12) explained 27.9% of the total variance and corresponded to the forward digit span (r = 0.94). We correlated the individual factor scores with the LESS index. The correlation was significant (r = −0.78; p < 0.001) for the first factor. There was no correlation between the second factor and the LESS index (r = −0.07; p = 0.78).
Psychophysical experiments in healthy volunteers
The psychophysical studies served a triple aim: to determine whether our experimental manipulation had a behavioral effect in healthy controls, to determine whether the effect of configuration axis depended on the orientations used, and to allow us to adjust orientation differences for each event type so that performance levels could be equated between the different event types during the fMRI experiment. We conducted two pilot psychophysical experiments in each of the 15 healthy volunteers. Subjects were seated in front of a computer screen at a distance of 114 cm with the head restrained by a front and chin rest while eye fixation was monitored. Each run contained 24 trials of four different types: bilateral symmetrical stimulation, bilateral stimulation along a diagonal axis, unilateral stimulation along a vertical axis, and single stimulation. Subjects completed six runs. In the first psychophysical experiment, the orientation of the relevant grating was either 89 or 91°. The orientation of the distracter was either identical to that of the target, rotated 2° clockwise, or rotated 2° counter-clockwise with respect to the orientation of the target. According to a one-way repeated-measures ANOVA, there was a significant effect of spatial configuration after reaction times (F(3,42) = 18.28; p < 0.0001) and accuracies (F(3,42) = 3.28; p = 0.03) (Table 2). Subjects responded significantly more slowly (F(1,42) = 12.86; p = 0.0009) and less accurately (F(1,42) = 5.37; p = 0.025) during bilateral symmetrical stimulation compared with bilateral diagonal stimulation, unilateral stimulation along the vertical axis (F(1,42) = 12.11, p = 0.0012, and F(1,42) = 4.52, p = 0.04, respectively), or single stimulation (F(1,42) = 12.86, p < 0.0001, and F(1,42) = 8.68, p = 0.005, respectively) (Bonferroni's post hoc testing). Reaction times or accuracies did not differ between bilateral diagonal stimulation and unilateral stimulation along the vertical axis (F(1,42) = 0.01, p = 0.92, and F(1,42) = 0.04, p = 0.85, respectively). Reaction times were slower in response to these two event types compared with single stimulation events (F(1,42) = 14.55, p = 0.0004, and F(1,42) = 15.37, p = 0.0003, respectively).
Table 2.
Behavioral parameters obtained in the two psychophysical experiments
| Bilateral symmetrical | Unilateral vertical | Bilateral diagonal | Unilateral single | |
|---|---|---|---|---|
| First psychophysical experiment | ||||
| RT (ms) | 845 (160) | 819 (160) | 818 (146) | 789 (161) |
| Percentage correct (%) | 78.8 (7.8) | 81.7 (7.7) | 82.0 (9.4) | 82.9 (9.0) |
| Mean number of saccades per run | 0.78 (0.39) | 0.79 (0.43) | 0.70 (0.60) | 0.90 (0.47) |
| Second psychophysical experiment | ||||
| RT (ms) | 735 (174) | 692 (168) | 700 (162) | 655 (151) |
| Percentage correct (%) | 87.4 (10.4) | 88.5 (11.1) | 88.3 (9.3) | 90.8 (7.8) |
| Mean number of saccades per run | 0.88 (0.67) | 0.89 (0.78) | 0.87 (0.83) | 0.97 (0.79) |
Values are mean and SD.
Leaving out the data from the single stimulus events, we conducted a separate two-way repeated-measures ANOVA with two factors: similarity in orientation between the relevant and the irrelevant grating (three levels: identical, distracter rotated clockwise with respect to target, or rotated anticlockwise) and spatial configuration (three levels: bilateral symmetrical, unilateral stimulation along the vertical axis, bilateral diagonal). The main effect of spatial configuration was highly significant (reaction times, F(2,112) = 5.96, p = 0.004; accuracies, F(2,112) = 6.00, p = 0.003). There was no main effect of orientation similarity on reaction times (F(2,112) = 1.27; p = 0.28) or accuracies (F(2,112) = 0.50; p = 0.61). There was also no interaction between orientation similarity and spatial configuration for reaction times (F(4,112) = 1.04; p = 0.39) or accuracies (F(4,112) = 1.56; p = 0.19).
We conducted a second psychophysical experiment to evaluate possible interactions between spatial configuration between stimuli and the grating orientations. The reference orientation of the relevant grating was set at 0° in half of the trials and 90° in the other half, with a rotation angle of 3°. The reference orientation of the irrelevant grating was independently set at 0, 45, or 90°. As in the first psychophysical experiment, there was a significant main effect of spatial configuration after reaction times (F(3,98) = 8.57; p < 0.0001) (Table 2): subjects responded more slowly to the bilateral symmetrical stimulation events than to unilateral stimulation along the vertical axis (F(3,98) = 7.33; p = 0.0081), bilateral diagonal stimulation (F(3,98) = 4.77; p = 0.03), or unilateral single stimulation (F(3, 98) = 4.77; p < 0.0001). There was a main effect of grating orientation: subjects responded faster when the reference orientation of the relevant grating was 0° than when it was 90° (F(1,98) = 16.05; p < 0.0001). There were no interaction effects between spatial configuration and the reference orientation of the relevant grating (reaction times, F(3,98) = 0.13, p = 0.94; accuracies, F(3,98) = 0.79, p = 0.50; eye movements, (F(3,98) = 0.10; p = 0.96).
Overlap between lesion map and fMRI activity map in the intact brain
Twenty-three cognitively intact subjects (12 women, 11 men; between 18 and 47 years of age) participated in this fMRI study.
Stimuli were projected from a Barco 6400i LCD projector (1024 × 768 pixels) onto a screen 36 cm in front of the subjects' eyes. The stimuli and task were very similar to those used in the patients. Each run contained 16 trials of six different types: leftward and rightward orienting with bilateral symmetrical stimulation, unilateral stimulation along the vertical axis, or single stimulation. The position of the target, in upper or lower hemifield, was matched between event types. Each run also contained 16 null events. The event sequence was optimized for the contrast of each event type minus the null event (Wager and Nichols, 2003). The first 12 subjects completed four runs, and the remaining subjects completed six runs. The total number of volumes per functional imaging run was 186. Subjects were instructed to fixate the central fixation point. Eye movements were registered during fMRI using Applied Science Laboratory (Waltham, MA) infrared system. Analysis of eye movements was automatized: we defined four 8.3 × 8.3° regions of interest surrounding the area where the gratings appeared. Deviations of the eye movements into the regions of interest were detected automatically and calculated. The day before the fMRI session, subjects received three training runs. On the basis of the previous psychophysical experiments, orientation differences during fMRI were adapted to equate performances between trial types: 3° rotation angle with respect to a 90° reference orientation during bilateral symmetrical stimulation, 2.5° during unilateral stimulation along the vertical axis and 2° during single stimulation.
A 3 tesla Philips Intera system equipped with a head volume coil provided T2* echoplanar images (EPI) with blood-oxygenation level dependent (BOLD) contrast. EPIs (TR, 2 s; TE, 30 ms) comprised 36 axial slices acquired continuously in ascending order (voxel size, 2.75 × 2.75 × 3.75 mm3). The first six volumes were discarded to allow the MRI signal to reach steady state. Structural imaging consisted of T1 images (TR, 1975 ms; TE, 30 ms; in-plane resolution, 1 mm).
We used SPM2 for data preprocessing and group random effects analysis. After realignment and normalization to the MNI template in Talairach space (Talairach and Tournoux, 1988; Friston et al., 1995), EPI images were spatially smoothed using a 5 × 5 × 7 mm3 filter. The time series for each voxel was high-pass filtered to 1/128 Hz. The event-related response, synchronized with the acquisition of the top slice, was modeled by a canonical hemodynamic response function consisting of a mixture of two gamma functions and its temporal derivative. Data were analyzed using a random effects general linear model. We calculated the following contrasts: (1) main effect of spatial stimulus configuration (left-sided attention, bilateral symmetrical stimulation plus right-sided attention, bilateral symmetrical stimulation) minus (left-sided attention, unilateral double stimulation plus right-sided attention, unilateral double stimulation); (2) left-sided attention, bilateral symmetrical stimulation minus right-sided attention, bilateral symmetrical stimulation; (3) left-sided attention, unilateral double stimulation minus right-sided attention, unilateral double stimulation.
A statistical parametric map of the t statistic for the parameter estimates was generated and subsequently transformed to a Z map. At the second level of analysis, we examined whether, on average, the contrast images revealed significant differences (one-sample t test). The significance map for the group random effects analysis was thresholded at p < 0.05 (corrected) for the entire brain search volume (cluster-level inference), with a voxel-level threshold of p < 0.001 (Poline et al., 1997).
We imported the activity map and the lesion-symptom map obtained in patients into the computerized anatomical reconstruction and editing toolkit (CARET; Washington University School of Medicine, Department of Anatomy and Neurobiology) (http://brainmap.wustl.edu). We determined the spatial overlap between these two maps using CARET and saved the overlap as a volume of interest for additional functional analyses with SPM2.
We conducted a two-way repeated-measures ANOVA with two factors: stimulus configuration (three levels: bilateral symmetrical, unilateral double, unilateral single) and direction of attention (two levels: left sided vs right sided). Reaction times (stimulus configuration, F(2,110) = 2.48, p = 0.09; direction of attention, F(1,110) = 1.80, p = 0.18; interaction, F(2,110) = 0.09, p = 0.91), accuracies (stimulus configuration, F(2,110) = 2.89, p = 0.06; direction of attention, F(1,110) = 0.33, p = 0.94; interaction, F(2,110) = 0.43, p = 0.65), or number of saccades (stimulus configuration, F(2,110) = 1.57, p = 0.21; direction of attention, F(1,110) = 0.15, p = 0.70; interaction, F(2,110) = 1.01, p = 0.37) did not show any significant differences (Table 3).
Table 3.
Behavioral parameters
| Bilateral symmetrical | Unilateral double | Single | Bilateral diagonal | |
|---|---|---|---|---|
| Main experiment | ||||
| Reaction times (ms) | 797 (146) | 780 (142) | 786 (147) | |
| % Correct | 91.5 (7.5) | 91.6 (7.6) | 89.4 (10.2) | |
| Saccades per run | 0.66 (0.42) | 0.72 (0.31) | 0.56 (0.54) | |
| Effect of configuration axis across hemifields | ||||
| Reaction times (ms) | 857 (179) | 847 (172) | 845 (170) | |
| % Correct | 71.6 (9.9) | 70.9 (10.3) | 71.8 (8.8) | |
| Saccades per run | 0.60 (0.32) | 0.67 (0.49) | 0.54 (0.29) | |
The middle third of the left and right intraparietal sulcus was significantly more active when subjects had to select between bilateral symmetrical stimuli than between stimuli that were presented unilaterally along the vertical axis (−33, −66, 57, Z = 4.04, extent 62 3 × 3 × 3 mm3 voxels, corrected p < 0.001; 36, −60, 60, Z = 3.85, extent 22, corrected p = 0.026) (Fig. 4 A–C). It was also more active during bilateral symmetrical stimulation than during single stimulation (−27, −54, 57, Z = 3.75, extent 38, corrected p < 0.001), confirming previous results (Vandenberghe et al., 2005). When we subtracted the single stimulation conditions from the unilateral double stimulation conditions, activity in right (24, −66, 42, Z = 3.09, uncorrected voxel-level p = 0.001) and left IPS (−27, −51, 54, Z = 3.06, uncorrected voxel-level p < 0.005) tended to be higher during the unilateral double stimulation condition than during the single stimulation conditions.
Figure 4.
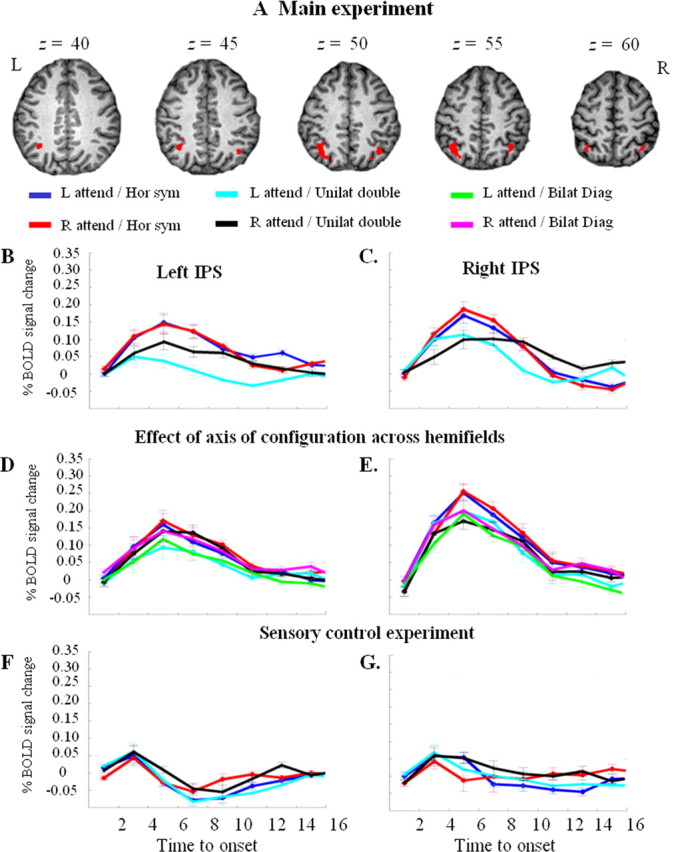
A, Main fMRI experiment. Brain activity map for the contrast of bilateral symmetrical stimulation minus unilateral vertical stimulation. Thresholded at uncorrected p < 0.001. B, C, Main fMRI experiment. Time-activity curves in the left (B) and right (C) IPS cluster, respectively, shown in A. Percentage of BOLD signal change averaged over all 23 healthy participants and all 3 × 3 × 3 mm3 voxels within the left (total number of voxels, 62) or right (total number of voxels, 22) IPS cluster, respectively. x-axis, Time in seconds. Dark blue, Left-sided attention, bilateral symmetrical stimulation; red, right-sided attention, bilateral symmetrical stimulation; cyan, left-sided attention, unilateral double stimulation along a vertical axis; black, right-sided attention, unilateral double stimulation. D, E, Effect of axis of configuration across hemifields. Green, Left-sided attention, bilateral diagonal stimulation; magenta, right-sided attention, bilateral diagonal stimulation. D, Percentage of BOLD signal change averaged over all 18 participants and all 62 voxels of the left IPS cluster shown in A. E, Percentage of BOLD signal change averaged over all 18 participants and all voxels of the right IPS area of overlap shown in yellow in Figure 6. Had we averaged all 22 voxels of the right IPS cluster shown in A, the profile would have been practically identical to that of the area of overlap. F, G, Sensory control experiment. F, Percentage of BOLD signal change averaged over all 12 participants and all 62 voxels of the left IPS cluster shown in A. G, Percentage of BOLD signal change averaged over all 12 participants and all voxels of the right IPS area of overlap shown in yellow in Figure 6. L, Left; R, right.
The contrast between bilateral symmetrical and unilateral double stimulation yielded two additional activations: one in the left occipitotemporal cortex (−45, −69, −12, Z = 4.22, extent 34, corrected p = 0.002) (Fig. 5), the other in the right middle frontal gyrus (48, 30, 33, Z = 4.30, extent 26, corrected p = 0.01). The latter cluster arose mainly from a differential decrease and will not be discussed any further.
Figure 5.

Main experiment. Time activity curve of the left occipitotemporal cluster of activity obtained by contrasting bilateral symmetrical stimulation minus unilateral double stimulation. Percentage of BOLD signal change was averaged for all 23 participants and all 34 voxels belonging to this cluster. The color code is identical to that used in Figure 4.
The contrast between left-sided and right-sided attention under bilateral symmetrical stimulation conditions did not yield significant activation at a p < 0.05 corrected for the whole-brain search volume (Fig. 4B,C). Under unilateral double stimulation conditions, the left intraparietal sulcus (−30, −57, 60, extent 51, Z = 4.22, corrected p < 0.05) and left medial parietal wall (−6, −48, 57, extent 20, Z = 4.55, corrected p < 0.05) were significantly more active during rightward compared with leftward orienting (Fig. 4B), along with extensive left-sided occipital activation (−51, −75, 9, extent 1112, Z = 5.97). The opposite contrast yielded extensive right-sided occipital activation (30, −84, 21, extent 1149, Z = 5.49), extending into the crossing between the IPS and the parieto-occipital sulcus (12, −87, 39, Z = 4.68). We did not find any direction sensitivity in the middle segment of the right IPS, even when we lowered our threshold to uncorrected p < 0.05 (Fig. 4C).
The activity map obtained during bilateral symmetrical minus unilateral double stimulation overlapped with the lesion-symptom map in the lower bank of the right middle IPS segment (Fig. 6). Three of 20 patients (cases 10, 11, and 20) had a lesion that included this volume of overlap (Fig. 7A,B,D). They all had a pathological LESS index. Inversely, among all four cases in which the LESS index was pathological, three (cases 10, 11, and 20) had a lesion that included the area of overlap (Fig. 7A,B,D), and one (case 17) had a lesion that lay just underneath (Fig. 7C).
Figure 6.
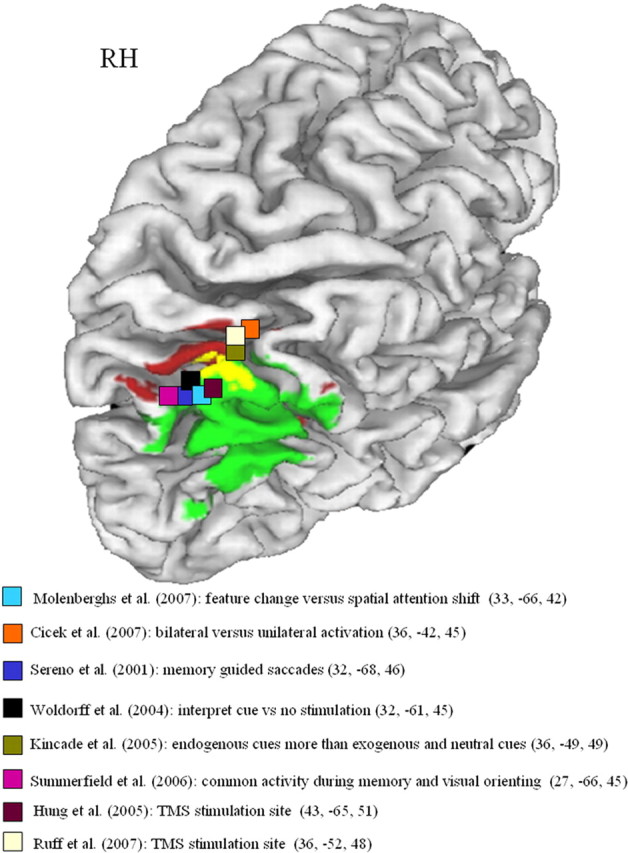
Overlap (yellow) between lesion-symptom map (green; Fig. 1B) and fMRI activity map (red; Fig. 4A). Projection on the cortical surface using CARET (http://brainmap.wustl.edu). A set of selected activity and rTMS peaks from the literature has also been added (Sereno et al., 2001; Woldorff et al., 2004; Hung et al., 2005; Kincade et al., 2005; Summerfield et al., 2006; Cicek et al., 2007; Molenberghs et al., 2007: Ruff et al., 2008). RH, Right hemisphere.
Figure 7.
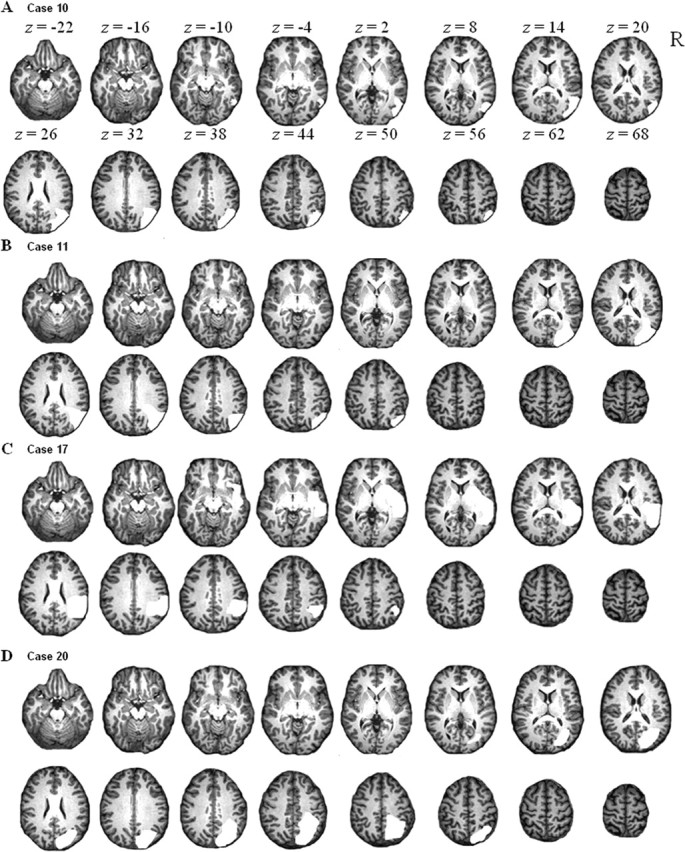
Lesion visualization in each of the four patients who had a pathological LESS index. The lesion is shown in white. Case numbers correspond to those in Table 1.
We saved the right IPS overlap as a volume of interest for subsequent analyses. To determine whether the IPS effects were specific for the right hemisphere, we also saved the left middle IPS activation from the contrast between bilateral symmetrical minus unilateral double stimulation (thresholded at an uncorrected p < 0.001) for additional analyses.
Sensory control experiment
Twelve subjects (six women, six men) participated in a sensory control experiment. Each run contained 40 trials of three different types: bilateral symmetrical, unilateral double along the vertical axis (20 to each side), and unilateral single (20 to each side) (Fig. 4F,G). Subjects were engaged in a central attention task, and the peripheral stimuli were entirely irrelevant. At the start of each event, a stimulus appeared at the center of the screen: a square or a diamond (side, 0.63°; duration, 200 ms). This was followed by a 50 ms delay, after which the grating stimuli appeared (duration, 200 ms). Subjects had to press a left- or a right-hand key button depending on the central shape. The intertrial interval was 2250 ms. Each run also contained 40 null events. All gratings had an orientation of 90°. Total number of volumes per functional imaging run was 186.
When the gratings were task irrelevant, fMRI responses during the bilateral symmetrical stimulation and unilateral double stimulation along the vertical axis did not differ in our right or left IPS volume of interest, even when the threshold was lowered to uncorrected p < 0.05 (Fig. 4F,G).
The contrast between left-sided and right-sided unilateral double stimulation yielded strong occipital activation contralaterally to the side of stimulation (left minus right: 0, −93, 15, Z = 5.40; 24, −90, 27, Z = 4.10, extent 107, corrected p < 0.001; right minus left: −12, −90, 0, Z = 4.39; −6, −84, 3, Z = 4.14, corrected p < 0.001). There were no significant differences between left- and right-sided unilateral double stimulation in the right or left IPS volumes of interest (Fig. 4F,G).
Orientation control experiment
To evaluate whether the IPS effect depended on the specific orientations used, we repeated bilateral symmetrical and unilateral stimulation along the vertical axis using 0° as the reference orientation of the gratings (Fig. 8A). Four subjects (two women, two men) participated. Each run contained 64 trials of each of the two event types plus 64 null events. On the basis of the previous psychophysical experiments, the orientation difference to be discriminated was set at 3° for bilateral symmetrical stimulation and 2.5° for the unilateral stimulation along the vertical axis. Event onset asynchrony was 3200 ms. All subjects completed four runs. The total number of volumes per functional imaging run was 308. The behavioral data and the fMRI data were analyzed using a fixed-effects analysis. A paired t test confirmed that reaction times (bilateral symmetrical, 751 ms, SD 93; unilateral vertical, 756 ms, SD 90; t(15) = 0.46; p = 0.65), accuracies (bilateral symmetrical, 88.4%, SD 6.5; unilateral vertical, 88.4%, SD 7.8; t(15) = 0.0; p = 1), or number of saccades (bilateral symmetrical, 0.88 saccades per run, SD 1.02; unilateral vertical, 0.75, SD 0.93; t(15) = −0.40; p = 0.70) did not differ between event types. During bilateral symmetrical stimulation, our volume of interest was more active than during unilateral double stimulation along the vertical axis (36, −63, 54, Z = 2.60, corrected p = 0.02) (Fig. 8B). This was also true for the left IPS (−39, −57, 39, Z = 3.15, corrected p = 0.03).
Figure 8.
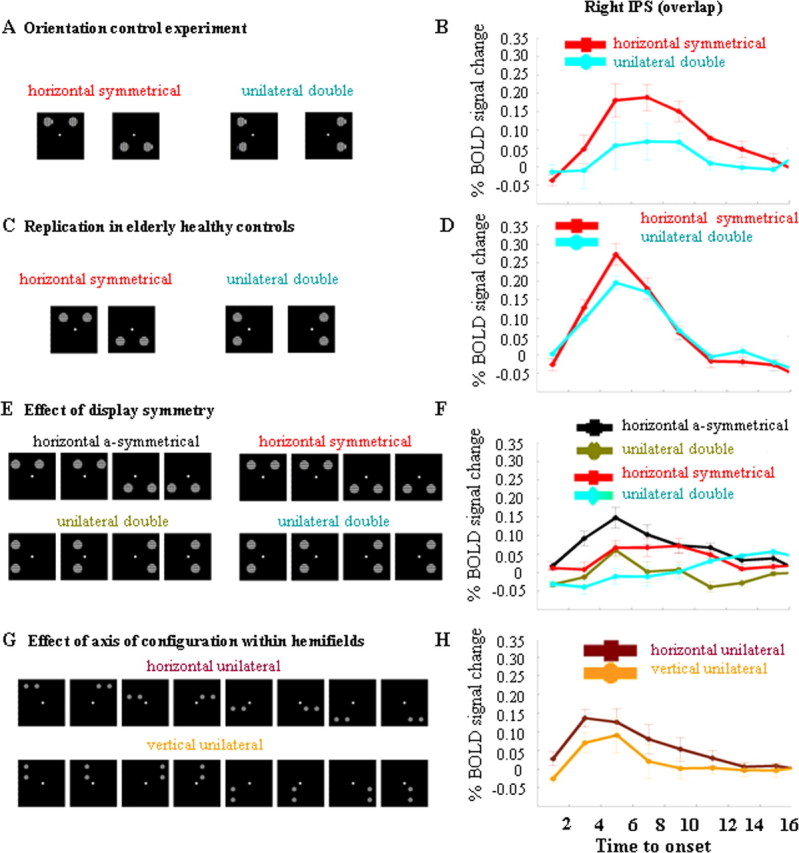
fMRI experiments in healthy volunteers. Left-sided and right-sided attention trials have been pooled. A, B, Orientation control experiment. A, Stimulus display. B, Time activity curve in the right IPS volume of overlap (Fig. 6, yellow), averaged over all four participants. C, D, Replication of the results from the main experiment in elderly controls. C, Stimulus display. D, Time activity curve in the right IPS volume of overlap, averaged over all eight participants E, F, Effect of display symmetry. E, Stimulus display. F, Time-activity curves, averaged over all 11 participants and all voxels belonging to the right IPS volume of overlap. G, H, Effect of axis of configuration within hemifields. G, Stimulus display. H, Time-activity curves. y-axis, Percentage BOLD signal increase, averaged over all eight participants and all voxels belonging to the right IPS volume of overlap.
Replication in elderly healthy controls
In eight elderly individuals (three women, five men; mean age, 61.1 years; SD 8.0), we repeated the main experiment. On the basis of previous psychophysical experiments, the orientation difference to be discriminated was set at 12° for bilateral symmetrical stimulation, 10° for unilateral stimulation along the vertical axis, and 8° for single stimulation. All subjects completed four runs. The behavioral data and the fMRI data were analyzed using a fixed-effects analysis. According to a one-way repeated measures ANOVA, reaction times (F(2,62) = 0.63; p = 0.53), accuracies (F(2,62) = 0.87; p = 0.42), or number of saccades (F(2,62) = 1.83; p = 0.17) did not differ between event types. During bilateral symmetrical stimulation, the right IPS was more active than during unilateral double stimulation along the vertical axis (36, −63, 54, Z = 2.34, corrected p = 0.03) (Fig. 8D) and more active than during single stimulation (36, −63, 54, Z = 2.31, corrected p = 0.04), replicating the results from the main experiment. In the left IPS, the effect did not reach significance (bilateral symmetrical minus unilateral double, −36, −63, 54, Z = 2.01; p = 0.08).
In a whole-brain search, during unilateral double stimulation, activity in right (24, −69, 60, Z = 3.27, uncorrected voxel-level p < 0.001) and left IPS (−33, −57, 60, Z = 3.77, uncorrected voxel-level p < 0.001) tended to be higher than during single stimulation. Within the a priori defined IPS regions, a trend in the same direction was found to the left (−24, −72, 54, Z = 2.43, corrected p = 0.17).
Effect of spatial configuration between stimuli
In a series of three event-related fMRI experiments in healthy subjects (Figs. 4D,E, 8E–H), we disentangled the effects of symmetry, axis of stimulus configuration, and bilaterality in the area of overlap. In each of the experiments, the direction of the cue (leftward versus rightward) and the position of the target (upper versus lower visual field) was matched between event types. Event onset asynchrony was always 3200 ms.
Effect of axis of configuration across hemifields
Eighteen healthy subjects (7 women, 11 men) participated. The six event types consisted of the following: bilateral stimulation along the diagonal axis, bilateral symmetrical stimulation and unilateral stimulation along the vertical axis, with leftward and rightward orienting trials (Fig. 4D,E). There were 16 trials per event type and 16 null events. All subjects completed six runs. The total number of volumes per functional imaging run was 186. On the basis of the previous psychophysical experiments, we set the rotation angle during the bilateral symmetrical stimulation events at 3° (90° reference orientation) and at 2° during bilateral diagonal stimulation and unilateral stimulation along a vertical axis.
A one-way repeated-measures ANOVA confirmed that reaction times (F(2,34) = 0.75; p = 0.48), accuracies (F(2,34) = 0.48; p = 0.62), or number of saccades (F(2,34) = 0.42; p = 0.66) did not differ between event types (Table 3).
During bilateral symmetrical stimulation, the right IPS was significantly more active than during bilateral stimulation along a diagonal axis (33, −66, 45, Z = 3.38; corrected p = 0.002) (Fig. 4E). It was also more active during bilateral symmetrical stimulation than during unilateral double stimulation along the vertical axis (45, −60, 57, Z = 2.38; corrected p = 0.04) (Fig. 4E), confirming the results from the main experiment. Activity in the right IPS did not differ between bilateral diagonal stimulation and unilateral stimulation along the vertical axis, even when the threshold was lowered to uncorrected p < 0.05 (Fig. 4E).
In the left IPS, activity tended to be higher during bilateral symmetrical stimulation than during bilateral stimulation along a diagonal axis (−30, −69, 51, Z = 3.09; corrected p = 0.054) or unilateral double stimulation along the vertical axis (−30, −69, 54, Z = 3.10; corrected p = 0.05) (Fig. 4D). Activity in left IPS did not differ between bilateral diagonal stimulation and unilateral stimulation along the vertical axis, even when the threshold was lowered to uncorrected p < 0.05.
During bilateral symmetrical stimulation conditions or during bilateral stimulation along the diagonal axis, the contrast between right-sided and left-sided attention did not yield any significant effects in our left or right IPS volumes of interest (Fig. 4D,E). When the two stimuli were unilaterally presented along a vertical axis, the left IPS was again significantly more active when the stimuli were presented contralaterally compared with ipsilateral stimulation (−24, −75, 51, Z = 4.29; corrected p < 0.001) (Fig. 4D).
Effect of symmetry
fMRI
Eleven subjects (five men, six women) participated in this experiment. We created asymmetrical stimulus pairs by means of a 3.06° leftward or rightward horizontal translation of the symmetrical bilateral stimulus pairs that had been used in the main experiment. As a control, we applied the same translation to the unilateral vertical stimulation pairs that had been used in the main experiment. In half of the trials, the translation was to the left, in the other half, the translation was to the right. The remaining two event types were identical to the symmetrical bilateral stimulation events and the unilateral vertical stimulation events used in the first fMRI experiment. This resulted in four event types (24 trials per event type per run) (Fig. 8E). Each run also contained 24 null events. All subjects completed six runs. Subjects had to press a left- or right-hand key depending on whether the target was rotated 1° clockwise or counter-clockwise with respect to the 90° reference orientation. The total number of volumes per functional imaging run was 192. The behavioral data and the fMRI data were analyzed using a fixed-effects analysis. Reaction times, accuracies, and eye movements were analyzed by means of a two-way repeated-measures ANOVA, with two factors: configuration axis (two levels: horizontal vs vertical) and translation (two levels: translated version vs original version). According to a two-way repeated-measures ANOVA, subjects responded more slowly when stimuli were configured along a horizontal compared with a vertical axis (bilateral symmetrical, 765 ms, SD 143; vertical control, 730 ms, SD 125; bilateral asymmetrical, 783, SD 145; corresponding vertical control, 760 ms, SD 157; F(1,195) = 14.85; p = 0.002). They also responded more slowly with the translated pairs than with the original stimulus pairs (F(1,195) = 9.80; p = 0.0002). There was no interaction between the two factors (reaction times, F(1,195) = 0.64; p = 0.42). Analysis of accuracies or number of saccades did not reveal any significant differences.
During bilateral asymmetrical stimulation, the right IPS area of overlap was more active than during the corresponding unilateral vertical stimulation conditions (33, −57, 48, Z = 3.53; corrected p = 0.001) (Fig. 8F). It was also more active during bilateral symmetrical stimulation than during the corresponding unilateral vertical control (36, −63, 54, Z = 2.53; corrected p = 0.02) (Fig. 8F). The conjunction between these two contrasts confirmed increased right IPS activation (36, −63, 54, Z = 3.65; corrected p < 0.001) (Fig. 8F). There was no interaction effect, even if we lowered the threshold to uncorrected p < 0.05. From this experiment, we conclude that display symmetry is not a critical determinant of the right IPS effect.
Patients
We reassessed cases 10, 17, and 20, which had a pathological LESS index at initial examination (case 11 had deceased) (Table 4) and tested them with horizontally aligned bilateral asymmetric stimuli. First, to determine the degree of recovery, we repeated the original experiment, with 36 trials per event type. Cases 17 and 20 again showed a pathological LESS index, whereas case 10 had recovered and his LESS index had normalized (Table 4). Second, we translated the horizontal and the vertical stimulus pairs 3.06° to the left or to the right, exactly as we described for the fMRI experiment in healthy controls. The number of trials of each type and orientation differences were identical to those of the initial experiment. The accuracy cost during contralesional orienting was larger when the asymmetric bilateral stimuli were aligned horizontally than with unilateral vertical stimulation. The effect size was comparable with that seen with symmetrical stimuli (Table 4).
Table 4.
Reassessment of the three patients who initially had a pathological LESS index
| Case | Time (weeks) | Contra |
Ipsi |
Inter (LESS) | Contra |
Ipsi |
Inter | Contra |
Ipsi |
Inter | ||||||
|---|---|---|---|---|---|---|---|---|---|---|---|---|---|---|---|---|
| B symm (%) | U vert (%) | B symm (%) | U vert (%) | B asymm (%) | Corr vert (%) | B asymm (%) | Corr vert (%) | Hor unilat (%) | Vert unilat (%) | Hor unilat (%) | Vert unilat (%) | |||||
| 20 | 68 | 58 | 67 | 78 | 69 | −18 | 56 | 78 | 75 | 69 | −28 | 53 | 78 | 75 | 75 | −25 |
| 17 | 64 | 58 | 69 | 67 | 64 | −14 | 56 | 69 | 64 | 61 | −16 | 56 | 66 | 63 | 63 | −10 |
| 10 | 164 | 89 | 89 | 89 | 83 | −6 | 97 | 94 | 92 | 97 | 2 | 81 | 78 | 78 | 81 | 0 |
The interaction refers to the difference between contralesional (Contra) and ipsilesional (Ipsi) orienting with horizontally configured stimuli versus vertically configured stimuli. B, Bilateral; symm, symmetrical; asymm, asymmetrical; Hor, horizontal; Vert, vertical; U unilateral; corr, corresponding; Inter, interaction. Bold indicates significant difference from 10 age-matched healthy controls at two-tailed p< 0.05 (Crawford and Garthwaite, 2005); underlined, significantly different from controls at two-tailed p< 0.005.
Effect of axis of configuration within hemifields
fMRI
Eight subjects (five women, three men) participated in this fMRI study. Pairs of gratings (diameter, 2.70°) were presented in one of the four quadrants. The gratings were positioned at the corners of an imaginary 5.2 × 5.2 degree squared, which was centered at 7.79° eccentricity on the diagonal axis. Each run contained 64 trials of each of the two event types: horizontal versus vertical configuration (Fig. 8G). Each possible position was occupied equally frequently during each event type. Each run also contained 64 null events. The orientation difference to be discriminated was 3° with respect to the 90° reference orientation for all the conditions. An instructive central cue indicated the exact location of the upcoming relevant stimulus. Event onset asynchrony was 3200 ms. All subjects completed four runs. The total number of volumes per functional imaging run was 308. fMRI and behavioral data were analyzed by means of a fixed-effects analysis. A paired t test revealed that subjects responded more slowly when stimuli were configured along a horizontal axis (819 ms; SD 163) compared with a vertical axis (787 ms; SD 179) (t(31) = 3.78; p < 0.001). There were no differences in accuracies (horizontal axis, 79.8%, SD 7.4; vertical axis, 79.0%, SD 7.1; t(31) = 0.70; p = 0.49) or eye movements (horizontal axis, 1.19, SD 1.20; vertical axis, 1.16, SD 1.32; t(31) = 0.10; p = 0.92).
When the relevant and the irrelevant stimulus were configured along a horizontal axis, the right IPS was more active than when they were configured along a vertical axis (36, −63, 54, Z = 3.08; corrected p = 0.004) (Fig. 8H). A similar effect was obtained in the left IPS (−24, −75, 51, Z = 3.28; corrected p = 0.02). We also examined the left occipitotemporal cluster that was obtained in the main experiment: It tended to be more active when the two stimuli were configured along a horizontal axis compared with a vertical axis (−39, −63, −18, Z = 2.65; corrected p = 0.07).
Patients
On the basis of this fMRI experiment, we re-examined cases 10, 17, and 20, which initially had a pathological LESS index (Table 4). We positioned the stimuli within the same quadrant, identically to the manipulation used with fMRI in healthy controls. In cases 17 and 20, the accuracy cost incurred when orienting to the most contralesional stimulus was as large when target and distracter were presented within the same hemifield on a horizontal compared with a vertical axis as when target and distracter were presented bilaterally (Table 4). The effect size did not depend on the hemifield in which the two stimuli were presented.
Discussion
The concordance between the lesion map and the fMRI activity map in healthy volunteers only became apparent when the two maps were overlaid directly (Fig. 6). Otherwise, the data might have looked as discrepant as previous comparisons between lesion and functional imaging studies did (compare Figs. 1B–D and 4A): the mathematical center of the lesion map (Fig. 1 B–D) lay at a distance from that of the activity map (Fig. 4A) and a significant portion of the lesion map did not overlap with the activity focus. The conjoined criterion we applied by overlaying the two maps (Fig. 6) allowed us to define the key neuroanatomical area, the lower bank of the middle third of the right IPS, much more reliably than if we had applied each of the two criteria in separation. There was also a striking functional concordance: in controls, spatial configuration axis modulated activity levels in the area of overlap, regardless of display symmetry or bilaterality of stimulation (Fig. 8 E–H). In patients in whom this area was lesioned, the axis of spatial configuration between target and distracter modulated performance levels accordingly (Table 4).
To the right, the angular gyrus, the superior temporal gyrus and the IPS were sampled with more or less equal frequency, but the superior parietal lobule (Vandenberghe et al., 2001a; Yantis et al., 2002), the left IPS, and left inferior parietal lobule did not belong to our lesion distribution volume (Fig. 1A). The absence of left IPS lesions (Fig. 1A) is attributable to the prevalence of aphasia after ischemic lesions in the vascular territory of the posterior branch of the left middle cerebral artery. Our data are therefore neutral with respect to the possible contribution of these areas to selective attention.
Larger lesions are more likely to cause attentional deficits than smaller lesions (Peers et al., 2005). Lesion size, however, cannot account for our findings. Our lesion mapping is based on an interaction between the direction of orienting and the spatial configuration between stimuli. General effects of stroke severity are likely to be subtracted out. There was no detectable relationship between lesion size and how spatial stimulus configuration affected the lateralized orienting deficit (Fig. 3, Table 1). Our findings result from a difference between three patients who had a lesion in the area of overlap and 17 patients who did not. The significance of our findings was confirmed by the permuted Brunner and Munzel rank-order test (Fig. 1B,C) (Rorden et al., 2007). A comparison of each single subject with normal controls also consistently revealed significant impairment in those cases that had lesions in or near the area of overlap (Fig. 7, Table 1) (Crawford and Garthwaite, 2005).
Could the effect of stimulus configuration be related to the use of oriented gratings as stimuli? Lateral masking studies (Polat and Sagi, 1994; Pavlovskaya et al., 1997) have provided psychophysical evidence for long-distance interactions between Gabor patches that depend on alignment axis and stimulus orientation. In our psychophysical experiments, the effect of configuration axis was independent of the orientations used for targets or distracters (Table 2). In an fMRI control experiment (Fig. 8A,B), the reference orientation was 0° (i.e., aligned with the vertical orientation axis), but we still obtained stronger IPS responses to horizontally versus vertically configured stimulus pairs, opposite to what one would predict on the basis of coaxiality between grating orientation and stimulus configuration axis. In patients, we used right oblique orientations, minimizing long-range interactions between grating orientations (Polat and Sagi, 1994; Pavlovskaya et al., 1997). For these reasons, we consider it unlikely that the effect of configuration axis is specifically related to the use of oriented gratings as stimuli.
Other spatial-attentional processes seen in neglect patients, such as deficits in spatial working memory (Malhotra et al., 2005; Mannan et al., 2005), in gaze-centric spatial remapping (Vuilleumier et al., 2007) or in stimulus-driven reorienting (Corbetta et al., 2000; Kincade et al., 2005), may relate to other parietal localizations (e.g., more inferiorly). Impaired performance on clinical tests such as target cancellation most likely results from a combination of different attentional deficits within the same patient (Malhotra et al., 2005; Mannan et al., 2005; Nachev and Husain, 2006).
At least one discrepancy remains: in patients, the contrast used for VLSM isolates the degree to which spatial configuration affects the lateralized orienting deficit (Table 1). Lesions of this IPS area result in strongly lateralized deficits, compatible with a role in spatial allocation of attention. In healthy volunteers, the activity map was based on a main effect of bilateral symmetrical versus unilateral double stimulation, regardless of direction of attention. We could not detect a clear effect of direction of attention in the middle IPS segment during bilateral symmetrical stimulation (Fig. 4 B–E), in line with numerous previous studies (Vandenberghe et al., 1997, 2000, 2001a,b, 2005; Geng et al., 2006). In that respect, the middle IPS segment substantially differs from the posterior third, near the crossing with the parieto-occipital sulcus, where clear visual responses and directional attentional enhancement can be obtained (Yantis et al., 2002; Vandenberghe et al., 2005). How can we reconcile the strong lateralization of the orienting deficit in right parietal lesion patients with the apparent absence of direction sensitivity in healthy controls in the volume of overlap during bilateral symmetrical stimulation? According to one influential theory (Weintraub and Mesulam, 1987; Mesulam 2000), left parietal cortex has a more strongly contralateral orienting bias than the right IPS, which processes left and right hemispace more evenly. Our fMRI data contained some effects in that direction. In healthy controls, during unilateral double stimulation conditions when the stimuli were task relevant (Fig. 4B,D), there was a significant effect of the direction of attention in the left IPS (Fig. 4B,D, black vs cyan) but not in the right IPS (Fig. 4C,E, cyan vs black). This was not seen during the sensory control experiment (Fig. 4F). This was the case in the main experiment (Fig. 4B,C) and was replicated in a subsequent study (Fig. 4D,E), confirming previous findings (Vandenberghe et al., 2005). When the right IPS is lesioned, the contralateral orienting bias in the left IPS may become unopposed (Kinsbourne 1977b; Corbetta et al., 2005) so that competition between stimuli that are located on the same left-right axis is resolved in favor of the ipsilesional competitor. In an MR image-guided transcranial magnetic stimulation (TMS) study in healthy volunteers (Hung et al., 2005), TMS of the right IPS (43, −65, 51, SD 5, 6, 4 mm) affected the competition between perceptually similar stimuli when they were presented bilaterally and symmetrically but not when the two stimuli were presented on a vertical axis within the same hemifield (Hung et al., 2005). These stimulus configurations are closely similar to those studied in our patients and in the main experiment. Stimulation of the symmetrical left-sided region did not have any effect (Hung et al., 2005).
The area of overlap is in close proximity to the putative human homolog of LIP (lateral intraparietal area) (Sereno et al., 2001) (Fig. 6), an area involved in selection between simultaneously presented stimuli (Wardak et al., 2002) and in the compilation of a saliency map (Gottlieb et al., 1998). We (Vandenberghe et al., 2005; Molenberghs et al., 2007) and others (Geng et al., 2006) previously proposed that the middle third of the lower bank of right IPS in humans fulfills a similar function. Our findings are compatible with this interpretation as even during unilateral double stimulation along the vertical axis activity tended to be higher than during single stimulation. A novel finding concerns the effect of a horizontal configuration axis. At which level of processing could the effect of configuration axis arise? As the behavioral data demonstrate, the distracter was not completely ignored but was processed up to a certain level, probably going through at least the early stages of visual processing (Rees et al., 2000; Vuilleumier et al., 2001). Even when the stimulus pair was presented within a same quadrant, left occipitotemporal activity tended to be higher when the relevant stimulus and the irrelevant stimulus were presented along a horizontal axis compared with a vertical axis, suggesting that configuration axis may influence responses in upstream visual areas. We propose that IPS acts as a source of attentional modulation (Kastner et al., 1999, 2004; Yantis et al., 2002; Pessoa et al., 2003; Ruff et al., 2008) of spatial interactions within (Kastner et al., 1998, 2001) or between (Gilbert, 1993; Polat and Norcia, 1996; Freeman et al., 2001; Angelucci et al., 2002; Brooks et al., 2005; Khoe et al., 2006) receptive fields that arise in upstream visual areas. The critical factor probably is whether the axis is horizontal in an egocentric rather than a gravitational or object-centered frame (Rafal, 1998). How configuration axis affects sensory and attentional responses in early visual cortex and how this factor interacts with receptive field size (Kastner et al., 2001) is a matter of additional investigation.
To conclude, the integration of lesion-symptom mapping and fMRI activity maps within one study provides converging evidence that the middle segment of the lower bank of the right IPS critically contributes to selection between competing stimuli. The behavioral as well as the fMRI effects are spatially anisotropic, with strongest attentional effects when stimuli are positioned along the same horizontal (left-right) axis.
Footnotes
This work was supported by the Fund for Scientific Research, Flanders, Belgium (G.0668.07 EuroCores Program), the Inter-University Attraction Pole P6/29, Katholieke Universiteit Leuven Grant OT/04/41, and Katholieke Universiteit Leuven Excellentiefinanciering EF/05/014. R.V. is a senior Clinical Investigator of the Fund for Scientific Research, Belgium. We thank Klaus Bundesen and Rufin Vogels for helpful discussions. We are most grateful to the patients who participated in this research.
References
- Angelucci A, Levitt J, Walton E, Huṕe J, Bullier J, Lund J. Circuits for local and global signal integration in primary visual cortex. J Neurosci. 2002;22:8633–8646. doi: 10.1523/JNEUROSCI.22-19-08633.2002. [DOI] [PMC free article] [PubMed] [Google Scholar]
- Ashburner J, Friston K. Nonlinear spatial normalization using basis functions. Hum Brain Mapp. 1999;7:254–266. doi: 10.1002/(SICI)1097-0193(1999)7:4<254::AID-HBM4>3.0.CO;2-G. [DOI] [PMC free article] [PubMed] [Google Scholar]
- Bates E, Wilson SM, Saygin AP, Dick F, Sereno MI, Knight RT, Dronkers NF. Voxel-based lesion-symptom mapping. Nat Neurosci. 2003;6:448–450. doi: 10.1038/nn1050. [DOI] [PubMed] [Google Scholar]
- Behrmann M, Ghiselli-Crippa T, Dimatteo I. Impaired initiation but not execution of contralesional saccades in hemispatial neglect. Behav Neurol. 2001;13:39–60. doi: 10.1155/2002/253201. [DOI] [PMC free article] [PubMed] [Google Scholar]
- Behrmann M, Ghiselli-Crippa T, Sweeney J, Dimatteo I, Kass R. Mechanisms underlying spatial representation revealed through studies of hemispatial neglect. J Cogn Neurosci. 2002;14:272–290. doi: 10.1162/089892902317236894. [DOI] [PubMed] [Google Scholar]
- Bender M. Springfield, IL: C.C. Thomas; 1952. Disorders in perception (with particular reference to the phenomena of extinction and displacement) [Google Scholar]
- Brooks J, Wong Y, Robertson L. Crossing the midline: reducing attentional deficits via interhemispheric interactions. Neuropsychologia. 2005;43:572–582. doi: 10.1016/j.neuropsychologia.2004.07.009. [DOI] [PubMed] [Google Scholar]
- Cicek M, Gitelman D, Hurley R, Nobre A, Mesulam M. Anatomical physiology of spatial extinction. Cereb Cortex. 2007;17:2892–2898. doi: 10.1093/cercor/bhm014. [DOI] [PubMed] [Google Scholar]
- Corbetta M, Shulman G. Control of goal-directed and stimulus-driven attention in the brain. Nat Rev Neurosci. 2002;3:201–215. doi: 10.1038/nrn755. [DOI] [PubMed] [Google Scholar]
- Corbetta M, Miezin F, Shulman G, Petersen S. A PET study of visuospatial attention. J Neurosci. 1993;13:1202–1226. doi: 10.1523/JNEUROSCI.13-03-01202.1993. [DOI] [PMC free article] [PubMed] [Google Scholar]
- Corbetta M, Kincade J, Ollinger J, McAvoy M, Shulman G. Voluntary orienting is dissociated from target detection in human posterior parietal cortex. Nat Neurosci. 2000;3:292–297. doi: 10.1038/73009. [DOI] [PubMed] [Google Scholar]
- Corbetta M, Kincade M, Lewis C, Snyder A, Sapir A. Neural basis and recovery of spatial attention deficits in spatial neglect. Nat Neurosci. 2005;8:1603–1610. doi: 10.1038/nn1574. [DOI] [PubMed] [Google Scholar]
- Crawford J, Garthwaite P. Testing for suspected impairments and dissociations in single-case studies in neuropsychology: evaluation of alternatives using Monte Carlo simulations and revised tests for dissociations. Neuropsychology. 2005;19:318–331. doi: 10.1037/0894-4105.19.3.318. [DOI] [PubMed] [Google Scholar]
- di Pellegrino G, de Renzi E. An experimental investigation on the nature of extinction. Neuropsychologia. 1995;33:153–170. doi: 10.1016/0028-3932(94)00111-2. [DOI] [PubMed] [Google Scholar]
- Doricchi F, Galati G, DeLuca L, Nico D, D'Olimpio F. Horizontal space misrepresentation in unilateral brain damage. I. Visual and proprioceptive-motor influences in left unilateral neglect. Neuropsychologia. 2002;8:1107–1117. doi: 10.1016/s0028-3932(02)00010-6. [DOI] [PubMed] [Google Scholar]
- Freeman E, Sagi D, Driver J. Lateral interactions between targets and flankers in low-level vision depend on attention to the flankers. Nat Neurosci. 2001;4:1032–1036. doi: 10.1038/nn728. [DOI] [PubMed] [Google Scholar]
- Friston K, Holmes A, Worsley K, Poline J, Frith C, Heather J, Frackowiak R. Statistical parametric maps in functional imaging: a general approach. Hum Brain Mapp. 1995;2:189–210. [Google Scholar]
- Gauthier L, Dehaut F, Joanette Y. The bells test: a quantitative and qualitative test for visual neglect. Int J Clin Neuropsychol. 1989;11:49–54. [Google Scholar]
- Geeraerts S, Lafosse C, Vandenbussche E, Verfaillie K. A psychophysical study of visual extinction: ipsilesional distractor interference with contralesional orientation thresholds in visual hemineglect patients. Neuropsychologia. 2005;43:530–541. doi: 10.1016/j.neuropsychologia.2004.07.012. [DOI] [PubMed] [Google Scholar]
- Geng J, Eger E, Ruff CC, Kristjnsson A, Rotshtein P, Driver J. Online attentional selection from competing stimuli in opposite visual fields: effects on human visual cortex and control processes. J Neurophysiol. 2006;96:26012612. doi: 10.1152/jn.01245.2005. [DOI] [PubMed] [Google Scholar]
- Giesbrecht B, Woldorff M, Song A, Mangun G. Neural mechanisms of top-down control during spatial and feature attention. NeuroImage. 2003;19:496–512. doi: 10.1016/s1053-8119(03)00162-9. [DOI] [PubMed] [Google Scholar]
- Gilbert C. Circuitry, architecture, and functional dynamics of visual cortex. Cereb Cortex. 1993;3:373–386. doi: 10.1093/cercor/3.5.373. [DOI] [PubMed] [Google Scholar]
- Gottlieb J, Kusunoki M, Goldberg M. The representation of visual salience in monkey parietal cortex. Nature. 1998;391:481–483. doi: 10.1038/35135. [DOI] [PubMed] [Google Scholar]
- Hillis A, Newhart M, Heidler J, Barker P, Herskovits EH, Degaonkar M. Anatomy of spatial attention: insights from perfusion imaging and hemispatial neglect in acute stroke. J Neurosci. 2005;25:3161–3167. doi: 10.1523/JNEUROSCI.4468-04.2005. [DOI] [PMC free article] [PubMed] [Google Scholar]
- Hillis A, Kleinman J, Newhart M, Heidler-Gary J, Gottesman R, Barker P, Aldrich E, Llinas R, Wityk R, Chaudhry P. Restoring cerebral blood flow reveals neural regions critical for naming. J Neurosci. 2006;26:8069–8073. doi: 10.1523/JNEUROSCI.2088-06.2006. [DOI] [PMC free article] [PubMed] [Google Scholar]
- Hung J, Driver J, Walsh V. Visual selection and posterior parietal cortex: effects of repetitive transcranial magnetic stimulation on partial report analyzed by bundesen's theory of visual attention. J Neurosci. 2005;25:9602–9612. doi: 10.1523/JNEUROSCI.0879-05.2005. [DOI] [PMC free article] [PubMed] [Google Scholar]
- Husain M, Rorden C. Non-spatially lateralized mechanisms in hemispatial neglect. Nat Rev Neurosci. 2003;4:26–36. doi: 10.1038/nrn1005. [DOI] [PubMed] [Google Scholar]
- Karnath H, Ferber S, Himmelbach M. Spatial awareness is a function of the temporal not the posterior parietal lobe. Nature. 2001;411:950–953. doi: 10.1038/35082075. [DOI] [PubMed] [Google Scholar]
- Karnath H, Himmelbach M, Küker W. The cortical substrate of visual extinction. NeuroReport. 2003;14:437–442. doi: 10.1097/01.wnr.0000059778.23521.88. [DOI] [PubMed] [Google Scholar]
- Kastner S, Pinsk M. Visual attention as a multilevel selection process. Cogn Affect Behav Neurosci. 2004;4:483–500. doi: 10.3758/cabn.4.4.483. [DOI] [PubMed] [Google Scholar]
- Kastner S, De Weerd P, Desimone R, Ungerleider L. Mechanisms of directed attention in the human extrastriate cortex as revealed by functional MRI. Science. 1998;282:108–111. doi: 10.1126/science.282.5386.108. [DOI] [PubMed] [Google Scholar]
- Kastner S, Pinsk M, De Weerd P, Desimone R, Ungerleider L. Increased activity in human visual cortex during directed attention in the absence of visual stimulation. Neuron. 1999;22:751–761. doi: 10.1016/s0896-6273(00)80734-5. [DOI] [PubMed] [Google Scholar]
- Kastner S, De Weerd P, Pinsk M, Elizondo M, Desimone R, Ungerleider L. Modulation of sensory suppression: implications for receptive field size in the human visual cortex. J Neurophysiol. 2001;86:1398–1411. doi: 10.1152/jn.2001.86.3.1398. [DOI] [PubMed] [Google Scholar]
- Kerkhoff G. Multiple perceptual distortions and their modulation in left-sided visual neglect. Neuropsychologia. 2000;38:1073–1086. doi: 10.1016/s0028-3932(99)00140-2. [DOI] [PubMed] [Google Scholar]
- Khoe W, Freeman E, Woldorff M, Mangun G. Interactions between attention and perceptual grouping in human visual cortex. Brain Res. 2006;1078:101–111. doi: 10.1016/j.brainres.2005.12.083. [DOI] [PubMed] [Google Scholar]
- Kincade J, Abrams R, Astafiev S, Shulman G, Corbetta M. An event-related functional magnetic resonance imaging study of voluntary and stimulus-driven orienting of attention. J Neurosci. 2005;25:4593–4604. doi: 10.1523/JNEUROSCI.0236-05.2005. [DOI] [PMC free article] [PubMed] [Google Scholar]
- Kinsbourne M. Hemineglect and hemisphere rivalry. Adv Neurol. 1977;18:41–49. [PubMed] [Google Scholar]
- Ladavas E. Is the hemispatial deficit produced by right parietal lobe damage associated with retinal or gravitational coordinates? Brain. 1987;110:167–180. doi: 10.1093/brain/110.1.167. [DOI] [PubMed] [Google Scholar]
- Malhotra P, Jäger H, Parton A, Greenwood R, Playford E, Brown M, Driver J, Husain M. Spatial working memory capacity in unilateral neglect. Brain. 2005;128:424–435. doi: 10.1093/brain/awh372. [DOI] [PubMed] [Google Scholar]
- Mannan S, Mort D, Hodgson T, Driver J, Kennard C, Husain M. Revisiting previously searched locations in visual neglect: role of right parietal and frontal lesions in misjudging old locations as new. J Cogn Neurosci. 2005;17:340–354. doi: 10.1162/0898929053124983. [DOI] [PubMed] [Google Scholar]
- Mesulam M. Attentional networks, confusional states and neglect syndromes. In: Mesulam M, editor. Principles of behavioral and cognitive neurology. New York: Oxford UP; 2000. pp. 174–256. [Google Scholar]
- Milner A, Harvey M. Distortion of size perception in visuospatial neglect. Curr Biol. 1995;5:85–89. doi: 10.1016/s0960-9822(95)00020-0. [DOI] [PubMed] [Google Scholar]
- Molenberghs P, Mesulam M, Peeters R, Vandenberghe R. Re-mapping attentional priorities: differential contribution of superior parietal lobule and intraparietal sulcus. Cereb Cortex. 2007;17:2703–2712. doi: 10.1093/cercor/bhl179. [DOI] [PubMed] [Google Scholar]
- Mort D, Malhotra P, Mannan S, Rorden C, Pambakian A, Kennard C, Husain M. The anatomy of visual neglect. Brain. 2003;126:1986–1997. doi: 10.1093/brain/awg200. [DOI] [PubMed] [Google Scholar]
- Nachev P, Husain M. Disorders of visual attention and the posterior parietal cortex. Cortex. 2006;42:766–773. doi: 10.1016/s0010-9452(08)70415-5. [DOI] [PubMed] [Google Scholar]
- Nobre A, Sebestyen G, Gitelman D, Mesulam M, Frackowiak R, Frith C. Functional localization of the system for visuospatial attention using positron emission tomography. Brain. 1997;120:515–533. doi: 10.1093/brain/120.3.515. [DOI] [PubMed] [Google Scholar]
- Oldfield R. The assessment and analysis of handedness: the Edinburgh inventory. Neuropsychologia. 1971;9:97–113. doi: 10.1016/0028-3932(71)90067-4. [DOI] [PubMed] [Google Scholar]
- Pardo J, Fox P, Raichle M. Localization of a human system for sustained attention by positron emission tomography. Nature. 1991;349:61–64. doi: 10.1038/349061a0. [DOI] [PubMed] [Google Scholar]
- Pavlovskaya M, Sagi D, Soroker N, Ring H. Visual extinction and cortical connectivity in human vision. Cogn Brain Res. 1997;6:159–162. doi: 10.1016/s0926-6410(97)00028-1. [DOI] [PubMed] [Google Scholar]
- Peers P, Ludwig C, Rorden C, Cusack R, Bonfiglioli C, Bundesen C, Driver J, Antoun N, Duncan J. Attentional functions of parietal and frontal cortex. Cereb Cortex. 2005;15:1469–1484. doi: 10.1093/cercor/bhi029. [DOI] [PubMed] [Google Scholar]
- Pessoa L, Kastner S, Ungerleider L. Neuroimaging studies of attention: from modulation of sensory processing to top-down control. J Neurosci. 2003;23:3990–3998. doi: 10.1523/JNEUROSCI.23-10-03990.2003. [DOI] [PMC free article] [PubMed] [Google Scholar]
- Polat U, Norcia A. Neurophysiological evidence for contrast dependent long-range facilitation and suppression in human visual cortex. Vision Res. 1996;36:2099–2109. doi: 10.1016/0042-6989(95)00281-2. [DOI] [PubMed] [Google Scholar]
- Polat U, Sagi D. Spatial interactions in human vision: from near to far via experience-dependent cascades of connections. Proc Natl Acad Sci USA. 1994;91:1206–1209. doi: 10.1073/pnas.91.4.1206. [DOI] [PMC free article] [PubMed] [Google Scholar]
- Poline J, Worsley K, Evans A, Friston K. Combining spatial extent and peak intensity to test for activations in functional imaging. NeuroImage. 1997;5:83–96. doi: 10.1006/nimg.1996.0248. [DOI] [PubMed] [Google Scholar]
- Pollmann S, Weidner R, Humphreys G, Olivers C, Müller K, Lohmann G, Wiggins C, Watson D. Separating distractor rejection and target detection in posterior parietal cortex: an event-related fMRI study of visual marking. NeuroImage. 2003;18:310–323. doi: 10.1016/s1053-8119(02)00036-8. [DOI] [PubMed] [Google Scholar]
- Posner M, Walker J, Friedrich F, Rafal R. Effects of parietal injury on covert orienting of attention. J Neurosci. 1984;4:1863–1874. doi: 10.1523/JNEUROSCI.04-07-01863.1984. [DOI] [PMC free article] [PubMed] [Google Scholar]
- Posner M, Walker J, Friedrich F, Rafal R. How do the parietal lobes direct covert attention? Neuropsychologia. 1987;25:135–145. doi: 10.1016/0028-3932(87)90049-2. [DOI] [PubMed] [Google Scholar]
- Rafal R. Neglect. In: Parasuraman R, editor. The attentive brain. Cambridge, MA: MIT; 1998. pp. 489–525. [Google Scholar]
- Rees G, Wojciulik E, Clarke K, Husain M, Frith C, Driver J. Unconscious activation of visual cortex in the damaged right hemisphere of a parietal patient with extinction. Brain. 2000;123:1624–1633. doi: 10.1093/brain/123.8.1624. [DOI] [PubMed] [Google Scholar]
- Riddoch M, Humphreys G. Hove, UK: Lawrence Erlbaum; 1993. Birmingham object recognition battery. [Google Scholar]
- Rorden C, Brett M. Stereotaxic display of brain lesions. Behav Neurol. 2000;12:191–200. doi: 10.1155/2000/421719. [DOI] [PubMed] [Google Scholar]
- Rorden C, Karnath H, Bonilha L. Improving lesion-symptom mapping. J Cogn Neurosci. 2007;19:1081–1088. doi: 10.1162/jocn.2007.19.7.1081. [DOI] [PubMed] [Google Scholar]
- Ruff C, Bestmann S, Blankenburg F, Bjoertomt O, Josephs O, Weiskopf N, Deichmann R, Driver J. Distinct causal influences of parietal versus frontal areas on the human visual cortex: evidence from concurrent TMS-fMRI. Cereb Cortex. 2008;18:817–827. doi: 10.1093/cercor/bhm128. [DOI] [PMC free article] [PubMed] [Google Scholar]
- Schenkenberg T, Bradford D, Ajax E. Line bisection and unilateral visual neglect in patients with neurologic impairment. Neurology. 1980;30:509–517. doi: 10.1212/wnl.30.5.509. [DOI] [PubMed] [Google Scholar]
- Serences J, Yantis S. Spatially selective representations of voluntary and stimulus-driven attentional priority in human occipital, parietal and frontal cortex. Cereb Cortex. 2007;17:284–293. doi: 10.1093/cercor/bhj146. [DOI] [PubMed] [Google Scholar]
- Sereno M, Pitzalis S, Martinez A. Mapping of contralateral space in retinotopic coordinates by a parietal cortical area in humans. Science. 2001;294:1350–1354. doi: 10.1126/science.1063695. [DOI] [PubMed] [Google Scholar]
- Smania N, Martini M, Gambina G, Tomelleri G, Palamara A, Natale E, Marzi C. The spatial distribution of visual attention in hemineglect and extinction patients. Brain. 1998;121:1759–1770. doi: 10.1093/brain/121.9.1759. [DOI] [PubMed] [Google Scholar]
- Summerfield J, Lepsien J, Gitelman D, Mesulam M, Nobre A. Orienting attention based on long-term memory experience. Neuron. 2006;49:905–916. doi: 10.1016/j.neuron.2006.01.021. [DOI] [PubMed] [Google Scholar]
- Talairach J, Tournoux P. New York: Thieme Medical; 1988. Co-planar stereotaxic atlas of the human brain. [Google Scholar]
- Tyler L, Marslen-Wilson W, Stamatakis E. Dissociating neuro-cognitive component processes: voxel-based correlational methodology. Neuropsychologia. 2005;43:771–778. doi: 10.1016/j.neuropsychologia.2004.07.020. [DOI] [PubMed] [Google Scholar]
- Vandenberghe R, Duncan J, Dupont P, Ward R, Poline J, Bormans G, Michiels J, Mortelmans L, Orban G. Attention to one or two features in left or right visual field: a positron emission tomography study. J Neurosci. 1997;17:3739–3750. doi: 10.1523/JNEUROSCI.17-10-03739.1997. [DOI] [PMC free article] [PubMed] [Google Scholar]
- Vandenberghe R, Duncan J, Arnell K, Bishop S, Herrod N, Owen A, Minhas P, Dupont P, Pickard J, Orban G. Maintaining and shifting attention within left or right hemifield. Cereb Cortex. 2000;10:706–713. doi: 10.1093/cercor/10.7.706. [DOI] [PubMed] [Google Scholar]
- Vandenberghe R, Gitelman D, Parrish T, Mesulam M. Functional specificity of superior parietal mediation of spatial shifting. NeuroImage. 2001a;14:661–673. doi: 10.1006/nimg.2001.0860. [DOI] [PubMed] [Google Scholar]
- Vandenberghe R, Gitelman D, Parrish T, Mesulam M. Location- or feature-based targeting of peripheral attention. NeuroImage. 2001b;14:34–47. doi: 10.1006/nimg.2001.0790. [DOI] [PubMed] [Google Scholar]
- Vandenberghe R, Geeraerts S, Molenberghs P, Lafosse C, Vandenbulcke M, Peeters K, Peeters R, Van Hecke P, Orban G. Attentional responses to unattended stimuli in human parietal cortex. Brain. 2005;128:2843–2857. doi: 10.1093/brain/awh522. [DOI] [PubMed] [Google Scholar]
- Vuilleumier P, Rafal R. A systematic study of visual extinction. Between- and within-field deficits of attention in hemispatial neglect. Brain. 2000;123:1263–1279. doi: 10.1093/brain/123.6.1263. [DOI] [PubMed] [Google Scholar]
- Vuilleumier P, Sagiv N, Hazeltine E, Poldrack R, Swick D, Rafal R, Gabrieli J. Neural fate of seen and unseen faces in visuospatial neglect: a combined event-related functional MRI and event-related potential study. Proc Natl Acad Sci USA. 2001;98:3495–3500. doi: 10.1073/pnas.051436898. [DOI] [PMC free article] [PubMed] [Google Scholar]
- Vuilleumier P, Sergent C, Schwartz S, Valenza N, Girardi M, Husain M, Driver J. Impaired perceptual memory of locations across gaze-shifts in patients with unilateral spatial neglect. J Cogn Neurosci. 2007;19:1388–1406. doi: 10.1162/jocn.2007.19.8.1388. [DOI] [PMC free article] [PubMed] [Google Scholar]
- Wager T, Nichols T. Optimization of experimental design in fMRI: a general framework using a genetic algorithm. NeuroImage. 2002;18:293–309. doi: 10.1016/s1053-8119(02)00046-0. [DOI] [PubMed] [Google Scholar]
- Wardak C, Olivier E, Duhamel J. Saccadic target selection deficits after lateral intraparietal area inactivation in monkeys. J Neurosci. 2002;22:9877–9884. doi: 10.1523/JNEUROSCI.22-22-09877.2002. [DOI] [PMC free article] [PubMed] [Google Scholar]
- Weintraub S, Mesulam M. Right cerebral dominance in spatial attention. Arch Neurol. 1987;44:621–624. doi: 10.1001/archneur.1987.00520180043014. [DOI] [PubMed] [Google Scholar]
- Woldorff M, Hazlett C, Fichtenholtz H, Weisman D, Dale A, Song A. Functional parcellation of attentional control regions of the brain. J Cogn Neurosci. 2004;16:149–165. doi: 10.1162/089892904322755638. [DOI] [PubMed] [Google Scholar]
- Yantis S, Schwarzbach J, Serences J, Carlson R, Steinmetz M, Pekar J, Courtney S. Transient neural activity in human parietal cortex during spatial attention shifts. Nat Neurosci. 2002;5:995–1003. doi: 10.1038/nn921. [DOI] [PubMed] [Google Scholar]