

Abstract
Gliosis is a pathological hallmark of posttraumatic epileptic foci, but little is known about these reactive astrocytes beyond their high glial fibrillary acidic protein (GFAP) expression. Using diolistic labeling, we show that cortical astrocytes lost their nonoverlapping domain organization in three mouse models of epilepsy: posttraumatic injury, genetic susceptibility, and systemic kainate exposure. Neighboring astrocytes in epileptic mice showed a 10-fold increase in overlap of processes. Concurrently, spine density was increased on dendrites of excitatory neurons. Suppression of seizures by the common antiepileptic, valproate, reduced the overlap of astrocytic processes. Astrocytic domain organization was also preserved in APP transgenic mice expressing a mutant variant of human amyloid precursor protein despite a marked upregulation of GFAP. Our data suggest that loss of astrocytic domains was not universally associated with gliosis, but restricted to seizure pathologies. Reorganization of astrocytes may, in concert with dendritic sprouting and new synapse formation, form the structural basis for recurrent excitation in the epileptic brain.
Keywords: diolistic labeling, EEG, dendritic sprouting, mice model, fluorescence microscopy, glia
Introduction
Astrocytes exhibit altered morphology early in the course of many CNS diseases, and are referred to as “reactive” astrocytes. Reactive astrocytes in both acute and chronic CNS diseases feature an upregulation of glial fibrillary acidic protein (GFAP) expression and an apparent hypertrophy of cell bodies and processes. Reactive gliosis was first described in the 19th century by Virchow, who observed a pathologic increase in the fibrillary nature of the normally granular-appearing spinal cord in a patient with neurosyphilis (Weigert, 1895). Antibodies against GFAP revealed that fibrous gliosis was caused by the accumulation of this intermediate filament protein, and this feature quickly became the standard marker for reactive astrocytes, as well as a sensitive but nonspecific indicator for brain injury (Bignami and Dahl, 1976). Although reactive gliosis is a stereotypic response of astrocytes to stress, little is known with regard to its functional consequences. Recent studies have shown that astrocytes play prominent roles in diverse neurological diseases such as Alexander's disease and amyotrophic lateral sclerosis, underscoring the need for a better understanding of reactive astrocytes (Rothstein et al., 1995; Brenner et al., 2001; Maragakis and Rothstein, 2006; Nagai et al., 2007).
Reactive changes of astrocytes may be of particular interest in epilepsy: the severity of gliosis is a predictor of developing posttraumatic epilepsy (Guerreiro et al., 2003), and intraoperative recordings have indicated that temporal lobe epilepsy and posttraumatic seizures are often initiated in, or immediately adjacent to, glial scar tissue (McKhann et al., 2000). Although numerous studies have documented morphological changes of neurons in epilepsy, little effort has been devoted to astrocytes beyond the observation that GFAP expression is conspicuously upregulated.
A novel concept is that cortical and hippocampal astrocytes are organized in nonoverlapping spatial domains with limited interdigitation of processes of adjacent cells in normal brain (Bushong et al., 2002; Ogata and Kosaka, 2002; Halassa et al., 2007). Through a process termed “tiling,” astrocytic processes grow within exclusive territories during development when neuronal and vascular territories are also being established. It is estimated that one domain encompasses ∼140,000 synapses in rodent brain and 2,000,000 synapses in human brain (Bushong et al., 2002; Oberheim et al., 2006). Each domain represents an area of the neuropil that is under control of a single astrocyte or an entity of synaptic modulation independent of neural networking (Volterra and Meldolesi, 2005).
Using the technique of diolistic labeling to visualize the full three-dimensional (3-D) structure of astrocytes, we demonstrate that reactive gliosis in epileptic mice was accompanied by a marked loss of astrocytic domain organization. Processes from neighboring cortical astrocytes exhibited an 8- to 15-fold increase in overlap in epileptic mice. Astrocytic reorganization was, at least in part, a consequence of repeated seizure events, because the loss of domains was reduced or even prevented if the seizures were medically suppressed.
Overlapping astrocytic processes were accompanied by neuronal changes, including hypertrophy of apical dendrites and increased spine density, suggesting that morphological changes of both astrocytes and neurons are required for establishment of the recurrent excitatory pathways underlying epilepsy.
Materials and Methods
Animal preparation
Intracortical iron injection.
Eight- to 10-week-old FVB/NJ, FVB/N-Tg(GFAP-GFP), or Tg(Thy1-YFPH)2Jrs mice (The Jackson Laboratory, Bar Harbor, ME) were anesthetized with a mixture of ketamine (60 mg/kg, i.p.) and xylazine (10 mg/kg, i.p.) and positioned in a stereotaxic frame. After a small craniotomy and opening of the dura, 1.0 μl of 100 mm ferrous chloride solution, or saline for control, was injected into sensorimotor cortex (1.5–2.0 mm posterior to bregma, 1.0–1.5 mm lateral to midline, and 0.5–1.0 mm below the cortical surface) at a rate of 0.2 μl/min using a microprocessor-controlled syringe pump (Model 210; Stoelting, Wood Dale, IL) (Willmore et al., 1978).
Kainate injection.
Eight- to 10-week-old FVB/NJ mice (The Jackson Laboratory) were administered kainic acid (30 mg/kg, i.p.) (Schauwecker, 2003). Mice that demonstrated 1 h of continuous stage 5 seizures were treated with sodium pentobarbital (30 mg/kg, s.c.) to terminate seizures 1 h after onset and were used in the study. Control mice were treated with kainate vehicle (saline) or sodium pentobarbital only (30 mg/kg, s.c.).
SWXL4/TyJ mice.
SWXL4/TyJ mice (The Jackson Laboratory) underwent normal handling as well as rhythmic tossing to induce spontaneous tonic-clonic and generalized seizures in adulthood.
Tg2576 mice.
Tg2576 mice (Taconic, Hudson, NY), the APP transgenic mouse model of Alzheimer's disease, underwent routine handling. All experiments were approved by the Institutional Animal Care and Use Committee of the University of Rochester.
Electroencephalography monitoring and behavioral observation
Mice were anesthetized using ketamine (100 mg/kg) and xylazine (25 mg/kg) and positioned in a stereotaxic frame. Two or three 0.075-mm-diameter platinum electrodes (MS303/9 or MS333/9; Plastics One, Roanoke, VA) were surgically implanted above the dura over the sensorimotor cortex (1.5–2.0 mm posterior to bregma, 1.0–3.0 mm lateral to midline, and above the dura) (Bragin et al., 1999). Electroencephalography (EEG) was continuously recorded for 10–15 h by a DP-311 Differential Amplifier (Warner Instruments, Hamden, CT) with a low-frequency filter at 0.1 Hz and high-frequency filter at 100 Hz (Ayala and Tapia, 2003), and pCLAMP 9.2 program (Axon Instruments, Sunnyvale, CA) with an interval of 200 μs. Concurrent with EEG recording, mice were videotaped for behavioral analysis using a PhenoTyper video-based monitoring system (Noldus Information Technology, Leesburg, VA) with Studio software 10 (Pinnacle Systems, Mountain View, CA).
Treatment with antiepileptic drugs
Eight- to 10-week-old FVB/NJ mice were treated with valproate (200 mg/kg, i.p.) 30 min before intracortical iron injection and EEG electrode implantation, and then treated daily with valproate (200 mg/kg, i.p.) for 1 week with EEG monitoring.
Immunofluorescence
Mice were deeply anesthetized with a mixture of ketamine (60 mg/kg, i.p.) and xylazine (10 mg/kg, i.p.) and fixed in situ by perfusion of PBS containing 4% paraformaldehyde (PFA). Brains were removed and washed overnight in PBS at 4°C. Vibratome sections of 200 μm were prepared (Technical Products International, St. Louis, MO) and immersed in PBS at 4°C. Sections for immunohistochemistry were postfixed for 1 h in 4% PFA and then washed for up to 4 h in PBS. Sections were then incubated in 5% normal donkey serum (NDS) (Jackson ImmunoResearch Laboratories, West Grove, PA) and 0.5–1% Triton X-100 (Sigma-Aldrich, St. Louis, MO) for 1 h. Sections were incubated in primary antibody in 1% NDS and 0.1–0.5% Triton X-100 overnight at 4°C. Primary antibodies used included monoclonal anti-GFAP (mAB360; 1:500; Millipore, Billerica, MA) and polyclonal chicken anti-Map2 (ab5392; 1:5000; Abcam, Cambridge, MA). Sections were then washed and incubated in secondary antibodies (Jackson ImmunoResearch Laboratories) and counterstained with 4′,6′-diamidino-2-phenylindole (DAPI; D-21490; 1:10,000; Invitrogen, Carlsbad, CA) or Sytox (S7020; 1:5000; Invitrogen). Images were collected with a confocal laser-scanning microscope (FV500 or FV1000; Olympus, Tokyo, Japan) (Wang et al., 2004).
Diolistic labeling
The Helios Gene Gun System (165-2431; Bio-Rad, Hercules, CA) was used to deliver gold (1.0 μm) and tungsten particles coated with lipophilic dyes into perfusion-fixed brain slices. Preparations of the DiOlistic bullets were based on the method of Gan et al. (2000) and Benediktsson et al. (2005). Briefly, 2–4 mg of DiI (D282; Invitrogen) or DiD (D307; Invitrogen) was dissolved in 200 μl of methylene chloride (Sigma-Aldrich) and added to 0.05 g of gold or tungsten, dried, then dissolved in 3 ml of double-distilled H2O. The solution was drawn into Tefzel tubing using a syringe and rotated three to four times. The water was slowly drawn out of the tube using a syringe, and the tube was allowed to air dry for 5 min before cutting into bullets using the tube cutter. Perfusion-fixed brain slices (200 μm thick) were placed on 2% agarose blocks in a culture dish and shot with both DiI and DiD bullets using 100 psi of helium pressure. Slices were counterstained with Sytox and mounted for imaging.
Image collection and analysis
Stacks of images with 1 μm increment in depth were collected using 40× oil objective lens [numerical aperture (NA), 1.3] with FluoView (Olympus) software and subsequently analyzed with ImageJ (NIH) software. The length of astrocytic processes was defined as the distance between the nucleus and the tip of an extended process identified by GFAP immunostaining or diolistic labeling, and the thickness of the processes was defined as the diameter of GFAP or diolistic labeling measured between two branching points. Diameter of the cell was determined by defining the domain of the cell based on GFAP or diolistic labeling and measuring the longest axis through the nucleus. The number of main processes was defined as the number of GFAP extensions from the nucleus. An unbiased approach was used for the analysis of diolistically labeled astrocytes. Pairs of labeled astrocytes were identified by scanning the sections from left to right using a 10× objective within 1 h after labeling. All pairs of adjacent labeled astrocytes within 1 mm of injury in the iron injection model, or within sensory motor cortex of the other models, were included in the analysis. The only exclusion criteria was that only pairs with two or three labeled astrocytes were used to limit confounding from multiple cells. The compilation of each extension of the diolistically labeled processes establishes the domain of an astrocyte, and overlapped area of two neighboring domains in 10 μm stacks was measured (Ogata and Kosaka, 2002). Additionally, processes that trespassed into the domain of the neighbor astrocyte were traced to obtain each length. The summation of the lengths over 10 μm stacks defines the degree of perturbation. The volume of an astrocyte was quantified as the summation of the thresholded area of the diolistically labeled astrocyte taken from z-stacks of the entire cell.
For dendrite and dendritic spine analysis, dendrites were sequentially imaged from the area of injury in the x direction through 1 mm, and chosen based on clear area of analysis without overlap of several dendrites to limit confounding spines from other dendrites. A series of images with interval of 0.3 μm in the z direction was taken with confocal microscope (FV-1000; Olympus) with 60× oil-immersion lens (NA, 1.42) with 3× zoom, and 3D reconstruction was performed using FluoView1000 software (Olympus). From the 3D images, each dendrite was sectioned in 10 μm segments, the number of spines in each segment was counted, and the data were grouped according to the distance from the injury site. Width was determined by averaging the diameter of the dendrite not including spines at three random locations along the dendrite.
The means, SDs, and SEMs were calculated, and the differences between experimental and control groups were tested with a Student's t test with significance determined to occur when p < 0.05 using a two-tailed test.
Results
Cortical astrocytes are organized in nonoverlapping domains
To evaluate domain organization of cortical astrocytes in normal and epileptic mice, we diolistically labeled astrocytes in adult mouse cortical brain slices with multiple colored lipophilic dyes, DiI and DiD (Fig. 1 A,B,E–G). Lipophilic dyes are incorporated throughout the plasma membrane, revealing the full structure of the cell, including fine laminate processes that are GFAP negative (Benediktsson et al., 2005). Because the majority of astrocytes in the adult mouse cortex express low levels of GFAP, we initially diolistically labeled astrocytes in transgenic mice expressing eGFP under the astrocyte-specific promoter hGFAP (supplemental Fig. 1A, available at www.jneurosci.org as supplemental material) (Zhuo et al., 1997). These experiments showed that diolistically labeled astrocytes were easily identified as such based on their characteristic bushy structure. The size of diolistically labeled cortical astrocytes was as follows: diameter = 57.7 ± 3.8 μm; length of longest process = 39.8 ± 2.3 μm; and diameter of thickest process = 2.6 ± 0.2 μm (n = 20 cells, 4 mice). These measurements based on diolistic labeling were consistent with measurements based on GFAP immunostaining (Fig. 1 C,D). We calculated based on serial optical sections of DiI- or DiD-labeled cortical astrocytes that their average cell volume was 6543 ± 924 μm3 (n = 12, 5 mice). Astrocyte volume differs from astrocytic domain volume, which is everything within the space demarcated by the farthest reach of a single astrocyte's processes. In addition to the astrocyte itself, this space contains neurons, microglial cells, and extracellular space (see Discussion).
Figure 1.

Cortical astrocytes are organized in nonoverlapping domains. A, Schematic of the procedure used for diolistic labeling of lightly fixed brain slices with DiI (green) and DiD (red). B, Representative labeling of cortical astrocytes with DiI and one with DiD. DiI and DiD distribute evenly in the plasma membrane of single astrocytes and outline their bushy structure in a control mouse. Scale bar (SB), 20 μm. C, Immunostaining against GFAP in cortex. Only the cell body and major processes of cortical astrocytes are GFAP positive. SB, 20 μm. D, Morphometric analysis of cortical astrocytes based on diolistic labeling and GFAP immunostaining (mean ± SEM). E, High-power image of box in B. SB, 10 μm. F, Area of overlap between two neighboring astrocytes is delineated in gray. The red line indicates the border of the domain of the DiD-labeled astrocyte (red), whereas the green line indicates the border of the domain of the DiI-labeled astrocyte (green). G, Yellow lines highlight the processes that extend into their neighbor's domain.
When two adjacent astrocytes were labeled with different colored lipophilic dyes, the border between the cells was clearly outlined, and overlap of their processes could be quantified (Fig. 1 E–G). Overlap of processes between neighboring astrocytes was analyzed by measuring the area that was common between two cells within 10 μm stacks (Ogata and Kosaka, 2002). As an alternative approach, the sum of the lengths of overlapping processes was quantified within 10 μm stacks. The average area of overlap through 10 μm of optical depth was 118 ± 22.2 μm2 among adjacent astrocytes in normal mouse cortex, and the average summation of the lengths of overlapping processes through 10 μm of optical depth was 43 ± 6.6 μm (n = 30 cells, 7 mice).
Reactive astrocytes in an experimental model of posttraumatic epilepsy
Epilepsy is a relatively common complication of traumatic brain injury and may affect as many as 15–53% of patients after severe head injury, dependent on the severity of the hematoma (Annegers et al., 1998; Frey, 2003; Messori et al., 2005). Extravasation of red blood cells results in accumulation of heme and ferric/ferrous compounds and production of reactive oxygen species within the brain parenchyma and increases the risk for development of posttraumatic epilepsy (Willmore et al., 1978, 1983; Graham and Lantos, 1997; Annegers et al., 1998; Frey, 2003; Messori et al., 2005). Intracortical injection of ferrous chloride recapitulates several key features of posttraumatic epilepsy, including physical injury and accumulation of ferric/ferrous compounds in the brain parenchyma (Willmore et al., 1978), and is associated with a high incidence of generalized recurrent seizures in rats, guinea pigs, cats, and Macaca mulatta monkeys (Willmore et al., 1978; Hammond et al., 1980; Lange et al., 1980; Reid and Sypert, 1980).
We injected mouse cortex with ferrous chloride solution. Within hours, these animals exhibited focal changes in EEG activity, including high-amplitude and fast-spiking epileptiform activity. The abnormal EEG activity persisted throughout the first week after injection (Fig. 2 D; supplemental Table 1, available at www.jneurosci.org as supplemental material). Seizures were typically characterized by spike activity lasting from 5 s to several minutes, with an average duration of 42 ± 6.2 s, frequency of 5.5 ± 0.7 Hz, and an average of 0.3 ± 0.07 events/h (supplemental Table 1, available at www.jneurosci.org as supplemental material). EEG changes were accompanied by behavioral changes, commonly including facial automatisms, head nodding, and unilateral and/or bilateral forelimb clonus, as well as manifestations of generalized seizures, including running, rearing, and falling.
Figure 2.

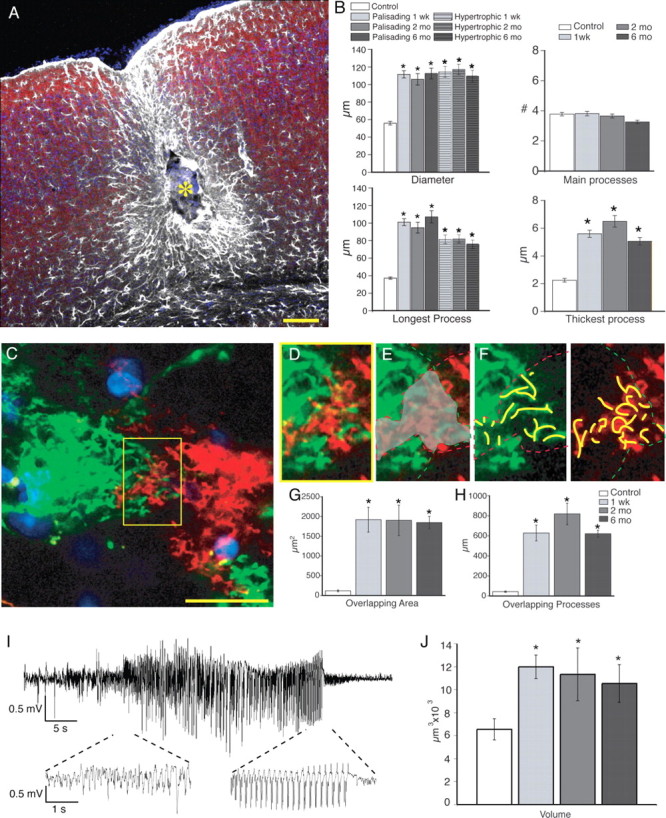
Structure and organization of reactive astrocytes 1 week after injury. A, Cortical slice immunolabeled for GFAP 1 week after iron injection. A marked upregulation of GFAP (white) is evident around the lesion. The yellow asterisk indicates the lesion site. B, High-power image of the border of the injury site. Astrocytes directly adjacent to the lesion extend long processes oriented toward the lesion site (palisading astrocytes; 0–200 μm). Astrocytes located at a greater distance from the lesion (200–1000 μm) also exhibited reactive changes, but their processes were not oriented toward the injury site (hypertrophic astrocytes). White, GFAP; red, Map2; blue, Sytox. Scale bar (SB), 50 μm. Top right, Palisading astrocytes next to area of injury. SB, 10 μm. Bottom right, Hypertrophic astrocytes. SB, 10 μm. C, Morphometric analysis of diameter, number of main processes, and longest and thickest process based on GFAP (control, n = 65 cells, 6 mice; 1 week after injury, n = 65 cells, 7 mice; mean ± SEM; *p < 0.001). D, Representative EEG recording 2 d after injury.
One week after injection, the center of the cortical injury was often necrotic, and contained a high density of infiltrating cells, as well as remnants of GFAP-positive cells. The lesion was surrounded by astrocytes with marked upregulation of GFAP (Fig. 2 A; compare with supplemental Fig. 1B, available at www.jneurosci.org as supplemental material). The majority of astrocytes directly adjacent to the area of injection (within 200 μm) appeared asymmetric in the sense that their processes were uniformly arranged in a radial pattern around the necrotic core. These asymmetric cells with their palisade of GFAP-positive fibers around the lesion were dubbed palisading astrocytes [symmetry index (SI) = length of longest process/diameter, with 0.5 = spherical cell; SI palisading = 0.9 ± 0.01] (Fig. 2 B). Astrocytes further from the injury epicenter (200–1000 μm distance) had hypertrophic processes with increased GFAP expression and extension of long processes without preferred direction (Fig. 2 B). These “hypertrophic” astrocytes were not asymmetric (SI = 0.7 ± 0.01) or significantly different from astrocytes in control mice (n = 19 cells, 5 mice; p = 0.3). Based on GFAP immunolabeling, palisading and hypertrophic astrocytes both had significantly increased diameters, approximately twofold, compared with control astrocytes (palisading = 112 ± 4.1 μm; hypertrophic = 115 ± 6.3 μm; n = 65 cells, 8 mice; p < 0.001) (Fig. 2 C). Both palisading and hypertrophic astrocytes also had a significantly greater “length of longest process” compared with control. Hypertrophy of processes was also noted with a 2.5-fold increase of the diameter of the thickest process for both the palisading and hypertrophic astrocytes to an average 5.6 ± 0.3 μm (p < 0.001) and 5.5 ± 0.4 μm (p < 0.001), respectively. Despite the significant increases in thickness and length of processes, the number of main GFAP-positive processes remained constant (palisading = 3.8 ± 0.2; hypertrophic = 3.9 ± 0.2; p = 0.99 and p = 0.65, respectively). Interestingly, astrocytes in the contralateral hemisphere also displayed some reactive changes, but to a lesser extent than astrocytes adjacent to the seizure foci (see Fig. 8). Reactive changes of astrocytes in the opposite hemisphere were probably caused by projection of seizure discharge to this area (Castiglioni et al., 1990).
Figure 8.

Changes in dendritic structure parallel reactive changes in astrocytes. A, Low-power image of a Thy1-YFP mouse 1 week after iron injection in the hemisphere contralateral to the injury site. White, GFAP; green, YFP. Scale bar (SB), 100 μm. B, Low-power image of a Thy1-YFP mouse 1 week after iron injection near the injury site; yellow lines delineate area of palisading astrocytes. SB, 100 μm. C, High-power image of normal-appearing apical dendrites of pyramidal cells in the hemisphere contralateral to the injection site. SB, 20 μm. Inset, High-power image of dendrite and spines. SB, 2 μm. D, High-power image of zone with palisading astrocytes and thin dendrites lacking spines. SB, 20 μm. Inset, High-power image of dendrite and spines within 200 μm of the injection site. SB, 2 μm. E, High-power image of area more distant to the lesion with hypertrophic astrocytes and thick dendrites exhibiting a significant increase in number of spines. SB, 20 μm. Inset, High-power image of dendrite and spines >200 μm from the injection site. SB, 2 μm. Yellow arrowheads (C–E) indicate dendrites seen in their respective high-power insets. F, Morphometric analysis of apical dendrites and controls (control, n = 40 dendrites, 3 mice; iron injection, n = 40 dendrites, 5 mice; mean ± SEM; *p < 0.001). G, Quantification of spine density compared with control (control, n = 24 dendrites; <200 μm, n = 28 dendrites; >200 μm, n = 31 dendrites; contralateral, n = 30 dendrites, 5 mice; mean ± SEM; *p < 0.005). H, Representative EEG recording from a Thy1-YFP mouse during the first week after iron injection. I, Apical dendrite in control, seizure-free Thy1-YFP cortex. SB, 2 μm. J, From within 200 μm of the iron injection, demonstrating thinning of the dendrite and loss of spines. SB, 2 μm. K, More than 200 μm from the iron injection, showing hypertrophy and increase in spine density. SB, 2 μm. L, From the contralateral hemisphere. SB, 2 μm.
Reactive astrocytes in epileptic brain lose their domain organization
We examined the domain organization of cortical astrocytes in mice with ferrous chloride injection 1 week earlier, using diolistic labeling (Fig. 3 A,B). Because of marked changes in morphology, astrocytes were, in initial experiments, identified as cells expressing GFP in the hGFAP-eGFP transgenic mice. Astrocytes within 1 mm of the lesion exhibited distinct morphologic changes. Consistent with the GFAP immunolabeling, astrocytes outlined by lipophilic dyes exhibited a highly significant increase in diameter as well as length of longest processes, compared with control astrocytes (diameter = 120 ± 10 μm; length of longest process = 92 ± 8 μm; n = 35 cells, 9 mice; p < 0.001). Furthermore, there was a twofold increase in the average volume of reactive astrocytes compared with control, with an average volume of 11,987 ± 1024 μm3 (n = 20 cells, 7 mice; p < 0.005) (Fig. 3 C). Typically, the fine lamellar processes were lost, and most processes were thicker and straighter.
Figure 3.

Loss of astrocytic domain organization 1 week after injury. A, Diolistic labeling of a cortical slice from an adult mouse expressing GFP under the hGFAP promoter 1 week after iron injection. Two adjacent GFP-positive astrocytes are labeled with DiI and DiD. Blue, DAPI; white, GFP; green, DiI; red, DiD. Scale bar (SB), 20 μm. B, Diolistic labeling of palisading reactive astrocytes demonstrating loss of the domain organization. Green, DiI; red, DiD; blue, DAPI. SB, 20 μm. C, Quantification of the volume of reactive astrocytes 1 week postinjury (PI) compared with astrocytes from control mice. The volume represents the total area of the astrocytic soma and processes labeled with DiI or DiD in serial sections (n = 20 cells, 7 mice; mean ± SEM; *p < 0.001). D, Quantification of the area of overlap between reactive astrocytes 1 week after injury compared with astrocytes in control mice over 10 μm stacks, and summation of the total length of processes that enter an adjacent cell's domain 1 week after injury compared with control over 10 μm stacks. The area of overlap and the total length of overlapping processes increased 15-fold in epileptic mice (control, n = 30 cells, 7 mice; 1 week after injury, n = 34 cells, 10 mice; mean ± SEM; *p < 0.001). E–H, High-power image of blue box in A of reactive astrocytes 1 week after injury. F, Area of overlap is delineated in gray, the red line is the border of the domain of the red cell, and the green line is the border of the domain of the green cell. G, H, Yellow lines indicate the processes of the cell that enter the domain of the adjacent astrocyte. I–L, Similar analysis in control mouse in which astrocytes are organized in essentially nonoverlapping domains.
The most striking finding was the loss of domain organization in both palisading and hypertrophic astrocytes located within 1 mm of the site of injection (Fig. 3 A,B,D–H). The average amount of overlap increased ∼15-fold, with an average summation of the lengths of overlapping processes through 10 μm of optical depth of 629 ± 79.2 μm (p < 0.001) and average area of overlap 1919 ± 315.4 μm2 (n = 34 cells, 10 mice; p < 0.001). None of the 17 pairs examined had a degree of overlap comparable with control. Most often, the extension of long processes occurred along the entire border separating two adjacent cells. There were some cases, however, when one cell maintained relatively normal morphology and the other aggressively invaded its domain. In rare instances, astrocytes extended long processes that traveled completely through its neighboring cell and penetrated into the domain of the next neighboring cell. In general, the fine processes were lost, and the invading processes were straighter, spinier, and less bulbous compared with those of normal astrocytes.
Persistent changes in morphology and domain organization of astrocytes in epileptic brain
The initial period of frequent seizures, which typically lasted up to a week after ferrous chloride injection, was followed by a latent period with few spontaneous events, until seizure activity stabilized and became chronic 2–6 months after injection (supplemental Table 1, available at www.jneurosci.org as supplemental material). To determine whether the morphological changes of reactive astrocytes observed acutely after ferrous chloride injection were preserved throughout the latent and into the chronic stages of epilepsy, we examined mice 2 and 6 months after ferrous chloride injection (Fig. 4). We found that the morphology changes noted at the first week were maintained at later time points: the palisading astrocytes formed a dense scar within 200 μm of the injection site at both 2 and 6 months after injection (SI = 0.89 ± 0.01 for 2 months and 0.94 ± 0.01 for 6 months) (Fig. 4 A). Additionally, less asymmetric, hypertrophic astrocytes resided outside the lesion at a distance of up to 1 mm (SI = 0.7 ± 0.01 for 2 months and 0.7 ± 0.01 for 6 months) (Fig. 4 A). The average diameter of palisading cells based on GFAP within 200 μm of the seizure foci remained twofold larger than control at both 2 and 6 months after injection (Fig. 4 B). The average diameter based on GFAP for hypertrophic cells was also significantly greater than control at both 2 and 6 months after ferrous chloride injection (Fig. 4 B). Furthermore, the diameter of the thickest process and the length of longest process of both the hypertrophic and palisading astrocytes also remained increased at 2 and 6 months (Fig. 4 B). Interestingly, the volume of reactive astrocytes based on diolistic labeling both 2 and 6 months after injection was significantly greater than control, but not significantly different from 1 week after injection (2 months = 11,335 ± 2296 μm3; n = 7, 3 mice; 6 months = 10,540 ± 1644 μm3; n = 7, 4 mice; p < 0.05) (Fig. 4 J).
Figure 4.
Structure and organization of reactive astrocytes 2 and 6 months after injury. A, Site of injury 6 months after injection of iron. The center of the lesion (yellow asterisk) is surrounded by palisading astrocytes and, at a greater distance, by hypertrophic astrocytes. White, GFAP; red, Map2; blue, Sytox. Scale bar (SB), 100 μm. B, Morphometric analysis of diameter, number of main processes, and longest and thickest process based on GFAP (2 months after iron injection, n = 50 cells, 3 mice; 6 months, n = 65 cells, 5 mice; mean ± SEM; *p < 0.001). The diameter, maximum length of process, and maximum thickness of GFAP-positive processes were significantly increased at both 2 and 6 months after injury compared with control. C, Diolistic labeling of cortical astrocytes near the area of injury, 6 months after injection. SB, 20 μm. D–F, High-power image of yellow box in C. E, Gray area delineates area of overlap between the adjacent cells. F, Yellow lines represent overlapping processes into the adjacent cell's domain. G, H, Quantification of overlapping area and summation of lengths of overlapping processes for 1 week and 2 and 6 months after injury. Area of overlap at 1 week and 2 and 6 months after injection was significantly increased compared with control (2 months, n = 18 cells, 3 mice; 6 months, n = 18 cells, 6 mice; mean ± SEM; *p < 0.001). I, Representative EEG trace recorded 6 months after iron injection. J, Quantification of the volume of reactive astrocytes 1 week and 2 and 6 months after iron injection compared with control (2 months, n = 7 cells, 3 mice; 6 months, n = 7 cells, 4 mice; mean ± SEM; *p < 0.05).
Diolistic labeling also revealed that loss of the domain organization persisted at 2 and 6 months after ferrous chloride injection (Fig. 4 C–H). Of all pairs analyzed at 2 and 6 months after injury, only 1 pair of 18 exhibited overlap of processes comparable with control. Thus, it was consistently observed that reactive astrocytes in epileptic mice displayed a reduction of their fine processes and that the same cells extended thickened processes into the domains of adjacent cells.
Valproate suppression of seizures reduced loss of astrocyte domain organization
To determine whether loss of the domain organization was a result of seizure activity, we medically suppressed seizures in ferrous chloride-injected mice (Loscher, 2002). Valproate was administered before intracortical ferrous chloride injection and daily throughout the first week. EEG activity was recorded for 10–15 h/d (Fig. 5; supplemental Table 1, available at www.jneurosci.org as supplemental material). Animals that displayed a significant decrease in the amount of seizure activity compared with those without valproate treatment were characterized as responders and displayed a significant decrease in the number of seizure events (average events/h for valproate treated, 0.06 ± 0.02; n = 5; p < 0.01), as well as the percentage of time spent within a seizure (average for valproate treated, 0.1 ± 0.04%; n = 5; p < 0.05) (supplemental Table 1, available at www.jneurosci.org as supplemental material). A subset of mice did not respond to valproate treatment, and continued to have seizures throughout the first week after ferrous chloride injection. Similarly, a previous study reported that valproate only suppresses seizures in a subset of patients with status epilepticus (Sinha and Naritoku, 2000). One week after the injection, animals were perfusion fixed and processed for both immunostaining and diolistic labeling. In “nonresponder” animals, in which valproate failed to reduce seizure activity, reactive changes of astrocytes did not differ significantly from those observed in mice with ferrous chloride injection not receiving valproate (Fig. 5 A). In “responder” animals, both palisading and hypertrophic reactive astrocytes were present near the area of injection (Fig. 5 B). However, the average diameter, length of longest process, and diameter of thickest process of both the hypertrophic and palisading astrocytes based on GFAP were all significantly reduced compared with mice that were not treated with the antiepileptic (Fig. 5 D). The greatest change was seen in the hypertrophic astrocytes, in which there was a 0.6-fold reduction in both the diameter and length of longest process in animals treated with valproate. There was also a significant reduction in the volume of reactive astrocytes in those successfully treated with valproate (average volume = 8202 ± 728 μm3; n = 18, 4 mice; p < 0.01) (Fig. 5 E).
Figure 5.
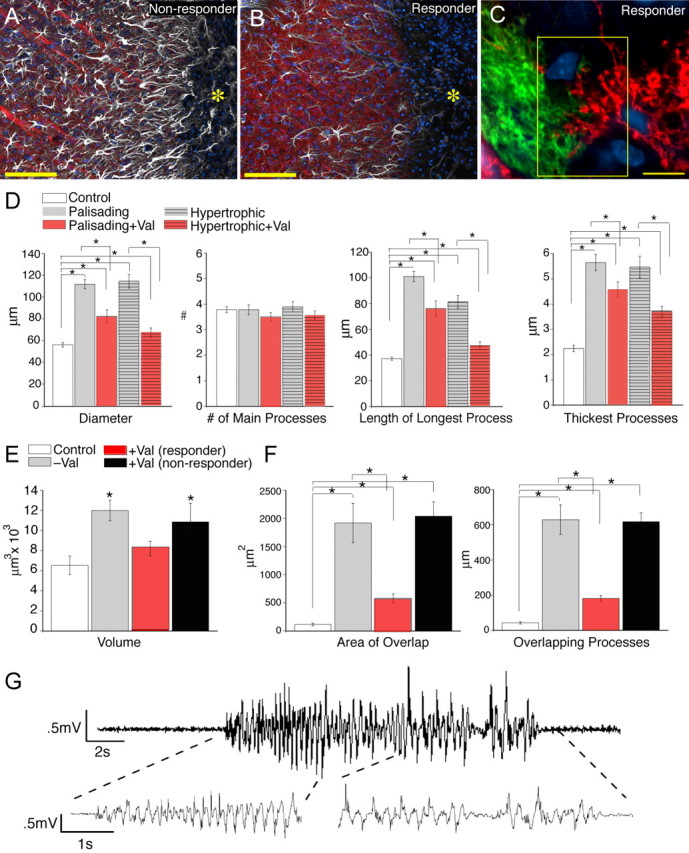
Valproate reduces postinjury seizure activity and overlap of astrocytic processes. A, B, Comparison of the injury border in a mouse that did not respond to valproate (no reduction in seizure activity; A) and a responder (significant reduction in seizure activity; B) 1 week after iron injection. The yellow asterisk indicates the lesion site. White, GFAP; red, Map2; blue, DAPI. Scale bars (SBs), 100 μm. Astrocytes exhibited less reactive changes in mice that responded to valproate. C, Diolistic labeling of two hypertrophic astrocytes near the lesion of an animal that responded to valproate treatment. The astrocytes exhibited less overlap of their processes than in mice that did not receive or did not respond to valproate. The yellow box indicates the border between two adjacent cells. SB, 10 μm. D, Morphometric analysis based on GFAP for animals 1 week after injury with and without valproate treatment (responders). There is a significant decrease in the length of longest process, diameter, and diameter of thickest process in animals successfully treated with valproate compared with those without (n = 65 cells, 5 mice; mean ± SEM; *p < 0.01). E, The volume of reactive astrocytes was significantly reduced in animals that received and responded to valproate 1 week after injury (mean ± SEM responders, n = 18, 4 mice; *p < 0.005; nonresponders, n = 11, 4 mice; p = 0.56). F, Quantification of the domain organization in animals treated with valproate, both responders and those in which the drug had minimal effect. There was a significant decrease in both the area of overlap and summation of lengths of overlapping processes in animals 1 week after iron injection in which valproate treatment reduced seizure activity compared with those without treatment (responders, n = 54 cells, 5 mice; mean ± SEM; *p < 0.001). There was no significant difference in the domain organization in animals treated with valproate that continued to have seizures (nonresponders), compared with mice that did not receive antiepileptic treatment after iron injection (nonresponders, n = 38 cells, 4 mice; mean ± SEM; p = 0.8 for area of overlap and p = 0.9 for summation of overlapping processes). G, Representative EEG recordings from a mouse that responded to valproate and exhibited a reduced number of EEG abnormalities.
Valproate responders also showed significantly reduced overlap between the processes of adjacent cells within 1 mm of the area of injection compared with those animals without antiepileptic treatment or not responding to this treatment (Fig. 5 C,F). The summation of the length of the overlapping processes over 10 μm of optical depth was 181 ± 17.1 μm, and the summation of the area of overlap was 583 ± 77.5 μm2 (n = 54 cells, 5 mice). Therefore, there was a more than fourfold reduction in the amount of overlap between animals with effective seizure treatment with valproate 1 week after ferrous chloride injection (p < 0.001). Nonresponders to valproate exhibited a loss of the domain organization that did not differ from animals without antiepileptic treatment (n = 38 cells, 4 mice; p = 0.8 for area of overlap and p = 0.9 of summation of overlapping processes) (Fig. 5 F).
Loss of domain organization in other epileptic models
To establish whether cortical astrocytes in other epilepsy models also lose their domain organization, we examined mice with kainate-induced epilepsy. Systemic administration of kainic acid replicates several features of human temporal lobe epilepsy, including neuronal loss and sclerosis of the hippocampal CA3 and CA1 regions, reorganization and sprouting of mossy fibers, and hippocampal and cortical gliosis (Ben-Ari and Cossart, 2000). Animals injected with kainic acid undergo repetitive limbic seizures and status epilepticus for several hours followed by a variable latent period, lasting between days and several weeks, preceding a chronic phase characterized by spontaneous seizure activity (Hellier et al., 1998; Leite et al., 2002). We examined epileptic mice 6 months after kainate injection (Fig. 6). These animals exhibited 0.42 ± 0.07 events/h with an average duration of 16.8 ± 5.1 s, which was accompanied by behavioral changes, including facial automatisms, forelimb clonus, running, rearing, and falling (Fig. 6 E; supplemental Table 1, available at www.jneurosci.org as supplemental material).
Figure 6.

Loss of domain organization among hypertrophic astrocytes in other epilepsy models. A, Low- and high-power images of sensory-motor cortex 6 months after exposure to kainic acid. A clear upregulation of GFAP throughout the cortical layers is evident. Scale bars (SBs): left, 100 μm; right, 10 μm. B, Low- and high-power images of the sensory-motor cortex of the SWXL-4 mouse that also exhibited an increase in GFAP expression. SBs: left, 100 μm; right, 10 μm. C, D, Morphometric analysis in mice exposed to kainate (KA) and the SWXL-4 mice based on GFAP (KA, n = 65 cells, 3 mice; SWXL-4, n = 85 cells, 6 mice; mean ± SEM; *p < 0.001). E, Representative EEG recording of a mouse exposed to kainate 6 months earlier. F, EEG recording of SWXL-4 mice 10 months of age. G, Diolistic labeling revealed extensive overlap of processes between two reactive astrocytes in the cortex of a kainate-treated mouse. SB, 10 μm. Inset, Overlapping processes of two astrocytes in CA3. H, I, High-power images of blue box in G demonstrating overlapping area and processes of kainate-treated cortical astrocytes. J, Two adjacent astrocytes in SWXL-4 mice with overlapping domains. SB, 10 μm. K, L, High-power images of blue box in J demonstrating overlapping area and processes in SWXL-4 cortical astrocytes. M, Quantification of the change in volume in kainate-treated and SWXL-4 mice compared with control. There is a significant increase in volume of reactive astrocytes in both the kainate-treated and SWXL-4 mice compared with control (KA, n = 10, 3 mice; SWXL-4, n = 16, 6 mice; mean ± SEM; *p < 0.05). N, O, Quantification of loss of domain organization in the kainate-treated and SWXL-4 cortical astrocytes. There is a significant increase in the amount of overlap between astrocyte domains in both kainate-treated and SWXL-4 mice compared with control (KA, n = 16 cells, 4 mice; SWXL-4, n = 44 cells, 7 mice; mean ± SEM; *p < 0.001).
In addition to neuronal loss and striking hippocampal gliosis (data not shown), upregulation of GFAP was evident throughout all cortical layers (Fig. 6 A). Furthermore, the average diameter of GFAP-labeled astrocytes in the cortex was ∼1.4-fold greater than control animals (76 ± 2.5 μm; n = 65 cells, 3 mice; p < 0.001) (Fig. 6 C). The length of longest process and the diameter of thickest processes were both significantly greater than control astrocytes (p < 0.001), yielding an average SI of 0.78 ± 0.01 (Fig. 6 C,D). Although the morphologic changes were significantly different from control animals, they were less pronounced than in the cortex of ferrous chloride-injected mice. The severity of reactive changes of astrocytes in kainate-injected mice is consistent with the notion that the seizure foci in kainate-injected animals reside in the CA3 hippocampal region (Castiglioni et al., 1990; Ben-Ari and Cossart, 2000).
We also analyzed the organization of cortical astrocytes in the SWXL-4 mice, a recombinant inbred mouse strain that develops a complex pattern of ictal behavior, including loss of postural control, progression to tonic-clonic movements, and automatisms spontaneously with age and routine handling (Frankel et al., 1994). We examined 6- to 10-month-old mice, 2–4 months after the occurrence of spontaneous generalized seizure activity (Fig. 6). These animals exhibited generalized high-frequency synchronous cortical discharges with 0.007 ± 0.004 events/h with an average duration of 79 ± 38 s, resulting in 0.47% of time of recording within a seizure (Fig. 6 F; supplemental Table 1, available at www.jneurosci.org as supplemental material). Neuronal injury often developed in cortex and the hippocampal regions of CA1 and the dentate gyrus (Frankel et al., 1994). Similar to the other epilepsy models, cortical astrocytes in SWXL-4 mice displayed a marked upregulation of GFAP (Fig. 6 B). The average diameter of the cortical astrocytes based on GFAP was significantly greater than those of control (70.6 ± 1.3 μm; p > 0.001; n = 85 cells, 6 mice) (Fig. 6 C). Additionally, there was a significant increase in the average length of the longest process as well as average thickness of processes (Fig. 6 D). Overall, reactive changes in cortical astrocytes in kainate-induced epilepsy and in SWXL-4 mice were comparable (Fig. 6). The average volume of cortical astrocytes in kainate-treated animals increased to 9208 ± 544 μm3 (n = 10, 3 mice; p < 0.05) and the SWXL model to 9939 ± 898 μm3 (n = 16, 5 mice; p < 0.05) (Fig. 6 M).
Cortical astrocytes in both the kainate and SWXL-4 mice models of epilepsy were also characterized by a loss in domain organization. Diolistic labeling of astrocytes in mice injected with kainate 6 months earlier displayed a 10-fold increase in the amount of overlap between adjacent cells in cortex (Fig. 6 G–I,N–O). The summation of the length of overlapping processes was 438 ± 75 μm, and area of overlap over 10 μm optical sections was 1421 ± 302 μm2, both significantly greater than control (p < 0.001; n = 16 cells, 4 mice). Of eight pairs analyzed, only one had an extent of overlap similar to control. Furthermore, we observed a loss in the domain organization in CA3 of the hippocampus of the kainate-treated mice, consistent with neuronal loss and gliosis seen in the seizure foci of this model (Fig. 6 G, inset). SWXL-4 mice also displayed a significant loss in the domain organization in cortical astrocytes with an eightfold increase in the amount of overlap compared with control animals (p < 0.001; n = 44, 6 mice) (Fig. 6 J–L,N–O). Only 2 of 22 pairs of cells analyzed were within the range of the amount of overlap seen in control. Therefore, astrocytes in mice with genetically susceptible epilepsy exhibit a loss of their domain organization, similar to epilepsy evoked by either ferrous chloride or kainate.
Reactive astrocytes in a mouse model of Alzheimer's disease
Is loss of the domain organization a general property of reactive changes in cortical astrocytes or limited to seizure pathologies? Gliosis is prominent in Alzheimer's disease, but the incidence of seizure is only moderately increased compared with reference populations (Hauser et al., 1986; Unger, 1998; Amatniek et al., 2006). Interestingly, a recent report has revealed that some mouse models of Alzheimer's disease (hAPPJ20) have nonconvulsive seizures and compensatory inhibitory changes in hippocampal circuitry (Palop et al., 2007). Tg2576 mice express the human APP 695 gene containing the double mutation Lys670→Asn and Met671→Leu (Hsiao et al., 1996). At 11–13 months of age, these mice have a 14-fold increase in the amount of amyloid β deposition in cortex and several other brain regions (Hsiao et al., 1996). The deposition of amyloid plaque is paralleled by intense reactive changes in astrocytes (Hsiao et al., 1996; Mehlhorn et al., 2000; Terai et al., 2001). Unlike the hAPPJ20 mouse model of Alzheimer's disease, EEG recordings of 12- to 14-month-old Tg2576 mice were normal and free of seizure activity (Fig. 7 E) (Palop et al., 2007). As expected, cortical gliosis was pronounced with upregulation of GFAP throughout all the layers of cortex (Fig. 7 B,C). The average diameter of cortical astrocytes was 57 ± 1.3 μm or not statistically different from control animals (p = 0.6; n = 65 cells, 3 mice) (Fig. 7 D). Diolistic labeling confirmed that the average diameter of astrocytes in Tg2576 and their processes was not statistically different from controls (diameter = 57 ± 2.4 μm; n = 30 cells, 3 mice; p = 0.4). Furthermore, the volume of cortical astrocytes in the Tg2576 mice was not increased compared with controls (6702 ± 1143 μm3; n = 12, 3 mice; p = 0.9) (Fig. 7 M).
Figure 7.

Cortical astrocytes in seizure-free Tg2576 transgenic mice are reactive but do not lose their domain organization. A, Control cortex with low GFAP expression throughout cortex. Scale bar (SB), 100 μm. B, Cortex of a Tg2576 mouse with upregulation of GFAP throughout all cortical layers. SB, 100 μm. C, Higher-power image of cortical astrocytes in Tg2576 mouse. SB, 10 μm. D, Morphometric analysis based on GFAP. Astrocytes in the Tg2576 mice exhibited only a significant increase in the maximum thickness of GFAP-positive processes (Tg2576, n = 65, 3 mice; mean ± SEM; *p < 0.001). E, Representative EEG recording of Tg2576 mice. F, Diolistic labeling of cortical astrocytes in Tg2576 mouse. SB, 10 μm. G–I, High-power image of blue box in F showing limited overlap between processes of two adjacent astrocytes. J–L, Adjacent control astrocytes showing limited overlap and extension of processes into the adjacent cell's domains. M, Quantification of the volume of reactive astrocytes in Tg2576 compared with control. There is no significant increase in the volume of reactive astrocytes in the Tg2576 model (n = 12, 3 mice; mean ± SEM; p = 0.45). N, Quantification of amount of overlap between adjacent cells in Tg2576 and control mice (Tg2576, n = 30, 3 mice; mean ± SEM; there is no significant increase in amount of overlap compared with control; area, p = 0.5; overlapping process, p = 0.8).
Diolistically labeled cortical sections depicted no sign of increased overlap of astrocytic processes compared with control (Fig. 7 F–I). The area of overlap between adjacent cells was 139 ± 22 μm2, and the summation of overlapping processes was 45 ± 4.7 μm in the Tg2576 mouse, both not significantly different from control values (p = 0.5 and p = 0.8 respectively; n = 30 cells, 3 mice) (Fig. 7 N). Thus, cortical reactive astrocytes in the Tg2576 model of Alzheimer's disease remain organized in nonoverlapping domains despite their marked increase in GFAP expression.
Changes of dendritic structures in epileptic brain
Much effort has in the past been dedicated to analyzing changes in neuronal morphology of the epileptic brain (Golarai et al., 2001; Tavazoie et al., 2005; Zha et al., 2005; Bausch et al., 2006). Histological and retrograde tracer techniques have shown that kainate-induced epilepsy is associated with a dendritic sprouting of mossy fibers and new synapse formation in the dentate gyrus (Tauck and Nadler, 1985; Ben-Ari and Cossart, 2000; Wuarin and Dudek, 2001). However, the number of dendritic spines is reduced in other experimental seizure models (Swann et al., 2000), suggesting that epilepsy also can be linked to a partial deafferentation of cortical neurons.
To determine whether loss of the domain organization is paralleled by structural changes of excitatory neurons, we examined spine density in transgenic animals expressing YFP under the Thy1 promoter 1 week after ferrous chloride injection (Fig. 8). Spine density in YFP-expression pyramidal neurons was analyzed as a function of their distance from the injury site. In control animals, average dendrite width of apical dendrites was 1.68 ± 0.08 μm (n = 40 dendrites, 3 mice), and average spine density of apical dendrites was 16.2 ± 1.1 spines/10 μm (n = 24 dendrites, 3 mice) (Fig. 8 F–G,I). A significant loss of dendrites was evident in areas populated by palisading astrocytes within 200 μm of the injury site (Fig. 8 B). The few dendrites that remained in this area frequently appeared thin and beaded, with a significant loss in dendrite width (1.2 ± 0.09 μm; n = 40 dendrites, 5 mice; p < 0.001) (Fig. 8 D,F,J). Furthermore, there was a highly significant decrease in the spine density (average spine density/10 μm = 4.3 ± 0.7; n = 28 dendrites, 5 mice; p < 0.001) (Fig. 8 G). Conversely, dendrites located >200 μm from the injury site, in the area of the hypertrophic astrocytes, were notably thicker, with an average width of 2.3 ± 0.1 μm (n = 40, 5 mice; p < 0.001), and exhibited a significant increase in the dendritic spine density (spine density/10 μm = 20.7 ± 0.9; n = 31, 5 mice; p < 0.005) (Fig. 8 B,E–G,K). The spines were typically thin and long, indicative of immature spines (Trachtenberg et al., 2002; Leite et al., 2005; Knott et al., 2006). In the contralateral hemisphere, dendrite width and spine density did not differ significantly from control (width = 1.7 ± 0.07 μm; n = 40, 5 mice; p = 0.99; density = 17.4 ± 1.6/10 μm; n = 30, 5 mice; p = 0.4) (Fig. 8 A,C,F,G,L). Thus, our analysis revealed that the number of spines on apical dendrites from pyramidal YFP-expressing cells is reduced in areas with palisading astrocytes. These changes are confined to a narrow border zone in direct contact with the lesion and may be the result of direct injury. More interestingly, the number of dendritic spines on apical dendrites was increased in widespread areas at greater distances from the injury site. The increase in spine number was modest, but significant, and present in cortical tissue populated with hypertrophic astrocytes.
Discussion
This study used diolistic labeling of cortical tissue to study the fine architecture of reactive astrocytes in the epileptic mouse brain. Our analysis confirmed that cortical astrocytes in normal adult brain are organized in nonoverlapping domains with minimal interdigitation of their processes. Extending the analysis to several mouse models of epilepsy revealed a marked increase in overlap of processes between adjacent astrocytes. Loss of astrocytic domains was, however, not a universal feature of reactive gliosis, because overlap of astrocytic processes was not noted in transgenic mice expressing mutant human APP despite a marked upregulation of GFAP. Furthermore, epileptic animals that responded to medical suppression of seizure exhibited a sharp reduction in the loss of their domain organization. Thus, gliosis, per se, may be a necessary condition for loss of astrocyte domain organization, but it is not sufficient.
We noted two morphologically distinct types of reactive astrocytes in animals with focal epilepsy. Palisading astrocytes immediately surrounded the injury site, and their processes formed a halo around the lesion with striking radial orientation. The processes were mainly straight, lacking the profuse and delicate veil-like ramifications of normal protoplasmic astrocytes. Palisading astrocytes exhibited a complete loss of individual domains and appeared to form a physical barrier separating the lesion from the surrounding cortical tissue (McGraw et al., 2001). The second type of astrocyte was termed hypertrophic and was located just beyond the annular sector occupied by palisading astrocytes. Their defining features were less extreme, but conspicuous when subjected to quantitative morphological analysis. Upregulation of GFAP and greater process thickness were hallmarks of hypertrophic astrocytes, but the number of fine veil-like processes was also clearly reduced.
Interestingly, the morphological changes of astrocytes surrounding epileptic foci were accompanied by distinct changes in neurons. Neurons in the vicinity of palisading astrocytes exhibited less dendritic spines and a thinning of their dendrites, confirming numerous studies reporting a general loss of dendritic spines in epileptic brains (Swann et al., 2000). In cortical areas populated by hypertrophic astrocytes, there was a subtle but significant hypertrophy of dendrites of excitatory neurons concurrent with an increase in spine density. This hypertrophy of dendrites distant to the epileptic focus has not been reported previously. Likely, the dramatic reduction of dendrites and spines near the injury site has overshadowed the modest hypertrophy. The large sample size needed to detect the minor increment in spine numbers was easily obtained in our study based on YFP expression in transgenic mice, compared with the cumbersome tracer injection techniques used previously. An increase of spine density in the dentate gyrus has previously been viewed as a structural basis for recurrent excitation and abnormal circuit function in kainate-induced epilepsy (Tauck and Nadler, 1985; Suzuki et al., 1997; Wuarin and Dudek, 2001). As such, our study adds new dimensions to the structural changes of both astrocytes and dendrites that accompany a model of posttraumatic epilepsy.
An important distinction to be drawn is between astrocyte volume and domain volume. Using the diolistic staining technique, we directly measured astrocyte volume referring to the cytosolic volume of individual astrocytes. Domain volume is defined by the three-dimensional boundaries of an astrocyte and contains all “brain” space within these boundaries. The literature on “domains” therefore must be read with this distinction in mind. The reported domain sizes of normal protoplasmic astrocytes have varied greatly from 14,700 μm3 (Chvatal et al., 2007) in live astrocytes in cortical brain slices to 85,300 μm3 (Ogata and Kosaka, 2002) and 65,900 μm3 (Bushong et al., 2002) in fixed preparations of hippocampus. Domain sizes may have been influenced by regional differences in astrocyte size or variation caused by fixation where interstitial space is largely obliterated in perfusion-fixed brain (Bushong et al., 2002). The latter explanation is contradicted by the observation that cortical astrocyte domain volume was reported to average 22,906 μm3 in frozen sections and 21,033 μm3 in intact live animals (Halassa et al., 2007). The astrocytic cell volume reported here is smaller (∼6500 μm3), because we, in contrast to other studies, quantified the actual volume of astrocytes rather than the total volume of astrocytic domains. This difference may also explain why a recent report concluded that the size of astrocytic domains did not increase during reactive gliosis (Wilhelmsson et al., 2006). Hypertrophy of astrocytic processes will not affect the volume of the domain if the growth occurs within the confines of a domain. The same study also found that reactive astrocytes maintained the domain organization after deafferentation of the dentate gyrus (Wilhelmsson et al., 2006). This injury model is only inconsistently associated with seizure pathology (Kopniczky et al., 2005), thus indirectly supporting the conclusion that loss of astrocytic domain organization is restricted to pathologies associated with EEG abnormalities.
Furthermore, it will be intriguing to examine the differences in astrocyte domain organization between Alzheimer's disease models with and without focal EEG abnormalities. The hAPPJ20 mice, which are reported to manifest nonconvulsive seizures, have three mutations in the hAPP gene, compared with two in the Tg2576 model used here, leading to earlier development of Aβ plaques and a more severe phenotype (Palop et al., 2007). We predict that these animals would also exhibit loss of the domain organization in areas surrounding the seizure foci.
The concept that astrocytes are organized in nonoverlapping domains was independently discovered by two groups (Bushong et al., 2002; Ogata and Kosaka, 2002). It was an important step because it had been previously thought that astrocytes formed a syncytium that filled empty space and otherwise lacked any higher level of organization. The functional significance of domain organization is not understood in detail, but a domain defines a functional unit that integrates the activity of a larger contiguous set of synapses. Astrocytes express receptors for glutamate, GABA, and most neuromodulators and respond over a slow time scale from seconds to minutes to input. In turn, astrocytes release gliotransmitters including ATP, d-serine, and glutamate, which modulate synaptic transmission. The observation reported here, that astrocytic processes interdigitate and thereby violate the domain organization in the epileptic brain, may provide a useful tool for future studies defining the functional significance of astrocytic architecture.
The changes in astrocyte structure and loss of domain organization that occur during gliosis are paralleled by functional changes. Human and rodent studies have shown that reactive astrocytes downregulate the glutamate transporter GLT-1, as well as glutamine synthetase in epilepsy (Mathern et al., 1999; Samuelsson et al., 2000; Proper et al., 2002; Eid et al., 2004; Maragakis and Rothstein, 2004). This may lead to an increase of glutamate in astrocytes resulting in its excessive release, triggering synchronized depolarization of groups of neurons, or paroxysmal depolarization shifts (Tian et al., 2005). Reactive astrocytes have also been shown to downregulate inward rectifying K+ channels (Kir), specifically Kir4.1, in posttraumatic and temporal lobe epilepsy, leading to impairment of clearance of extracellular K+, linked to neuronal hyperexcitability (Bordey and Sontheimer, 1998; Heinemann et al., 2000; Hinterkeuser et al., 2000; Schroder et al., 2000). In addition, aquaporin-4, the major water channel, loses its polarized location in astrocytic endfeet and becomes distributed across the entire cell body, potentially contributing to abnormalities of both water homeostasis and K+ buffering (Eid et al., 2005).
An issue not addressed in this study is whether loss of astrocyte domain organization precedes the changes in dendritic structures or vice versa. Does the overlap of astrocytic processes contribute to increase in spine density or does new synapse formation leads to interdigitation of astrocytic processes? It is known from work in the hypothalamo-neurohypophysial system that retraction of astrocytic processes can lead to dramatic increases in number of synapses (Theodosis et al., 2004). Also, it has been demonstrated that astrocyte contact to dendritic protrusions both stabilizes and stimulates maturation of dendritic spines (Nishida and Okabe, 2007). Based on these studies, we speculate that loss of fine processes in hypertrophic astrocytes contributes to dendritic sprouting in widespread areas around an epileptic focus. Additional studies are clearly needed, but structural alterations of dendrites and astrocytes may, in concert, form the basis for the abnormal circuit in the epileptic brain. It is in this regard important to note that valproate dampened seizure activity and at the same time reduced reactive changes of astrocytes and preserved their domain organization. It has been known for centuries that seizures early in life, most notably febrile seizures (Chen et al., 1999), reduce the threshold for development of epilepsy. We show here that seizure induces permanent changes in the structure and organization of astrocytes, in addition to the well described morphological alterations of neurons (Golarai et al., 2001; Tavazoie et al., 2005; Zha et al., 2005; Bausch et al., 2006). Together, these observations underpin the importance of aggressive clinical management of seizure to avoid long-lasting structural damage to the brain.
Footnotes
This work was supported by National Institute of Neurological Disorders and Stroke/National Institutes of Health (NIH) Grants NS030007, NS038073, and NS50315, NIH Grant T32 GM07356 (N.A.O.), the New York State Spinal Cord Injury Research Board, and the CURE Program for Post Traumatic Epilepsy. We thank Erlend Nagelhus for insightful comments on this manuscript.
References
- Amatniek JC, Hauser WA, DelCastillo-Castaneda C, Jacobs DM, Marder K, Bell K, Albert M, Brandt J, Stern Y. Incidence and predictors of seizures in patients with Alzheimer's disease. Epilepsia. 2006;47:867–872. doi: 10.1111/j.1528-1167.2006.00554.x. [DOI] [PubMed] [Google Scholar]
- Annegers JF, Hauser WA, Coan SP, Rocca WA. A population-based study of seizures after traumatic brain injuries. N Engl J Med. 1998;338:20–24. doi: 10.1056/NEJM199801013380104. [DOI] [PubMed] [Google Scholar]
- Ayala GX, Tapia R. Expression of heat shock protein 70 induced by 4-aminopyridine through glutamate-mediated excitotoxic stress in rat hippocampus in vivo. Neuropharmacology. 2003;45:649–660. doi: 10.1016/s0028-3908(03)00230-2. [DOI] [PubMed] [Google Scholar]
- Bausch SB, He S, Petrova Y, Wang XM, McNamara JO. Plasticity of both excitatory and inhibitory synapses is associated with seizures induced by removal of chronic blockade of activity in cultured hippocampus. J Neurophysiol. 2006;96:2151–2167. doi: 10.1152/jn.00355.2006. [DOI] [PubMed] [Google Scholar]
- Ben-Ari Y, Cossart R. Kainate, a double agent that generates seizures: two decades of progress. Trends Neurosci. 2000;23:580–587. doi: 10.1016/s0166-2236(00)01659-3. [DOI] [PubMed] [Google Scholar]
- Benediktsson AM, Schachtele SJ, Green SH, Dailey ME. Ballistic labeling and dynamic imaging of astrocytes in organotypic hippocampal slice cultures. J Neurosci Methods. 2005;141:41–53. doi: 10.1016/j.jneumeth.2004.05.013. [DOI] [PubMed] [Google Scholar]
- Bignami A, Dahl D. The astroglial response to stabbing: immunofluorescence studies with antibodies to astrocyte-specific protein (GFA) in mammalian and submammalian vertebrates. Neuropathol Appl Neurobiol. 1976;2:99–111. [Google Scholar]
- Bordey A, Sontheimer H. Properties of human glial cells associated with epileptic seizure foci. Epilepsy Res. 1998;32:286–303. doi: 10.1016/s0920-1211(98)00059-x. [DOI] [PubMed] [Google Scholar]
- Bragin A, Engel J, Jr, Wilson CL, Vizentin E, Mathern GW. Electrophysiologic analysis of a chronic seizure model after unilateral hippocampal KA injection. Epilepsia. 1999;40:1210–1221. doi: 10.1111/j.1528-1157.1999.tb00849.x. [DOI] [PubMed] [Google Scholar]
- Brenner M, Johnson AB, Boespflug-Tanguy O, Rodriguez D, Goldman JE, Messing A. Mutations in GFAP, encoding glial fibrillary acidic protein, are associated with Alexander disease. Nat Genet. 2001;27:117–120. doi: 10.1038/83679. [DOI] [PubMed] [Google Scholar]
- Bushong EA, Martone ME, Jones YZ, Ellisman MH. Protoplasmic astrocytes in CA1 stratum radiatum occupy separate anatomical domains. J Neurosci. 2002;22:183–192. doi: 10.1523/JNEUROSCI.22-01-00183.2002. [DOI] [PMC free article] [PubMed] [Google Scholar]
- Castiglioni AJ, Peterson SL, Sanabria EL, Tiffany-Castiglioni E. Structural changes in astrocytes induced by seizures in a mode of temporal lobe epilepsy. J Neurosci Res. 1990;26:334–341. doi: 10.1002/jnr.490260310. [DOI] [PubMed] [Google Scholar]
- Chen K, Baram TZ, Soltesz I. Febrile seizures in the developing brain result in persistent modification of neuronal excitability in limbic circuits. Nat Med. 1999;5:888–894. doi: 10.1038/11330. [DOI] [PMC free article] [PubMed] [Google Scholar]
- Chvatal A, Anderova M, Kirchhoff F. Three-dimensional confocal morphometry—a new approach for studying dynamic changes in cell morphology in brain slices. J Anat. 2007;210:671–683. doi: 10.1111/j.1469-7580.2007.00724.x. [DOI] [PMC free article] [PubMed] [Google Scholar]
- Eid T, Thomas MJ, Spencer DD, Runden-Pran E, Lai JC, Malthankar GV, Kim JH, Danbolt NC, Ottersen OP, de Lanerolle NC. Loss of glutamine synthetase in the human epileptogenic hippocampus: possible mechanism for raised extracellular glutamate in mesial temporal lobe epilepsy. Lancet. 2004;363:28–37. doi: 10.1016/s0140-6736(03)15166-5. [DOI] [PubMed] [Google Scholar]
- Eid T, Lee TS, Thomas MJ, Amiry-Moghaddam M, Bjornsen LP, Spencer DD, Agre P, Ottersen OP, de Lanerolle NC. Loss of perivascular aquaporin 4 may underlie deficient water and K+ homeostasis in the human epileptogenic hippocampus. Proc Natl Acad Sci USA. 2005;102:1193–1198. doi: 10.1073/pnas.0409308102. [DOI] [PMC free article] [PubMed] [Google Scholar]
- Frankel WN, Taylor BA, Noebels JL, Lutz CM. Genetic epilepsy model derived from common inbred mouse strains. Genetics. 1994;138:481–489. doi: 10.1093/genetics/138.2.481. [DOI] [PMC free article] [PubMed] [Google Scholar]
- Frey LC. Epidemiology of posttraumatic epilepsy: a critical review. Epilepsia. 2003;44(Suppl 10):11–17. doi: 10.1046/j.1528-1157.44.s10.4.x. [DOI] [PubMed] [Google Scholar]
- Gan WB, Grutzendler J, Wong WT, Wong RO, Lichtman JW. Multicolor “DiOlistic” labeling of the nervous system using lipophilic dye combinations. Neuron. 2000;27:219–225. doi: 10.1016/s0896-6273(00)00031-3. [DOI] [PubMed] [Google Scholar]
- Golarai G, Greenwood AC, Feeney DM, Connor JA. Physiological and structural evidence for hippocampal involvement in persistent seizure susceptibility after traumatic brain injury. J Neurosci. 2001;21:8523–8537. doi: 10.1523/JNEUROSCI.21-21-08523.2001. [DOI] [PMC free article] [PubMed] [Google Scholar]
- Graham D, Lantos P. Greenfields' neuropathology. Ed 6. London: Arnold; 1997. [Google Scholar]
- Guerreiro MM, Quesney LF, Salanova V, Snipes GJ. Continuous electrocorticogram epileptiform discharges due to brain gliosis. J Clin Neurophysiol. 2003;20:239–242. doi: 10.1097/00004691-200307000-00002. [DOI] [PubMed] [Google Scholar]
- Halassa MM, Fellin T, Takano H, Dong JH, Haydon PG. Synaptic islands defined by the territory of a single astrocyte. J Neurosci. 2007;27:6473–6477. doi: 10.1523/JNEUROSCI.1419-07.2007. [DOI] [PMC free article] [PubMed] [Google Scholar]
- Hammond EJ, Ramsay RE, Villarreal HJ, Wilder BJ. Effects of intracortical injection of blood and blood components on the electrocorticogram. Epilepsia. 1980;21:3–14. doi: 10.1111/j.1528-1157.1980.tb04039.x. [DOI] [PubMed] [Google Scholar]
- Hauser WA, Morris ML, Heston LL, Anderson VE. Seizures and myoclonus in patients with Alzheimer's disease. Neurology. 1986;36:1226–1230. doi: 10.1212/wnl.36.9.1226. [DOI] [PubMed] [Google Scholar]
- Heinemann U, Gabriel S, Jauch R, Schulze K, Kivi A, Eilers A, Kovacs R, Lehmann TN. Alterations of glial cell function in temporal lobe epilepsy. Epilepsia. 2000;41(Suppl 6):S185–S189. doi: 10.1111/j.1528-1157.2000.tb01579.x. [DOI] [PubMed] [Google Scholar]
- Hellier JL, Patrylo PR, Buckmaster PS, Dudek FE. Recurrent spontaneous motor seizures after repeated low-dose systemic treatment with kainate: assessment of a rat model of temporal lobe epilepsy. Epilepsy Res. 1998;31:73–84. doi: 10.1016/s0920-1211(98)00017-5. [DOI] [PubMed] [Google Scholar]
- Hinterkeuser S, Schroder W, Hager G, Seifert G, Blumcke I, Elger CE, Schramm J, Steinhauser C. Astrocytes in the hippocampus of patients with temporal lobe epilepsy display changes in potassium conductances. Eur J Neurosci. 2000;12:2087–2096. doi: 10.1046/j.1460-9568.2000.00104.x. [DOI] [PubMed] [Google Scholar]
- Hsiao K, Chapman P, Nilsen S, Eckman C, Harigaya Y, Younkin S, Yang F, Cole G. Correlative memory deficits, Abeta elevation, and amyloid plaques in transgenic mice. Science. 1996;274:99–102. doi: 10.1126/science.274.5284.99. [DOI] [PubMed] [Google Scholar]
- Knott GW, Holtmaat A, Wilbrecht L, Welker E, Svoboda K. Spine growth precedes synapse formation in the adult neocortex in vivo. Nat Neurosci. 2006;9:1117–1124. doi: 10.1038/nn1747. [DOI] [PubMed] [Google Scholar]
- Kopniczky Z, Dobo E, Borbely S, Vilagi I, Detari L, Krisztin-Peva B, Bagosi A, Molnar E, Mihaly A. Lateral entorhinal cortex lesions rearrange afferents, glutamate receptors, increase seizure latency and suppress seizure-induced c-fos expression in the hippocampus of adult rat. J Neurochem. 2005;95:111–124. doi: 10.1111/j.1471-4159.2005.03347.x. [DOI] [PubMed] [Google Scholar]
- Lange SC, Neafsey EJ, Wyler AR. Neuronal activity in chronic ferric chloride epileptic foci in cats and monkey. Epilepsia. 1980;21:251–254. doi: 10.1111/j.1528-1157.1980.tb04070.x. [DOI] [PubMed] [Google Scholar]
- Leite JP, Garcia-Cairasco N, Cavalheiro EA. New insights from the use of pilocarpine and kainate models. Epilepsy Res. 2002;50:93–103. doi: 10.1016/s0920-1211(02)00072-4. [DOI] [PubMed] [Google Scholar]
- Leite JP, Neder L, Arisi GM, Carlotti CG, Jr, Assirati JA, Moreira JE. Plasticity, synaptic strength, and epilepsy: what can we learn from ultrastructural data? Epilepsia. 2005;46(Suppl 5):134–141. doi: 10.1111/j.1528-1167.2005.01021.x. [DOI] [PubMed] [Google Scholar]
- Loscher W. Basic pharmacology of valproate: a review after 35 years of clinical use for the treatment of epilepsy. CNS Drugs. 2002;16:669–694. doi: 10.2165/00023210-200216100-00003. [DOI] [PubMed] [Google Scholar]
- Maragakis NJ, Rothstein JD. Glutamate transporters: animal models to neurologic disease. Neurobiol Dis. 2004;15:461–473. doi: 10.1016/j.nbd.2003.12.007. [DOI] [PubMed] [Google Scholar]
- Maragakis NJ, Rothstein JD. Mechanisms of disease: astrocytes in neurodegenerative disease. Nat Clin Pract Neurol. 2006;2:679–689. doi: 10.1038/ncpneuro0355. [DOI] [PubMed] [Google Scholar]
- Mathern GW, Mendoza D, Lozada A, Pretorius JK, Dehnes Y, Danbolt NC, Nelson N, Leite JP, Chimelli L, Born DE, Sakamoto AC, Assirati JA, Fried I, Peacock WJ, Ojemann GA, Adelson PD. Hippocampal GABA and glutamate transporter immunoreactivity in patients with temporal lobe epilepsy. Neurology. 1999;52:453–472. doi: 10.1212/wnl.52.3.453. [DOI] [PubMed] [Google Scholar]
- McGraw J, Hiebert GW, Steeves JD. Modulating astrogliosis after neurotrauma. J Neurosci Res. 2001;63:109–115. doi: 10.1002/1097-4547(20010115)63:2<109::AID-JNR1002>3.0.CO;2-J. [DOI] [PubMed] [Google Scholar]
- McKhann GM, II, Schoenfeld-McNeill J, Born DE, Haglund MM, Ojemann GA. Intraoperative hippocampal electrocorticography to predict the extent of hippocampal resection in temporal lobe epilepsy surgery. J Neurosurg. 2000;93:44–52. doi: 10.3171/jns.2000.93.1.0044. [DOI] [PubMed] [Google Scholar]
- Mehlhorn G, Hollborn M, Schliebs R. Induction of cytokines in glial cells surrounding cortical beta-amyloid plaques in transgenic Tg2576 mice with Alzheimer pathology. Int J Dev Neurosci. 2000;18:423–431. doi: 10.1016/s0736-5748(00)00012-5. [DOI] [PubMed] [Google Scholar]
- Messori A, Polonara G, Carle F, Gesuita R, Salvolini U. Predicting posttraumatic epilepsy with MRI: prospective longitudinal morphologic study in adults. Epilepsia. 2005;46:1472–1481. doi: 10.1111/j.1528-1167.2005.34004.x. [DOI] [PubMed] [Google Scholar]
- Nagai M, Re DB, Nagata T, Chalazonitis A, Jessell TM, Wichterle H, Przedborski S. Astrocytes expressing ALS-linked mutated SOD1 release factors selectively toxic to motor neurons. Nat Neurosci. 2007;10:615–622. doi: 10.1038/nn1876. [DOI] [PMC free article] [PubMed] [Google Scholar]
- Nishida H, Okabe S. Direct astrocytic contacts regulate local maturation of dendritic spines. J Neurosci. 2007;27:331–340. doi: 10.1523/JNEUROSCI.4466-06.2007. [DOI] [PMC free article] [PubMed] [Google Scholar]
- Oberheim NA, Wang X, Goldman S, Nedergaard M. Astrocytic complexity distinguishes the human brain. Trends Neurosci. 2006;29:547–553. doi: 10.1016/j.tins.2006.08.004. [DOI] [PubMed] [Google Scholar]
- Ogata K, Kosaka T. Structural and quantitative analysis of astrocytes in the mouse hippocampus. Neuroscience. 2002;113:221–233. doi: 10.1016/s0306-4522(02)00041-6. [DOI] [PubMed] [Google Scholar]
- Palop JJ, Chin J, Roberson ED, Wang J, Thwin MT, Bien-Ly N, Yoo J, Ho KO, Yu GQ, Kreitzer A, Finkbeiner S, Noebels JL, Mucke L. Aberrant excitatory neuronal activity and compensatory remodeling of inhibitory hippocampal circuits in mouse models of Alzheimer's disease. Neuron. 2007;55:697–711. doi: 10.1016/j.neuron.2007.07.025. [DOI] [PMC free article] [PubMed] [Google Scholar]
- Proper EA, Hoogland G, Kappen SM, Jansen GH, Rensen MG, Schrama LH, van Veelen CW, van Rijen PC, van Nieuwenhuizen O, Gispen WH, de Graan PN. Distribution of glutamate transporters in the hippocampus of patients with pharmaco-resistant temporal lobe epilepsy. Brain. 2002;125:32–43. doi: 10.1093/brain/awf001. [DOI] [PubMed] [Google Scholar]
- Reid SA, Sypert GW. Acute FeCl3-induced epileptogenic foci in cats: electrophysiological analyses. Brain Res. 1980;188:531–542. doi: 10.1016/0006-8993(80)90051-7. [DOI] [PubMed] [Google Scholar]
- Rothstein JD, Van Kammen M, Levey AI, Martin LJ, Kuncl RW. Selective loss of glial glutamate transporter GLT-1 in amyotrophic lateral sclerosis. Ann Neurol. 1995;38:73–84. doi: 10.1002/ana.410380114. [DOI] [PubMed] [Google Scholar]
- Samuelsson C, Kumlien E, Flink R, Lindholm D, Ronne-Engstrom E. Decreased cortical levels of astrocytic glutamate transport protein GLT-1 in a rat model of posttraumatic epilepsy. Neurosci Lett. 2000;289:185–188. doi: 10.1016/s0304-3940(00)01284-2. [DOI] [PubMed] [Google Scholar]
- Schauwecker PE. Genetic basis of kainate-induced excitotoxicity in mice: phenotypic modulation of seizure-induced cell death. Epilepsy Res. 2003;55:201–210. doi: 10.1016/s0920-1211(03)00115-3. [DOI] [PubMed] [Google Scholar]
- Schroder W, Hinterkeuser S, Seifert G, Schramm J, Jabs R, Wilkin GP, Steinhauser C. Functional and molecular properties of human astrocytes in acute hippocampal slices obtained from patients with temporal lobe epilepsy. Epilepsia. 2000;41(Suppl 6):S181–S184. doi: 10.1111/j.1528-1157.2000.tb01578.x. [DOI] [PubMed] [Google Scholar]
- Sinha S, Naritoku DK. Intravenous valproate is well tolerated in unstable patients with status epilepticus. Neurology. 2000;55:722–724. doi: 10.1212/wnl.55.5.722. [DOI] [PubMed] [Google Scholar]
- Suzuki F, Makiura Y, Guilhem D, Sorensen JC, Onteniente B. Correlated axonal sprouting and dendritic spine formation during kainate-induced neuronal morphogenesis in the dentate gyrus of adult mice. Exp Neurol. 1997;145:203–213. doi: 10.1006/exnr.1997.6469. [DOI] [PubMed] [Google Scholar]
- Swann JW, Al-Noori S, Jiang M, Lee CL. Spine loss and other dendritic abnormalities in epilepsy. Hippocampus. 2000;10:617–625. doi: 10.1002/1098-1063(2000)10:5<617::AID-HIPO13>3.0.CO;2-R. [DOI] [PubMed] [Google Scholar]
- Tauck DL, Nadler JV. Evidence of functional mossy fiber sprouting in hippocampal formation of kainic acid-treated rats. J Neurosci. 1985;5:1016–1022. doi: 10.1523/JNEUROSCI.05-04-01016.1985. [DOI] [PMC free article] [PubMed] [Google Scholar]
- Tavazoie SF, Alvarez VA, Ridenour DA, Kwiatkowski DJ, Sabatini BL. Regulation of neuronal morphology and function by the tumor suppressors Tsc1 and Tsc2. Nat Neurosci. 2005;8:1727–1734. doi: 10.1038/nn1566. [DOI] [PubMed] [Google Scholar]
- Terai K, Iwai A, Kawabata S, Sasamata M, Miyata K, Yamaguchi T. Apolipoprotein E deposition and astrogliosis are associated with maturation of beta-amyloid plaques in betaAPPswe transgenic mouse: Implications for the pathogenesis of Alzheimer's disease. Brain Res. 2001;900:48–56. doi: 10.1016/s0006-8993(01)02202-8. [DOI] [PubMed] [Google Scholar]
- Theodosis DT, Piet R, Poulain DA, Oliet SH. Neuronal, glial and synaptic remodeling in the adult hypothalamus: functional consequences and role of cell surface and extracellular matrix adhesion molecules. Neurochem Int. 2004;45:491–501. doi: 10.1016/j.neuint.2003.11.003. [DOI] [PubMed] [Google Scholar]
- Tian GF, Azmi H, Takano T, Xu Q, Peng W, Lin J, Oberheim N, Lou N, Wang X, Zielke HR, Kang J, Nedergaard M. An astrocytic basis of epilepsy. Nat Med. 2005;11:973–981. doi: 10.1038/nm1277. [DOI] [PMC free article] [PubMed] [Google Scholar]
- Trachtenberg JT, Chen BE, Knott GW, Feng G, Sanes JR, Welker E, Svoboda K. Long-term in vivo imaging of experience-dependent synaptic plasticity in adult cortex. Nature. 2002;420:788–794. doi: 10.1038/nature01273. [DOI] [PubMed] [Google Scholar]
- Unger JW. Glial reaction in aging and Alzheimer's disease. Microsc Res Tech. 1998;43:24–28. doi: 10.1002/(SICI)1097-0029(19981001)43:1<24::AID-JEMT4>3.0.CO;2-P. [DOI] [PubMed] [Google Scholar]
- Volterra A, Meldolesi J. Astrocytes, from brain glue to communication elements: the revolution continues. Nat Rev Neurosci. 2005;6:626–640. doi: 10.1038/nrn1722. [DOI] [PubMed] [Google Scholar]
- Wang X, Arcuino G, Takano T, Lin J, Peng WG, Wan P, Li P, Xu Q, Liu QS, Goldman SA, Nedergaard M. P2X7 receptor inhibition improves recovery after spinal cord injury. Nat Med. 2004;10:821–827. doi: 10.1038/nm1082. [DOI] [PubMed] [Google Scholar]
- Weigert C. Beitrage zur kenntnis der normalen menshlichen neuroglia. Frankfurt: Moritz Diesterweg; 1895. [Google Scholar]
- Wilhelmsson U, Bushong EA, Price DL, Smarr BL, Phung V, Terada M, Ellisman MH, Pekny M. Redefining the concept of reactive astrocytes as cells that remain within their unique domains upon reaction to injury. Proc Natl Acad Sci USA. 2006;103:17513–17518. doi: 10.1073/pnas.0602841103. [DOI] [PMC free article] [PubMed] [Google Scholar]
- Willmore LJ, Sypert GW, Munson JB. Recurrent seizures induced by cortical iron injection: a model of posttraumatic epilepsy. Ann Neurol. 1978;4:329–336. doi: 10.1002/ana.410040408. [DOI] [PubMed] [Google Scholar]
- Willmore LJ, Hiramatsu M, Kochi H, Mori A. Formation of superoxide radicals after FeCl3 injection into rat isocortex. Brain Res. 1983;277:393–396. doi: 10.1016/0006-8993(83)90954-x. [DOI] [PubMed] [Google Scholar]
- Wuarin JP, Dudek FE. Excitatory synaptic input to granule cells increases with time after kainate treatment. J Neurophysiol. 2001;85:1067–1077. doi: 10.1152/jn.2001.85.3.1067. [DOI] [PubMed] [Google Scholar]
- Zha XM, Green SH, Dailey ME. Regulation of hippocampal synapse remodeling by epileptiform activity. Mol Cell Neurosci. 2005;29:494–506. doi: 10.1016/j.mcn.2005.04.007. [DOI] [PubMed] [Google Scholar]
- Zhuo L, Sun B, Zhang CL, Fine A, Chiu SY, Messing A. Live astrocytes visualized by green fluorescent protein in transgenic mice. Dev Biol. 1997;187:36–42. doi: 10.1006/dbio.1997.8601. [DOI] [PubMed] [Google Scholar]