

Abstract
Homer proteins are components of postsynaptic density (PSD) and play a crucial role in coupling diverse target molecules. However, the regulatory aspect of Homer-mediated coupling has been addressed only about a dominant-negative effect of Homer1a, which requires de novo gene expression. Here, we present evidence that Homer-mediated coupling is regulated by its phosphorylation state. We found that Homer3, the predominant isoform in Purkinje cells, is phosphorylated by calcium/calmodulin-dependent protein kinase II (CaMKII) both in vitro and in vivo. Biochemical fractionation with phosphor-specific antibodies revealed the presence of phosphorylated Homer3 in the cytosolic fraction in contrast to high levels of nonphosphorylated Homer3 in PSD. In P/Q-type voltage-gated-Ca2+ channel knock-out mice, in which CaMKII activation was reduced, the levels of Homer3 phosphorylation and the soluble form of Homer 3 were markedly lower. Furthermore, both robust phosphorylation of Homer3 and its dissociation from metabotropic glutamate receptor 1α (mGluR1α) were triggered by depolarization in primary cultured Purkinje cells, and these events were inhibited by CaMKII inhibitor. An in vitro binding kinetic analysis revealed that these phosphorylation-dependent events were attributable to a decrease in the affinity of phosphorylated Homer3 for its ligand. In a heterologous system, the Ca2+ signaling pattern induced by mGluR1α activation was modulated by the Homer3 phosphorylation state. Together, these findings suggested that Homer3 in Purkinje cells might function as a reversible coupler regulated by CaMKII phosphorylation and that the phosphorylation is capable of regulating the postsynaptic molecular architecture in response to synaptic activity.
Keywords: Purkinje cells, Homer, phosphorylation, CaMKII, synaptic plasticity, Ca2+ signaling
Introduction
Homer family proteins are adaptor proteins that bind to a variety of target proteins, including the group I metabotropic glutamate receptors (mGluRs) (Brakeman et al., 1997; Kato et al., 1998; Tu et al., 1998), inositol 1,4,5-trisphosphate receptors (IP3Rs) (Tu et al., 1998; Xiao et al., 1998), and the NMDA receptor complex adaptor Shank (Naisbitt et al., 1999; Tu et al., 1999), via conserved EVH1 (Enabled/Vasp homology 1) domain in the N terminus (Beneken et al., 2000; Xiao et al., 2000; Shiraishi-Yamaguchi and Furuichi, 2007). The long-form Homer proteins, Homer1b/c, Homer2, and Homer3, have the C-terminal coiled-coil region, which is responsible for their tetramer formation and enable to link target molecules at specific cellular regions, such as at excitatory postsynaptic sites (Hayashi et al., 2006). In contrast, Homer1a, which shows synaptic activity-dependent expression and fails to form tetramer attributable to lacking a coiled-coil region, is thought to function as a natural dominant negative to break clustering and/or linking target molecules (Brakeman et al., 1997; Kato et al., 1998; Kammermeier and Worley, 2007).
Many forms of synaptic plasticity of parallel fibers–Purkinje cells synapse, including long-term depression (LTD), which is a form of synaptic plasticity and is postulated as a cellular basis for motor learning, were reported (Ito, 2001; Boyden et al., 2004). Notably, a common and essential factor is a postsynaptic [Ca2+]i elevation (Hartell, 2002; Safo et al., 2006). Indeed, some upstream (Aiba et al., 1994; Inoue et al., 1998; Hirono et al., 2001) and downstream signaling molecules for postsynaptic [Ca2+]i elevation are found to be essential for induction of these plasticities (Ahn et al., 1999; Kawasaki et al., 1999; Boyden et al., 2004; Hansel et al., 2006). Homer1a overexpression in Purkinje cells induced the attenuation of [Ca2+]i mobilization, suggesting that Homer proteins are involved in physical and functional coupling of mGluR1α and IP3R1 (Tu et al., 1998)
Among Homer family proteins, Homer3 shows a relatively restricted expression pattern in CNS, i.e., high expression in hippocampal CA3 pyramidal cells and cerebellar Purkinje cells (Shiraishi et al., 2004). In Purkinje cells, Homer3 is distributed throughout the dendrites, axons, and soma, but the most remarkable accumulation of Homer3 was observed in dendritic spines. Previously, we presented that Homer3 protein showed multiple spots on two-dimensional (2D)-PAGE, suggesting that Homer3 can be a phosphor-protein (Shiraishi et al., 2003a). In this study, we revealed that Homer3 was phosphorylated by calcium/calmodulin-dependent protein kinase II (CaMKII) in Purkinje cells, and the phosphorylation reduces the affinity for Homer target molecules, resulting in change of the solubility. Moreover, the phosphorylation altered Ca2+ signaling patterns induced by mGluR1α in heterologous expression system. These results suggest that the phosphorylation may regulate postsynaptic molecular architecture and Ca2+ signaling of Purkinje cells in response to synaptic activity.
Materials and Methods
Animals.
Wild-type mice (ICR and C57B6J) were purchased from Nihon SLC (Hamamatsu, Japan). IP3R1 knock-out mice and α1A subunit of P/Q calcium channel knock-out mice were produced as described previously (Matsumoto et al., 1996; Kulik et al., 2004). All procedures undertaken in this study were conducted according to the RIKEN and National Institutes of Health guidelines for animal research and were approved by the RIKEN Animal Experiments Committee.
Plasmids and antibodies.
Mouse Homer3 cDNA was cloned as described previously. Site-directed mutagenesis of Homer3 for Ser to Ala or Asp substitution of each phosphorylation site, Ser120, Ser141, Ser159, and Ser176, was performed using QuickChange II Site-Directed Mutagenesis kit (Stratagene, La Jolla, CA). For expression of Homer3 in HeLa cells, hemagglutinin (HA)-tag epitope was introduced between the first and second amino acids by PCR-based strategy. Rat Homer1c cDNA was a kind gift from Dr. K. Inokuchi (Mitsubishi Kagaku Institute of Life Sciences, Tokyo, Japan). Ser117 to Ala mutation of Homer1c was also performed using QuickChange II Site-Directed Mutagenesis kit. Rat mGluR1α cDNA was a kind gift from Dr. S. Nakanishi (Osaka Bioscience Institute, Osaka, Japan). Myc-tag epitope and enhanced green fluorescence protein (EGFP) was introduced in the N-terminal extracellular domain (between Ser33 and Ser34) and the C-terminal cytoplasmic domain (between Tyr1192 and Lys1193), respectively, by PCR-based strategy. All constructed plasmids were verified by DNA sequencing. Mouse monoclonal anti-rat mGluR1α (clone G209-488; BD PharMingen, San Diego, CA), mouse monoclonal anti-rat CaMKIIα (clone 6G9; Affinity BioReagents, Golden, CO), and mouse monoclonal anti-phosphor-CaMKIIα (pThr286) (clone 22B1; Affinity BioReagents) were purchased.
Cerebellar fractionation.
Subcellular fractionation of 8 week mouse cerebella was performed as described previously (Carlin et al., 1980; Huttner et al., 1983). Cytosol and crude microsome fractions from postnatal day 14 (P14) wild-type and each knock-out mouse was performed as described previously (Yoshikawa et al., 1999).
Phosphor-protein analysis.
2D-PAGE was performed as described previously (Manabe et al., 1987; Shiraishi et al., 2003b). For dephosphorylation, cerebellar extracts were incubated with nonspecific bacterial alkaline phosphatase (1 U/100 μg protein) (Toyobo Engineering, Osaka, Japan) in the presence of 5 mm MgCl2 for 30 min at 30°C. Phosphorylation of Homer3 in COS cells were examined with coexpression of Homer3 cDNA and protein kinase cDNA(s): HA-tagged Xenopus constitutively active mitogen-activated protein kinase kinase (MEK) and HA-tagged Xenopus mitogen-activated protein kinase (MAPK) (a kind gift from Dr. Y. Goto, Tokyo University, Tokyo, Japan), constitutively active rat CaMKII (a kind gift from Dr. H. Yamamoto, Ryukyu University, Okinawa, Japan), constitutively active p21-activated kinase (PAK) (a kind gift from E. Manser, GlaxoSmithKline–Institute of Molecular and Cellular Biology Laboratory, Singapore), and p35/cyclin-dependent kinase 5 (CDK5) (a kind gift from T. Oshima, Brain Science Institute–RIKEN, Saitama, Japan). At 24 h after transfection, cells were directly lysed in SDS-PAGE sample buffer, and lysates were analyzed by Western blotting for Homer3 to detect the phosphorylation-induced retarded migration.
In vitro phosphorylation and phosphorylation site determination.
Homer protein was purified from Escherichia coli as glutathione S-transferase (GST)-fusion protein and released from GST by thrombin cleavage. Recombinant Homer protein in 25 mm HEPES, pH 7.4, 50 mm NaCl, 5 mm MgCl2, 3 mm EGTA, 3.3 mm CaCl2, 5 mm NaF, 2.5 mm DTT, 0.005% Triton X-100, and 4 μm CaM was incubated with 10 ng of rat CaMKIIα subunit purified from Sf9 cells (a kind gift from Dr. Y. Watanabe, Showa Pharmaceutical University, Tokyo, Japan) and with 200 μm ATP or [γ-32P]ATP at 30°C for indicated time periods. For phosphor-amino acid analysis, phosphorylated Homer3 labeled with [32P] was extracted from gel and partially hydrolyzed in 6N HCl for 2 h at 105°C. The hydrolyzed products were electrophoretically separated on cellulose thin-layer plate according to the method described previously (Ando et al., 2006). For determination of phosphorylation sites, phosphorylated Homer3, labeled with [32P] and nonradioactive, were in-gel digested with Lys-C endopeptidase (Wako, Tokyo, Japan) or trypsin (Promega, Madison, WI) in parallel, and the resultant peptides were separated on C-18 reverse-phase column (μRPC C2/C18 SC 2.1/10; GE Healthcare, Little Chalfont, UK) connected on a SMART LC system. Phosphor-peptides were identified by the radioactivity, and the phosphorylation site in the peptide was determined for parallel-prepared nonradioactive peptide with liquid chromatography electrospray ionization tandem mass spectrometry (LC/ESI–MS/MS) analysis by QSTAR quadrupole orthogonal acceleration time-of-flight mass spectrometer (AB/MDS Sciex, Toronto, Ontario, Canada).
Antibodies production for Homer3.
For production of phosphorylation state-specific antibodies for Homer3 phosphorylated at Ser120, Ser141, Ser159, and Ser176, phosphor-peptides pH3–120 (C-ARLAREKpSQDGGEF, corresponding to residues 113–126), pH3–141 (C-ASHQVPPpSPLVSTN corresponding to residues 134–147), pH3–159 (C-EEKLFRSQpSADTPG corresponding to residues 151–164), and pH3–176 (C-LKKMLpSEGSVG corresponding to residues 171–181) were synthesized and injected into Japanese white rabbits. Each phosphorylation state-specific antibody was obtained by affinity chromatography on each phosphor-peptide coupled Sepharose and subsequently absorption in nonphosphor-peptide (H3–120 C-ARLAREKSQDGGEF, H3–141 C-ASHQVPPSPLVSTN, H3–159 C-EEKLFRSQSADTPG, and H3–176 C-LKKMLSEGSVG) coupled Sepharose. Anti-Homer3 guinea pig polyclonal antibodies were produced using recombinant protein spanning amino acids 131–358 of Homer3 as an antigen. The specific antibody was obtained from guinea pig sera by affinity column chromatography using Sepharose coupled with GST-fusion protein carrying the same region used in antigen. The specificity of guinea pig anti-Homer3 antibody was examined as described previously (Shiraishi et al., 2003a).
Surface plasmon resonance analysis.
The effect of Homer3 phosphorylation on the direct binding between Homer3 and Homer ligand was examined by surface plasmon analysis (Biacore 2000; Biacore, Uppsala, Sweden). Homer ligand peptide fused with antennapedia peptide (RQIKIWFQNRRMKWKK-LPEPPATFCDPEE, amino acids 543–555 in mouse drebrin E) and control peptide (RQIKIWFQNRRMKWKK-LPEPLATFCDPEE) were synthesized. Equal molar amount (150 resonance units) of each peptide was immobilized on CM5 sensor chip according to the instructions of the manufacturer. Homer protein, either wild type or mutant, was incubated with CaMKII in phosphorylation assay solution for indicated time periods. The phosphorylation reaction was halted by adding 50 mm EDTA and diluted in running buffer [10 mm HEPES, pH 7.4, containing 150 mm NaCl, 1 mm EDTA, 1 mm DTT, and 0.05% (v/v) Tween 20] to adjust Homer protein concentration to 1–100 nm. The samples were injected at 20 μl/min flow rate. Regeneration of sensor chips between each experiment was done by three times loading of 20 mm NaOH for 15 s. Sensor gram of specific binding was obtained by subtraction of that from the flow cell coupled with control peptide and was analyzed using BIA evaluation 3.1 software. For determination of kinetics constants, sensor grams were subjected to global analysis with using a 1:1 Langmuir model to fit the data.
Cerebellar primary cultures and immunocytochemistry.
Cerebellar primary cultures were prepared basically as described previously (Shiraishi et al., 1999). Briefly, cerebella were dissected from embryonic day 18 ICR mice digested with 0.1% trypsin (Sigma, St. Louis, MO) and 0.05% DNaseI (Roche Diagnostics, Mannheim, Germany) in Ca2+/Mg2+-free HBSS (Sigma) for 13 min at 37°C. The dissociated cells were plated at 5 × 10⁵ cells per glass coverslip coated with poly-l-lysine (Sigma) and cultured in serum-free Eagle's minimal essential medium-based chemical conditioned medium supplemented with 0.25% (w/v) glucose (Nacalai Tesque, Kyoto, Japan), 10 μg/ml insulin (Sigma), 0.1 nm l-thyroxine (Sigma), 0.1 mg/ml apo-transferrin (Sigma), 1 mg/ml bovine serum albumin (Sigma), 2 mm l-glutamine (Nacalai Tesque), 1 μg/ml aprotinin (Sigma), 30 nm sodium selenite (Merck, Darmstadt, Germany), 100 U/ml penicillin (Banyu Pharmaceutical, Tokyo, Japan), and 100 μg/ml streptomycin (Meiji, Tokyo, Japan) in a humidified 5% CO2 atmosphere at 37°C. The cultures were used at 14–17 d in vitro (DIV). Cells were incubated in HEPES-buffered saline (HBS), 20 mm HEPES, pH 7.4, 135 mm NaCl, 4 mm KCl, 1 mm Na2HPO4, 2 mm CaCl2, 1 mm MgCl2, and 10 mm glucose, in the presence or absence of 10 μm KN-93 (2-[N-(2-hydroxyethyl)]-N-(4-methoxybenzenesulfonyl)amino-N-(4-chlorocinnamyl)-N-methylbenzylamine) (Calbiochem, San Diego, CA). Cells were depolarized by replacing the extracellular solution into the HBS containing 55 mm KCl and 84 mm NaCl for indicated time periods. The cells were fixed with 4% paraformaldehyde, 4% sucrose in PBS for 15 min, followed by permeabilization with 0.1% Triton X-100 for 5 min. After blocking with 2% normal goat serum in PBS, cells were incubated with the primary antibodies in 2% normal goat serum in PBS overnight at 4°C. Primary antibodies were rabbit anti-phosphor-specific Homer3 (1 μg/ml) and guinea pig anti-Homer3 (0.5 μg/ml). Immunolabeling was visualized using Alexa Fluor 488-conjugated anti-rabbit and Alexa Fluor 594-conjugated anti-guinea pig secondary antibodies (Invitrogen, Carlsbad, CA). Coverslips were mounted in Vectashield (Vector Laboratories, Burlingame, CA) mounting medium.
Immunoprecipitations and Western blotting.
For immunoprecipitation, cerebellar primary cultured cells were plated on 3.5 cm dishes precoated with poly-l-lysine. After the cells at DIV 14–17 were treated with 55 mm KCl for 2 min as described above, cells were immediately frozen by placing the dishes onto liquid nitrogen. The frozen cells were collected in 0.5 ml of 10 mm HEPES, pH 7.4, 1% Triton X-100, 100 mm NaCl, 2 mm EDTA, 25 mm NaF, 25 mm Na-pyrophosphate, and protease inhibitor cocktail (Complete; Roche Diagnostics), followed by incubation for 30 min on ice to allow proteins solubilized. After centrifugation (20,000 × g, for 25 min at 4°C), the cleared lysates were incubated with rabbit anti-Homer3 antibody (2 μg) or normal rabbit IgG (2 μg) with 20 μl (50% slurry) of protein G Sepharose (GE Healthcare) for 8 h at 4°C. After washing beads with the lysis buffer several times, each immunoprecipitate was mixed with SDS-PAGE sample buffer and boiled for 5 min. The immunoprecipitate as well as lysate were loaded on 10% SDS-PAGE and transferred onto polyvinylidene difluoride membrane (Millipore, Bedford, MA). The membrane was blocked with 5% skim milk in PBST (PBS plus 0.05% Tween 20) before incubation with the primary antibodies. The primary antibodies used were anti-mGluR1α monoclonal antibody (1 μg/ml), rabbit anti-phosphor-specific Homer3 (0.5 μg/ml), and rabbit anti-Homer3 (0.2 μg/ml). Incubation with the primary antibody was performed for 2 h at room temperature. After three washes with PBST, the membrane was incubated with horseradish peroxidase-conjugated secondary antibody (1:4000; GE Healthcare) for 1 h at room temperature. The blot was developed using chemiluminescence reagents (ECL; GE Healthcare). For quantitative analysis, after primary antibody incubation, the membrane was incubated with appropriate secondary antibodies conjugated with Alexa Fluor 680-conjugated (Invitrogen) or with IRDyeTM 800 (Rockland, Gilbertsville, PA). The membranes were scanned by Odyssey infrared imaging system (LI-COR Biosciences, Lincoln, NE).
Immunohistochemistry and quantitative analysis.
Immunohistochemical study was performed essentially as described previously (Shiraishi et al., 2004). In brief, the brains were sectioned parasagittally at 8 μm thickness with a cryostat (CM1850; Leica, Frankfurt, Germany). The sections, after blocking with 2% normal goat serum (Vector Laboratories) in PBS, were reacted with the primary antibody (guinea pig anti-Homer3 antibody at 0.5 μg.ml and rabbit anti-phosphor-Homer3 antibody at 1 μg.ml) overnight at 4°C. Immunolabeling was visualized using Alexa Fluor 488-conjugated anti-rabbit and Alexa Fluor 594-conjugated anti-guinea pig secondary antibodies (Invitrogen). The immunoreactions were observed with an epifluorescence microscope (Eclipse E800; Nikon, Tokyo, Japan) equipped with a cooled CCD camera (Spot; Diagnostic Instruments, Sterling Heights, MI) or a confocal laser microscope (FluoView FV300; Olympus, Tokyo, Japan) with constant settings of parameters. Distribution of each phosphorylated Homer3 (pSer120 or pSer176) on Purkinje cells was determined by analyzing the fluorescence intensity ratio of phosphorylated Homer 3 signals to total Homer 3 signals by NIH Image J software on 20 Purkinje cells from four independent sections. Statistical significance was determined by Student's t test.
Ca2+ imaging.
HeLa cells were transfected with myc–mGluR1α–EGFP and HA–Homer3 (2:1, weight ratio). At 16–24 h after transfection, HeLa cells were incubated with 5 μm fura-2 AM (Dojindo, Kumamoto, Japan) for 30 min at room temperature. The fura-2-loaded cells were placed on the stage of an inverted fluorescence microscope (Eclipse TE300; Nikon) and perfused with HBS buffer (in mm: 20 HEPES, 115 NaCl, 5.4 KCl, 1 MgCl2, 1 CaCl2, and 10 glucose, pH 7.4). Parallel experiments showed that the efficiency of coexpression of Homer3 in EGFP-positive cells were 99.5%, and we selected cells expressing EGFP–mGluR1α diffusely for analysis. Image capture and processing were performed with an ORCA-ER system (Hamamatsu Photonics, Hamamatsu, Japan) at room temperature. With alternate illumination at 340 and 380 nm excitation, pairs of fluorescence images were obtained through an objective lens (S Fluor 20×; Nikon) and an emission filter (510–550 nm). Data are presented as means ± SEM.
Results
Homer3 is phosphorylated at Ser120, Ser159, and Ser176 by CaMKII in vitro
Our previous findings showed that Homer3 is highly expressed in cerebellar Purkinje cells and a prominent distribution in spines and dendrites (Shiraishi et al., 2004). 2D-PAGE analysis of mouse cerebellar lysates indicated predominant expression of Homer3 in mouse cerebellum (supplemental Fig. S1, available at www.jneurosci.org as supplemental material), suggesting that Homer3 is involved in coupling mGluR1α and IP3R1, both of which are highly expressed and localized at postsynaptic sites in Purkinje cells (Furuichi et al., 1989; Shigemoto et al., 1992; Matsumoto et al., 1996; Petralia et al., 1997). Biochemical fractionation of the cerebellum has consistently showed that Homer3 is rich in the crude synaptosomal fraction (Fig. 1A, P2′). Interestingly, Homer3 appeared in a doublet band in the P2′ fraction, and, when the synaptosomal membranes were disrupted by hypotonic treatment, the upper band was preferentially recovered in the synaptosomal cystosol (SC) fraction (Fig. 1A, SC), whereas the lower band was recovered in crude postsynaptic density (PSD) fraction (Fig. 1A, cPSD). When each fraction was treated with alkaline phosphatase, the upper band signals were reduced and converged in the lower band, suggesting that the upper band was slow-migrating Homer3 as a result of phosphorylation, which is often observed in phosphor-proteins. To determine whether that was true, we separated the SC fraction on 2D-PAGE, and the results showed that the Homer3 in the SC fraction yielded at least four spots. After treatment with alkaline phosphatase, the most acidic spot (supplemental Fig. S1, spot d, available at www.jneurosci.org as supplemental material) was no longer detected, and the signal of the most basic spot had increased (Fig. 1B). These results clearly indicated that some parts of Homer3 were phosphorylated and that the phosphorylation altered the extractability of Homer3 in biochemical fractionation. Several protein kinases in Purkinje cells have been reported to be essential for induction of various types of synaptic plasticity and Purkinje cell development (Ahn et al., 1999; Kawasaki et al., 1999; Ohshima et al., 1999; Bryan et al., 2004; Hansel et al., 2006). Because Homer proteins function as adaptors, the phosphorylation-dependent change in extractability of Homer3 implied that phosphorylation might be involved in the reorganization of the postsynaptic molecular network that should occur during the induction of synaptic plasticity or during the synapse development. We therefore tried to identify the protein kinase(s) that phosphorylated Homer3 in heterologous cells expressing Homer3 with several protein kinases in the active state, based on criteria of retarded migration and the multiple phosphorylation. The results showed that migration was retarded when coexpressed with constitutively active MEK/MAPK or with constitutively active CaMKIIα but not with PAK, PAK5, or p35/CDK5 (Fig. 1C, and data not shown). 2D-PAGE analysis revealed that Homer3 was phosphorylated at multiple sites in the cells coexpressing MAPK (at least four sites) and in the cells coexpressed with CaMKIIα (at least three sites) (Fig. 1D). In vitro phosphorylation experiments confirmed that both CaMKII and MAPK phosphorylated Homer3 (Fig. 1E), indicating that Homer3 was directly phosphorylated by CaMKII and MAPK. Phosphor-amino acid analysis indicated that Homer3 was exclusively phosphorylated at Ser residues by both CaMKII (Fig. 2A) and MAPK (data not shown), and two phosphor-peptides were isolated from the Lys-C endopeptidase digestion products of Homer3 phosphorylated by CaMKII (Fig. 2B, L11 and L16). Each peptide sequence was determined by LC/EIS–MS/MS analysis (Fig. 2C), and Ser120 and Ser159 were identified as phosphorylation sites in two Lys-C endopeptidase digests. Both mutants, in which Ser120 substituted to Ala a S120A mutant and a S159A mutant, showed reduced phosphorylation by CaMKII (Fig. 3A). Reverse-phase HPLC separation of the Lys-C endopeptidase yielded only two phosphor-peptides, but double-mutated Homer3 (S120A/S59A) was still substantially phosphorylated by CaMKII (Fig. 3A). Indeed, one phosphor-peptide was obtained from S120A/S159A digested with trypsin, and the third phosphorylation site was identified at Ser176 (Fig. 2B,C, T18). The triple mutant S120A/S159A/S176 was barely phosphorylated by CaMKII (Fig. 3A), confirming that these three Ser residues of Homer3, Ser120, Ser159, and Ser176, were CaMKII phosphorylation sites in vitro. The same approach yielded only one phosphor-peptide derived from MAPK-phosphorylated Homer3, and the phosphorylation site was determined to be Ser141 (data not shown). In a heterologous system, Homer3 was phosphorylated at multiple sites if coexpressed with constitutively active MEK/MAPK, as judged by 2D-PAGE (Fig. 1D), but the S141A mutant was no longer phosphorylated by MAPK in vitro (Fig. 3B), suggesting that Ser141 was the only site directly phosphorylated by MAPK and that, in the heterologous cells, other sites besides the Ser141 of Homer3 were phosphorylated by unidentified kinase(s), which might be activated by MEK/MAPK. All four phosphorylation sites identified here were mapped to the linker region between the N-terminal EVH1 domain and the C-terminal coiled-coil region (Fig. 3C), and all four residues are conserved in diverse species (Fig. 3D).
Figure 1.

Homer3 in a synaptic cytosol fraction was phosphorylated, and CaMKII and MAPK were candidates for Homer3 kinase. A, Crude synaptosome (P2′) from mouse cerebella was disrupted by hypotonic treatment and fractionated into SC and PSD fractions. Each fraction was treated with or without alkaline phosphatase (AP), and Homer3 in each fraction was examined by Western blotting. B, The synaptic cytosol fraction, treated with or without alkaline phosphatase (AP), was separated on 2D-PAGE and examined by Western blotting for Homer3. C, Homer3 and various protein kinases were cotransfected in COS cells, and migration of Homer3 on SDS-PAGE was analyzed by Western blotting. D, COS cells lysate, coexpressing Homer3 with constitutively active MEK and MAPK (+MEK c.a./MAPK) or constitutively active CaMKIIα (+CaMKII c.a.) was separated on 2D-PAGE and was examined by Western blotting for Homer3. E, Homer3 protein purified from E. coli was in vitro phosphorylated by CaMKII or MAPK for 30 min at 30°C with [γ-32P] ATP. Pi incorporation into Homer3 was assessed by autoradiography. Phosphorylation-induced retarded migration of Homer3 was observed in Coomassie brilliant blue (CBB)-strained gel.
Figure 2.

In vitro Homer3 phosphorylation sites by CaMKII were determined. A, Purified Homer3 was in vitro phosphorylated by CaMKII with [γ-32P] ATP, and phosphorylated amino acids were determined by a partial hydrolysis of a radiolabeled Homer3 with 6N HCl, followed by 2D electrophoresis on thin-layer cellulose plate. B, In vitro phosphorylated Homer3 by CaMKII with [γ-32P]ATP was digested with Lys-C endopeptidase or trypsin (wild type digested with Lys-C endopeptidase and S120A/S159A mutant digested with trypsin). Digested peptides were separated on reverse-phase HPLC, and phosphor-peptides were isolated by monitoring the radioactivity (indicated by red symbols). C, Isolated phosphor-peptides were analyzed by LC-MS/MS, and phosphorylation sites were determined. L11 and L16 were peptides from Lys-C endopeptidase digests, and T18 was from trypsin digest.
Figure 3.
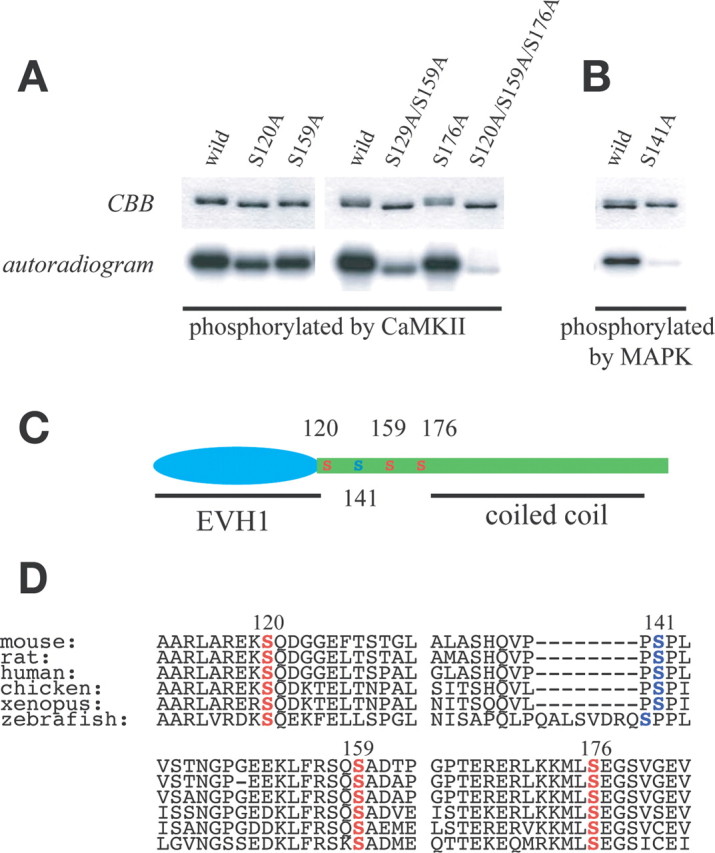
In vitro CaMKII phosphorylation sites of Homer3 were at Ser120, Ser159, and Ser176, and MAPK site was at Ser141. A, Wild-type or mutated Homer3 protein was processed for in vitro phosphorylation by CaMKII, and the phosphate incorporation was analyzed by autoradiography. B, Wild-type or mutated Homer3 protein was processed for in vitro phosphorylation by MAPK, and the phosphate incorporation was analyzed by autoradiography. C, Schematic diagram of phosphorylation sites of Homer3 by CaMKII (red S) and MAPK (blue S). D, Homer3 phosphorylation sites were conserved among species. Each amino acid sequence was from GenBank accession numbers NP_036114 (mouse), NP_445762 (rat), NP_004829 (human), XP_418233 (chicken), XP_687581 (zebra fish), or NP_001080624 (Xenopus).
Homer3 phosphorylation at Ser120, Ser159, and Ser176 occurs in vivo
2D-PAGE analysis of in vivo cerebellar proteins showed that Homer was phosphorylated at least three sites (Fig. 1B), and the fact that CaMKII phosphorylates three Ser residues of Homer3 in vitro suggested that Homer3 might be a bona fide substrate for CaMKII in Purkinje cells. To test this hypothesis, we first produced phosphor-specific antibodies that recognized Homer3 phosphorylated at each Ser residue. Affinity-purified anti-pSer120, anti-pSer159, and anti-pSer176 antibodies were obtained, and their specificity was assessed by Western blotting and immunocytochemical analysis. None of the phosphor-specific antibodies reacted with Homer3 purified from E. coli, but they all showed clear reactivity against Homer3 phosphorylated by CaMKII in vitro (Fig. 4B). The reactivity was abolished when the antibody was preincubated with each antigenic phosphor-peptide but not when preincubated with nonphosphor-peptide (data not shown), suggesting that the signals were specific. The immunocytochemical analysis, Homer3 solely expressed in HeLa cells was barely detected by each phosphor-specific antibody, but when coexpressed with constitutively active CaMKII, the anti-pSer120 and anti-pSer176 yielded clear signals in the cells expressing Homer3 (Fig. 4C). Anti-pSer159 antibody did not react with cellular Homer3, even when coexpressed with constitutively active CaMKII (Fig. 4C), suggesting that the pSer159 antibody was only usable in Western blotting. We used these phosphor-specific antibodies to determine whether Homer3 was phosphorylated at the corresponding sites in vivo. Homer3 in the S1 fraction prepared from mouse cerebella was recognized by all three phosphor-specific antibodies. When the fraction was treated with alkaline phosphatase, the immunoreactive signals of anti-pSer120 and of anti-pSer159 were disappeared and diminished greatly, respectively (Fig. 5A), but the anti-pSer176 signal was only slightly reduced (Fig. 5A). Because the results of the 2D-PAGE analysis showed that alkaline phosphatase treatment did not completely dephosphorylate Homer3 (Fig. 1B), the phosphorylated Ser176 of Homer3 may be relatively resistant to phosphatase treatment under the conditions used in this study. These findings indicated that phosphorylation of Homer3 at Ser120, Ser159, or Ser176 also occurred in vivo. Because, as described above, the phosphorylated form of Homer3 was found in the soluble fraction, we investigated the distribution of Homer3 phosphorylated at each Ser. The results showed that Homer3 phosphorylated at Ser120 (pSer120), Ser159 (pSer159), or Ser 176 (pSer176) was found in soluble fractions, i.e., cytosol (S3) and detergent extractable fraction from crude synaptosome (1% Triton X-100) (Fig. 5B). Remarkably, in contrast to the high levels of Homer3 protein in the PSD fraction, consistent with a previous report (Fig. 5B) (Xiao et al., 1998), the PSD contained little Homer3 phosphorylated (Fig. 5B, PSD), suggesting that phosphorylated Homer3 was more easily extractable than nonphosphorylated Homer3. We also produced anti-phosphor-specific antibody against Ser141, the MAPK phosphorylation site and investigated phosphorylation in vivo, but no phosphorylation of Ser141 has been detected in vivo thus far. We therefore focused on the phosphorylation of Homer3 by CaMKII. Comparison of the signal patterns of Homer3 obtained by 2D-PAGE Western blotting on P14 and P56 (supplemental Fig. S1, available at www.jneurosci.org as supplemental material) revealed a higher level of phosphorylated Homer3 (supplemental Fig. S1, spot c or d compared with spot a or b, available at www.jneurosci.org as supplemental material) on P14 than on P56. We then measured the phosphorylation level of each Ser residue from P7 to P56 by Western blotting. The phosphorylation level of pSer120 showed a marked increase during development, i.e., the level was much higher at approximately P14 than at P28 or later (Fig. 5C), whereas the phosphorylation levels of Ser159 and Ser176 were relatively constant after P14.
Figure 4.

Productions and specificity of anti-phosphorylated Homer3-specific antibodies. A, Each phosphor-peptide was synthesized and used for generations of anti-phosphorylated Homer3-specific antibodies. B, Homer3 protein from E. coli was phosphorylated by CaMKII, and the phosphorylation state of indicated serine residue was examined by Western blotting with each anti-phosphor-Homer3 antibody. C, Homer3 was expressed with or without constitutively active (c.a.) CaMKII in COS cells, and the phosphorylation state of indicated serine residue was examined by immunocytochemistry with each anti-phosphor-Homer3 antibody.
Figure 5.

Homer3 is phosphorylated at Ser120, Ser159, and Ser176 in vivo. A, Denuclear crude lysates (S1) from P14 mouse cerebella were treated with or without alkaline phosphatase (AP) and analyzed by Western blotting for phosphorylation state of each Ser residue. B, P14 mouse cerebellar were fractionated and examined for Homer3 and phosphoHomer3 distribution. Relative abundance of immunoreactivities; Homer3, pSer120, pSer159, and pSer176 were determined by fluorescence intensity-based quantitative Western blotting as the amount of each immunoreactive signal in S1 fraction was standardized to 1. The values were means from three independent preparations. *p < 0.001. Error bars represent SEM. C, S1 fractions prepared from mouse cerebellum at indicated postnatal day was examined for Homer3 and phosphorylated Homer3 by Western blotting. Phosphorylation level (indicated as phosphor-Homer3/total Homer3) at each Ser residue was semiquantitated by dividing fluorescence intensity from anti-phosphor-specific antibody by that from anti Homer3. Each phosphorylation level in P7 was standardized to 1. The values represent means from three independent preparations. *p < 0.001. Error bars represent SEM.
Because biochemical fractionation revealed that the phosphorylated form of Homer3 was easy to extract, we attempted to investigate a distribution of phosphorylated Homer3 in Purkinje cells by immunohistochemistry. In P14 mouse cerebellum, most Purkinje cells were stained with the antibody for pSer120 (Fig. 6A). Although both pSer120 and Homer3 were observed throughout the Purkinje cells, the relative signal intensity of pSer120 to Homer3 was more prominent in the proximal dendrites and soma than in the distal dendrites and dendritic spines (Fig. 6A,B). In contrast, the pSer120 signals in P56 mouse cerebellum were clearly weak. Most of the signals that were observed were detected in the proximal dendrites and soma, and hardly any were observed in the distal dendrites or dendritic spines, which are rich in Homer3 proteins (Fig. 6A,B). pSer176 showed the similar distribution pattern in P14 Purkinje cells with prominent staining observed in the proximal dendrites and soma and weaker staining in the distal dendrites and dendritic spines (Fig. 6A,B). However, the relative signal intensity of pSer176 to Homer3 in the distal dendrites and dendritic spines of P56 Purkinje cells did not diminish, and the relative intensity in the proximal dendrites and soma increased in P56 Purkinje cells. These findings suggest that phosphorylation of Homer3 may induce not only increase of extractability from the sites that are rich in Homer3 and where phosphorylation occurred but also induce translocation, e.g., from spines to dendrites.
Figure 6.
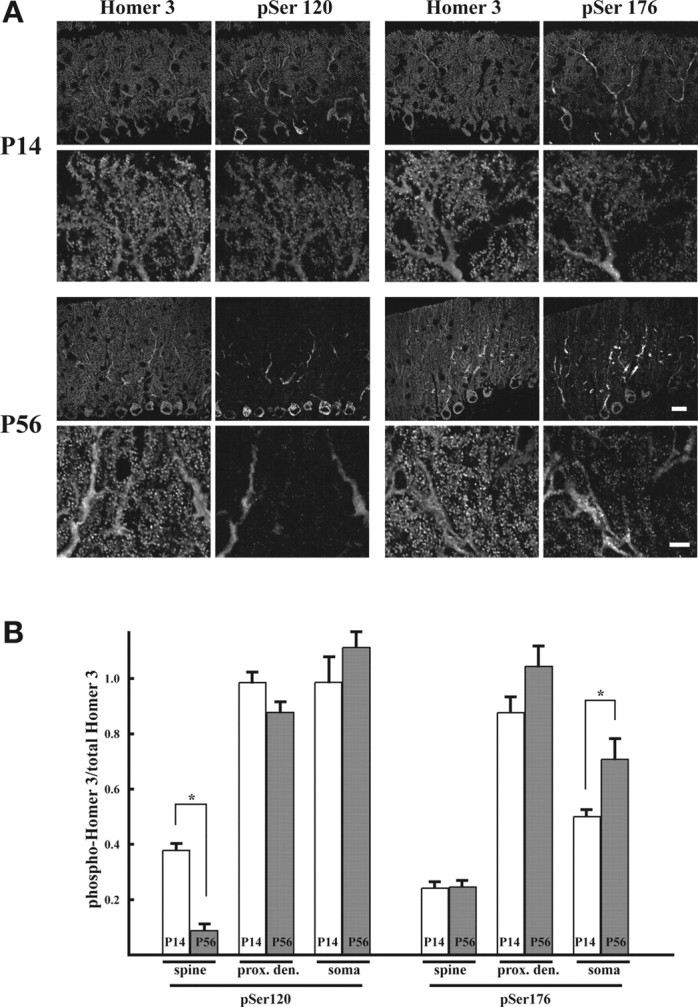
Distinct distribution of phosphorylated Homer3 (pSer120) between in P14 and P56 mouse cerebellum. A, Comparative immunohistochemical analysis between P14 and P56 mouse cerebellum was done for both pSer120 and pSer176, costained for Homer3. Cryosections (7 μm thick) were probed with each antibody. Scale bars: lower magnification, 20 μm; higher magnification, 6 μm. B, Quantification of the distribution of each phosphorylated Homer3: pSer120 or pSer176, in spines, proximal dendrites, and soma of P14 and P58 mouse cerebellum. Abundance of each phosphorylated-Homer3 in subregions of Purkinje cells (spines, proximal dendrites, and soma) was assessed in total 20 Purkinje cells obtained from four independent sections. The abundance was represented by dividing immunofluorescence signal intensity of phosphor-specific antibodies by that of Homer3 antibody. The values represent means. *p < 0.01. Error bars represent SEM.
Homer3 is phosphorylated by CaMKII in vivo
Because phosphorylated Homer3 showed easily extractable property and was preferentially distributed in the proximal dendrites and soma of Purkinje cells, if the phosphorylation was occurring as a result of CaMKII activation in response to synaptic activity, the phosphorylations would seem to be one of the key events that induced the change in postsynaptic molecular architecture. To determine whether the phosphorylations occurred in response to synaptic activity and whether CaMKII was involved in the process, we examined the phosphorylation of Homer3 in primary cultured cerebellar Purkinje cells before and after depolarization. Depolarization induces a Ca2+ influx into Purkinje cells via voltage-gated calcium channels, especially via P/Q-type calcium channel (Hartmann and Konnerth, 2005), which leads to CaMKII activation. In the resting state, Homer3 phosphorylated at each Ser120, Ser159, or Ser176 was not detected by Western blotting (Fig. 7A). Consistent with this finding, at cellular levels, detection of pSer120 or pSer176 was rare in Purkinje cells, and, when pSer120 or pSer176 was detected, the phosphorylation at both sites was almost restricted in soma of Purkinje cells (Fig. 7B). When depolarization was induced by increasing extracellular potassium concentration to 55 mm, phosphorylation at all three sites, Ser120, Ser149, and Ser176, were drastically increased within 2 min (Fig. 7A). pSer120 and pSer176 were observed throughout the Purkinje cells, including the dendritic spines and axons (Fig. 7B). Preincubation with 10 μm KN-93, a specific CaMKII inhibitor (Sumi et al., 1991; Takao et al., 2005), significantly inhibited the phosphorylation at Ser120 and Ser159 as demonstrated by Western blotting, and the inhibition at Ser120 was also confirmed in immunocytochemical analysis (Fig. 7A,B). These results clearly indicated that Homer3 was indeed phosphorylated at Ser120 and Ser159 by CaMKII in the primary cultured Purkinje cells. In contrast, both Western blotting and immunocytochemistry showed that phosphorylation at Ser176 was not significantly affected by KN-93, suggesting that Ser176 in primary cultured Purkinje cells might be phosphorylated by (an)other protein kinase(s) that was (were) activated by high potassium treatment.
Figure 7.

Phosphorylation of Homer3 at Ser120, Ser159, and Ser176 by CaMKII was induced by depolarization in primary cultured Purkinje cells. A, Primary cultured mouse cerebellar neurons (DIV 17) were treated with 55 mm KCl in the presence or absence of 10 μm KN-93, a specific inhibitor for calmodulin kinases. At the indicated time point after treatment with 55 mm KCl, whole lysates were prepared and examined by Western blotting with each specific antibody. B, Immunocytochemical analysis of primary cultured Purkinje cells was done with each specific antibody, at the indicated time point after 55 mm KCl treatment. Scale bar, 20 μm.
CaMKII was activated in a Ca2+/CaM-dependent manner (Griffith, 2004). In postsynaptic sites in Purkinje cells, the major route for increase in [Ca2+]i is P/Q-type calcium channel (Hartmann and Konnerth, 2005). We therefore examined phosphorylation state of Homer3 in P/Q–Ca2+-channel knock-out mice. As expected, CaMKIIα activation, as assessed by Western blotting for autophosphorylation at Thr268, was dramatically reduced in P/Q–Ca2+-channel knock-out mice at the P14 stage but not in the mutant mice that was deficient in IP3R1, which also contributes the postsynaptic Ca2+ signaling in Purkinje cells (Finch and Augustine, 1998; Hartmann and Konnerth, 2005) (Fig. 8A), suggesting that CaMKII was activated mainly by a Ca2+ influx via the P/Q–Ca2+ channel at the postsynaptic sites of Purkinje cells. Remarkably, the levels of Homer3 phosphorylation at all three sites in the P/Q–Ca2+-channel knock-out mice were dramatically reduced (Fig. 8B, lanes 1 and 4), and there was a parallel reduction in the amount of Homer3 in the soluble fraction (Fig. 8B, lanes 2 and 5). In contrast, no significant differences in phosphorylation level or fractionation pattern of Homer3 were found in IP3R1 knock-out mice at the same stage compared with wild type (Fig. 8B, lanes 7–9). Immunohistochemical analysis also indicated that hardly any phosphorylated Homer3 (pSer120) was present in the distal dendrites and dendritic spines of the P/Q–Ca2+-channel knock-out mice, and staining was weak in the proximal dendrite and soma (Fig. 8C). Together, these findings show that Homer3 was phosphorylated by CaMKII at every site in vivo as well, that Ca2+ influx via the P/Q–Ca2+ channel was more crucial to CaMKII activation than Ca2+ release from IP3R1 was, and that the phosphorylations actually contributed to determining the solubility of Homer3 protein, although contributions by other Ca2+ dependent kinase(s) could not be ruled out.
Figure 8.

Phosphorylated Homer3 and cytosolic Homer3 were decreased in parallel in P/Q–Ca2+-channel knock-out mice. A, CaMKIIα activity in wild (WT), P/Q–Ca2+-channel knock-out (P/Q KO), and IP3R1 knock-out (IP3R1 KO) mouse at P14 stage was examined by assessing the autophosphorylation level of CaMKIIα (pThr286) in S1 fraction from each mouse cerebellum. B, Denuclear crude lysates (lanes 1, 4, 7), cytosolic (lanes 2, 5, 8), and crude microsome (lanes 3, 6, 9) fractions were prepared from wild-type (lanes 1–3), P/Q knock-out (lanes 4–6), and IP3R1 knock-out (lanes 7–9) mouse cerebella, according to experimental procedures. Each fraction was examined for content of phosphorylated Homer3 at each site and total Homer3 protein by Western blotting. C, Cryosections were prepared from P14 wild-type and P/Q knock-out mice and examined for distribution of phosphorylated Homer3 at Ser120 (pS120) and total Homer3 by immunohistochemical analysis.
Homer3 phosphorylation reduces its affinity for target molecules and modulates the Ca2+ signaling patterns induced by mGluR1α activation
The preferential enrichment of phosphorylated Homer3 in the soluble fractions suggests that phosphorylation can alter the affinity of Homer3 for its target molecules. We therefore investigated whether the phosphorylation of Homer3 affects the interaction between Homer3 and mGluR1α, a major target molecule of Homer3 in Purkinje cells (Xiao et al., 1998), by means of coimmunoprecipitation assay of primary cultured Purkinje cells. Interaction between Homer3 and mGluR1α was observed in anti-Homer3 immunoprecipitates from resting Purkinje cells (Fig. 9, lane 7), but the amount of mGluR1α that coimmunoprecipitated with Homer3 was greatly reduced in Purkinje cells exposed to 55 mm KCl for 2 min (Fig. 9, lane 9), when robust phosphorylation of Homer3 occurred in Purkinje cells (Fig. 7). In contrast, when cells were preincubated with 10 μm KN-93, Homer3–mGluR1α complex remained intact after induction of depolarization (Fig. 9, lane 8). These results suggest that the interaction between Homer3 and mGluR1α can be regulated by phosphorylation of Homer3 by CaMKII.
Figure 9.

Depolarization induced a dissociation of Homer3 from mGluR1α in primary cultured Purkinje cells. Homer3 and mGluR1α interaction was examined from primary cultured mouse cerebellar cells (DIV 17). Lysates (lanes 1–3) from resting cells (lanes 1, 4, 7) and cells treated with 55 mm KCl for 2 min in the presence (lanes 2, 5, 8) or absence (lanes 3, 6, 9) of 10 μm KN-93 were prepared. Immunoprecipitation (I.P.) was done with normal rabbit IgG (lanes 4–6) or anti-Homer3 IgG (lanes 7–9). Immunoprecipitates were analyzed by Western blotting (W.B.) with the indicated antibodies. Arrow indicates Homer3 and arrowhead indicates IgG.
Homer3 phosphorylation affected the interaction between Homer3 and mGluR1α in Purkinje cells, but, as stated above, all three sites of Homer3 phosphorylation by CaMKII were mapped outside the EVH1 domain, which is the domain through which Homer3 binds to mGluR1α. To determine whether phosphorylation simply reduced the affinity of Homer3 for mGluR1α, we investigated the effect of Homer3 phosphorylation by CaMKII on the affinity of Homer3 for the Homer binding ligand biochemically. The minimum element of Homer binding ligands was characterized by proline-based motif, -PPxxF- (Beneken et al., 2000), and the binding between Homer3 and synthetic peptides derived from the C-terminal region of drebrin was investigated by means of a Biacore system. As shown in Figure 10A, in vitro phosphorylation of Homer3 by CaMKII proceeded rapidly from 0 to 10 min and reached a plateau at 1 h, at which time phosphate (Pi) incorporation into Homer3 was ∼1.6 mol/mol Homer3. The phosphorylation reaction was halted by adding an excess amount of EDTA at indicated time point, and the binding kinetics of Homer3 at each indicated was examined by using the ligand peptides immobilized on a sensor chip. As shown in Figure 10B, the affinity of wild-type Homer3 (Homer3 wild) for the ligand decreased with the duration of the phosphorylation reaction, whereas the affinity of the Homer3 triple mutant (Homer3 S120A/S159A/S176A, AAA) was not significantly reduced even after allowing the phosphorylation reaction to proceed for 1 h. Inversely, the phosphor-mimetic triple mutant (Homer3 S120D/S159D/S176D, DDD) showed a great reduction in affinity (supplemental Fig. S3, available at www.jneurosci.org as supplemental material). We also attempted to identify which of the three Ser phosphorylation(s) contributed to the reduction in affinity. A binding kinetics analysis for two different target molecules, drebrin peptide and the C-terminal region of mGluR1α fused with GST, by mutant Homer3 proteins carrying a single mutation, S120A, S159A, or S176A, revealed only a small reduction in the affinity of S120A mutant after phosphorylation reaction (Fig. 10C; (supplemental Fig. S3, available at www.jneurosci.org as supplemental material) and a much larger decrease in affinity of other two mutants S159A and S176A (Fig. 10C; supplemental Fig. S3, available at www.jneurosci.org as supplemental material). Inversely, among three phosphormimetic mutants, S120D, S159D, and S176D, S120D showed the lowest affinity for both target molecules, suggesting that Ser120 phosphorylation is the main contributor to the phosphorylation-induced reduction in affinity, although the Ser159 and Ser176 phosphorylations also contribute to some extent. Ser120 was conserved among the Homer family of proteins (supplemental Fig. S2A, available at www.jneurosci.org as supplemental material). We therefore investigated whether Homer1c was also phosphorylated by CaMKII and whether the phosphorylation induced the reduction in affinity. In vitro phosphorylation assay clearly revealed that CaMKII phosphorylated Ser117 residue of Homer1c (an equivalent residue to Ser120 of Homer3) (supplemental Fig. S2B,C, available at www.jneurosci.org as supplemental material), and the phosphorylation induced the reduction in affinity for drebrin peptide and the C-terminal region of mGluR1α fused with GST (supplemental Fig. S2D, available at www.jneurosci.org as supplemental material). These results indicated that the phosphorylation by CaMKII reduced the affinity of Homer3 for its ligand, suggesting that the phosphorylation via the P/Q–Ca2+-channel/Ca2+/CaMKII pathway was involved in the mechanism of dissociation of Homer3 from mGluR1α and/or PSD observed in the dendritic spines of Purkinje cells in vivo.
Figure 10.
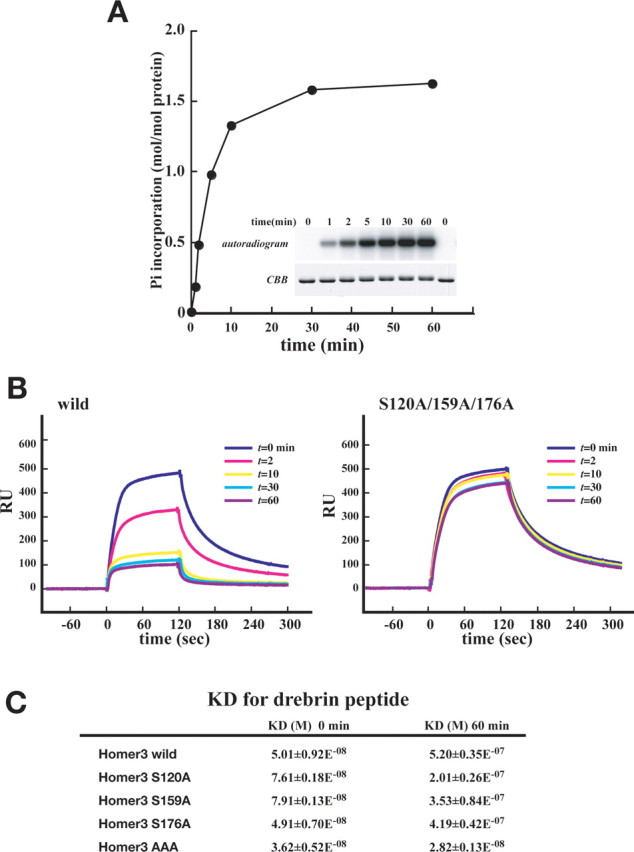
In vitro phosphorylation of Homer3 by CaMKII reduced the affinity for Homer ligand. A, Recombinant Homer3 protein purified from E. coli was in vitro phosphorylated by CaMKII, and a time course of phosphate incorporation was determined. B, Recombinant Homer3 protein (wild-type or S120A/S159A/S176A mutant) was in vitro phosphorylated by CaMKII. The reaction was halted at the indicated time point by adding EDTA. Each sample was diluted and analyzed by Biacore, on a sensor chip of which a Homer ligand peptide derived from drebrin was coupled. C, Dissociation constants (means ± SE) for each Homer3 protein that was phosphorylated by CaMKII for the indicated time period (0 or 60 min) for drebrin peptide were shown. RU, Resonance units.
Homer proteins are thought to couple mGluR1α to IP3R1 at postsynaptic sites in Purkinje cells both physically and functionally (Tu et al., 1998). Because Homer3 phosphorylation reduced the affinity of Homer3 for its ligands, phosphorylation of Homer3 may play a regulatory role in the mGluR1α–IP3R1-mediated calcium signaling pathway. To investigate this possibility, we adopted a heterologous system, HeLa cells, which express IP3R1 (Hattori et al., 2004), because Purkinje cells strongly express Homer3. HeLa cells transfected with myc- and EGFP-tagged mGluR1α solely or together with the wild type, a triple Ala mutant (S120A/S159A/S176A, AAA) Homer3, or a triple Asp mutant (S120D/S159D/S176D, DDD) Homer3 were analyzed for glutamate-induced calcium signaling. Because 1 μm glutamate was around threshold level in this system, we sequentially applied 1 and 10 μm glutamate to the cells and observed the [Ca2+]i signaling. At 1 μm glutamate, [Ca2+]i mobilization observed in each cell were all transient patterns as shown in Figure 11C, but significant difference in sensitivity for glutamate was observed between the cells expressing mGluR1α alone and coexpressing mGluR1α and wild-type Homer3 or S120A/S159A/S176A. More than 50% of cells (57.6% of cells; n = 4, total of 33 cells) expressing mGluR1α alone responded to 1 μm glutamate and showed transient [Ca2+]i elevation (Fig. 11A), but only 17.9 and 29.8% of the cells coexpressing mGluR1α and wild-type Homer3 (n = 4, total of 39 cells) and mGluR1α and S120A/S159A/S176A (n = 6, total of 84 cells) responded, respectively. The cells coexpressing mGluR1α with the phosphor-mimetic mutant S120D/S159D/S176D showed a similar sensitivity (56.3% of cells responding; n = 4, total of 32 cells) to those expressing mGluR1α alone (Fig. 11A). These phenomena can be a reflection of the reduced surface expression of mGluR1α induced by Homer protein coexpression, which were reported previously (Roche et al., 1999; Abe et al., 2003). A phosphor-mimetic mutant, S120D/S159D/S176D, which showed very reduced affinity for mGluR1α as determined by Biacore analysis (supplemental Fig. S3, available at www.jneurosci.org as supplemental material), may not retain mGluR1α intracellularly, resulting in sufficient surface expression of mGluR1α and the comparable sensitivity to mGluR1α alone. As shown in Fig. 11C, 10 μm glutamate induced three [Ca2+]i elevation patterns: transient, persistent, and oscillatory in the cells expressing mGluR1α. Interestingly, the [Ca2+]i signaling patterns were remarkably different in the cells expressing S120A/S159A/S176A mutant (Fig. 11B, AAA). In S120A/S159A/S176A mutant expressing cells, the proportion of cells exhibiting the persistent [Ca2+]i patterns was much higher than the proportion exhibiting oscillatory patterns (15.5 ± 6.1% oscillatory cells and 41.7 ± 4.3% persistent cells) (Fig. 11B). The cells expressing wild-type Homer3-expressing cells exhibited a similar proportions of [Ca2+]i patterns compared with the cells expressing mGluR1α alone (Fig. 11B) (wild type: 19.7 ± 6.1% oscillatory cells and 27.9 ± 4.3% persistent cells, n = 4 total 61 cells; alone: 15.5 ± 5.1% oscillatory cells and 25.9 ± 4.9% persistent cells, n = 4 total 58 cells). The cells expressing the phosphor-mimetic mutant S120D/S159D/S176D did not show a remarkable difference in the proportions of [Ca2+]i patterns compared with the cells expressing mGluR1α alone (Fig. 11B, DDD), which was consistent with that the mutant showed a very low affinity for its ligand and affected little on a link between mGluR1α and IP3R1. It was noteworthy that phosphorylation at all three Ser residues in wild-type Homer3 were observed even before exposure to 10 μm glutamate, when Homer3 was coexpressed with mGluR1α (data not shown). After 2 min exposure to 10 μm glutamate, a slight increase of phosphorylation level only at Ser120 was observed (data not shown). These findings suggest that phosphorylation of Homer3 regulates the [Ca2+]i signaling pattern by affecting a Homer3-mediated coupling state between mGluR1α and IP3R1.
Figure 11.

Homer3 phosphorylation modulated the glutamate-induced Ca2+ release in heterologous cells. A–C, HeLa cells expressed with mGluR1α alone or with wild-type Homer3 (WT), S120A/S159A/S176A mutant (AAA), or S120D/S159D/S176D mutant (DDD) and loaded with fura-2. [Ca2+]i signaling induced by glutamate was examined on sensitivity at 1 μm glutamate (A) and on the [Ca2+]i signaling pattern induced at 10 μm glutamate (B, C).
Discussion
Homer3 is a bona fide substrate for CaMKII
Homer3 was phosphorylated at multiple sites in Purkinje cells (Fig. 1) (supplemental Fig. S1, available at www.jneurosci.org as supplemental material). CaMKII, in vitro, phosphorylated Homer3 at three Ser residues, Ser120, Ser159, and Ser176, all of which were indeed phosphorylated in Purkinje cells in vivo, demonstrated by the use of phosphor-specific antibodies (Figs. 5, 6). Although we have no direct evidences, such as determinations of the phosphorylation state of each Ser residue in a mutant mouse lacking CaMKIIα and/or CaMKIIβ, both of which are reported to be abundantly expressed in cerebellar Purkinje cells (Walaas et al., 1988; Hansel et al., 2006), phosphorylation at these three sites, especially at Ser120 and Ser159, were likely conducted by CaMKII in vivo for the following reasons. First, the amino acid sequences flanking the phosphorylated Ser residues were almost optimal to sequences for CaMKII recognition, i.e., Hyd-X-Arg-NB-X-Ser*/Thr*-Hyd, where the asterisk represents a Ser/Thr capable of being phosphorylated, Hyd is a hydrophobic amino acid residue, X is any, and NB is a nonbasic amino acid residue (White et al., 1998). Second, the phosphorylations of Ser120 and Ser159 induced by depolarization in primary cultured Purkinje cells were significantly inhibited by preincubation with 10 μm KN-93, a CaMKII inhibitor (Sumi et al., 1991; Takao et al., 2005). However, because KN-93 has been reported to inhibit all three multifunctional CaMKs (CaMKI, CaMKII, and CaMKIV) in vitro with similar efficacy (Hidaka and Yokokura, 1996; Hook and Means, 2001) and all these prefer a similar recognition motif as a substrate (White et al., 1998), whether other CaMKs expressed in Purkinje cells phosphorylate Homer3 remains to be elucidated. Third, in P/Q–type Ca2+-channel knock-out mouse, CaMKIIα autophosphorylation at Thr286, which represents the activated state (Griffith, 2004), was drastically reduced, and there was a parallel reduction in phosphorylation at all three Ser sites in Homer3. These three Ser residues, as well as their flanking sequences, are well conserved in Homer3 orthologs (Fig. 3), suggesting the functional importance of CaMKII phosphorylation at these sites across species, and Ser120 in particular is also conserved in other Homer family proteins. Ser120 phosphorylation is a major determinant for affinity (supplemental Fig. S3, available at www.jneurosci.org as supplemental material) and Ser117 in Homer1c, an equivalent site to Ser120 in Homer3, was indeed phosphorylated by CaMKII in vitro (Yoshimura et al., 2002) (supplemental Fig. S2, available at www.jneurosci.org as supplemental material). Furthermore, phosphorylation of Ser117 in Homer1 induced the reduction in affinity of Homer1c for its target molecules (supplemental Fig. S2D, available at www.jneurosci.org as supplemental material), suggesting that CaMKII phosphorylation of Homer family proteins may be a common process in the CNS.
Phosphorylation of Homer3 reduces its affinity for its target molecules
The results of a surface plasmon resonance-based binding kinetics analysis clearly indicated that phosphorylation of Homer3 by CaMKII decreased its affinity for its binding molecules (Fig. 10; supplemental Fig. S3, available at www.jneurosci.org as supplemental material). This is no doubt a crucial event in the mechanism of dissociation of Homer3 from PSD and mGluR1α, but a couple of questions remain unanswered. How does the phosphorylation at the linker region of the Homer protein reduce its affinity for its targets? Is the phosphorylation-induced reduction in affinity sufficient for the Homer3 dissociation in vivo? A recent report by Hayashi et al. (2006) demonstrated that tetramer formation of Homer protein is necessary for both coclustering with its ligand and synaptic targeting. Thus, one possibility is that phosphorylation at the linker region of Homer3 induces a conformational change that results in breaking up of the tetramer. However, our preliminary size-exclusion column chromatography experiment showed no significant difference in elution profiles between phosphorylated and nonphosphorylated Homer3 (A. Mizutani, unpublished data), suggesting that this possibility is unlikely. In regard to the dissociation from mGluR1α, Xu et al. (2007) showed that mGluR1α is cleaved by calpain upstream of its Homer-biding site, suggesting that the cleavage may be involved in the dissociation. However, we did not find any significant loss of mGluR1α amount in high-potassium-treated cells (Fig. 9), and the dissociation was inhibited in the presence of a CaMKII inhibitor (Fig. 9). These results suggest that the calpain-mediated cleavage of mGluR1α is unlikely to be involved in the dissociation of Homer3 from mGluR1α that we observed. The only way to directly determine whether Homer3 phosphorylation by CaMKII is sufficient for dissociation from PSD and mGluR1α in in vivo would seem to be to produce and analyze a knock-in mouse that carries a triple mutant, S120A/S159/S176A.
Homer3 phosphorylation modulates the mGluR1α–IP3R1-mediated calcium signaling pattern
The results of a Ca2+ imaging analysis in a heterologous expression system indicated that the phosphorylation-dependent uncoupling between mGluR1α and IP3R1 was, in part, involved in formation of the [Ca2+]i signaling pattern (Fig. 11). Only a slight difference in [Ca2+]i signaling pattern was observed between the cells expressing mGluR1α alone and expressing mGluR1α with wild-type Homer3. There are no clear explanations for it, but only a very small increase of phosphorylation of Ser120 after exposure to 10 μm glutamate was observed (data not shown), which can in part explain the reason why only subtle effects of coexpression of wild-type Homer3 on the [Ca2+]i signaling pattern was observed. In contrast, a triple mutant, the cells expressing S120A/S159/S176A, showed a distinct patterns of glutamate-induced [Ca2+]i signaling that was characteristic in persistent [Ca2+]i elevation. The precise mechanism of the contribution of the phosphorylation of Homer3 to [Ca2+]i signaling pattern remains to be elucidated. One possible mechanism is that Homer3 was phosphorylated by CaMKII, as reported in HeLa cells (Takeda et al., 2004), and was activated by glutamate stimuli, resulting in attenuation of the physical and functional coupling between mGluR1α and IP3R. Because, in general, the phosphorylation state is dynamically regulated by a balance between kinase activity and phosphatase activity, the physical coupling between mGluR1α and IP3R1 maybe dynamically regulated via Homer3 phosphorylation state, which partly reflects the dynamic [Ca2+]i signal pattern such as Ca2+ oscillation.
Possible physiological roles of Homer3 phosphorylation
The inducible short form of Homer1, Homer1a, is postulated to function as an intrinsic dominant negative by uncoupling between Homer-mediated target molecules (Kammermeier and Worley, 2007). In the present study, we demonstrated another mechanism for uncoupling of Homer target molecules by phosphorylation. Because phosphorylation of Homer3 is induced within 2 min after depolarization whereas induction of Homer1a is triggered 1 h after synaptic activity (Brakeman et al., 1997; Kato et al., 1998), we propose two modes of uncoupling of Homer-mediated complexes that are distinct both from a mechanistic stand point (protein modification vs gene expression) and in this timing (minutes vs hours): an “early-phase” mode in which uncoupling is achieved by phosphorylation-dependent affinity regulation, and a “late-phase” in which uncoupling is achieved by a dominant-negative effect regulated by de novo gene expression (Fig. 12). Recently, Minami et al. (2003) reported that induction of Homer1a in Purkinje cells 1 h after depolarization promoted the surface expression of mGluR1α. However, in view of the abundant expression of Homer3 in Purkinje cells (supplemental Fig. S1, available at www.jneurosci.org as supplemental material), the Homer1a induced alone does not seem sufficient for uncoupling of the target molecules. If Homer1a functions in a stoichiometric manner, Homer3 phosphorylation may be a prerequisite for a dominant-negative effect of the relatively small amount of Homer1a induced. In other words, coordination between the two uncoupling mechanisms may guarantee the occurrence of uncoupling at specific sites of synaptic input.
Figure 12.

Proposed model of physiological function of Homer3 phosphorylation in Purkinje cells. Homer3 phosphorylation by CaMKII occurs within 2 min in response to synaptic activity, which regulates Homer3-mediated molecular coupling such as mGluR1α–IP3R1 in Purkinje cells spine, designated as “early-phase uncoupling,” contrasting with Homer1a-mediated uncoupling, which requires de novo gene expression and takes 1–4 h, “late-phase uncoupling.” Additionally, when Homer3 is phosphorylated by CaMKII at the spine, Homer3 translocates from spine to dendrites, which can function as a signal transmitter from activated synapse. ER, Endoplasmic reticulum.
What is the physiological function of Homer3 phosphorylation in Purkinje cells? Jin et al. (2007) reported recently a long-term depression of mGluR1α signaling, which was found to be expressed postsynaptically and requires a depolarization-induced Ca2+ influx (Jin et al., 2007). Because Homer3 phosphorylation is also induced by Ca2+ influx, the phosphorylation-dependent uncoupling of mGluR1α and IP3R1 may contribute to the mGluR1α LTD mechanism. In addition, many other binding partners of Homer3 have been reported in Purkinje cells, including Shank protein, which is postulated to be a core framework in the postsynaptic density (Naisbitt et al., 1999; Baron et al., 2006). The phosphorylation of Homer3 is more prominent in juvenile (P14–P21) mice, in which Purkinje cells undergo active synaptogenesis with parallel fibers (Kurihara et al., 1997). Thus, Homer3 phosphorylation may be involved in regulation in remodeling of the postsynaptic molecular architectures in response to synaptic activity.
Finally, immunohistochemical studies revealed preferential distribution of phosphorylated Homer3 in the soma and proximal dendrites (Fig. 6), which suggests that, if Homer3 is phosphorylated postsynaptically in response to synaptic activity, it can translocate from these spines to the dendrites. Thus, there is an intriguing possibility that phosphorylated Homer3 can function as a signal transmitter from activated spines (Fig. 12). To explore this possibility, it will be important to search for phosphorylated Homer3-specific binding partners in Purkinje cells.
Footnotes
This work was supported by grants from the Ministry of Education, Science, and Culture of Japan, and the Japan Science and Technology Agency. We thank S. Nakanishi, H. Yamamoto, Y. Watanabe, Y. Goto, E. Manser, and T. Ohshima for kindly providing the rat mGluR1α cDNA, rat constitutively active CaMKIIα cDNA, recombinant Sf9 virus carrying rat CaMKIIα cDNA, Xenopus constitutively active MEK and Xenopus MAPK cDNAs, constitutively active human PAK cDNA, and mouse p35 and CDK5 cDNAs, respectively. We also thank A. Yamasaki, M. Iwai, and N. Ogawa for excellent technical assistance and K. Otsuki and M. Usui, members of the Research Resource Center of Brain Science Institute, for excellent LC-MS/MS analysis.
References
- Abe H, Misaka T, Tateyama M, Kubo Y. Effects of coexpression with Homer isoforms on the function of metabotropic glutamate receptor 1alpha. Mol Cell Neurosci. 2003;23:157–168. doi: 10.1016/s1044-7431(03)00052-6. [DOI] [PubMed] [Google Scholar]
- Ahn S, Ginty DD, Linden DJ. A late phase of cerebellar long-term depression requires activation of CaMKIV and CREB. Neuron. 1999;23:559–568. doi: 10.1016/s0896-6273(00)80808-9. [DOI] [PubMed] [Google Scholar]
- Aiba A, Kano M, Chen C, Stanton ME, Fox GD, Herrup K, Zwingman TA, Tonegawa S. Deficient cerebellar long-term depression and impaired motor learning in mGluR1 mutant mice. Cell. 1994;79:377–388. [PubMed] [Google Scholar]
- Ando H, Mizutani A, Kiefer H, Tsuzurugi D, Michikawa T, Mikoshiba K. IRBIT suppresses IP3 receptor activity by competing with IP3 for the common binding site on the IP3 receptor. Mol Cell. 2006;22:795–806. doi: 10.1016/j.molcel.2006.05.017. [DOI] [PubMed] [Google Scholar]
- Baron MK, Boeckers TM, Vaida B, Faham S, Gingery M, Sawaya MR, Salyer D, Gundelfinger ED, Bowie JU. An architectural framework that may lie at the core of the postsynaptic density. Science. 2006;311:531–535. doi: 10.1126/science.1118995. [DOI] [PubMed] [Google Scholar]
- Beneken J, Tu JC, Xiao B, Nuriya M, Yuan JP, Worley PF, Leahy DJ. Structure of the Homer EVH1 domain-peptide complex reveals a new twist in polyproline recognition. Neuron. 2000;26:143–154. doi: 10.1016/s0896-6273(00)81145-9. [DOI] [PubMed] [Google Scholar]
- Boyden ES, Katoh A, Raymond JL. Cerebellum-dependent learning: the role of multiple plasticity mechanisms. Annu Rev Neurosci. 2004;27:581–609. doi: 10.1146/annurev.neuro.27.070203.144238. [DOI] [PubMed] [Google Scholar]
- Brakeman PR, Lanahan AA, O'Brien R, Roche K, Barnes CA, Huganir RL, Worley PF. Homer: a protein that selectively binds metabotropic glutamate receptors. Nature. 1997;386:284–288. doi: 10.1038/386284a0. [DOI] [PubMed] [Google Scholar]
- Bryan B, Kumar V, Stafford LJ, Cai Y, Wu G, Liu M. GEFT, a Rho family guanine nucleotide exchange factor, regulates neurite outgrowth and dendritic spine formation. J Biol Chem. 2004;279:45824–45832. doi: 10.1074/jbc.M406216200. [DOI] [PubMed] [Google Scholar]
- Carlin RK, Grab DJ, Cohen RS, Siekevitz P. Isolation and characterization of postsynaptic densities from various brain regions: enrichment of different types of postsynaptic densities. J Cell Biol. 1980;86:831–845. doi: 10.1083/jcb.86.3.831. [DOI] [PMC free article] [PubMed] [Google Scholar]
- Finch EA, Augustine GJ. Local calcium signalling by inositol-1,4,5-trisphosphate in Purkinje cell dendrites. Nature. 1998;396:753–756. doi: 10.1038/25541. [DOI] [PubMed] [Google Scholar]
- Furuichi T, Yoshikawa S, Miyawaki A, Wada K, Maeda N, Mikoshiba K. Primary structure and functional expression of the inositol 1,4,5-trisphosphate-binding protein P400. Nature. 1989;342:32–38. doi: 10.1038/342032a0. [DOI] [PubMed] [Google Scholar]
- Griffith LC. Regulation of calcium/calmodulin-dependent protein kinase II activation by intramolecular and intermolecular interactions. J Neurosci. 2004;24:8394–8398. doi: 10.1523/JNEUROSCI.3604-04.2004. [DOI] [PMC free article] [PubMed] [Google Scholar]
- Hansel C, de Jeu M, Belmeguenai A, Houtman SH, Buitendijk GH, Andreev D, De Zeeuw CI, Elgersma Y. alphaCaMKII Is essential for cerebellar LTD and motor learning. Neuron. 2006;51:835–843. doi: 10.1016/j.neuron.2006.08.013. [DOI] [PubMed] [Google Scholar]
- Hartell NA. Parallel fiber plasticity. Cerebellum. 2002;1:3–18. doi: 10.1080/147342202753203041. [DOI] [PubMed] [Google Scholar]
- Hartmann J, Konnerth A. Determinants of postsynaptic Ca2+ signaling in Purkinje neurons. Cell Calcium. 2005;37:459–466. doi: 10.1016/j.ceca.2005.01.014. [DOI] [PubMed] [Google Scholar]
- Hattori M, Suzuki AZ, Higo T, Miyauchi H, Michikawa T, Nakamura T, Inoue T, Mikoshiba K. Distinct roles of inositol 1,4,5-trisphosphate receptor types 1 and 3 in Ca2+ signaling. J Biol Chem. 2004;279:11967–11975. doi: 10.1074/jbc.M311456200. [DOI] [PubMed] [Google Scholar]
- Hayashi MK, Ames HM, Hayashi Y. Tetrameric hub structure of postsynaptic scaffolding protein homer. J Neurosci. 2006;26:8492–8501. doi: 10.1523/JNEUROSCI.2731-06.2006. [DOI] [PMC free article] [PubMed] [Google Scholar]
- Hidaka H, Yokokura H. Molecular and cellular pharmacology of a calcium/calmodulin-dependent protein kinase II (CaM kinase II) inhibitor, KN-62, and proposal of CaM kinase phosphorylation cascades. Adv Pharmacol. 1996;36:193–219. doi: 10.1016/s1054-3589(08)60583-9. [DOI] [PubMed] [Google Scholar]
- Hirono M, Sugiyama T, Kishimoto Y, Sakai I, Miyazawa T, Kishio M, Inoue H, Nakao K, Ikeda M, Kawahara S, Kirino Y, Katsuki M, Horie H, Ishikawa Y, Yoshioka T. Phospholipase Cbeta4 and protein kinase Calpha and/or protein kinase CbetaI are involved in the induction of long term depression in cerebellar Purkinje cells. J Biol Chem. 2001;276:45236–45242. doi: 10.1074/jbc.M105413200. [DOI] [PubMed] [Google Scholar]
- Hook SS, Means AR. Ca2+/CaM-dependent kinases: from activation to function. Annu Rev Pharmacol Toxicol. 2001;41:471–505. doi: 10.1146/annurev.pharmtox.41.1.471. [DOI] [PubMed] [Google Scholar]
- Huttner WB, Schiebler W, Greengard P, De Camilli P. Synapsin I (protein I), a nerve terminal-specific phosphoprotein. III. Its association with synaptic vesicles studied in a highly purified synaptic vesicle preparation. J Cell Biol. 1983;96:1374–1388. doi: 10.1083/jcb.96.5.1374. [DOI] [PMC free article] [PubMed] [Google Scholar]
- Inoue T, Kato K, Kohda K, Mikoshiba K. Type 1 inositol 1,4,5-trisphosphate receptor is required for induction of long-term depression in cerebellar Purkinje neurons. J Neurosci. 1998;18:5366–5373. doi: 10.1523/JNEUROSCI.18-14-05366.1998. [DOI] [PMC free article] [PubMed] [Google Scholar]
- Ito M. Cerebellar long-term depression: characterization, signal transduction, and functional roles. Physiol Rev. 2001;81:1143–1195. doi: 10.1152/physrev.2001.81.3.1143. [DOI] [PubMed] [Google Scholar]
- Jin Y, Kim SJ, Kim J, Worley PF, Linden DJ. Long-term depression of mGluR1 signaling. Neuron. 2007;55:277–287. doi: 10.1016/j.neuron.2007.06.035. [DOI] [PMC free article] [PubMed] [Google Scholar]
- Kammermeier PJ, Worley PF. Homer 1a uncouples metabotropic glutamate receptor 5 from postsynaptic effectors. Proc Natl Acad Sci USA. 2007;104:6055–6060. doi: 10.1073/pnas.0608991104. [DOI] [PMC free article] [PubMed] [Google Scholar]
- Kato A, Ozawa F, Saitoh Y, Fukazawa Y, Sugiyama H, Inokuchi K. Novel members of the Vesl/Homer family of PDZ proteins that bind metabotropic glutamate receptors. J Biol Chem. 1998;273:23969–23975. doi: 10.1074/jbc.273.37.23969. [DOI] [PubMed] [Google Scholar]
- Kawasaki H, Fujii H, Gotoh Y, Morooka T, Shimohama S, Nishida E, Hirano T. Requirement for mitogen-activated protein kinase in cerebellar long term depression. J Biol Chem. 1999;274:13498–13502. doi: 10.1074/jbc.274.19.13498. [DOI] [PubMed] [Google Scholar]
- Kulik A, Nakadate K, Hagiwara A, Fukazawa Y, Lujan R, Saito H, Suzuki N, Futatsugi A, Mikoshiba K, Frotscher M, Shigemoto R. Immunocytochemical localization of the alpha 1A subunit of the P/Q-type calcium channel in the rat cerebellum. Eur J Neurosci. 2004;19:2169–2178. doi: 10.1111/j.0953-816X.2004.03319.x. [DOI] [PubMed] [Google Scholar]
- Kurihara H, Hashimoto K, Kano M, Takayama C, Sakimura K, Mishina M, Inoue Y, Watanabe M. Impaired parallel fiber→Purkinje cell synapse stabilization during cerebellar development of mutant mice lacking the glutamate receptor δ2 subunit. J Neurosci. 1997;17:9613–9623. doi: 10.1523/JNEUROSCI.17-24-09613.1997. [DOI] [PMC free article] [PubMed] [Google Scholar]
- Manabe T, Visvikis S, Steinmetz J, Galteau MM, Okuyama T, Siest G. Systematic analysis of serum lipoproteins and apolipoproteins by a combined technique of micro two-dimensional electrophoresis. Electrophoresis. 1987;8:325–330. [Google Scholar]
- Matsumoto M, Nakagawa T, Inoue T, Nagata E, Tanaka K, Takano H, Minowa O, Kuno J, Sakakibara S, Yamada M, Yoneshima H, Miyawaki A, Fukuuchi Y, Furuichi T, Okano H, Mikoshiba K, Noda T. Ataxia and epileptic seizures in mice lacking type 1 inositol 1,4,5-trisphosphate receptor. Nature. 1996;379:168–171. doi: 10.1038/379168a0. [DOI] [PubMed] [Google Scholar]
- Minami I, Kengaku M, Smitt PS, Shigemoto R, Hirano T. Long-term potentiation of mGluR1 activity by depolarization-induced Homer1a in mouse cerebellar Purkinje neurons. Eur J Neurosci. 2003;17:1023–1032. doi: 10.1046/j.1460-9568.2003.02499.x. [DOI] [PubMed] [Google Scholar]
- Naisbitt S, Kim E, Tu JC, Xiao B, Sala C, Valtschanoff J, Weinberg RJ, Worley PF, Sheng M. Shank, a novel family of postsynaptic density proteins that binds to the NMDA receptor/PSD-95/GKAP complex and cortactin. Neuron. 1999;23:569–582. doi: 10.1016/s0896-6273(00)80809-0. [DOI] [PubMed] [Google Scholar]
- Ohshima T, Gilmore EC, Longenecker G, Jacobowitz DM, Brady RO, Herrup K, Kulkarni AB. Migration defects of cdk5−/− neurons in the developing cerebellum is cell autonomous. J Neurosci. 1999;19:6017–6026. doi: 10.1523/JNEUROSCI.19-14-06017.1999. [DOI] [PMC free article] [PubMed] [Google Scholar]
- Petralia RS, Wang YX, Singh S, Wu C, Shi L, Wei J, Wenthold RJ. A monoclonal antibody shows discrete cellular and subcellular localizations of mGluR1 alpha metabotropic glutamate receptors. J Chem Neuroanat. 1997;13:77–93. doi: 10.1016/s0891-0618(97)00023-9. [DOI] [PubMed] [Google Scholar]
- Roche KW, Tu JC, Petralia RS, Xiao B, Wenthold RJ, Worley PF. Homer 1b regulates the trafficking of group I metabotropic glutamate receptors. J Biol Chem. 1999;274:25953–25957. doi: 10.1074/jbc.274.36.25953. [DOI] [PubMed] [Google Scholar]
- Safo PK, Cravatt BF, Regehr WG. Retrograde endocannabinoid signaling in the cerebellar cortex. Cerebellum. 2006;5:134–145. doi: 10.1080/14734220600791477. [DOI] [PubMed] [Google Scholar]
- Shigemoto R, Nakanishi S, Mizuno N. Distribution of the mRNA for a metabotropic glutamate receptor (mGluR1) in the central nervous system: an in situ hybridization study in adult and developing rat. J Comp Neurol. 1992;322:121–135. doi: 10.1002/cne.903220110. [DOI] [PubMed] [Google Scholar]
- Shiraishi Y, Mizutani A, Bito H, Fujisawa K, Narumiya S, Mikoshiba K, Furuichi T. Cupidin, an isoform of Homer/Vesl, interacts with the actin cytoskeleton and activated rho family small GTPases and is expressed in developing mouse cerebellar granule cells. J Neurosci. 1999;19:8389–8400. doi: 10.1523/JNEUROSCI.19-19-08389.1999. [DOI] [PMC free article] [PubMed] [Google Scholar]
- Shiraishi Y, Mizutani A, Mikoshiba K, Furuichi T. Coincidence in dendritic clustering and synaptic targeting of homer proteins and NMDA receptor complex proteins NR2B and PSD95 during development of cultured hippocampal neurons. Mol Cell Neurosci. 2003a;22:188–201. doi: 10.1016/s1044-7431(03)00037-x. [DOI] [PubMed] [Google Scholar]
- Shiraishi Y, Mizutani A, Yuasa S, Mikoshiba K, Furuichi T. Glutamate-induced declustering of post-synaptic adaptor protein Cupidin (Homer 2/vesl-2) in cultured cerebellar granule cells. J Neurochem. 2003b;87:364–376. doi: 10.1046/j.1471-4159.2003.02003.x. [DOI] [PubMed] [Google Scholar]
- Shiraishi Y, Mizutani A, Yuasa S, Mikoshiba K, Furuichi T. Differential expression of Homer family proteins in the developing mouse brain. J Comp Neurol. 2004;473:582–599. doi: 10.1002/cne.20116. [DOI] [PubMed] [Google Scholar]
- Shiraishi-Yamaguchi Y, Furuichi T. The Homer family proteins. Genome Biol. 2007;8:206. doi: 10.1186/gb-2007-8-2-206. [DOI] [PMC free article] [PubMed] [Google Scholar]
- Sumi M, Kiuchi K, Ishikawa T, Ishii A, Hagiwara M, Nagatsu T, Hidaka H. The newly synthesized selective Ca2+/calmodulin dependent protein kinase II inhibitor KN-93 reduces dopamine contents in PC12h cells. Biochem Biophys Res Commun. 1991;181:968–975. doi: 10.1016/0006-291x(91)92031-e. [DOI] [PubMed] [Google Scholar]
- Takao K, Okamoto K, Nakagawa T, Neve RL, Nagai T, Miyawaki A, Hashikawa T, Kobayashi S, Hayashi Y. Visualization of synaptic Ca2+/calmodulin-dependent protein kinase II activity in living neurons. J Neurosci. 2005;25:3107–3112. doi: 10.1523/JNEUROSCI.0085-05.2005. [DOI] [PMC free article] [PubMed] [Google Scholar]
- Takeda K, Matsuzawa A, Nishitoh H, Tobiume K, Kishida S, Ninomiya-Tsuji J, Matsumoto K, Ichijo H. Involvement of ASK1 in Ca2+-induced p38 MAP kinase activation. EMBO Rep. 2004;5:161–166. doi: 10.1038/sj.embor.7400072. [DOI] [PMC free article] [PubMed] [Google Scholar]
- Tu JC, Xiao B, Yuan JP, Lanahan AA, Leoffert K, Li M, Linden DJ, Worley PF. Homer binds a novel proline-rich motif and links group 1 metabotropic glutamate receptors with IP3 receptors. Neuron. 1998;21:717–726. doi: 10.1016/s0896-6273(00)80589-9. [DOI] [PubMed] [Google Scholar]
- Tu JC, Xiao B, Naisbitt S, Yuan JP, Petralia RS, Brakeman P, Doan A, Aakalu VK, Lanahan AA, Sheng M, Worley PF. Coupling of mGluR/Homer and PSD-95 complexes by the Shank family of postsynaptic density proteins. Neuron. 1999;23:583–592. doi: 10.1016/s0896-6273(00)80810-7. [DOI] [PubMed] [Google Scholar]
- Walaas SI, Lai Y, Gorelick FS, DeCamilli P, Moretti M, Greengard P. Cell-specific localization of the alpha-subunit of calcium/calmodulin-dependent protein kinase II in Purkinje cells in rodent cerebellum. Brain Res. 1988;464:233–242. doi: 10.1016/0169-328x(88)90029-0. [DOI] [PubMed] [Google Scholar]
- White RR, Kwon YG, Taing M, Lawrence DS, Edelman AM. Definition of optimal substrate recognition motifs of Ca2+-calmodulin-dependent protein kinases IV and II reveals shared and distinctive features. J Biol Chem. 1998;273:3166–3172. doi: 10.1074/jbc.273.6.3166. [DOI] [PubMed] [Google Scholar]
- Xiao B, Tu JC, Petralia RS, Yuan JP, Doan A, Breder CD, Ruggiero A, Lanahan AA, Wenthold RJ, Worley PF. Homer regulates the association of group 1 metabotropic glutamate receptors with multivalent complexes of homer-related, synaptic proteins. Neuron. 1998;21:707–716. doi: 10.1016/s0896-6273(00)80588-7. [DOI] [PubMed] [Google Scholar]
- Xiao B, Tu JC, Worley PF. Homer: a link between neural activity and glutamate receptor function. Curr Opin Neurobiol. 2000;10:370–374. doi: 10.1016/s0959-4388(00)00087-8. [DOI] [PubMed] [Google Scholar]
- Xu W, Wong TP, Chery N, Gaertner T, Wang YT, Baudry M. Calpain-mediated mGluR1alpha truncation: a key step in excitotoxicity. Neuron. 2007;53:399–412. doi: 10.1016/j.neuron.2006.12.020. [DOI] [PubMed] [Google Scholar]
- Yoshikawa F, Iwasaki H, Michikawa T, Furuichi T, Mikoshiba K. Trypsinized cerebellar inositol 1,4,5-trisphosphate receptor. Structural and functional coupling of cleaved ligand binding and channel domains. J Biol Chem. 1999;274:316–327. doi: 10.1074/jbc.274.1.316. [DOI] [PubMed] [Google Scholar]
- Yoshimura Y, Shinkawa T, Taoka M, Kobayashi K, Isobe T, Yamauchi T. Identification of protein substrates of Ca2+/calmodulin-dependent protein kinase II in the postsynaptic density by protein sequencing and mass spectrometry. Biochem Biophys Res Commun. 2002;290:948–954. doi: 10.1006/bbrc.2001.6320. [DOI] [PubMed] [Google Scholar]