

Abstract
The first synapse in olfaction undergoes considerable anatomical plasticity in both early postnatal development and adult neurogenesis, yet we know very little concerning its functional maturation at these times. Here, we used whole-cell recordings in olfactory bulb slices to describe olfactory nerve inputs to developing postnatal neurons and to maturing adult-born cells labeled with a GFP-encoding lentivirus. In both postnatal development and adult neurogenesis, the maturation of olfactory nerve synapses involved an increase in the relative contribution of AMPA over NMDA receptors, and a decrease in the contribution of NMDA receptors containing the NR2B subunit. These postsynaptic transformations, however, were not mirrored by presynaptic changes: in all cell groups, paired-pulse depression remained constant as olfactory nerve synapses matured. Although maturing cells may therefore offer, transiently, a functionally distinct connection for inputs from the nose, presynaptic function at the first olfactory connection remains remarkably constant in the face of considerable anatomical plasticity.
Keywords: development, adult neurogenesis, olfaction, olfactory bulb, synapse, periglomerular cells
Introduction
The first synapse in olfaction takes place between the axon terminals of olfactory sensory neurons (OSNs) and their postsynaptic targets (mitral cells, tufted cells, and periglomerular cells) in the olfactory bulb (OB). Anatomically, this is one of the most plastic synapses in the brain, with significant changes occurring not only during postnatal development, but also throughout adult life. Developmentally, OSN axons reach the brain early, by embryonic day 11 (E11)–E13 in mice (Royal and Key, 1999), and axons from OSNs expressing the same odorant receptor (OR) converge onto regions representing presumptive OB glomeruli by birth (Mombaerts et al., 1996). Their postsynaptic targets are also largely present at this stage, with mitral cells and external tufted cells (ETCs) all born prenatally, and periglomerular cell (PGC) production peaking in the first postnatal weeks (Bayer, 1983). However, OSN projections are by no means perfect at this stage: in many cases, axons from OSNs expressing the same OR converge onto two or more glomeruli in each half-OB (Zou et al., 2004). The process of refining OSN projections to their mature state of single glomerular convergence (Treloar et al., 1999) then proceeds over a rather extended postnatal period, with some glomerular projections only fully refined at approximately postnatal day 60 (P60) (Zou et al., 2004). Neuronal activity in OSNs, both spontaneous (Yu et al., 2004) and odor driven (Nakatani et al., 2003; Zou et al., 2004), is essential for this refinement to occur.
In adult life, the first synapse in olfaction is also subject to significant plasticity. Its presynaptic components, the OSNs, have a lifespan of ∼3 months, before undergoing cell death and replacement by new OSNs born from epithelial stem cells (Graziadei and Monti Graziadei, 1980). In addition, postsynaptic components at the OSN-to-OB synapse (PGCs) are also subject to adult neurogenesis (Luskin, 1993; Alvarez-Buylla and Garcia-Verdugo, 2002). As a result, adult-born but immature PGCs must form new connections with changing OSN axon terminals (Belluzzi et al., 2003), while integrating themselves into a resident mature glomerular network. This process, like the postsynaptic development of OSN projections, is also known to be activity dependent: naris occlusion (Mandairon et al., 2006), olfactory enrichment (Rochefort et al., 2002), and olfactory learning (Alonso et al., 2006) all affect the survival of adult-generated periglomerular neurons.
Despite such prolonged plasticity and the importance of the OSN-to-OB connection as a model for both developmental refinement and adult neurogenesis, surprisingly little is known about the synapse's functional maturation. Here we use whole-cell recordings in OB slices to show that the sequence of maturation for OSN-to-OB synapses is extremely similar in both postnatal development and adult neurogenesis, involving an increase in AMPA:NMDA ratio and a decrease in NR2B subunit contributions to NMDA responses. Presynaptically, however, no maturational changes are apparent in either development or adult neurogenesis: surprisingly, the characteristically high release probability at OSN terminals (Murphy et al., 2004) is already present as soon as functional synapses are formed.
Materials and Methods
Animals.
We used C57BL/6J@Rj mice (Centre d'Elevage Janvier, Le Genest Saint Isle, France) of either sex for all experiments. The day of birth was designated as P0. Mice were housed under a 12 h light/dark cycle, with dry food and water available ad libitum. All experiments used procedures approved by the European Communities Council Directive of 24 November 1986 (86/609/EEC) and European Union guidelines, and were reviewed and approved by our institutional Animal Welfare Committee.
Stereotaxic surgery.
For stereotaxic injections of GFP-expressing lentivirus, adult mice (P60) were anesthetized with a mixture of ketamine (Imalgene, Merial, France; 1.5% in PBS) and xylazine (Rompun; Bayer Health Care, France; 0.05%; 250 μl given per mouse, followed by top-ups of 50 μl as necessary to maintain complete absence of the paw-pinch reflex) and were mounted in a Kopf stereotaxic apparatus. After drilling small craniotomies above the injection sites, a fine-tipped glass pipette was filled from the tip with virus solution and inserted into the rostral migratory stream (RMS) at the following coordinates in each hemisphere: anteroposterior, +3.3 mm from bregma; mediolateral, ±0.82 mm from bregma; dorsoventral, −2.9 mm from pial surface. We injected 200 nl of virus solution in each hemisphere (Drummond Nanoject II; Drummond Scientific, Broomall, PA), cleaned wounds with 10% Betadine (Viatris, Mérignac, France), sutured the scalp, applied local anesthetic and scar-promoting cream (Dermaflon; Pfizer, Paris, France), and left animals to recover on a gently warmed hot plate. Injected mice were then housed individually until their use in electrophysiological experiments. Virus injections specifically labeled adult-born migrating neuroblasts, because subsequent inspection of OB slices revealed GFP expression in granule cells and periglomerular cells only, and because GFP-expressing (GFP+) cells at 3 and 7 d postinjection (dpi) were virtually all positive for the immature neuronal marker doublecortin (DCX) (P. Panzanelli, M. Sassoe-Pognetto, and P.-M. Lledo, unpublished data). Any diffusion from the injection site was therefore never sufficient to label resident OB cell populations.
Viral vector.
We used a PGK-GFP lentivirus with a titer of 2.2 × 10¹⁰ U/ml, stored at −80°C. For most experiments, the virus was diluted in PBS to obtain a final concentration of 15 ng of p24 protein/μl. To test for any adverse effects of viral transfection on our recorded cells, however, we also injected some mice with different viral concentrations, ranging from 10.5 to 52.5 ng of p24 protein/μl. Over all cells recorded in these animals, ranging from 14 to 32 dpi, we saw no significant correlation between virus strength and any of three sensitive measures of cell maturation (Tables 1, 2): membrane resistance (Rm; Spearman r = −0.13; p = 0.2; n = 97), membrane capacitance (Cm; Spearman r = 0.007; p = 0.95; n = 95), and peak Na+ current (Spearman r = −0.06; p = 0.58; n = 93). Use of a lentivirus was necessary to label enough newborn PGCs to make recording olfactory nerve (ON) inputs feasible, but did mean that adult-born neurons were labeled at any stage of the cell cycle. However, we minimized any resultant heterogeneity in cell age by performing virus injections in the RMS, far away from the major site of olfactory system stem cells in the subventricular zone (SVZ). That our injections labeled a specific time-limited cohort of newborn OB neurons is supported by two control experiments. First, whereas practically all GFP+ neurons in the OB were positive for the immature neuronal marker DCX at 3 and 7 dpi, by 21 dpi no GFP+ OB neurons were also positive for DCX (Panzanelli, Sassoe-Pognetto, and Lledo, unpublished data). Second, we reanalyzed our electrophysiological data using measures of cell maturity (Rm and peak Na+ current) that are more intrinsic to a given neuron than dpi. For every correlation of ON synaptic function with dpi, the same result in terms of significance was also found using either Rm or peak Na+ current, suggesting that particular dpi values do not encompass a wide range of real cell ages. In addition, a lentivirus has already been successfully used to describe the migration and morphological maturation of adult-born PGCs in vivo (Mizrahi, 2007). Finally, the very fact that in adult neurogenesis we observed large and significant maturational changes in many functional parameters (see Results) means that our approach was in fact rather resistant to cell age heterogeneity in adult-born neurons.
Table 1.
Maturation of intrinsic membrane properties and spontaneous input: development
| Cell type | Parameter | Rank correlation with postnatal day or dpi |
Group means ± SEM (n) |
||||
|---|---|---|---|---|---|---|---|
| r | p | n | Pw1 | Pw4 | Adult | ||
| ETC | Rm | −0.21 | 0.11 | 60 | 714 ± 78 MΩ (26) | 562 ± 53 MΩ (11) | |
| Cm | −0.20 | 0.12 | 59 | 29.1 ± 1.7 pF (26) | 21.8 ± 2.0 pF (10)* | ||
| Peak Na+ current | 0.33 | 0.01 | 59 | 96 ± 12 pA/pF (26) | 206 ± 38 pA/pF (10)* | ||
| sEPSC frequency | 0.20 | 0.14 | 57 | 0.81 ± 0.21 Hz (23) | 2.03 ± 0.80 Hz (11) | ||
| sEPSC amplitude | −0.32 | 0.02 | 53 | 17.4 ± 1.5 pA (22) | 12.8 ± 0.9 pA (10)* | ||
| sIPSC frequency | 0.57 | <0.0001 | 52 | 0.08 ± 0.04 Hz (19) | 0.86 ± 0.34 Hz (11)** | ||
| sIPSC amplitude | 0.38 | 0.03 | 33 | 10.0 ± 1.0 pA (6) | 13.6 ± 1.6 pA (9) | ||
| PGC | Rm | −0.27 | <0.0001 | 254 | 2526 ± 108 MΩ (106) | 2006 ± 107 MΩ (72)** | 1927 ± 169 MΩ (41)**, ns |
| Cm | −0.04 | 0.50 | 223 | 12.3 ± 0.4 pF (94) | 12.0 ± 0.6 pF (66) | 11.0 ± 10.6 pF (36) | |
| Peak Na+ current | 0.44 | <0.0001 | 218 | 85 ± 10 pA/pF (91) | 157 ± 14 pA/pF (64)*** | 188 ± 21 pA/pF (36)***, ns | |
| sEPSC frequency | 0.30 | <0.0001 | 220 | 0.14 ± 0.03 Hz (89) | 1.40 ± 0.32 Hz (59)*** | 1.11 ± 0.37 Hz (38) ns, * | |
| sEPSC amplitude | −0.35 | <0.0001 | 163 | 24.5 ± 2.0 pA (58) | 17.8 ± 1.0 pA (51) ns | 13.8 ± 1.0 pA (26)***, * | |
| sIPSC frequency | 0.51 | <0.0001 | 136 | 0.03 ± 0.02 Hz (40) | 0.36 ± 0.12 Hz (34)*** | 0.87 ± 0.34 Hz (30)***, ns | |
| sIPSC amplitude | 0.20 | 0.08 | 81 | 18.6 ± 5.1 pA (9) | 14.4 ± 1.3 pA (26) | 18.4 ± 2.3 pA (26) | |
Values in bold come from significant correlations or group comparisons (p < 0.05). For two-sample group comparisons (t test or Mann–Whitney test, depending on sample normality), the significance level is displayed at the end of the Pw4 column. For three-sample group comparisons, bold values indicate a significant overall difference between groups in a parametric or nonparametric ANOVA (depending on sample normality). The results of post hoc comparisons between groups are then shown at the end of the Pw4 and Adult columns. The Pw4 column contains the result of a comparison between the Pw1 and Pw4 columns, whereas the Adult column shows the results of comparisons between the Pw1 and Adult columns and between the Pw4 and Adult columns, in that order. *p < 0.05; **p < 0.01; ***p < 0.001; ns, nonsignificant.
Table 2.
Maturation of intrinsic membrane properties and spontaneous input: adult neurogenesis
| Cell type | Parameter | Rank correlation with postnatal day or dpi |
Group means ± SEM (n) |
||||
|---|---|---|---|---|---|---|---|
| r | p | n | 7-14 dpi | 45 dpi | 90 dpi | ||
| GFP+ | Rm | −0.35 | <0.0001 | 226 | 2148 ± 140 MΩ (92) | 1293 ± 145 MΩ (47)*** | 1385 ± 340 MΩ (15)**, ns |
| Cm | 0.18 | 0.007 | 226 | 13.7 ± 0.6 pF (93) | 16.0 ± 0.8 pF (47)* | 17.0 ± 1.4 pF (15) ns, ns | |
| Peak Na+ current | 0.40 | <0.0001 | 224 | 106 ± 10 pA/pF (93) | 178 ± 16 pA/pF (47)*** | 231 ± 21 pA/pF (15)***, ns | |
| sEPSC frequency | 0.25 | 0.0002 | 212 | 1.11 ± 0.24 Hz (87) | 1.88 ± 0.47 Hz (41)* | 0.97 ± 0.18 (14) ns, ns | |
| sEPSC amplitude | −0.13 | 0.12 | 149 | 15.9 ± 0.9 pA (63) | 16.1 ± 1.4 pA (35) ns | 12.5 ± 1.1 pA (13)*, * | |
| sIPSC frequency | 0.17 | 0.03 | 136 | 0.19 ± 0.06 Hz (40) | 0.61 ± 0.22 Hz (16) | 0.13 ± 0.03 Hz (13) | |
| sIPSC amplitude | 0.06 | 0.53 | 112 | 13.0 ± 1.2 pA (29) | 13.2 ± 1.6 pA (13) | 12.8 ± 1.7 pA (13) | |
Values in bold come from significant correlations or group comparisons (p < 0.05). For two-sample group comparisons (t test or Mann–Whitney test, depending on sample normality), the significance level is displayed at the end of the 45 dpi column. For three-sample group comparisons, bold values indicate a significant overall difference between groups in a parametric or nonparametric ANOVA (depending on sample normality). The results of post hoc comparisons between groups are then shown at the end of the 45 dpi and 90 dpi colums. The 45 dpi column contains the result of a comparison between the 7-14 dpi and 45 dpi columns, whereas the 90 dpi column shows the results of comparisons between the 7-14 dpi and 90 dpi columns and between the 45 dpi and 90 dpi columns, in that order. *p < 0.05; **p < 0.01; ***p < 0.001; ns, nonsignificant.
Electrophysiology.
Mice were deeply anesthetized with isoflurane (Mundipharma, Paris, France) and then swiftly decapitated. The OB and frontal cortices were rapidly dissected and placed in ice-cold artificial CSF (ACSF; containing in mm: 124 NaCl, 3 KCl, 1.3 MgSO4, 26 NaHCO3, 1.25 NaHPO4, 20 glucose, 2 CaCl; ∼310 mOsm, pH 7.4 when bubbled with a mixture of 95% O2 and 5% CO2; all chemicals from Sigma, St. Quentin Fallavier, France), before being glued to a block of 4% agarose and placed, submerged in ice-cold ACSF, in the cutting chamber of a Leica (Wetzlar, Germany) vibrotome (VT 1000S). Vibroslice blades (World Precision Instruments, Sarasota, FL) were used to cut 300 μm horizontal sections of the OB, which were then placed in bubbled ACSF in a warming bath at 35°C for 30 min. After incubation, we kept slices in bubbled ACSF for the remainder of the experiment (up to 6 h after decapitation).
For whole-cell recordings, individual slices were placed in a chamber mounted on an Olympus (Rungis, France) BX51WI upright microscope, and continuously perfused (1.5 ml/min) with room-temperature (23°C) bubbled ACSF. Appropriate receptor antagonists and agonists [10 μm SR-95531 (gabazine); 50 μm dl-2-amino-5-phosphonopentanoic acid (APV); 10 μm 2,3-dioxo-6-nitro-1,2,3,4-tetrahydrobenzo(f)quinoxaline-7-sulfonamide disodium salt (NBQX); 0.5 μm Ro 25-6981 (Ro) (all from Sigma); 1 μm tetrodotoxin (TTX; Latoxan, Valence, France); and 0.5 μm baclofen (Tocris Bioscience, Bristol, UK)] were added to the perfusate using an automated switching system. Slices were visualized using a 40× water-immersion objective, a halogen light source, differential interference contrast filters (all Olympus), and a CCD camera (C7500; Hamamatsu, Shizuoka, Japan). Fluorescent cells were visualized using an Olympus U-RFL-T burner and appropriate TRITC (tetramethylrhodamine isothiocyanate) and FITC filters.
We obtained whole-cell patch-clamp recordings from visually targeted glomerular layer neurons. Patch pipettes, pulled from borosilicate glass [outer diameter (OD), 1.5 mm; inner diameter (ID), 1.17 mm (Harvard Apparatus, Edenbridge, UK); P-87 Flaming/Brown micropipette puller (Sutter Instruments, Royston, UK)], had resistances of 6–10 MΩ and were filled with a cesium gluconate-based solution (in mm: 126 Cs-gluconate, 6 CsCl, 2 NaCl, 10 Na-HEPES, 10 d-glucose, 0.2 Cs-EGTA, 0.3 GTP, 2 Mg-ATP, 0.2 cAMP, with 0.15% biocytin; 280–290 mOsm, pH 7.3). The concentration of Cs-EGTA was sometimes increased to 10 mm for recordings of NMDA currents, but without noticeable changes in response stability. Rhodamine (0.1–0.4%) was included in the internal solution for recordings of GFP+ cells. All voltages reported in this manuscript are corrected for a liquid junction potential of +10 mV between our internal and external solutions.
Patch-clamp recordings were obtained via a Heka EPC9/2 amplifier coupled to Pulse acquisition software. Signals were Bessel filtered at 10 kHz (filter 1) and 2.9 kHz (filter 2), digitized, and sampled at intervals of 20–450 μs (2.2–50 kHz) according to the demands of individual protocols. Compensation for fast capacitance in cell-attached mode was ∼80% (12–13 pF, 3–5 μs); after rupture, we also compensated for Cm but not series resistance (Rs). With Cm compensation inactivated, values of Cm, Rs, and Rm were estimated using area, peak, and steady-state currents, respectively, observed in response to a 10 mV membrane step. Any experiments in which Rs changed by >20% were discarded from our analyses.
Recorded cell type was established based on various criteria (cf. Hayar et al., 2004). Non-GFP-expressing cells were divided into two groups: ETCs and PGCs. PGCs had small cell bodies (≤8 μm) and high Rm [>1 GΩ in postnatal week 1 (Pw1), >700 MΩ thereafter] and fired single sodium action currents in response to membrane depolarization (Fig. 1). ETCs had large cell bodies (>10 μm), low Rm, or fired multiple sodium action currents after depolarization (seen from as early as P1). These characterizations were always consistent with cell morphology (Pinching and Powell, 1971; Hayar et al., 2004) after subsequent processing of recorded slices for biocytin label (see below), although success rates for leaving recorded cells intact after pipette removal were unfortunately too low to allow such processing to be systematic. Note that we did not attempt to distinguish glomerular short-axon cells (SACs) in our recordings, for the simple reason that we concentrated on describing ON inputs to our cells and SACs are known never to receive monosynaptic input from OSNs (Pinching and Powell, 1971; Hayar et al., 2004). Still, with their low Rm and tendency to fire single action potentials when depolarized (Hayar et al., 2004), these rare cells likely formed most of the six neurons that we could not reliably classify as either ETCs or PGCs.
Figure 1.

Recording evoked olfactory nerve inputs in three types of maturing OB glomerular layer neurons. A, Schematic of our experimental approach for developing postnatal juxtaglomerular cells (JGCs). Acute horizontal slices were cut from mouse olfactory bulb, and a monopolar stimulating electrode was placed in the olfactory nerve layer. Evoked inputs from OSN axons were then recorded via a patch pipette placed on a juxtaglomerular cell. B, Biocytin fills illustrating the two types of developing juxtaglomerular cell recorded. ETCs were large, with correspondingly low Rm and high Cm. PGCs were much smaller, with high Rm and low Cs. Scale bar, 20 μm. C, Sodium currents recorded in an ETC (left) and a PGC (right) after depolarization to −20 mV. Whereas ETCs displayed multiple currents, PGCs displayed only one. D, Schematic of our experimental approach for adult-born periglomerular cells. Newly born cells migrating toward the OB were labeled in adult mice via stereotaxic injection of a GFP-expressing lentivirus into the RMS. We then patched GFP+ cells in the glomerular layer and recorded evoked olfactory nerve inputs as shown above. LV, Lateral ventricle. E, An example of a recorded adult-born PGC. The biocytin fill (red) showed typical PGC morphology, whereas subsequent immunohistochemical staining for GFP (green) showed that the recorded cell was indeed newly generated. TOTO (blue) labels cell bodies and shows glomerular structure; the recorded cell's glomerulus is outlined in white. Scale bar, 20 μm.
We did not attempt to account for the formidable biochemical and functional heterogeneity present within both developing and adult-born PGC populations (Kosaka et al., 1998; Puopolo and Belluzzi, 1998; McQuiston and Katz, 2001; Whitman and Greer, 2007; De Marchis et al., 2007). However, in our most inclusive functional measures of membrane resistance and capacitance (Tables 1, 2), we saw no obvious heterogeneity in either sample: no multipeaked histograms for either measure. Also, by concentrating our efforts on monosynaptic ON inputs in particular, we probably reduced cell-type heterogeneity considerably in our PGC samples. Only a minority of PGCs receive direct input from the ON (Pinching and Powell, 1971; Kosaka et al., 1998; Hayar et al., 2004), and immunohistochemical evidence suggests that this minority excludes the entire subpopulations expressing calbindin and calretinin (Kosaka et al., 1998). Indeed, when we divided our intrinsic membrane property data into groups depending on the presence or absence of ON input, we found that those cells receiving direct OSN contact were significantly larger, with lower Rm and higher Cm (data not shown). ON-receiving cells may therefore represent a distinct PGC subpopulation, a subpopulation that we focused on here. Despite this, there is no doubt that heterogeneity exists in our samples, but, as with heterogeneity in cell age, this would act against us seeing significant and common maturational changes in ON input. The fact that we did see such changes (Tables 1, 2, see Figs. 2, 3) argues that PGC heterogeneity, although fascinating to study in its own right, did not prevent us from describing fundamental properties of OSN-to-OB synaptic maturation.
Figure 2.

The AMPA:NMDA ratio at ON synapses increases with postnatal maturation of ETCs and PGCs and with maturation of adult-born GFP+ neurons. A, Calculating an AMPA:NMDA ratio from ON-evoked inputs in a PGC. At −70 mV, in the presence of gabazine to block GABAA receptors, magnesium blockade of NMDA receptors means that the recorded current is AMPA dominated. An estimate of AMPA amplitude (amp1) was therefore taken as the peak of this response. At +40 mV, however, magnesium block is removed from NMDA receptors, revealing a mixed AMPA+NMDA response. Because AMPA responses are fast, as illustrated by the gray trace showing the AMPA-only trace after l-APV application (50 μm), an estimate of NMDA amplitude (amp2) could be taken from this combined response at 50 ms after stimulation. The AMPA:NMDA (A:N) ratio was then simply calculated as amp1/amp2. B, Representative traces showing A:N ratios at different stages of maturation in ETCs, PGCs, and adult-generated GFP+ neurons. Bottom traces show responses at −70 mV; top traces show responses at +40 mV. Traces for each cell are normalized by amp1, and the A:N ratio is displayed at the bottom right of each example, showing the clear increase in A:N ratio as maturation proceeds in all three cell types. C, Significant positive correlations between maturation stage and A:N ratio for all three cell types. r and p report results of a nonparametric rank correlation on each dataset. A, Adult. D, Group comparisons show increasing A:N ratios with maturation in all three cell types. In this and in subsequent figures, data plotted are mean ± SEM, and values within bars show sample sizes (n). *p < 0.05; **p < 0.01. W1, Postnatal week 1; W4, postnatal week 4; 7–14, 45, and 90 refer to GFP+ cell groupings based on dpi; GFP− refers to control PGCs in adult tissue.
Figure 3.
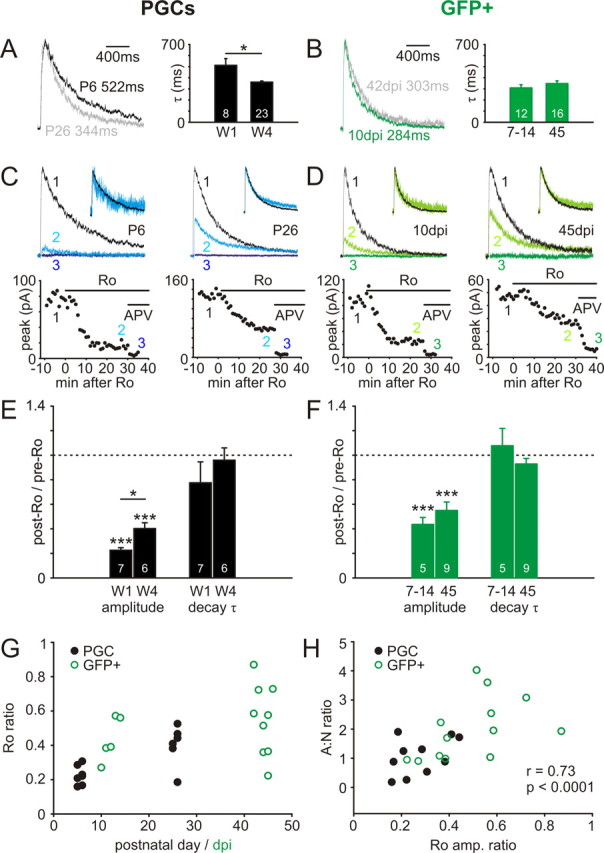
ON input NMDA decay kinetics and NR2B subunit contributions in maturing postnatal and adult-born PGCs. A, B, NMDA decay kinetics quicken with the postnatal maturation of PGCs, but do not change significantly with maturation of adult-born GFP+ neurons. Left, Representative NMDA currents recorded at +40 mV and normalized by peak amplitude, from immature (dark) and mature (light) cells. Values show the responses' τ calculated from a single-exponential fit to each curve. Right, Group comparisons showing a significant difference in τ (*p < 0.05) between mature and immature groups for developing PGCs, but not for GFP+ cells. W1, Postnatal week 1; W4, postnatal week 4; 7–14 and 45 refer to GFP+ cell groupings based on dpi. C, D, Partial blockade of NMDA responses with the NR2B subunit-selective drug Ro (0.5 μm) in immature and mature PGCs. Top traces show NMDA responses before (1) and after (2) Ro application, and after complete blockade of the response in APV (50 μm; 3). Significant reduction of NMDA responses was observed with Ro application for both immature and mature neurons, and for both early postnatal and adult-born GFP+ PGCs. Ro appeared, however, to decrease immature NMDA responses a little more for both cell types. Traces for each cell are normalized by initial NMDA response amplitude. Insets show pre-Ro and post-Ro responses normalized by peak amplitude; no consistent change in decay kinetics was observed in any cell group after Ro application. Bottom plots show peak NMDA response amplitude as a function of time after Ro application. E, F, Effects of Ro application on NMDA response amplitude and decay kinetics in immature and mature PGC cell groups. Ro significantly decreased NMDA response amplitude in both immature and mature groups, in both developing postnatal PGCs and adult-born GFP+ cells (***p < 0.001). In developing postnatal PGCs, this decrease was significantly greater in the immature group (*p < 0.05). In adult-born GFP+ PGCs, the same trend was apparent, but the difference was not significant. Ro application did not significantly alter NMDA decay kinetics in any group. G, Population Ro ratio data for both PGC and GFP+ groups. Note the trend toward increased values with maturation for both groups, the higher Ro ratio values in GFP+ cells, and the rapid maturation within the GFP + 7–14 dpi group. H, A strong positive correlation between the reduction in NMDA response amplitude after Ro application (Ro amp. ratio) and AMPA:NMDA ratio measured as shown in supplemental Figure 2A (available at www.jneurosci.org as supplemental material) (A:N ratio). Cells from all age groups are shown. r and p report the results of a nonparametric rank correlation on all data points; individual correlations for both developing PGCs and adult-born GFP+ cells were also positive and significant.
Adult-born cells were identified by either spatially coincident double label of GFP and rhodamine during recording or the presence of GFP in the patch pipette. GFP-targeted recordings that met neither of these criteria were discarded from our analyses.
OSN axon stimulation was achieved via a small monopolar stimulating pipette (3–4 μm tip diameter, pulled from 1.5 mm OD, 1.17 mm ID borosilicate glass and filled with ACSF) placed well within the outer nerve layer of the OB and finely positioned using a micromanipulator. We aimed for bundles of OSN fibers clearly running into a given glomerulus (these were far more evident in mature tissue), usually anterior to the recorded cell. We never directly stimulated our recorded cells or glomerular tissue; although primary cell dendrites can release glutamate onto their glomerular neighbors (Hayar et al., 2004), we never observed any evoked responses from our stimulating pipette in the presence of 1 μm TTX. Stimuli were triggered from Pulse software, patterned using a Master-8 controller, and delivered using a Digitimer (Welwyn Garden City, UK) constant-current isolated stimulator. Stimulus duration was 100 μs, and amplitude was set at the largest value that resulted in a clean monosynaptic EPSC in the recorded cell, up to a maximum of 100 μA. Stimulus frequency, because of the depressing nature of the OSN-to-OB synapse (see Fig. 6), was usually 0.05 Hz (20 s intervals), but was often 0.017 Hz (60 s intervals) for those experiments, such as Ro washin (see Fig. 3), in which response amplitude stability was required over an extended period of time.
Figure 6.

Paired-pulse depression at ON synapses does not change with postnatal maturation of ETCs and PGCs, nor with maturation of adult-born GFP+ neurons. A, Paired-pulse AMPA responses evoked at varying ISIs at either −70 mV or +40 mV. Responses depressed strongly with a 50 ms ISI; this depression lessened with increasing ISI but was still evident at 5000 ms intervals. Values at each peak show the PPR calculated by dividing the peak amplitude of the second response by that of the first. B, Mean ± SEM. PPR values for all three cell types, over all maturation stages. A one-way ANOVA for responses at +40 mV revealed no significant differences between cell groups, whereas a two-way ANOVA for responses at −70 mV revealed significant differences between ISIs (p < 0.0001), but no significant differences between cell types, consistent with a presynaptic cause of PPR. C, Representative traces at −70 mV, 50 ms ISI for immature and mature stages in all three cell groups. Examples are normalized with respect to their initial peak; values at bottom are PPR. D, No significant correlations of PPR (−70 mV, 50 ms ISI) with maturation in any cell group. r and p report the results of nonparametric rank correlations. A, Adult. E, No significant group differences in PPR (−70 mV, 50 ms ISI) for any cell type. W1, Postnatal week 1; W4, postnatal week 4; 7–14, 45, and 90 refer to GFP+ cell groupings based on dpi.
Data analysis.
Spontaneous postsynaptic currents (Tables 1, 2) and asynchronous evoked events in the presence of strontium (see Fig. 5) were analyzed with Elphy software (Gerard Sadoc, Gif-sur-Yvette, France) using custom routines written by Samuel Lagier (Centre National de la Recherche Scientifique, Paris, France). The threshold for event detection was 8 pA (typically twice as large as the root mean square noise). All synaptic event analyses were performed by an experimenter blind to cell maturity and categories. All other data were analyzed using custom-written code in Matlab (MathWorks, Natick, MA). Peak sodium currents were measured after subtraction of scaled passive current responses to the appropriate voltage steps. Decay curves were fitted with single-exponential functions using a least-squares minimalization algorithm, with resultant fits typically accounting for >99% of the variance in the raw data. For paired-pulse responses with 50 ms interstimulus intervals, an extrapolated fitted function to the decay of the first response was used to establish a baseline for the second response. For aesthetic purposes, stimulus artifacts have been removed from all displayed traces, which represent the average of ≥3 trials.
Figure 5.

No increase in ON input quantal size with postnatal maturation of ETCs and PGCs, nor with maturation of adult-born GFP+ neurons. A, Estimating quantal size at ON inputs by replacing external Ca2+ with Sr2+. A1, Sr2+ (2 mm) produces asynchronous glutamate release: a single, smooth evoked EPSC recorded in an ETC at P2 is converted into a series of small asynchronous SrEPSCs extended in time. Between 40 and 240 ms after stimulation, shown by the gray box, these events were consistent in amplitude, and were much higher in frequency than background spontaneous events. A2, Histogram of SrEPSC amplitudes recorded in this cell (black). Recording noise amplitudes are shown in white. The arrow points to the median SrEPSC amplitude, taken as an estimate of quantal size for each cell (here 14.3 pA). A3, Average SrEPSC for this example cell. B, Average SrEPSCs for different cell groups at immature and mature time points. Values at bottom show median SrEPSC amplitude for that cell. Calibration: 10 pA, 10 ms. C, No significant correlation of quantal size with maturation in any cell type. r and p report results of nonparametric rank correlations. Each dot represents one cell. D, Group comparisons of quantal size, by cell and by event. D1, In ETCs, when data are combined by cell (taking the median SrEPSC event amplitude per cell), a nonsignificant decrease in ON input quantal size is seen between postnatal week 1 (W1) and postnatal week 4 (W4). This difference, however, is more marked, and is significant, if SrEPSC amplitudes are pooled across all neurons within a group (by event; *p < 0.05). D2, Because of the difficulty in obtaining clean SrEPSC recordings in adult tissue, GFP+ cells were treated as one group and compared alongside developing postnatal and adult PGCs. Whether analyzed by cell or by event, no significant differences were observed between PGC groups.
Statistical analysis.
Statistical analysis was performed with GraphPad (San Diego, CA) Instat and Prism software. All datasets were described using the mean ± SEM. Because of the noncontinuous nature of our cell maturity data, all correlations were nonparametric Spearman rank analyses. For this reason, no regression lines are fitted to our scatterplot figures. Cell groupings were based on published time points for morphological maturation in adult-born PGCs (Mizrahi, 2007) and on maturational start and end points in developing glomerular layer neurons. All group analyses for adult-born GFP+ cells also included a group of non-GFP-expressing cells, recorded in tissue from virus-injected animals (P60 + 7–45 dpi), and representing the resident preexisting PGC population. Lack of any immature characteristics in this group (see Results) suggests that the contribution of ongoing neurogenesis to functionality in the PGC population is actually rather minor (cf. Mizrahi et al., 2006). Where assumptions for linearity and equality of variance were met, group comparisons used the appropriate parametric tests. Where these assumptions were not met, we used nonparametric tests instead. Aware that our sample sizes were often too small (n < 30) to reliably assess normality using a Kolmogorov–Smirnov test, we also applied nonparametric tests wherever a parametric analysis had been used. In all cases, both tests produced identical results in terms of significance. All group comparisons were two-tailed, with the level of significance (α) set at 0.05.
Immunohistochemistry.
After successful whole-cell recordings, OB slices were fixed and stored at least overnight in 4% paraformaldehyde (in 0.1 m phosphate buffer, pH 7.4). After washing in PBS, biocytin was labeled with a streptavidin Alexa Fluor 568 conjugate (1:100 from a stock solution of 1 mg/ml in PBS, 2 h at ambient temperature). To enhance fluorescence, GFP was labeled with anti-GFP antibody. After blocking (in PBS + 0.3% Triton X-100 + 4% bovine serum albumin + 5% fetal calf serum; all from Sigma; 2 h ambient temperature), slices were incubated overnight in primary antibody solution (rabbit anti-GFP IgG; 1:1000 in blocking buffer; 4°C) and then labeled with secondary antibodies (goat anti-rabbit Alexa Fluor 488; 1:500 in PBS; 2 h ambient temperature) and TOTO-3 iodide to stain cell bodies (1:5000; 20 min ambient temperature). Slices were mounted in Mowiol (EMD Biosciences, San Diego, CA), and images were obtained using a Zeiss confocal microscope. Unless specified, all reagents were from Invitrogen (Carlsbad, CA).
Results
We studied the maturation of ON inputs to cells in the glomerular layer of the OB, both in early postnatal development and during adult neurogenesis. Investigations of early postnatal maturation were performed in acute OB slices taken from 48 mice aged from P1 to P28, with additional cells recorded in adults (>P60). We obtained whole-cell patch-clamp recordings from 350 juxtaglomerular cells (Fig. 1A), which we characterized into two groups, ETCs and PGCs, on the basis of morphological and functional criteria (see Materials and Methods) (Hayar et al., 2004). PGCs (n = 282) were small, had high membrane resistance and low membrane capacitance (Fig. 1B), and produced single sodium action currents in response to membrane depolarization (Fig. 1C). ETCs (n = 62), in comparison, were large, possessed low membrane resistance and high membrane capacitance (Fig. 1B), and produced multiple sodium action currents when depolarized (Fig. 1C).
We investigated maturation during adult neurogenesis by using a GFP-encoding lentivirus in 49 adult mice to label newly born cells as they migrated from the SVZ toward the OB in the RMS (Fig. 1D) (see Materials and Methods). We then took whole-cell patch-clamp recordings from 242 GFP+ cells in the glomerular layer of acute OB slices (Fig. 1D) taken at time points ranging from 4 to 91 dpi. Double label of targeted cells with GFP and either rhodamine (immediate) or biocytin (after fixation) confirmed that the cells we recorded had been born in the adult forebrain (Fig. 1E).
Intrinsic membrane properties and spontaneous input
Although we were primarily interested in the maturation of ON inputs to our recorded cells, the preliminary functional characterizations we tested in the first few minutes after membrane rupture gave us useful information about their intrinsic membrane properties and synaptic input (Tables 1, 2). Important changes in these parameters are known to take place during the maturation of adult-born neurons in the granule cell layer of the OB (Carleton et al., 2003) and in the dentate gyrus of the hippocampus (Esposito et al., 2005), and we detected similar changes during maturation in all three of our cell groups.
Rm, indicative of total leak channel number in a cell's membrane (and therefore indirectly related to cell size), decreased significantly with increased maturity in both developing PGCs and adult-born GFP+ neurons (rank correlations with age or dpi; p < 0.05) (Tables 1, 2). Group comparisons suggest that Rm reached fully mature values by Pw4 for developing PGCs, and by 45 dpi for GFP+ cells (Tables 1, 2). ETCs in the early postnatal OB also showed a trend, although nonsignificant, toward lower Rm values with increasing age. Cm, a more direct indicator of cell membrane area, increased slightly but significantly with maturation in adult-born neurons (Spearman r = 0.18; p = 0.007) (Table 2), and also appeared to reach mature values by 45 dpi. However, neither PGCs nor ETCs in postnatal OB development showed significant age-related changes in Cm (Table 1). This suggests that whereas adult-born glomerular layer neurons become larger up to 45 dpi, a result backed by recent in vivo morphological data (Mizrahi 2007), cells in the postnatal developing OB simply add more channels to their membrane.
Indeed, we saw significant increases in the amount of voltage-activated sodium current expressed in all three of our cell groups as they matured. Measuring peak current after depolarization to −20 mV and dividing by Cm to obtain a measure of Na+ current amplitude that was expressed as current density, we observed significant positive correlations with age for both ETCs and PGCs and with dpi for GFP+ adult-born neurons (Tables 1, 2). Group comparisons showed that sodium current density reached mature levels by Pw4 for PGCs, and by 45 dpi for GFP+ cells (Tables 1, 2). However, despite this clear maturation of Na+ current amplitude, and unlike adult-born OB granule cells, which become fully mature in all other aspects before being able to fire (Carleton et al., 2003), depolarizations in current-clamp mode showed that action potentials were possible as early as P1 for ETCs and PGCs and 7 dpi for adult-generated GFP+ neurons (data not shown).
Recording spontaneous synaptic events can give a useful first indication of the type of inputs received by maturing neurons. In the glomerular layer of the OB, as in most areas of the brain, the predominant inputs to all cell types are either glutamatergic or GABAergic (Hayar et al., 2004), so we used a low-chloride internal solution to be able to distinguish between the two in our maturing neurons. We recorded glutamatergic spontaneous EPSCs (sEPSCs) at the chloride reversal potential of −70 mV and GABAergic IPSCs (sIPSCs) at the combined cation reversal potential of 0 mV. These events were entirely blocked by 10 μm NBQX and 10 μm gabazine, respectively (data not shown). In the postnatal developing OB, both types of event were seen in both ETCs and PGCs from the earliest recordings made, at P1. In adult-born neurons, GABA input appeared at 4 dpi, a few days before glutamatergic inputs were first seen at 7 dpi. However, as well as observing many young GFP+ neurons that only received GABA input, we did record from adult-born cells that possessed only glutamatergic spontaneous activity. The sequence of maturation of spontaneous inputs to adult-generated glomerular layer neurons is therefore not as precise as that for granule cells of the OB, where GABA inputs always arrive first (Carleton et al., 2003). Tables 1 and 2 detail the maturation of sEPSC and sIPSC spontaneous input onto our three cell groups. The frequency of sEPSCs increased significantly with maturation for both postnatal PGCs and adult-born GFP+ cells (Tables 1, 2), and also showed a nonsignificant increase in developing ETCs. sEPSC amplitude, on the other hand, decreased with maturity in all three cell groups, significantly so for ETCs and PGCs in early postnatal development. As with glutamatergic events, the frequency of GABAergic spontaneous input increased with maturation in all three cell groups (Tables 1, 2). In ETCs only, sIPSC amplitude also increased significantly with age.
Evoked input from the ON
Having characterized the intrinsic membrane properties and spontaneous input of our recorded cells, we then went on to seek monosynaptic inputs from the ON, using a small monopolar stimulating pipette placed in the bulb's outer nerve layer. At −70 mV, and in the presence of the GABAA receptor antagonist gabazine (10 μm), ON inputs were characterized by short-latency, reliably timed, large synchronous inward currents with fast rise and decay times (Fig. 2A). These currents were always completely blocked by either TTX (1 μm) or a combination of the AMPA receptor antagonist NBQX (10 μm) and the NMDA antagonist APV (l-APV; 50 μm; data not shown). As shown below, they also showed properties characteristic of ON inputs, including marked paired-pulse depression (see Fig. 6) and modulation via GABAB receptors (see Fig. 7). We were able to record monosynaptic ON input to our recorded cells from the earliest time point studied (P1) for ETCs, from P2 for developing PGCs, and from as early as 7 dpi for adult-born GFP+ neurons. This latter finding puts the time for initial ON inputs much earlier than previously thought for postnatally born PGCs: in a study of neurogenesis in the early postnatal rat, Belluzzi et al. (2003) reported the presence of ON input only in cells ∼4 weeks of age. Indeed, we found that ON inputs were easier to find as cells became more mature. In Pw1, 19% (19/99) and 58% (14/24) of recorded PGCs and ETCs, respectively, received monosynaptic inputs from the ON; by Pw4, these values had risen to 48% (30/63) and 69% (9/13), respectively (Fisher's exact test, p = 0.0002 for PGCs; p = 0.72 for ETCs). Similarly, whereas 46% (45/97) of GFP+ cells aged 7–14 dpi possessed ON input, 67% (35/52) had ON input by 45 dpi (Fisher's exact test, p = 0.02). Note the higher proportion of ON inputs in GFP+ cells, a suggestion that they may form a functionally different group compared with preexisting PGCs (see Discussion).
Figure 7.

Presynaptic modulation of ON input via GABAB receptors is present and mature in the first postnatal week. A, Example traces recorded from PGCs at P5 and P26, showing AMPA responses to paired-pulse stimulation (50 ms ISI, −70 mV). Control traces (gray) show strongly depressing responses before the addition of the GABAB receptor agonist baclofen (0.5 μm). Black traces show responses after baclofen application: initial response amplitude is decreased and PPR becomes less strong, consistent with a decrease in presynaptic release probability. B, Group comparisons show that baclofen's effects on initial response amplitude and PPR are significant in both the first (W1) and the fourth (W4) postnatal weeks (1-sample t test vs 1; *p < 0.05; **p < 0.01; ***p < 0.001), but do not differ significantly between different stages of ON input maturation.
Both in the presence and in the absence of monosynaptic ON inputs to our recorded neurons, we also saw polysynaptic, unreliable, asynchronous glutamatergic input with high jittering, characteristic of feedforward excitation onto glomerular layer neurons from the dendrites of mitral and tufted cells (Hayar et al., 2004). We did not characterize this input fully, but did note its presence from as early as P1 in developing PGCs, from P2 in developing ETCs, and from 7 dpi in adult-born GFP+ neurons. All glutamatergic inputs to glomerular layer neurons (monosynaptic evoked, polysynaptic evoked, and spontaneous) therefore appeared simultaneously in all three of our cell groups.
Identical increases in AMPA:NMDA ratio at maturing ON synapses in postnatal development and adult neurogenesis
In many areas of the brain, immature glutamatergic synapses are characterized by a relative predominance of NMDA over AMPA receptors, which switches to a predominance of AMPA over NMDA receptors as maturation proceeds (Malinow and Malenka, 2002). The input from the ON to the OB is no exception to this rule, both for synapses developing in the early postnatal period and for connections formed onto newborn cells in the adult animal (Fig. 2). We derived a commonly used index of the AMPA:NMDA ratio in our recorded cells (Laplagne et al., 2006) by first measuring the peak amplitude of ON monosynaptic inputs at −70 mV in the presence of 10 μm gabazine. At this hyperpolarized membrane potential, and with magnesium present in the extracellular medium, NMDA receptors are largely blocked. This amplitude (Fig. 2A, amp1) can therefore be used as a measure of AMPA receptor contribution. At +40 mV, on the other hand, the magnesium block of NMDA receptors is released, leading to a composite AMPA+NMDA response after ON stimulation (Fig. 2A, top black trace). Because NMDA receptor-mediated responses are much slower than their AMPA-mediated counterparts (peaking at ∼50 ms vs ∼5 ms after stimulus), the amplitude of this composite response at 50 ms after stimulus (Fig. 2A, amp2) can be taken as a measure of NMDA receptor contribution. Blocking the NMDA response with 50 μm APV (Fig. 2A, gray top trace) shows that by this 50 ms time point, the AMPA response has decayed to only a small fraction of its peak (11.7 ± 1.0% across all cells). The AMPA:NMDA ratio is then given by simply dividing amp1 by amp2 (Fig. 2A).
In all three of our cell types, evoked ON responses at early ages or dpis were characterized by a predominance of NMDA receptor inputs (Fig. 2B, top traces). This changed dramatically so that by Pw4 for ETCs and PGCs, or by 45 dpi for GFP+ cells, AMPA receptors provided the predominant contribution to ON inputs. We observed strong, significant positive correlations between age and AMPA:NMDA ratio for ETCs (Spearman r = 0.55; p = 0.03; n = 15), between age and AMPA:NMDA ratio for PGCs (Spearman r = 0.53; p = 0.0003; n = 43), and between dpi and AMPA:NMDA ratio for GFP+ adult-born neurons (Spearman r = 0.51; p < 0.0001; n = 83) (Fig. 2C). Group analyses revealed a significant difference between Pw1 (mean ± SEM = 2.62 ± 0.53; n = 9) and Pw4 (6.54 ± 0.81; n = 3) for ETCs (t test, p = 0.003) (Fig. 2D). PGC groups were also significantly different (Kruskal–Wallis, p = 0.008), with significant post hoc differences (Dunn, p < 0.05) between Pw1 (2.88 ± 0.99; n = 10) and Pw4 (8.25 ± 1.75; n = 19) and between Pw1 and adult (8.47 ± 1.87; n = 8) (Fig. 2D). For GFP+ cells, groups were significantly different (Kruskal–Wallis, p < 0.0001), with significant post hoc differences (Dunn) between 7–14 dpi (3.48 ± 0.47; n = 31) and 45 dpi (7.84 ± 1.43; n = 20; p < 0.01), 90 dpi (7.81 ± 1.70; n = 7; p < 0.05), and adult GFP-PGCs (8.47 ± 1.87; n = 8; p < 0.05) (Fig. 2D). As for Rm, Cm, and peak sodium current (Tables 1, 2), significant maturation of AMPA:NMDA influences in ON inputs appears complete for developing PGCs by the fourth postnatal week, and for adult-born PGCs by 45 dpi.
Although commonly used to assess maturational changes at glutamatergic synapses, the above AMPA:NMDA ratio has some drawbacks. One is that it relies on measurements at different holding membrane potentials, so that if current reversal potentials or rectification change with maturation, the ratio can be affected. We checked that this was not the case in our recordings by comparing the peak current of AMPA-only evoked responses at +40 mV and −70 mV in the presence of 10 μm gabazine and 50 μm APV (supplemental Fig. 1A, available at www.jneurosci.org as supplemental material). As expected when using an internal solution that lacks polyamines (see Materials and Methods), we saw no evidence for changes in this AMPA rectification index with maturation in any of our cell groups (supplemental Fig. 1B,C, available at www.jneurosci.org as supplemental material). However, there are other drawbacks of the above AMPA:NMDA ratio. The ratio is dependent on an NMDA measure taken from a composite AMPA+NMDA response, and also is open to influence from polysynaptic glomerular activity. In particular, if polysynaptic input is more prevalent at immature stages, its AMPA component would be easily fast enough to contribute to the “NMDA” measure taken 50 ms after stimulation in the composite AMPA+NMDA trace. An increasing AMPA:NMDA ratio with maturation would then simply represent a decrease in the influence of polysynaptic glomerular excitation. We ensured that this was not the case by measuring ON-evoked responses at +40 mV in 10 μm gabazine, before and after the addition of the AMPA receptor antagonist NBQX (10 μm) (supplemental Fig. 2A, available at www.jneurosci.org as supplemental material). This produces an NMDA-only response whose peak is too fast to be contributed to by NMDA-only polysynaptic activity. By subtracting this trace from the AMPA+NMDA composite response, we obtain an AMPA-only current whose peak should also be unaffected by the glomerular network. Both measures are also obtained at the same holding potential. We obtained AMPA:NMDA ratios from these recordings in developing and adult-born PGCs at “immature” (Pw1/7–14 dpi) and “mature” (Pw4/45 dpi) time points, and found that the ratio increased significantly with maturation in both cell groups (PGCs: Pw1, 0.90 ± 0.28; n = 8; Pw4, 2.03 ± 0.25; n = 15; t test, p = 0.009; GFP+ cells: 7–14 dpi, 1.24 ± 0.24; n = 12; 45 dpi, 2.23 ± 0.30; n = 15; t test, p = 0.02) (supplemental Fig. 2C, available at www.jneurosci.org as supplemental material). Over all cells, the two AMPA:NMDA ratios were also extremely well correlated (Spearman r = 0.85; p < 0.0001; n = 42). Thus, in our recording conditions, the increased AMPA:NMDA ratio with maturation of ON-stimulated responses is a product of events occurring solely at the ON synapse.
Faster NMDA kinetics with maturation of developing but not adult-born PGCs
Our control experiments for the AMPA:NMDA ratio data described above gave us the opportunity to investigate the properties of NMDA-only ON-evoked responses. At many glutamatergic synapses in the developing brain, maturation is accompanied by a speeding of NMDA response kinetics (Flint et al., 1997). We saw a similar effect in our developing PGC cells: in Pw1 (512 ± 61 ms; n = 8), the NMDA decay constant was significantly longer than in Pw4 (361 ± 10 ms; n = 23; t test with correction for unequal variances, p = 0.04) (Fig. 3A). However, even at the earliest ages studied, NMDA responses in adult-born GFP+ neurons were as fast as those in Pw4 PGCs, and there was no difference between decay kinetics in the 7–14 dpi (309 ± 29 ms; n = 12) and 45 dpi (348 ± 25 ms; n = 16) groups (t test, p = 0.32) (Fig. 3B). Even in its mature state, however, note the extremely slow kinetics of the ON-evoked NMDA response [for comparison, decay constants for NMDA responses in mature somatosensory cortex are of the order of 100 ms (Flint et al., 1997)]. The functional implications for such slow-scale signaling are yet to be explored by those investigating the information-processing capabilities of OB glomeruli through modeling or experimental approaches.
Lesser contribution of NR2B subunit-containing NMDA receptors with maturation of developing and adult-born PGCs
Our observation of faster NMDA kinetics in developing PGCs led us to examine the contribution to ON-evoked NMDA responses of NR2B subunit-containing receptors. These subunits, which generally confer slower decay kinetics on the receptors that contain them, are often preferentially expressed at immature glutamatergic synapses (Flint et al., 1997). We studied their contribution to ON-evoked NMDA currents by using a specific antagonist for NR2B-containing NMDA receptors, Ro (0.5 μm). After ∼30 min of washin, Ro reduced ON-evoked NMDA responses to a stable level in both Pw1 and Pw4 PGCs, with the remaining current being completely abolished by 50 μm APV (Fig. 3C). We took a “Ro ratio” of mean peak amplitude after Ro divided by mean peak amplitude before Ro. Although both Pw1 and Pw4 PGC responses were significantly reduced by Ro application (Ro ratio, single-sample t test vs 1; p < 0.0001) (Fig. 3E), this reduction was significantly greater for Pw1 cells (0.23 ± 0.02; n = 7) than for Pw4 cells (0.40 ± 0.05; n = 6; t test with correction for unequal variances, p = 0.01) (Fig. 3E). However, this lesser contribution of NR2B-containing subunits with maturation cannot explain the speeding of NMDA decay kinetics described above, because Ro application had no significant effect on ON-evoked NMDA decay constants in either Pw1 or Pw4 (post-Ro vs pre-Ro decay constant ratio, single-sample t test vs 1, p > 0.2) [Fig. 3C (inset), E). The slow nature of ON-stimulated NMDA responses is therefore likely to be caused by the presence of other slow-kinetic subunits at the synapse.
NMDA responses in adult-born GFP+ cells were also significantly reduced by Ro application in both 7–14 dpi and 45 dpi groups (Ro ratio, single-sample t test vs 1; p < 0.001) (Fig. 3D,F), without any accompanying change in NMDA decay kinetics (post-Ro vs pre-Ro decay constant ratio, single-sample t test vs 1, p > 0.05) [Fig. 3D (inset), F]. The trend for higher Ro ratios at 45 dpi (0.55 ± 0.07; n = 9) versus 7–14 dpi (0.44 ± 0.06; n = 5) was not significant (t test, p = 0.29) (Fig. 3F). However, mean Ro ratio values in both GFP+ groups were higher than those in the Pw1 and Pw4 developing PGC groups, and a large increase in Ro ratio appeared to be present within the 7–14 dpi GFP+ group (Fig. 3G). We wondered, then, whether we had missed any maturational changes in NR2B subunit contributions in our GFP+ cells, by dint of the fact that some of the older cells in our immature group were already rather mature. We therefore compared Ro ratio with a different index of maturity (the second AMPA:NMDA ratio described above) with the reasoning that any mature cells in an immature group should display a dominant AMPA receptor contribution. Indeed, for both developing PGCs (Spearman r = 0.64; p = 0.04; n = 11) and adult-born GFP+ cells (Spearman r = 0.57; p = 0.04; n = 13), and for all cells grouped together (r = 0.73; p < 0.0001; n = 24), we saw strong, positive, and significant correlations between the AMPA:NMDA and Ro ratios (Fig. 3H). It appears, then, that more mature PGCs, whether in postnatal development or in adult neurogenesis, have a lesser contribution to their NMDA responses from receptors containing the Ro-sensitive NR2B subunit.
No change in AMPA receptor kinetics with maturation in any cell group
Having assessed maturational changes in NMDA receptor decay kinetics at ON→OB synapses, we went on to ask whether AMPA receptor kinetics mature at this connection. Maturation at other glutamatergic synapses in the brain has been associated with a speeding of AMPA responses (Cathala et al., 2005); however, we found no significant changes in the AMPA decay constant with age or dpi for any of our cell groups (Fig. 4). For all cell types, fitting a single exponential to the decay phase of AMPA responses, at −70 mV in the presence of 10 μm gabazine and 50 μm APV, yielded a decay constant (τ) of ∼6 ms at all maturational time points. No significant correlations were found between AMPA τ and postnatal day for ETCs (Spearman r = 0.11; p = 0.59; n = 27), between AMPA τ and postnatal day for PGCs (Spearman r = −0.05; p = 0.75; n = 52), or between AMPA τ and dpi for adult-born GFP+ cells (Spearman r = 0.22; p = 0.16; n = 41) (Fig. 4B). Group comparisons also revealed no significant differences across maturational time points for any cell type (ETCs: Pw1, 6.6 ± 0.9 ms; n = 11; Pw4, 7.5 ± 1.1 ms; n = 6; t test, p = 0.59; PGCs: Pw1, 6.1 ± 0.6 ms; n = 15; Pw4, 5.4 ± 0.3 ms; n = 19; adult, 5.7 ± 0.3 ms; n = 7; Kruskal–Wallis, p = 0.48; GFP+ cells: 7–14 dpi, 6.7 ± 0.9 ms; n = 15; 45 dpi, 5.9 ± 1.0 ms; n = 4; 90 dpi, 9.0 ± 0.8 ms; n = 4; GFP−, 5.7 ± 0.3 ms; n = 7; Kruskal–Wallis, p = 0.1) (Fig. 4C). Finally, in no cell group did AMPA τ correlate significantly with AMPA:NMDA ratio (ETCs: Spearman r = −0.1; p = 0.73; n = 14; PGCs, Spearman r = −0.36; p = 0.15; n = 17; GFP+ cells: Spearman r = −0.08; p = 0.62; n = 39).
Figure 4.

No maturation in AMPA decay kinetics in any cell group. A, Representative evoked AMPA responses, recorded at −70 mV, for immature and mature stages in all cell groups. Traces are normalized by peak amplitude; values show the decay constant, τ, resulting from a single-exponential fit. B, No significant correlation of AMPA τ with age or dpi for any cell group. r and p report the results of nonparametric rank correlations. A, Adult. C, No significant group differences in AMPA τ for any cell type. W1, Postnatal week 1; W4, postnatal week 4; 7–14, 45, and 90 refer to GFP+ cell groupings based on dpi.
Quantal size does not change with maturation in any cell group
One possible explanation for an increase in AMPA:NMDA ratio at maturing ON synapses is an increase in AMPA quantal size. In other words, the postsynaptic effect of a single released presynaptic vesicle could become larger with development. Quantal size is commonly assessed by measuring the amplitude of miniature EPSCs, spontaneous events recorded in the presence of TTX. However, because neurons in the glomerular layer can receive glutamatergic input from many sources other than the ON (Pinching and Powell, 1971), we sought to use a more specific means to investigate quantal size maturation at the ON→OB synapse. We therefore replaced all calcium (2 mm) in the extracellular medium with strontium (2 mm), a change that alters evoked synaptic release from smoothly synchronous to largely asynchronous, with quantal stimulated strontium EPSCs (SrEPSCs) strung out individually over a window of a few hundred milliseconds after stimulation (Oliet et al., 1996) (Fig. 5A1). We measured the amplitude of SrEPSCs occurring between 40 and 240 ms after ON stimulation at −70 mV in the presence of 10 μm gabazine and 50 μm APV (Fig. 5A1, gray box). In this time window, events were constant in amplitude (no significant rank correlation between poststimulus time and event amplitude for any cell group; p > 0.05), and occurred at a frequency that was, on average, 7.9 ± 1.2 times more than that of nonevoked spontaneous events. The large majority of events taken, then, represented quantal events from stimulated ON inputs. To minimize the effect of any multivesicular events, even in strontium, we then took the median SrEPSC amplitude as an index for quantal size in each cell (Fig. 5A2,A3).
In the developing postnatal OB, rather than seeing any sign of increased AMPA quantal size with maturation, there was a slight trend toward reduced SrEPSC amplitude with increasing age (Fig. 5B). When data were analyzed with each cell as a single data point, no significant correlations were observed between quantal size and postnatal day for either ETCs (Spearman r = −0.16; p = 0.57; n = 15) or PGCs (Spearman r = −0.25; p = 0.25; n = 24) (Fig. 5C), and no significant differences were observed between age groups (ETCs: Pw1, 17.5 ± 2.3 pA; n = 5; Pw4, 14.0 ± 1.1 pA; n = 5; t test, p = 0.22; PGCs: Pw1, 13.7 ± 1.2 pA; n = 6; Pw4, 12.2 ± 0.8 pA; n = 6; adult, 12.7 ± 1.5 pA; n = 2; ANOVA, p = 0.8) (Fig. 5D). However, analyzing data with each SrEPSC as a separate data point revealed a small, significant decrease in quantal size with maturation of ETCs only (ETCs: Pw1, 22.7 ± 1.1 pA; n = 316; Pw4, 16.6 ± 0.4 pA; n = 322; Mann–Whitney, p = 0.02; PGCs: Pw1, 15.3 ± 0.8 pA; n = 182; Pw4, 13.5 ± 0.3 pA; n = 675; adult, 12.7 ± 0.3 pA; n = 259; Kruskal–Wallis, p = 0.33) (Fig. 5D). Unfortunately, we found strontium experiments extremely difficult in our adult tissue, perhaps because of mature mechanisms of compensation for a lack of extracellular calcium. Nevertheless, we obtained data from just enough adult-born GFP+ cells to see no significant correlation of quantal size with dpi (Spearman r = 0.23; p = 0.6; n = 7) (Fig. 5C). We could also show that, when grouped with the other PGC data, and whether analyzed by cell (12.5 ± 1.3 pA; n = 7) or by event (13.7 ± 0.5 pA; n = 146), AMPA quantal size in GFP+ cells was equal to that of GFP− PGCs of all ages (ANOVA and Kruskal–Wallis, respectively, p > 0.3) (Fig. 5D). Finally, SrEPSC amplitude did not correlate significantly with AMPA:NMDA ratio in any of our cell groups (ETCs: Spearman r = −0.20; p = 0.71; n = 6; PGCs: Spearman r = −0.23; p = 0.45; n = 13; GFP+ cells: Spearman r = 0.18; p = 0.71; n = 7). The maturational increase in AMPA:NMDA ratio at ON synapses therefore cannot be explained by an increase in AMPA quantal size in any cell group.
No maturational change in paired-pulse responses in any cell group
Having characterized the main features of the postsynaptic site of the ON→OB synapse, we then sought to analyze how its presynaptic counterpart matures during development and adult neurogenesis. A characteristic presynaptic feature of the ON synapse is its extremely high release probability (Pr) (Murphy et al., 2004). High Pr usually results in a significantly depressed response to the second of a pair of closely spaced stimuli, and indeed such paired-pulse depression is known to be a presynaptic phenomenon at ON→OB connections (Murphy et al., 2004). Given that Pr can change drastically over glutamatergic synapse development (Bolshakov and Siegelbaum, 1995), we therefore investigated paired-pulse responses over maturation in our three cell groups, recording AMPA currents in the presence of 10 μm gabazine and 50 μm APV. Strong depression was evident in all cells with an interstimulus interval (ISI) of 50 ms, whether recordings were made at hyperpolarized (−70 mV) or depolarized (+40 mV) membrane potentials (Fig. 6A). This depression weakened with increasing ISI, but was still present even when stimuli were spaced 5 s apart (Fig. 6A). We calculated a paired-pulse ratio (PPR) by dividing the amplitude of the second response by that of the first. Mean PPR, calculated across all maturational stages, did not differ at +40 mV with 50 ms ISI between ETCs, PGCs, and GFP+ cells (Fig. 6B) (ANOVA, p = 0.36). In addition, a two-way ANOVA for data recorded at −70 mV revealed a strong effect of ISI (p < 0.0001), but no effect of cell group (p = 0.13), and no significant interaction between the two variables (p = 0.22) (Fig. 6B). The degree of paired-pulse depression therefore did not depend on the identity of the postsynaptic cell, suggesting that it may indeed reflect presynaptic function in our tissue (cf. Murphy et al., 2004). We verified this further by showing that PPR, like presynaptic release probability, depends strongly on the free concentration of extracellular calcium. In low Ca2+ conditions (1 mm), 50 ms ISI PPR was much higher than in control Ca2+ conditions (2 mm; 0.7 ± 0.05 vs 0.35 ± 0.03). Furthermore, increasing extracellular calcium from 1 to 2 mm decreased PPR in every cell studied (n = 12; paired t test, p < 0.0001) (supplemental Fig. 3, available at www.jneurosci.org as supplemental material). Our measure of 50 ms ISI PPR is therefore capable of detecting changes in OSN terminal release probability.
However, we did not observe any such changes with maturation in any of our cell groups: from the very first ON inputs recorded (P1 for ETCs, P2 for PGCs, 7 dpi for GFP+ cells), responses showed strong paired-pulse depression. PPR did not change with maturation (Fig. 6C): at −70 mV with 50 ms ISI, we saw no significant correlation between postnatal day and PPR for ETCs (Spearman r = −0.06; p = 0.76; n = 27), no significant correlation between postnatal day and PPR for PGCs (Spearman r = 0.14; p = 0.34; n = 50), and no significant correlation between dpi and PPR for adult-born GFP+ neurons (Spearman r = 0.02; p = 0.88; n = 42) (Fig. 6D). Group comparisons told the same story: no difference between Pw1 (0.36 ± 0.05; n = 11) and Pw4 (0.35 ± 0.06; n = 6; t test, p = 0.83) for ETCs, no difference between Pw1 (0.23 ± 0.03; n = 14), Pw4 (0.29 ± 0.05; n = 19), and adult (0.29 ± 0.05; n = 7; ANOVA, p = 0.43) for PGCs, and no difference between 7–14 dpi (0.27 ± 0.03; n = 16), 45 dpi (0.18 ± 0.04; n = 4), 90 dpi (0.41 ± 0.06; n = 4), and GFP-PGCs (0.29 ± 0.05; n = 7; ANOVA, p = 0.09) for adult-born GFP+ cells (Fig. 6E). In addition, there were no significant correlations between PPR and AMPA:NMDA ratio in any cell group (ETCs: Spearman r = −0.13; p = 0.65; n = 14; PGCs: Spearman r = 0.30; p = 0.30; n = 14; GFP+ cells: Spearman r = 0.02; p = 0.93; n = 40).
Release probability at OSN terminals is strongly regulated by GABAergic and dopaminergic intraglomerular feedback operating via presynaptic GABAB and D2 receptors, respectively (Hsia et al., 1999; Aroniadou-Anderjaska et al., 2000; McGann et al., 2005). To ensure that the lack of maturation we saw in PPR was not attributable to developmental differences in this intrinsic presynaptic modulation, we recorded 50 ms ISI PPR before and after washin of the GABAB antagonist CGP-55845 (CGP; 5 μm) and the D2 antagonist sulpiride (sul; 100 μm). Blocking presynaptic receptors did not significantly alter PPR in either developing PGCs (control, 0.27 ± 0.04; CGP+sul, 0.28 ± 0.04; paired t test, p = 0.85; n = 15) or adult-born GFP+ neurons (control, 0.26 ± 0.03; CGP+sul, 0.27 ± 0.03; paired t test, p = 0.67; n = 14) (supplemental Fig. 4, available at www.jneurosci.org as supplemental material). Furthermore, PPR in the presence of CGP-55845 and sulpiride did not differ significantly between Pw1 and Pw4 PGCs (Pw1, 0.30 ± 0.07; n = 7; Pw4, 0.25 ± 0.06; n = 8; t test, p = 0.56), nor between adult-born cells at 7–14 dpi and at 45 dpi (7–14 dpi, 0.27 ± 0.04; n = 6; 45 dpi, 0.27 ± 0.05; n = 6; t test, p = 0.94) (supplemental Fig. 4, available at www.jneurosci.org as supplemental material). These data agree well with studies showing that intraglomerular feedback inhibition of OSN terminals is not yet active after an ISI of 50 ms (McGann et al., 2005), and suggest that ambient levels of GABA and dopamine signaling have little, if any, chronic effect on OSN release probability in our slices. Activation of the glomerular network can, however, lead to feedback inhibition after ∼100 ms (McGann et al., 2005), and we did indeed observe a significant increase in PPR with 500 ms ISI after application of CGP-55845 and sulpiride in all cell types and age groups (paired t test, p < 0.05).
Another feature of synapses with high Pr is that they are extremely reliable and consistent: evoked response amplitude differs very little from trial to trial. We calculated the coefficient of variation of first evoked response amplitude in our paired-pulse experiments (CV = SD/mean), and found that ON input amplitudes were highly reliable at all maturational time points. Mean CV for all cell types was ∼0.1–0.2, and no significant correlations were found between CV and age or dpi in any cell group (ETCs: Spearman r = −0.24; p = 0.23; n = 27; PGCs: Spearman r = −0.06; p = 0.67; n = 47; GFP+ cells: Spearman r = 0.21; p = 0.20; n = 40). We also found no significant maturational group differences in CV (ETCs: Pw1, 0.13 ± 0.03; n = 11; Pw4, 0.09 ± 0.03; n = 5; t test, p = 0.37; PGCs: Pw1, 0.12 ± 0.01; n = 16; Pw4, 0.13 ± 0.02; n = 19; adult, 0.13 ± 0.02; n = 7; Kruskal–Wallis, p = 0.67; GFP+ cells: 7–14 dpi, 0.15 ± 0.02; n = 16; 45 dpi, 0.20 ± 0.04; n = 4; 90 dpi: 0.18 ± 0.02; n = 3; GFP− cells, 0.13 ± 0.02; n = 7; ANOVA, p = 0.56), nor any significant correlations of CV with AMPA:NMDA ratio (ETCs: Spearman r = −0.06; p = 0.84; n = 14; PGCs: Spearman r = −0.07; p = 0.77; n = 18; GFP+ cells: Spearman r = −0.03; p = 0.86; n = 38). In combination, the above data strongly suggest that, in contrast to some glutamatergic synapses in the brain, the characteristically high Pr of ON inputs is present as soon as developing connections are formed, and remains constant while other features of those synapses mature. Moreover, despite the constant turnover of OSNs throughout life (Graziadei and Monti Graziadei, 1980), at no time point and in no cell group did we see any evidence for significant presynaptic heterogeneity in OSN inputs (cf. Murphy et al., 2004). Release probability may therefore remain characteristically high whether OSNs are young or old, ensuring consistently reliable transmission of olfactory information from nose to brain.
Functional presynaptic receptors on ON terminals from postnatal week 1
Given that Pr appeared to be fully mature in all cell groups as soon as ON inputs were formed, we investigated whether presynaptic modulation of the ON terminal could also be present at immature stages. Our recordings of 500 ms ISI PPR after GABAB and D2 receptor blockade certainly suggested this to be the case (see above), and we confirmed the presence of functional presynaptic receptors in early postnatal development using agonist application. Paired-pulse AMPA responses, with 50 ms ISI, were recorded in developing PGCs at −70 mV, before and after the addition of the GABAB receptor agonist baclofen (0.5 μm). In Pw1 cells, baclofen produced a significant decrease in the first response to ON stimulation (post/pre ratio, 0.52 ± 0.07; n = 6; single-sample t test vs 1, p = 0.001), but a significant increase in PPR (post/pre ratio, 2.80 ± 0.67; n = 6; single-sample t test vs 1, p = 0.04), indicative of reduced Pr (Fig. 7A,B). These effects were just as pronounced as those seen in Pw4 (amplitude ratio, 0.40 ± 0.06; n = 7; single-sample t test vs 1, p < 0.0001; t test vs Pw1, p = 0.23; PPR ratio, 2.47 ± 0.44; n = 7; single-sample t test vs 1, p < 0.02; t test vs Pw1, p = 0.68) (Fig. 7A,B), suggesting that functional presynaptic receptors are present on ON terminals in very early postnatal life and remain constant during at least the first four postnatal weeks.
Discussion
We used whole-cell recordings in OB slices to describe the maturation of ON inputs in both early postnatal development and adult neurogenesis. We found significant and common postsynaptic maturational changes in developing glomerular layer neurons and in adult-born PGCs. The AMPA:NMDA ratio at ON synapses increases with maturation in all cell groups, and the contribution of NR2B subunit-containing receptors to NMDA responses at this connection decreases as developing and adult-generated PGCs mature. In contrast, we found no evidence for any maturational changes in AMPA response kinetics, or in AMPA quantal size, nor could we find any maturation in presynaptic OSN function. Remarkably, the marked paired-pulse depression and high reliability indicative of high release probability at OSN terminals were present as soon as we first observed these inputs in any glomerular cell type.
Maturational similarities and differences between postnatal development and adult neurogenesis
We saw far more similarities than differences between the developmental and adult maturation of OSN-to-OB synapses, with ON inputs maturing in an extremely similar manner for all cell groups. Forming the first synapse in the olfactory pathway may therefore happen according to a precise set of rules, followed for every postsynaptic cell whenever that cell was generated. In this respect, the situation in OB glomeruli is rather similar to that in the hippocampus, where inputs to postnatal and adult-born dentate gyrus granule cells undergo the same sequence of development (Esposito et al., 2005), and finish at almost indistinguishable levels of functional maturity (Laplagne et al., 2006). Our data contrast markedly, however, with the situation for other adult-born interneurons in the OB. Not only do postnatal and adult-born granule cells tend to occupy separate portions of the OB's granule cell layer (Lemasson et al., 2005), their sequences of functional maturation are very different (Carleton et al., 2003). Why constraints on granule cell network integration should be so different from those of PGCs is an intriguing question for those modeling the functional mechanisms of bulbar neurogenesis (Cecchi et al., 2001).
Underlying mechanisms for increases in the AMPA:NMDA ratio
The most striking maturational change at the OSN-to-OB synapse, for developing ETCs, developing PGCs, and maturing adult-born PGCs, was an increase in the ratio of AMPA versus NMDA inputs (Fig. 2; supplemental Fig. 2, available at www.jneurosci.org as supplemental material). This maturation could be caused by a number of underlying mechanisms, but experiments described here rule out a few possible explanations. We know that AMPA quantal size does not increase with maturation in any cell group (Fig. 5), so, assuming receptor saturation by released glutamate (Murphy et al., 2004), the AMPA:NMDA ratio is not increased by simply scaling up the number of AMPA receptors at each synapse. We also know that AMPA kinetics do not change with maturation (Fig. 4), so the AMPA:NMDA ratio increase is also not attributable to a change in AMPA receptor type (Isaac et al., 2007). In addition, it is unlikely that AMPA:NMDA ratio maturation is caused by nonsynaptic changes. Glutamate spillover as a result of nonefficient reuptake in young tissue is a possible explanation for the predominance of NMDA responses at immature synapses, because of the higher glutamate affinity of those receptors (Kullmann and Asztely, 1998). However, for this phenomenon to explain all of our data, one would have to assume highly specific development of reuptake in the precise location of adult-born PGC dendrites. In addition, maturation of glutamate reuptake would almost certainly influence the decay kinetics of glutamate receptors (Overstreet et al., 1999), whereas we show that AMPA decay remains constant throughout maturation in all cell types (Fig. 4). In addition, adult-born PGCs, which have highly significant AMPA:NMDA ratio maturation, show no maturational changes in NMDA decay kinetics either (Fig. 3B). We are therefore left with two likely explanations for the AMPA:NMDA ratio maturation at OSN-to-OB synapses. On one hand, there may be a maturational increase in the number of synapses containing quantal numbers of AMPA receptors, i.e., an all-or-nothing conversion of NMDA-only, “silent” synapses to mixed AMPA+NMDA connections (Isaac et al., 1997). Alternatively, there could be a decrease in the contribution of NMDA receptors with synapse maturation, a mechanism known to operate in olfactory cortex (Franks and Isaacson, 2005).
Consequences for functional and anatomical plasticity
Two maturing features at the OSN-to-OB synapse, the AMPA:NMDA ratio and NR2B subunit contributions to NMDA responses, are commonly associated with the transition from immature, plastic glutamatergic transmission to more mature, stable connections (Flint et al., 1997; Isaac et al., 1997; Franks and Isaacson, 2005; Ge et al., 2007). If this is indeed the case for the first synapse in olfaction, these maturational effects could provide functional correlates for the activity-dependent anatomical plasticity exhibited by ON projections in early postnatal development (Zou et al., 2004). In addition, they could provide a functional basis for the activity-dependent life-or-death decisions made by newborn PGCs integrating into the mature glomerular network (Rochefort et al., 2002; Alonso et al., 2006; Mandairon et al., 2006). A similar situation pertains in the adult hippocampus, where immature adult-born granule cells display enhanced synaptic plasticity relative to their mature neighbors (Schmidt-Hieber et al., 2004), plasticity that depends on high expression of NR2B subunits (Ge et al., 2007). However, long-term synaptic plasticity has been hard to find at the first synapse in olfaction, the only reports thus far being of presynaptically expressed long-term depression (Mutoh et al., 2005) and compensatory increases in release probability and quantal size after unilateral naris occlusion (Tyler et al., 2007). Because an increase in AMPA:NMDA ratio would normally be expected to accompany synaptic strengthening during normal maturation, the plastic mechanism behind this change remains obscure. Still, it is difficult to imagine the complex process of glomerular refinement occurring solely through the weakening of aberrant connections (Mutoh et al., 2005) or through the compensatory strengthening of silenced synapses (Tyler et al., 2007), without any strengthening of those projections that are correctly targeted.
In addition, the significance of our observed NR2B subunit changes is presently unclear. These subunits normally make a significant contribution to glutamatergic synaptic plasticity, because they lengthen decay kinetics at NMDA receptors, allowing longer integration times for coincident presynaptic and postsynaptic inputs. At the OSN-to-OB synapse, however, the presence or absence of functional NR2B subunits does not change NMDA receptor kinetics at all; these signals are always extremely slow (Fig. 3). The presence of NR2B subunits that do not determine NMDA receptor decay kinetics has previously been observed in hippocampal neurons (Kirson and Yaari, 1996; Ye et al., 2005), where decay kinetics are presumed to be set by other NR2 subunits. Indeed, NR2C- or NR2D-containing NMDA receptors are associated with slow decay constants (Monyer et al., 1992), and both subunits are known to be expressed in the OB (Wenzel et al., 1995), suggesting that NR1-NR2C/D heteromeric channels may be responsible for setting the lower limit on (nonmaturing) NMDA response kinetics at the ON-to-OB synapse. Decay kinetics can also be determined by non-neural factors, such as changes in synaptic cleft morphology (Cathala et al., 2005), and this may be an explanation for the reduction in NMDA decay constant with maturation in developing but not adult-born PGCs (Fig. 3A,B). If supporting glial processes and general synaptic morphology determine glutamate diffusion at ON-to-OB synapses, and develop over postnatal life, they could determine NMDA decay kinetics for developing postnatal PGCs, but not for adult-born cells integrating into an already-mature network. As to why the contribution from NR2B-containing NMDA receptors should decrease with maturation if that decrease does not affect decay kinetics, we note that NR2A and NR2B subunits also differ significantly in terms of, among other properties, glutamate affinity (Mori and Mishina, 1995) and desensitization (Vicini et al., 1998). Whether changes in these characteristics play an important role in maturation at the first synapse in olfaction remains an important question for future studies.
Functional implications of immaturity and maturity at the first synapse in olfaction
Whatever the implications for synaptic plasticity and activity-dependent processes, the significant maturation we observe in postsynaptic features of the OSN-to-OB synapse shows that immature connections between the nose and the brain are different from their mature counterparts. In early postnatal development, this means that although olfaction is necessary for survival from birth, with the necessary implication that the first synapse in olfaction is functional from birth, olfaction, and its first synapse in particular, need not necessarily be fully mature as soon as postnatal life begins. Indeed, our data provide functional correlates for the considerable anatomical plasticity that occurs postnatally in the primary olfactory projection (Zou et al., 2004). In adult neurogenesis, we show that, just as in the granule cell layer of the OB or in the dentate gyrus of the hippocampus, newly generated PGCs receive functionally different inputs, albeit transiently, in comparison with their resident neighbors. For a limited period of time in the adult brain, then, newborn PGCs can provide a functionally distinct connection for sensory information arriving from the periphery. Because this distinct function is limited to the postsynaptic half of the synapse, however, presynaptic ON terminals appear adapted to provide reliable signaling of olfactory information from the nose to the brain in the face of quite remarkable anatomical plasticity in the connection.
Footnotes
This work was supported by the Pasteur Institute, Fondation pour la Recherche Médicale, Association Française contre les Myopathies, Fédération pour la Recherche sur le Cerveau, Agence Nationale de la Recherche (ANR-05-Neur-028-01), and Fondation NRJ-Institut de France. The lab is a member of the Network of European Neuroscience Institutes (ENI-NET; LSHM-CT-2005-019063). M.S.G. held a Study Abroad Studentship from the Leverhulme Trust, and then a Marie-Curie IntraEuropean Fellowship. We thank Mady Gabellec for assistance with confocal microscopy and Juan Burrone and Ian Thompson for helpful comments on this manuscript.
References
- Alonso M, Viollet C, Gabellec MM, Meas-Yedid V, Olivo-Marin JC, Lledo PM. Olfactory discrimination learning increases the survival of adult-born neurons in the olfactory bulb. J Neurosci. 2006;26:10508–10513. doi: 10.1523/JNEUROSCI.2633-06.2006. [DOI] [PMC free article] [PubMed] [Google Scholar]
- Alvarez-Buylla A, Garcia-Verdugo JM. Neurogenesis in adult subventricular zone. J Neurosci. 2002;22:629–634. doi: 10.1523/JNEUROSCI.22-03-00629.2002. [DOI] [PMC free article] [PubMed] [Google Scholar]
- Aroniadou-Anderjaska V, Zhou FM, Priest CA, Ennis M, Shipley MT. Tonic and synaptically evoked presynaptic inhibition of sensory input to the rat olfactory bulb via GABA(B) heteroreceptors. J Neurophysiol. 2000;84:1194–1203. doi: 10.1152/jn.2000.84.3.1194. [DOI] [PubMed] [Google Scholar]
- Bayer SA. 3H-thymidine-radiographic studies of neurogenesis in the rat olfactory bulb. Exp Brain Res. 1983;50:329–340. doi: 10.1007/BF00239197. [DOI] [PubMed] [Google Scholar]
- Belluzzi O, Benedusi M, Ackman J, LoTurco JJ. Electrophysiological differentiation of new neurons in the olfactory bulb. J Neurosci. 2003;23:10411–10418. doi: 10.1523/JNEUROSCI.23-32-10411.2003. [DOI] [PMC free article] [PubMed] [Google Scholar]
- Bolshakov VY, Siegelbaum SA. Regulation of hippocampal transmitter release during development and long-term potentiation. Science. 1995;269:1730–1734. doi: 10.1126/science.7569903. [DOI] [PubMed] [Google Scholar]
- Carleton A, Petreanu LT, Lansford R, Alvarez-Buylla A, Lledo PM. Becoming a new neuron in the adult olfactory bulb. Nat Neurosci. 2003;6:507–518. doi: 10.1038/nn1048. [DOI] [PubMed] [Google Scholar]
- Cathala L, Holderith NB, Nusser Z, DiGregorio DA, Cull-Candy SG. Changes in synaptic structure underlie the developmental speeding of AMPA receptor-mediated EPSCs. Nat Neurosci. 2005;8:1310–1318. doi: 10.1038/nn1534. [DOI] [PubMed] [Google Scholar]
- Cecchi GA, Petreanu LT, Alvarez-Buylla A, Magnasco MO. Unsupervised learning and adaptation in a model of adult neurogenesis. J Comput Neurosci. 2001;11:175–182. doi: 10.1023/a:1012849801892. [DOI] [PubMed] [Google Scholar]
- De Marchis S, Bovetti S, Carletti B, Hsieh YC, Garzotto D, Peretto P, Fasolo A, Puche AC, Rossi F. Generation of distinct types of periglomerular olfactory bulb interneurons during development and in adult mice: implication for intrinsic properties of the subventricular zone progenitor population. J Neurosci. 2007;27:657–664. doi: 10.1523/JNEUROSCI.2870-06.2007. [DOI] [PMC free article] [PubMed] [Google Scholar]
- Esposito MS, Piatti VC, Laplagne DA, Morgenstern NA, Ferrari CC, Pitossi FJ, Schinder AF. Neuronal differentiation in the adult hippocampus recapitulates embryonic development. J Neurosci. 2005;25:10074–10086. doi: 10.1523/JNEUROSCI.3114-05.2005. [DOI] [PMC free article] [PubMed] [Google Scholar]
- Flint AC, Maisch US, Weishaupt JH, Kriegstein AR, Monyer H. NR2A subunit expression shortens NMDA receptor synaptic currents in developing neocortex. J Neurosci. 1997;17:2469–2476. doi: 10.1523/JNEUROSCI.17-07-02469.1997. [DOI] [PMC free article] [PubMed] [Google Scholar]
- Franks KM, Isaacson JS. Synapse-specific downregulation of NMDA receptors by early experience: a critical period for plasticity of sensory input to olfactory cortex. Neuron. 2005;47:101–114. doi: 10.1016/j.neuron.2005.05.024. [DOI] [PubMed] [Google Scholar]
- Ge S, Yang CH, Hsu KS, Ming GL, Song H. A critical period for enhanced synaptic plasticity in newly generated neurons of the adult brain. Neuron. 2007;54:559–566. doi: 10.1016/j.neuron.2007.05.002. [DOI] [PMC free article] [PubMed] [Google Scholar]
- Graziadei PP, Monti Graziadei GA. Neurogenesis and neuron regeneration in the olfactory system of mammals. III. Deafferentation and reinnervation of the olfactory bulb following section of the fila olfactoria in rat. J Neurocytol. 1980;9:145–162. doi: 10.1007/BF01205155. [DOI] [PubMed] [Google Scholar]
- Hayar A, Karnup S, Ennis M, Shipley MT. External tufted cells: a major excitatory element that coordinates glomerular activity. J Neurosci. 2004;24:6676–6685. doi: 10.1523/JNEUROSCI.1367-04.2004. [DOI] [PMC free article] [PubMed] [Google Scholar]
- Hsia AY, Vincent JD, Lledo PM. Dopamine depresses synaptic inputs into the olfactory bulb. J Neurophysiol. 1999;82:1082–1085. doi: 10.1152/jn.1999.82.2.1082. [DOI] [PubMed] [Google Scholar]
- Isaac JT, Crair MC, Nicoll RA, Malenka RC. Silent synapses during development of thalamocortical inputs. Neuron. 1997;18:269–280. doi: 10.1016/s0896-6273(00)80267-6. [DOI] [PubMed] [Google Scholar]
- Isaac JT, Ashby M, McBain CJ. The role of the GluR2 subunit in AMPA receptor function and synaptic plasticity. Neuron. 2007;54:859–871. doi: 10.1016/j.neuron.2007.06.001. [DOI] [PubMed] [Google Scholar]
- Kirson ED, Yaari Y. Synaptic NMDA receptors in developing mouse hippocampal neurones: functional properties and sensitivity to ifenprodil. J Physiol (Lond) 497. 1996;2:437–455. doi: 10.1113/jphysiol.1996.sp021779. [DOI] [PMC free article] [PubMed] [Google Scholar]
- Kosaka K, Toida K, Aika Y, Kosaka T. How simple is the organization of the olfactory glomerulus?: the heterogeneity of so-called periglomerular cells. Neurosci Res. 1998;30:101–110. doi: 10.1016/s0168-0102(98)00002-9. [DOI] [PubMed] [Google Scholar]
- Kullmann DM, Asztely F. Extrasynaptic glutamate spillover in the hippocampus: evidence and implications. Trends Neurosci. 1998;21:8–14. doi: 10.1016/s0166-2236(97)01150-8. [DOI] [PubMed] [Google Scholar]
- Laplagne DA, Esposito MS, Piatti VC, Morgenstern NA, Zhao C, van Praag H, Gage FH, Schinder AF. Functional convergence of neurons generated in the developing and adult hippocampus. PLoS Biol. 2006;4:e409. doi: 10.1371/journal.pbio.0040409. [DOI] [PMC free article] [PubMed] [Google Scholar]
- Lemasson M, Saghatelyan A, Olivo-Marin JC, Lledo PM. Neonatal and adult neurogenesis provide two distinct populations of newborn neurons to the mouse olfactory bulb. J Neurosci. 2005;25:6816–6825. doi: 10.1523/JNEUROSCI.1114-05.2005. [DOI] [PMC free article] [PubMed] [Google Scholar]
- Luskin MB. Restricted proliferation and migration of postnatally generated neurons derived from the forebrain subventricular zone. Neuron. 1993;11:173–189. doi: 10.1016/0896-6273(93)90281-u. [DOI] [PubMed] [Google Scholar]
- Malinow R, Malenka RC. AMPA receptor trafficking and synaptic plasticity. Annu Rev Neurosci. 2002;25:103–126. doi: 10.1146/annurev.neuro.25.112701.142758. [DOI] [PubMed] [Google Scholar]
- Mandairon N, Sacquet J, Jourdan F, Didier A. Long-term fate and distribution of newborn cells in the adult mouse olfactory bulb: influences of olfactory deprivation. Neuroscience. 2006;141:443–451. doi: 10.1016/j.neuroscience.2006.03.066. [DOI] [PubMed] [Google Scholar]
- McGann JP, Pirez N, Gainey MA, Muratore C, Elias AS, Wachowiak M. Odorant representations are modulated by intra- but not interglomerular presynaptic inhibition of olfactory sensory neurons. Neuron. 2005;48:1039–1053. doi: 10.1016/j.neuron.2005.10.031. [DOI] [PubMed] [Google Scholar]
- McQuiston AR, Katz LC. Electrophysiology of interneurons in the glomerular layer of the rat olfactory bulb. J Neurophysiol. 2001;86:1899–1907. doi: 10.1152/jn.2001.86.4.1899. [DOI] [PubMed] [Google Scholar]
- Mizrahi A. Dendritic development and plasticity of adult-born neurons in the mouse olfactory bulb. Nat Neurosci. 2007;10:444–452. doi: 10.1038/nn1875. [DOI] [PubMed] [Google Scholar]
- Mizrahi A, Lu J, Irving R, Feng G, Katz LC. In vivo imaging of juxtaglomerular neuron turnover in the mouse olfactory bulb. Proc Natl Acad Sci USA. 2006;103:1912–1917. doi: 10.1073/pnas.0506297103. [DOI] [PMC free article] [PubMed] [Google Scholar]
- Mombaerts P, Wang F, Dulac C, Chao SK, Nemes A, Mendelsohn M, Edmondson J, Axel R. Visualizing an olfactory sensory map. Cell. 1996;87:675–686. doi: 10.1016/s0092-8674(00)81387-2. [DOI] [PubMed] [Google Scholar]
- Monyer H, Sprengel R, Schoepfer R, Herb A, Higuchi M, Lomeli H, Burnashev N, Sakmann B, Seeburg PH. Heteromeric NMDA receptors: molecular and functional distinction of subtypes. Science. 1992;256:1217–1221. doi: 10.1126/science.256.5060.1217. [DOI] [PubMed] [Google Scholar]
- Mori H, Mishina M. Structure and function of the NMDA receptor channel. Neuropharmacol. 1995;34:1219–1237. doi: 10.1016/0028-3908(95)00109-j. [DOI] [PubMed] [Google Scholar]
- Murphy GJ, Glickfeld LL, Balsen Z, Isaacson JS. Sensory neuron signaling to the brain: properties of transmitter release from olfactory nerve terminals. J Neurosci. 2004;24:3023–3030. doi: 10.1523/JNEUROSCI.5745-03.2004. [DOI] [PMC free article] [PubMed] [Google Scholar]
- Mutoh H, Yuan Q, Knopfel T. Long-term depression at olfactory nerve synapses. J Neurosci. 2005;25:4252–4259. doi: 10.1523/JNEUROSCI.4721-04.2005. [DOI] [PMC free article] [PubMed] [Google Scholar]
- Nakatani H, Serizawa S, Nakajima M, Imai T, Sakano H. Developmental elimination of ectopic projection sites for the transgenic OR gene that has lost zone specificity in the olfactory epithelium. Eur J Neurosci. 2003;18:2425–2432. doi: 10.1046/j.1460-9568.2003.02998.x. [DOI] [PubMed] [Google Scholar]
- Oliet SH, Malenka RC, Nicoll RA. Bidirectional control of quantal size by synaptic activity in the hippocampus. Science. 1996;271:1294–1297. doi: 10.1126/science.271.5253.1294. [DOI] [PubMed] [Google Scholar]
- Overstreet LS, Kinney GA, Liu YB, Billups D, Slater NT. Glutamate transporters contribute to the time course of synaptic transmission in cerebellar granule cells. J Neurosci. 1999;19:9663–9673. doi: 10.1523/JNEUROSCI.19-21-09663.1999. [DOI] [PMC free article] [PubMed] [Google Scholar]
- Pinching AJ, Powell TP. The neuron types of the glomerular layer of the olfactory bulb. J Cell Sci. 1971;9:305–345. doi: 10.1242/jcs.9.2.305. [DOI] [PubMed] [Google Scholar]
- Puopolo M, Belluzzi O. Functional heterogeneity of periglomerular cells in the rat olfactory bulb. Eur J Neurosci. 1998;10:1073–1083. doi: 10.1046/j.1460-9568.1998.00115.x. [DOI] [PubMed] [Google Scholar]
- Rochefort C, Gheusi G, Vincent JD, Lledo PM. Enriched odor exposure increases the number of newborn neurons in the adult olfactory bulb and improves odor memory. J Neurosci. 2002;22:2679–2689. doi: 10.1523/JNEUROSCI.22-07-02679.2002. [DOI] [PMC free article] [PubMed] [Google Scholar]
- Royal SJ, Key B. Development of P2 olfactory glomeruli in P2-internal ribosome entry site-tau-LacZ transgenic mice. J Neurosci. 1999;19:9856–9864. doi: 10.1523/JNEUROSCI.19-22-09856.1999. [DOI] [PMC free article] [PubMed] [Google Scholar]
- Schmidt-Hieber C, Jonas P, Bischofberger J. Enhanced synaptic plasticity in newly generated granule cells of the adult hippocampus. Nature. 2004;429:184–187. doi: 10.1038/nature02553. [DOI] [PubMed] [Google Scholar]
- Treloar HB, Purcell AL, Greer CA. Glomerular formation in the developing rat olfactory bulb. J Comp Neurol. 1999;413:289–304. [PubMed] [Google Scholar]
- Tyler WJ, Petzold GC, Pal SK, Murthy VN. Experience-dependent modification of primary sensory synapses in the mammalian olfactory bulb. J Neurosci. 2007;27:9427–9438. doi: 10.1523/JNEUROSCI.0664-07.2007. [DOI] [PMC free article] [PubMed] [Google Scholar]
- Vicini S, Wang JF, Li JH, Zhu WJ, Wang YH, Luo JH, Wolfe BB, Grayson DR. Functional and pharmacological differences between recombinant N-methyl-d-aspartate receptors. J Neurophysiol. 1998;79:555–556. doi: 10.1152/jn.1998.79.2.555. [DOI] [PubMed] [Google Scholar]
- Wenzel A, Scheurer L, Kunzi R, Fritschy JM, Mohler H, Benke D. Distribution of NMDA receptor subunit proteins NR2A, 2B, 2C, and 2D in rat brain. NeuroReport. 1995;7:45–48. [PubMed] [Google Scholar]
- Whitman MC, Greer CA. Adult-generated neurons exhibit diverse developmental fates. Dev Neurobiol. 2007;67:1079–1093. doi: 10.1002/dneu.20389. [DOI] [PubMed] [Google Scholar]
- Ye GL, Yi S, Gamkrelidze G, Pasternak JF, Trommer BL. AMPA and NMDA receptor-mediated currents in developing dentate gyrus granule cells. Brain Res Dev Brain Res. 2005;155:26–32. doi: 10.1016/j.devbrainres.2004.12.002. [DOI] [PubMed] [Google Scholar]
- Yu CR, Power J, Barnea G, O'Donnell S, Brown HE, Osborne J, Axel R, Gogos JA. Spontaneous neural activity is required for the establishment and maintenance of the olfactory sensory map. Neuron. 2004;42:553–566. doi: 10.1016/s0896-6273(04)00224-7. [DOI] [PubMed] [Google Scholar]
- Zou DJ, Feinstein P, Rivers AL, Mathews GA, Kim A, Greer CA, Mombaerts P, Firestein S. Postnatal refinement of peripheral olfactory projections. Science. 2004;304:1976–1979. doi: 10.1126/science.1093468. [DOI] [PubMed] [Google Scholar]