

Abstract
At the immature calyx of Held, the fast decay phase of a Ca2+ transient induced by tetanic stimulation (TS) was followed by a period of elevated [Ca2+]i for tens of seconds, referred to as posttetanic residual calcium (Cares). We investigated the source of Cares and its contribution to posttetanic potentiation (PTP). After TS (100 Hz for 4 s), posttetanic Cares at the calyx of Held was largely abolished by tetraphenylphosphonium (TPP+) or Ru360, which inhibit mitochondrial Na+-dependent Ca2+ efflux and Ca2+ uniporter, respectively. Whereas the control PTP lasted longer than Cares, inhibition of Cares by TPP+ resulted in preferential suppression of the early phase of PTP, the decay time course of which well matched with that of Cares. TS induced significant increases in release probability (Pr) and the size of the readily releasable pool (RRP), which were estimated from plots of cumulative EPSC amplitudes. TPP+ or Ru360 suppressed the posttetanic increase in Pr, whereas it had little effect on the increase in RRP size. Moreover, the posttetanic increase in Pr, but not in RRP size, showed a linear correlation with the amount of Cares. In contrast, myosin light chain kinase (MLCK) inhibitors and blebbistatin reduced the posttetanic increase in RRP size with no effect on the increase in Pr. Application of TPP+ in the presence of MLCK inhibitor peptide caused further suppression of PTP. These findings suggest that Cares released from mitochondria and activation of MLCK are primarily responsible for the increase in Pr and that in the RRP size, respectively.
Keywords: posttetanic potentiation, residual calcium, mitochondria, myosin light chain kinase, readily releasable pool, calyx of Held
Introduction
Posttetanic potentiation (PTP) is a transient enhancement of synaptic efficacy that lasts tens of seconds after a cessation of tetanic stimulation (TS). It is generally accepted that PTP is presynaptic in origin (for review, see Zucker and Regehr, 2002). The posttetanic residual calcium (Cares) has been a long-standing hypothesis for PTP mechanisms (Kamiya and Zucker, 1994). A linear relationship between the magnitudes of PTP and Cares concentration has been demonstrated at the calyx of Held (Habets and Borst, 2005; Korogod et al., 2005). Although a close temporal correlation between posttetanic recovery of presynaptic Ca2+ concentration ([Ca2+]i) and synaptic enhancement during PTP has been shown at crayfish neuromuscular junctions (NMJs) (Delaney et al., 1989; Delaney and Tank, 1994), it has been recognized that the time course of [Ca2+]i decay is faster than that of PTP at mammalian central synapses, suggesting that PTP is not solely dictated by Cares (Regehr et al., 1994; Korogod et al., 2005) (but see Habets and Borst, 2005). To account for the temporal mismatch between the Cares and PTP, a calcium binding site with slow kinetics has been assumed, but its identity remains elusive (Regehr et al., 1994).
Presynaptic release of synaptic vesicles is largely determined by both the readily releasable pool (RRP) size and release probability (Pr). Recently, it has been shown that increases in both Pr and the RRP size contribute to PTP at the calyx of Held synapse and that the increase in RRP size lasts longer than that in Pr (Habets and Borst, 2007). Interestingly, submicromolar elevation of basal [Ca2+]i (<100 nm) induced by a small depolarization of the calyceal terminal caused a significant increase in Pr with no effect on the RRP size (Awatramani et al., 2005), implying that Cares may have differential effects on the posttetanic increase in Pr and in the RRP size. We investigated the source of Cares at the calyx of Held, and assessed contribution of Cares to the posttetanic increases in Pr and in the RRP size, which were estimated from the plot of cumulative EPSC amplitudes (Schneggenburger et al., 1999). We found that Cares is generated mainly by posttetanic release from mitochondria at the calyx of Held. When mitochondrial Ca2+ release was inhibited to reduce Cares, the increase in Pr, but not the RRP size, was affected. In contrast, inhibitors of myosin light chain kinase (MLCK) reduced specifically the posttetanic increase in the RRP size.
Materials and Methods
Preparation of brainstem slices.
Transverse 180- to 200-μm-thick brainstem slices containing the medial nucleus of trapezoid body (MNTB) were prepared from 6- to 8-d-old Sprague Dawley rats (17 ± 8 g). Rats were decapitated, and brainstems were chilled in ice-cold low-calcium artificial CSF (aCSF), which contained (in mm) 125 NaCl, 25 NaHCO3, 2.5 KCl, 1.25 NaH2PO4, 2.5 MgCl2, 0.5 CaCl2, 25 glucose, 0.4 Na ascorbate, 3 myoinositol, and 2 Na pyruvate [pH 7.4 when saturated with carbogen (95% O2, 5% CO2); osmolarity, ∼320 mOsm]. Brainstem slices were made with a vibratome slicer (VT1000S; Leica), and slices were incubated at 37°C for 30 min in normal aCSF, the constituents of which are the same as low-calcium aCSF except 1 mm MgCl2 and 2 mm CaCl2, and thereafter maintained at room temperature (23–25°C) until required.
Electrophysiological recording and reagents.
Slices were transferred to a recording chamber in an upright microscope (BX50WI; Olympus). Whole-cell patch-clamp recordings from calyces of Held were made under visual control using differential interference illumination. In most experiments, to reduce saturation and desensitization of AMPA receptors, we added 1 mm kynurenic acid (Kyn; Tocris) or 4 mm γ-d-glutamylglycine (γ-DGG) to aCSF, which were denoted as “aCSF + Kyn” or “aCSF + γ-DGG,” respectively, in Results. To preload calyx terminals with Ca2+ indicator dye, we made a brief presynaptic whole-cell recording for ∼90 s with the K-gluconate-containing pipette solution composed of (in mm) 120 K-gluconate, 30 KCl, 20 HEPES, 4 Na2-phosphocreatine, 4 Mg-ATP, 0.3 Na-GTP, and 0.2 fura-4F. The “preloading” technique was also used for delivering lipid-soluble drugs into the cytosol of calyx terminals, because it took too long a time (>50 min) for lipid-soluble drugs to take an effect, and drug effects were often too variable, when they were applied to the bath. Therefore, lipid-soluble drugs including blebbistatin, chelerythrine, Bis-I, and Bis-V were dissolved in dimethylsulfoxide (DMSO) and added to the internal solution such that final concentration of DMSO became 1:1000 (v/v). In these cases, the synapse whose calyx terminal was preloaded with vehicle only (DMSO) was regarded as a control. Postsynaptic recordings were made in voltage-clamp mode at a holding potential of −70 mV. Series resistance (Rs; range, 4–15 MΩ) was regularly checked and partially compensated by up to 75% for remaining uncompensated Rs value of 3–4 MΩ. Experiments were discarded when uncompensated Rs exceeded 15 MΩ. Patch pipettes with a resistance of 3.5–4.5 MΩ were used for recordings. Postsynaptic patch pipettes contained the following (in mm): 110 Cs-gluconate, 20 tetraethylammonium-Cl, 10 NaCl, 20 HEPES, 10 EGTA, 4 Mg-ATP, 5 Na2-phosphocreatine, 5 lidocaine N-ethyl bromide (QX314; an intracellular blocker of Na+ currents), pH 7.3 (adjusted with CsOH). Recordings were made at room temperature (23–25°C) with an EPC10 amplifier (HEKA). EPSCs were evoked by stimulating presynaptic axons (0.1–0.2 ms, 10–20 V) with a bipolar stimulating electrode (TM53CCINSl; World Precision Instruments) placed at the midline of the brainstem. Fura-4F was purchased from Invitrogen. Ru360, ML-7, myosin light chain kinase inhibitor peptide 18 (MLCKip), Ro31-8220, Bis-1, and Bis-5 were obtained from Merck Biosciences. Kynurenate, γ-DGG, QX314, and cyclothiazide were purchased from Tocris. Blebbistatin was from Biomol. Other reagents, including tetraphenylphosphonium (TPP+), were purchased from Sigma.
Presynaptic [Ca2+] imaging.
Calyces of Held were preloaded with 200 μm fura-4F for typically 90 s via presynaptic whole-cell recording with the K-gluconate solution. After withdrawing the patch pipette, [Ca2+]i at the calyx of Held was measured as previously described (Kim et al., 2005). Briefly, excitation light from a monochromator (Polychrome-II; TILL Photonics) was delivered to an upright microscope (BX50; Olympus). Imaging was performed using a 60× water-immersion objective (numerical aperture, 0.9; LUMPlanFl; Olympus) and an air-cooled slow-scan CCD camera (SensiCam; PCO) using on-chip binning (8 × 16 pixels). The fluorescence ratio (r = Fiso/F380) at the isosbestic wavelength (360 nm; Fiso) to that at 380 nm (F380) was converted to [Ca2+]i according to the following equation:
Calibration parameters were determined by “in-cell” calibration. Rmin values were measured using a Ca2+-free internal solution containing 10 mm BAPTA. Rmax values were obtained from in vitro measurement, because calyces of Held did not endure internal dialysis with high CaCl2 (10 mm). The values for the calibration ratio at intermediate [Ca2+]i were measured in the calyx using a pipette solution containing 8 mm BAPTA and 6 mm CaCl2 ([Ca2+]i ≈ 660 nm) for fura-4F. The effective dissociation constant of fura-4F (Keff) was calculated by measuring the fluorescence ratio at these intermediate [Ca2+]i and by rearranging Equation 1 for Keff. The Kd values of fura-4F were calculated as 0.75 μm from Kd = Keff × (α + Rmin)/(α + Rmax), where α is the iso-coefficient. All the estimates of presynaptic [Ca2+] were presented as an excursion of [Ca2+]i (Δ[Ca2+]i) from its resting level ranging from 100 to 200 nm. The decay phase of a Ca2+ transient induced by TS (100 Hz for 4 s) is characterized by a period of slow [Ca2+] decay that lasted tens of seconds. Henceforth, we define posttetanic residual [Ca2+] as Δ[Ca2+]i during the slow decay phase after a fast decay phase of a Ca2+ transient induced by TS. The amount of Cares was quantified as the time integral of Δ[Ca2+]i from 2 s after the end of TS for a period two times longer than the decay time constant of residual [Ca2+]i (denoted by ∫Caresdt).
Statistics and data presentation.
Data are presented as mean ± SEM, with n indicating the number of synapses analyzed. In figures, the number of synapses or calyceal terminals that we studied is indicated as a number in parentheses on each bar. In Results, the first and the second statistical values in parentheses intervened by “vs” represent statistical data under control conditions and under test conditions, respectively. Statistical analyses on data measured at the same synapse and on data at different synapses were performed using the Student's paired t test and the Student's t test, respectively.
Results
PTP results from increases in both the RRP size and Pr at the calyx of Held synapse
We investigated PTP of EPSCs evoked by afferent fiber stimulation at the immature calyx of Held synapse of the rat (postnatal day 6–8). Unless otherwise mentioned, we monitored EPSCs evoked by paired stimuli (interstimulus interval 20 ms) every 10 s in the presence of 1 mm Kyn to prevent desensitization and saturation of postsynaptic AMPA receptors. The mean basal EPSC amplitude was 1.53 ± 0.20 nA (n = 11), which corresponds to 40 ± 4.6% of that in the absence of 1 mm Kyn. At 20 s after TS (100 Hz train of 4 s duration), the EPSC amplitude increased by 100.33 ± 10.6% (n = 19) of control values (Fig. 1E), and the paired-pulse ratio was reduced from 0.91 ± 0.05 to 0.42 ± 0.03 (p < 0.01) (Fig. 1A), indicative of a presynaptic locus of the PTP expression. When PTP was induced repeatedly at the same synapse, no progressive decline of PTP was observed. We assessed TS-induced relative changes in the RRP size and Pr by comparing a plot of cumulative amplitudes of first 20 EPSCs evoked by TS with that of EPSCs evoked by short trains of APs (100 Hz, 20 pulses) applied 20 s after TS (Fig. 1C,D). TS increased both estimates for the RRP size and Pr by 16.5 ± 1.2% and by 70.6 ± 9.0% of control values, respectively (n = 19; p < 0.01, paired t test) (Fig. 1E).
Figure 1.

Changes in the RRP size and Pr during posttetanic potentiation at the calyx of Held synapse. A, EPSCs in response to a pair of fiber stimulation separated by 20 ms (aCSF + Kyn). Baseline EPSC (black) and EPSC recorded after TS (100 Hz for 4 s; gray) are superimposed. B, Time course for PTP of EPSC amplitudes. Time points of TS and stimulation with a short train of action potentials (short AP trains; 100 Hz, 20 pulses) are indicated by black and gray triangles, respectively. C, First 10 EPSCs induced by TS (black) or by short AP trains (gray) applied 20 s after the TS. D, Plot of cumulative (cum.) EPSC amplitudes evoked by TS (black circles) or by a short AP train shown in C. RRP size was estimated at the y-intercept of the back extrapolation line fitted to the last five points. Pr was estimated from the first EPSC amplitude divided by the estimate of RRP size. Both Pr and RRP were increased to 180% and 116% of control values, respectively. E, Mean values for PTP and associated changes in Pr and the RRP size measured 20 s after TS in the presence of 1 mm Kyn (n = 19), 2 mm Kyn (n = 5), or 4 mm γ-DGG (n = 11). Data are mean ± SEM.
To rigorously test whether the saturation and desensitization of AMPA receptors affected our estimates of relative changes in Pr and the RRP size, we repeated experiments in the presence of 2 mm Kyn or 4 mm γ-DGG instead of 1 mm Kyn (Wong et al., 2003). All estimates for the RRP size and Pr and their changes after PTP induction under the different pharmacological conditions are summarized in supplemental Table 1 (available at www.jneurosci.org as supplemental material). We found that relative changes in the RRP size and Pr in the presence of 1 mm Kyn were not different from those in the presence of 2 mm Kyn or 4 mm γ-DGG (Fig. 1E). Therefore, we henceforth presented the statistical data after pooling data obtained in the presence of 1 mm Kyn and those in the presence of 4 mm γ-DGG.
Effects of mitochondrial Na+-dependent Ca2+ efflux inhibitor, TPP+, on Cares and PTP
It has been demonstrated that the magnitude of PTP is linearly correlated with that of residual [Ca2+]i at the calyx of Held synapse (Habets and Borst, 2005; Korogod et al., 2005), but the source of Cares is not known at this synapse. Mitochondria have been suggested as a source of Cares at the motor nerve terminals and at large terminals of hippocampal mossy fibers (Tang and Zucker, 1997; García-Chacón et al., 2006; Lee et al., 2007). TPP+ at low concentration (IC50, 0.2 μm) (Wingrove and Gunter, 1986) is known as a potent and selective inhibitor of mitochondrial Na+-dependent Ca2+ efflux (NCE) with little adverse effects on mitochondrial respiration (Aiuchi et al., 1985). To test whether mitochondrial NCE contributes to presynaptic Cares, we studied the effects of 2 μm TPP+ on presynaptic Cares. For simultaneous recording of presynaptic [Ca2+] and EPSCs, we loaded the calyx with Ca2+-indicator dye via whole-cell patch pipette containing 200 μm fura-4F for a brief period (∼90 s), and pulled off the pipette. Because of the fluorescence of Kyn at UV excitation, when combined with Ca2+ imaging, EPSCs were recorded in the presence of 4 mm γ-DGG.
We compared the time courses of PTP and residual Δ[Ca2+] before and after bath application of 2 μm TPP+ at the same synapse (Fig. 2A). TPP+ had little effect on the basal transmission (0.52 ± 0.15 vs 0.49 ± 0.15 nA; n = 5; p = 0.11, paired t test), but significantly reduced PTP from 131.4 ± 33.6 to 53.4 ± 10.3% (n = 5; p = 0.04) (Figs. 2A, 3Ba). Concomitantly, TPP+ essentially abolished posttetanic Cares (Fig. 2A,D), whereas the Ca2+ buildup during TS was not affected (Fig. 2B,C). In control conditions, there was a significant temporal mismatch between the decay time courses of PTP and accompanying residual Δ[Ca2+]i (Fig. 2A). The decay of TPP+-sensitive PTP (PTP in control conditions minus that in the presence of TPP+), however, occurred with a time course similar to the decay of residual Δ[Ca2+]i (Fig. 2E,F), indicative of a linear relationship between Cares and TPP+-sensitive PTP.
Figure 2.

Effects of mitochondrial NCE inhibitor, TPP+, on PTP and presynaptic residual calcium (Cares) at the calyx of Held synapse. A, Time-dependent changes in EPSC amplitude (open circles, left ordinate) and in presynaptic Cares (gray dots; calibration: 200 nm) simultaneously recorded at the same synapse (aCSF + γ-DGG). TPP+ reduced the time integrals of Cares from 3.89 to 0.46 μm · s. B, Ca2+ transients during TS with expanded time scale (black, control; gray, TPP+). C, D, Mean values for peak [Ca2+] of Ca2+ transients (C) and time integral of Cares (D) induced by TS before and after bath application of TPP+. The estimate for ∫Caresdt was reduced from 2.03 ± 0.50 to 0.37 ± 0.07 μm · s (n = 5; p = 0.03), whereas the mean peak [Ca2+] was little affected (2.77 ± 0.63 μm and 2.75 ± 0.64 μm before and after application of TPP+, respectively; n = 5; p = 0.90). E, TPP+-sensitive PTP (solid line) and Cares (gray dots), calculated from A, decayed with a similar time course (dotted line, an exponential fit to TPP+-sensitive PTP with τ = 39.54 s; τ for Cares = 35.78 s). F, Mean values for decay time constants (τ) of TPP+-sensitive PTP (τ = 23.66 ± 4.34 s; n = 5) and residual Δ[Ca2+]i (τ = 24.61 ± 4.56 s; n = 5). On the bar graphs (C, D, and F), data points measured from the same synapse are connected with a dotted line.
Figure 3.

Effects of TPP+ on posttetanic increases in Pr and in the RRP size. Aa, Ac, First 10 EPSCs induced by TS (black) or by a short AP train (gray) applied 20 s after the TS under control conditions (aCSF + γ-DGG; Aa) and in the presence of 2 μm TPP+ (Ac). Ab, Ad, Plots of cumulative (cum.) EPSC amplitudes recorded before (Ab) and after (Ad) the application of TPP+. EPSCs were recorded from the same synapse as in Figure 2A. The time points when these plots were obtained are indicated by triangles in Figure 2A (black, TS; gray, 20 s after TS). The posttetanic increase in Pr was reduced from 180.9 to 28.3% by TPP+, whereas the increase in RRP size was little affected (from 25.2 to 29.8%). Ba–Bc, Summary of the effects of TPP+ on PTP (Ba) and increases in Pr (Bb) and in the RRP size (Bc) under the “aCSF + γDGG” condition. Dots connected with a dotted line indicate data obtained from the same synapse. C, D, Plot of the posttetanic increase in Pr (C) and in RRP size (D) as a function of residual Δ[Ca2+]. The increase in Pr was linearly correlated with Cares (r = 0.91). Ea–Ec, Mean values for PTP (Ea) and increases in Pr (Eb) and in the RRP size (Ec) measured at the calyx of Held synapse, whose presynaptic terminal had not been preloaded with Ca2+ indicator dye (ctrl, under control conditions, aCSF + Kyn (n = 5) or γ-DGG (n = 6); TPP, in the presence of 2 μm TPP+).
Next, we investigated which component of PTP, when comparing increases in Pr and in the RRP size, is affected by a reduction of ∫Caresdt. TPP+ significantly suppressed the posttetanic increase in Pr (94.3 ± 25.7 vs 26.9 ± 6.4%; n = 5; p = 0.04) (Fig. 3Bb), whereas it had little effect on that in the RRP size (18.7 ± 2.4 vs 19.6 ± 3.2%; p = 0.63) (Fig. 3Bc). The posttetanic increase in Pr, but not in the RRP size, showed a linear relationship with residual Δ[Ca2+]i (r = 0.91) (Fig. 3C,D).
Saturation of intracellular Ca2+ buffer can greatly influence the release probability and thus short-term plasticity (Felmy et al., 2003). To test whether the presence of exogenous Ca2+ buffer exaggerates PTP by the buffer saturation mechanism (Rozov et al., 2001), we assessed the effects of TPP+ on PTP under the conditions not disturbed by Ca2+-indicator dye and in the presence of 1 mm Kyn or 4 mm γ-DGG. TPP+ showed similar effects on the posttetanic increases in Pr and the RRP size, regardless of presynaptic loading with Ca2+-indicator dye (Fig. 3E). TPP+ suppressed PTP from 104.8 ± 10.1 to 52.3 ± 7.6% [n = 11; p < 0.01, paired t test; aCSF + Kyn (n = 5) or γ-DGG (n = 6)]. TPP+ exerts its effect on PTP by suppressing the posttetanic increase in Pr (78.6 ± 8.3 vs 37.1 ± 5.9%; n = 11; p < 0.01) (Fig. 3Eb), because TPP+ did not suppress the posttetanic increase in RRP size (16.1 ± 2.1 vs 16.0 ± 1.6%; n = 11; p = 0.96) (Fig. 3Ec).
Effects of Ru360 on PTP and residual Ca2+
Exposed to high [Ca2+]i, mitochondria take up Ca2+ via the mitochondrial Ca2+ uniporter at the calyx of Held (Billups and Forsythe, 2002; Kim et al., 2005). To test whether mitochondrial Ca2+ uptake during TS is a prerequisite for the generation of Cares, we examined posttetanic Cares at the calyx of Held preloaded with 200 μm fura-4F plus 20 μm Ru360, a specific blocker of Ca2+ uniporter (Kirichok et al., 2004). The calyx terminal preloaded with Ru360 showed significantly higher [Ca2+] increments during TS (100 Hz, 4 s; 2.77 ± 0.63 μm vs 21.97 ± 5.21 μm; p < 0.01) (Fig. 4A), whereas posttetanic Cares was almost abolished [0.42 ± 0.11 μm · s; n = 6; p < 0.01] [Fig. 4Ba (gray dots), Cb]. These results indicate that mitochondrial Ca2+ uptake limits the Ca2+ build-up during TS, and is a prerequisite for Cares. In the presence of presynaptic Ru360, the same TS (100 Hz, 4 s) induced significantly lower PTP than under control conditions (55.0 ± 9.3%; n = 6; p = 0.04) (Fig. 4Ca), whereas the basal EPSC amplitude was not different from control values [0.52 ± 0.15 nA (n = 5) vs 0.43 ± 0.10 nA (n = 6); p = 0.62]. Lower PTP in the presence of Ru360 can be explained primarily by the lower increase in Pr (32.7 ± 7.3%; n = 6; p = 0.03) (Fig. 4Cc), because the increase in RRP size was not different from control values (16.7 ± 1.4%; n = 6; p = 0.48) (Fig. 4Cd). These results further confirm that posttetanic increase in Pr, but not in RRP size, depends on Cares at the calyx of Held synapse.
Figure 4.

Effects of Ru360 on presynaptic Ca2+ dynamics and PTP. The calyx of Held was preloaded with Ru360 (20 μm) together with fura-4F (200 μm). Aa, Ab, Representative Ca2+ transients (Aa) induced by the same TS (100 Hz, 4 s) and mean values for peak [Ca2+] of Ca2+ transients (Ab) under control conditions (black trace) and in the presence of Ru360 (gray trace). Ba, Time course of EPSC amplitude (open circles, left ordinate) and Cares (gray dots, right calibration bar) at the calyx of Held preloaded with Ru360 (aCSF + γ-DGG). Triangles indicate time points when TS (100 Hz, 4 s; black) or a short AP train (100 Hz, 20 pulses; gray) was applied. Bb, First 10 EPSCs during (black) and 20 s after TS (gray). Bc, Plots of cumulative (cum.) EPSC amplitudes during (black) and 20 s after (gray) TS. RRP and Pr were increased by 11.1 and 39.0% of control values, respectively. Ca–Cd, Mean values for PTP (Ca), amount of presynaptic Cares (Cb), and increases in the Pr (Cc) and in the RRP size (Cd) at control synapses (ctrl; aCSF + γ-DGG) and at those preloaded with 20 μm Ru360. Data are mean ± SEM; *p < 0.05; **p < 0.01; unpaired t test.
MLCK inhibitors abolish specifically the posttetanic increase in RRP size
MLCK has been suggested to mediate the mobilization of synaptic vesicles (SVs) in the reserve pool at the NMJ (Verstreken et al., 2005), but its role at hippocampal synapse is controversial (Ryan, 1999; Tokuoka and Goda, 2006). To test the involvement of MLCK in posttetanic change of the RRP size, we studied the effects of ML-7, a specific MLCK inhibitor, on PTP and TS-induced increase in the RRP size. ML-7 (20 μm) suppressed PTP from 131.0 ± 21.1 to 75.4 ± 10.2% [n = 10; p < 0.01, paired t test; aCSF + Kyn (n = 5) or γ-DGG (n = 5)] (Fig. 5Aa,Ba). ML-7 abolished the posttetanic increase in the RRP size (19.8 ± 2.0 vs 1.1 ± 2.0%; p < 0.01) (Fig. 5Bb), but not the increase in Pr (95.5 ± 18.7 vs 78.9 ± 8.9%; p = 0.22) (Fig. 5Bc). ML-7 increased the basal EPSC amplitude by 28.5 ± 12.1 and 42.3 ± 15.6% in the presence of Kyn or γ-DGG, respectively, probably because of recruitment of the fast-releasing SV pool (Srinivasan et al., 2008). This can result in occlusion of posttetanic increase in the RRP size. To further test whether MLCK is involved in the posttetanic increase of the RRP size, we investigated the effects of inhibitors for different steps of the signal transduction pathway involving MLCK: calmodulin inhibitor, MLCK inhibitory peptide, and myosin ATPase inhibitor.
Figure 5.
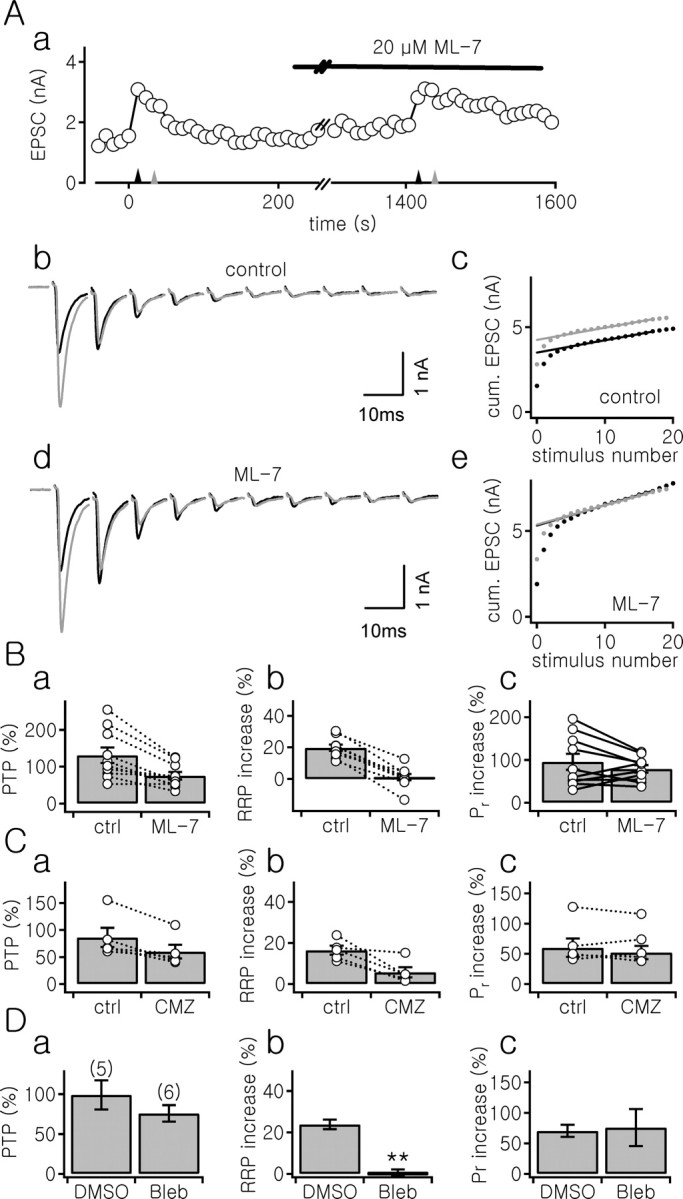
Inhibitors of MLCK or myosin ATPase abolished posttetanic increase in the RRP size with no significant effect on the increase in Pr. Aa, Time course of PTP before and 20 min after bath application of 20 μm ML-7. Triangles indicate time points when TS (100 Hz for 4 s; black) or short AP trains (20 pulses at 100 Hz; gray) was applied. Ab, Ad, First 10 EPSCs during (black) and 20 s after TS (gray) under control conditions (Ab, aCSF + Kyn) and in the presence of ML-7 (Ad). Ac, Ae, Plots of cumulative (cum.) EPSC amplitudes during (black) and 20 s after (gray) TS are superimposed under control conditions (Ac) and after application of ML-7 (Ae). ML-7 suppressed the increase in RRP size from 21.3 to 1.1%, but the increase in Pr was slightly enhanced (from 50.0 to 73.9%). Ba–Cc, Mean values for PTP (Ba, Ca) and increases in the RRP size (Bb, Cb) and Pr (Bc, Cc) under control conditions (ctrl) and 20 min after the bath application of 20 μm ML-7 (Ba–Bc) or 20 μm calmidazolium (CMZ; Ca–Cc). Ba–Bc, aCSF + Kyn (n = 5) or γ-DGG (n = 5); Ca–Cc, aCSF + Kyn (n = 5). Da–Dc, Mean values for PTP (Da) and increases in the RRP size (Db) and in Pr (Dc) at the synapse preloaded with vehicle only (1:1000 DMSO; DMSO, aCSF + γ-DGG; n = 5) or with 100 μm blebbistatin (Bleb; n = 6). Data are mean ± SEM; **p < 0.01.
Activation of MLCK requires binding of Ca2+/calmodulin (CaM) to its regulatory segment (Kamm and Stull, 2001). Bath application of calmidazolium (20 μm), a calmodulin antagonist, reduced PTP from 86.2 ± 17.7 to 59.9 ± 12.7% (n = 5; p = 0.02, paired t test; aCSF + Kyn) (Fig. 5Ca), whereas the basal EPSC amplitude was not significantly affected (1.58 ± 0.30 nA vs 1.78 ± 0.37 nA; p = 0.1). Similar to ML-7, calmidazolium suppressed posttetanic increase in the RRP size (16.5 ± 2.2 vs 5.7 ± 2.5%; p = 0.02) (Fig. 5Cb), with no effect on the posttetanic Pr increase (60.0 ± 15.1 vs 52.2 ± 11.0%; p = 0.4) (Fig. 5Cc).
MLCK phosphorylates the myosin regulatory light chain, which in turn enhances the myosin ATPase activity. Myosin II has been suggested to modulate neurotransmission at sympathetic neuron (Takagishi et al., 2005). To test whether myosin II is involved in the posttetanic increase in RRP size, 100 μm blebbistatin, a specific myosin II ATPase inhibitor, was introduced into the presynaptic terminal using the preloading technique. The basal EPSC amplitude was significantly lower at the synapse preloaded with blebbistatin than that at synapse preloaded with vehicle only [1:1000 DMSO; 0.85 ± 0.16 nA (n = 5) vs 0.35 ± 0.09 nA (n = 6); p = 0.02; aCSF + γ-DGG]. Blebbistatin abolished specifically the posttetanic increase in the RRP size (24.0 ± 2.8 vs 0.35 ± 1.8%; p < 0.01) with no significant effect on the increase in Pr (70.5 ± 10.0 vs 76.0 ± 12.4%; p = 0.75) (Fig. 5D).
Next, we tested the effects of MLCKip. The inhibitory mechanism of MLCKip is based on the autoinhibitory sequence of MLCK, independent of CaM, and it shows very high specificity for MLCK with no inhibition of Ca2+/CaM kinase II or protein kinase A (IC50 = 50 nm) (Lukas et al., 1999). PTP was assessed at the calyx of Held synapse preloaded with 5 μm MLCKip. Similar to the effects of pseudosubstrate peptide of MLCK on EPSPs in sympathetic neurons (Mochida et al., 1994), MLCKip significantly reduced the basal EPSC amplitude [1.55 ± 0.15 nA (n = 19) vs 0.57 ± 0.09 nA (n = 10); p < 0.01; aCSF + Kyn]. At synapses preloaded with MLCKip, the mean value for PTP was significantly lower than that at control synapses (100.3 ± 10.6 vs 64.9 ± 10.5%; p = 0.04) (Fig. 6Ba). The lower PTP can be ascribed to the negligible posttetanic increase in the RRP size (16.5 ± 1.2 vs 1.2 ± 1.7%; p < 0.01) (Fig. 6Bb), because MLCKip had less effect on the increase in Pr (70.6 ± 9.0 vs 62.2 ± 9.4%; p = 0.56) (Fig. 6Bc). These results strongly suggest that activation of MLCK is responsible for the posttetanic increase in RRP size at the calyx of Held synapse. Finally, we tested whether the effects of TPP+ and MLCKip on PTP are additive. When 2 μm TPP+ was bath applied in the presence of MLCKip, PTP was further suppressed from 72.2 ± 13.8 to 20.5 ± 7.4% (n = 7; p < 0.01, paired t test; aCSF + Kyn) (Fig. 6A,Ba). In the presence of MLCKip, TPP+ reduced only the posttetanic increase in Pr from 70.2 ± 12.0 to 21.4 ± 8.0% (n = 7; p = 0.01) (Fig. 6Bc) with no effect on the RRP size (Fig. 6Bb).
Figure 6.

Additive inhibition of PTP by TPP+ and MLCKip. Aa, Time course of PTP at the calyceal synapse preloaded with 5 μm MLCKip (for 90 s) before and after bath application of TPP+. Triangles indicate time points when TS (100 Hz for 4 s, black) or short AP trains (20 pulses at 100 Hz; gray) were applied. Ab–Ae, First 10 EPSCs during (black) TS and 20 s after (gray) TS at the synapse preloaded with MLCKip before (Ab) and after (Ad) superfusion of 2 μm TPP+. Plots of cumulative (cum.) EPSC amplitudes during (black) and 20 s after (gray) TS at the same synapse are shown in Ac and Ae (black dots, during TS; gray dots, 20 s after TS). Ba–Bc, Mean values for PTP (Ba) and increases in the RRP size (Bb) and Pr (Bc) at the synapse preloaded with 5 μm MLCKip before and after bath application of TPP+. For comparison, statistical data under control conditions (ctrl, aCSF + Kyn; n = 19) were reproduced from Figure 1E. Statistical difference between ctrl and MLCKip: *p < 0.05, **p < 0.01, unpaired t test.
Summary for the effects of Cares and MLCK inhibitors
In Figure 7A, we summarize the effects of various inhibitors on PTP and increases in Pr and the RRP size. For comparison, we pooled data obtained with drugs targeting Cares into one group and those obtained with drugs targeting MLCK into another group, because the observed effects were statistically not different. In addition we summarize the results obtained for combined application of MLCKip plus TPP+. The bar graphs in Figure 7A demonstrate that Pr and the RRP size are independently regulated during PTP by Cares and MLCK, respectively. Finally, we examined the decay time constants of PTP under control conditions and PTP components sensitive to TPP+ or to ML-7 (Fig. 7B). We excluded from analysis synapses at which we lost the patch before PTP was fully decayed. At 11 of 21 synapses, the time course of control PTP was best fitted with biexponential function with fast and slow time constants of 24.2 ± 2.5 s and 50.0 ± 4.0 s, respectively (n = 11). At other synapses, PTP decayed monoexponentially with a time constant of 49.6 ± 2.5 s (n = 10). Regardless of whether the decay of PTP follows monoexponential or biexponential time course under control conditions, the PTP component sensitive to TPP+ (denoted by “TPP diff” in Fig. 7B) decayed with a time constant (25.7 ± 2.3 s; n = 13) similar to the fast component of biexponential decay of control PTP (denoted by “ctrl fast” in Fig. 7B). In contrast, the decay time constant of the PTP component sensitive to ML-7 (denoted by “ML-7 diff”; 47.1 ± 2.7 s; n = 8) was similar to the slow time constant of control PTP (p = 0.59), which is distinct from that of TPP+-sensitive PTP. These results suggest that PTP at the calyx of Held synapse is composed of fast and slow decaying components that are regulated by Cares and MLCK, respectively.
Figure 7.

Aa–Ac, Summary for the effects of mitochondrial Cares inhibitors and MLCK inhibitors on PTP (Aa) and increases in the RRP size (Ab) and in Pr (Ac). There was no statistical difference between the effect of TPP+ and that of Ru360, and the data were pooled. The data in the presence of ML-7, calmidazolium (CMZ), blebbistatin (Bleb), or MLCKip were pooled for the same reason. The statistical difference from a control value, **p < 0.01 (unpaired t test). ns, Not significant. B, Mean values for decay time constants of PTP under control conditions and the PTP components sensitive to TPP+ (denoted by “TPP+ diff”) or ML7 (denoted by “ML-7 diff”). The decay time constant of TPP+-sensitive PTP (reproduced from Fig. 2C) was significantly faster than that of ML7-sensitive PTP (**p < 0.01). The decay time constant for PTP remaining after the combined treatment with TPP+ and MLCKip was also similar to the slow time constant (49.7 ± 1.6 s; n = 6; p = 0.96). Numbers in parentheses are the number of synapses investigated.
Role of protein kinase C in PTP
The above results indicate that Cares and activation of MLCK can explain ∼80% of PTP. Recently, however, Korogod et al. (2007) have reported that PTP was abolished by protein kinase C (PKC) inhibitors, bisindolylmaleimide (Bis) drugs: Bis-I or Ro31-8220. To resolve this discrepancy, we compared PTP at the synapse preloaded with Bis drugs or an inactive analog, Bis-V. The results are summarized in Figure 8, and EPSC traces are presented in supplemental Fig. S1 (available at www.jneurosci.org as supplemental material). Not only Bis-1 (2 μm) and Ro31-8220 (2 μm) but also Bis-V (2 μm) significantly suppressed PTP (Fig. 8), indicating that PKC-independent mechanisms may be involved in the inhibitory effects of Bis drugs. Three drugs abolished the posttetanic increase in RRP size. Because posttetanic increase in Pr was significantly suppressed by Bis-I and Bis-V, but not by Ro31-8220, we tested the effect of these drugs on Cares. Consistently, Cares was abolished by Bis-I and Bis-V, but not by Ro31-8220 (supplemental Fig. S1A–C, available at www.jneurosci.org as supplemental material), suggesting that Bis-1 affects mitochondrial Ca2+ handling regardless of PKC. The Bis drugs inhibit PKC by competing with ATP (Toullec et al., 1991). We tested the effects of chelerythrine, which inhibits PKC by covalently reacting with catalytic domain (Gopalakrishna et al., 1995). PTP persisted at the synapse preloaded with 5 μm chelerythrine (Fig. 8; supplemental Fig. S1D, available at www.jneurosci.org as supplemental material). PTP and the increase in Pr were slightly reduced in the presence of chelerythrine with no statistical significance (p = 0.2 and p = 0.15, respectively). These results indicate that at least a part of inhibitory effects of Bis drugs may not be related to the inhibition of PKC.
Figure 8.

The effects of PKC inhibitors on PTP at the calyx of Held synapse. Mean values ± SEM for PTP and relative changes in the RRP size and Pr estimated at the synapse preloaded with DMSO (1:1000, v/v; n = 5), 2 μm Bis-I (n = 5), 2 μm Ro31-8220 (n = 4), 2 μm Bis-V (n = 4), or 5 μm chelerythrine (Che; n = 6) are shown. Note that the posttetanic increase in RRP size was abolished not only by Bis-I or Ro31-8220 but also by an inactive analog, Bis-V (−4.16 ± 2.77%; n = 4; p < 0.01). PTP at the synapse preloaded with 5 μm chelerythrine (84.0 ± 15.1%; n = 6; p = 0.23) was not different from that at the synapse with DMSO (1/1000, 112.0 ± 15.9%; n = 5). Statistical data in each condition were compared with data obtained from the synapse preloaded with DMSO unless specified otherwise. *p < 0.05; **p < 0.01.
Discussion
The principal findings of the present study are that (1) Cares is generated by posttetanic Ca2+ release via NCE subsequent to mitochondrial Ca2+ uptake during TS; (2) Cares and activation of MLCK independently mediate the posttetanic increases in Pr and the RRP size, respectively; and (3) the increase in RRP size lasted longer than Cares, and constitutes a part of the slow decay phase of PTP at the calyx of Held synapse. These findings may provide an explanation for the long-standing question of why presynaptic Cares decays faster than PTP at mammalian central synapses. The involvement of MLCK in PTP is of general importance for short-term synaptic plasticity.
Our results indicate that the increase in Pr contributes more to PTP than that in the RRP size. It should be noted, however, that the present study was done at immature synapses and at room temperature. Given that mitochondria in the calyx of Held compete for cytosolic Ca2+ with Na+/Ca2+ exchanger (Kim et al., 2005), developmental increase in Na+/Ca2+ exchanger activity (our unpublished observations) might limit mitochondrial uptake of Ca2+ during TS, a prerequisite for posttetanic Cares. Moreover, the decay of the posttetanic Pr increase is preferentially accelerated at physiological temperature with little effect on the change in RRP size (Habets and Borst, 2007). Therefore, residual calcium, which subserves the increase in Pr, might contribute less to PTP at mature synapses under physiological conditions.
Mechanisms underlying the posttetanic increase in Pr
Downstream mechanisms of Cares responsible for the increase in Pr are not clear. Saturation of endogenous Ca2+ buffers or increase in Ca2+ influx may underlie the increase in Pr (Felmy et al., 2003; Habets and Borst, 2006). Recently, Korogod et al. (2007) suggested that the latter is not sufficient to explain the Pr increase, and that activation of PKC contributes to the posttetanic Pr increase. The results in Figure 8, however, indicate that further experiments are necessary to clarify the role of PKC for PTP at the calyx of Held synapse.
Recently, we have reported that Cares derived from mitochondria and activation of PKC differentially contribute to PTP at large and small mossy fiber (MF) boutons of dentate granule cells (Lee et al., 2007). Cares-dependent PTP has been observed only at exceptionally large presynaptic terminals such as NMJs, large mossy fiber boutons, and calyces of Held, suggesting a higher contribution of mitochondrial Ca2+ uptake during TS to the Ca2+ clearance at large presynaptic terminals than at small boutons. In the same paper, we also reported that PTP at large MF synapses was not inhibited by PKC inhibitors (chelerythrine and Ro31-8220). Interestingly, we observed that both Bis-I and Bis-V suppressed PTP at large MF synapses to a similar extent (our unpublished observations). This result is consistent with our observation that Bis-I and Bis-V suppress Cares at the calyx of Held (supplemental Fig. S1, available at www.jneurosci.org as supplemental material), and thus one should be cautious in interpreting the effects of Bis-I on PTP.
Posttetanic increase in the RRP size
It has been firmly established that desensitization and saturation of AMPA receptors contribute to the synaptic depression during strong synaptic activity (Trussell et al., 1993; Otis et al., 1996; Wong et al., 2003). The absolute value for the RRP size should be underestimated in the presence of 1 mm Kyn without cyclothiazide (CTZ). Consistent with Korogod et al. (2005), we found that in the presence of 1 mm Kyn plus 100 μm CTZ, the relative increase in estimates for the RRP size was negligible. However, when Kyn was elevated from 1 to 2 mm, RRP size estimates were significantly higher after induction of PTP (supplemental Fig. S2B, available at www.jneurosci.org as supplemental material). This may indicate that the addition of 1 mm Kyn is insufficient to fully relieve AMPA receptor saturation during 100 Hz trains when CTZ is present in the bath. The decay time course of PTP was significantly slower in the presence of CTZ than that under control conditions, and the enhancement of EPSC did not subside at least until 5 min after TS; probably long-term potentiation of EPSC was induced (supplemental Fig. S2C, available at www.jneurosci.org as supplemental material). This result might be caused by nonspecific presynaptic effects of CTZ (Ishikawa and Takahashi, 2001). Therefore, we consider the use of CTZ problematic when studying the mechanisms of PTP at the calyx of Held synapse.
Because estimates of the RRP size from plots of cumulative EPSC amplitudes largely represent the fast-releasing pool (Schneggenburger et al., 2002; Sakaba, 2006), the TS-induced increase in the RRP size observed in the present study may represent an increase in the size of a fast-releasing pool rather than in a slow-releasing pool. In contrast, when the size of RRP was estimated by hypertonic sucrose, an increase in Pr, but not in the RRP size, was induced during augmentation in cultured hippocampal neurons (Stevens and Wesseling, 1999). The discrepancy may be ascribed to the fact that RRP estimates from cumulative EPSCs plots represent only a part of the RRP size reported by hypertonic sucrose (Moulder and Mennerick, 2005).
Role of MLCK in the posttetanic increase in the RRP size
It is not clear whether the mechanism responsible for replenishment of SV pools after depletion is similar to that for the posttetanic increase in RRP size. We showed that the posttetanic increase in RRP size was not affected by inhibition of Cares (Figs. 3B, 4C). Moreover, no linear correlation was found between the amount of posttetanic Cares and the change in RRP size (Fig. 3D), indicating that Cares plays little role in posttetanic regulation of the RRP size. Therefore, activation of MLCK induced by the Ca2+ build-up during TS seems to be primarily responsible for the posttetanic increase in RRP size. This result is contrasted with the recent report that replenishing rate of fast-releasing pool is linearly dependent on [Ca2+]i (Hosoi et al., 2007). Activation of myosin II by MLCK is thought to be a mediator for mobilization and recruitment of SVs at NMJs, where inhibition of MLCK caused intermittent failure of neurotransmission during TS (Polo-Prada et al., 2005). However, we did not observed any difference in late steady-state neurotransmission during 100 Hz stimulation in the presence of MLCK inhibitor or blebbistatin, suggesting that inhibition of MLCK has little effect on the vesicle recruitment during TS. Consistent with this view, Srinivasan et al. (2008) have recently reported that ML-7 affects neither the steady-state EPSCs nor the rate of recovery from synaptic depression. Therefore, we imagine that the mechanisms underlying posttetanic increase in the RRP size might be different from that underlying replenishment of fast SV pool after depletion.
Possible physiological role of PTP in development of calyx of Held synapses
The calyx of Held synapse is a sign-inverting synapse, for which synaptic transmission with high fidelity of spike timing is essential. The task of the calyx of Held synapse might be interfered with by activity-dependent plastic changes of the synaptic connectivity, including PTP. Consistently, it has been reported that PTP is reduced as the synapse matures (Korogod et al., 2005). We consider a possibility that PTP contributes to the maturation of calyx of Held synapse. Recently, Joshi et al. (2007) reported that extrasynaptic NMDA receptors (NMDARs) are downregulated by pairing a depolarization of the postsynaptic neuron and burst stimulation of afferent axon fibers, probably by the mechanism of coincident activation of postsynaptic metabotropic glutamate receptors and NMDARs. It remains to be addressed whether such strong stimuli are possible under physiological conditions during a developmental period of hearing onset. We imagine that PTP at this synapse could provide an answer to this question, because an appreciable amount of PTP still remains at the age of hearing onset (Korogod et al., 2005). Sound stimulus elicits presynaptic bursts of high frequencies up to 600 Hz at the MNTB units in vivo (Kopp-Scheinpflug et al., 2003), suggesting that hearing onset will be accompanied with increased episodes of tetanic stimulation of MNTB neurons. It is conceivable that a prolonged tone burst might induce PTP of subsequent spontaneous synaptic activities. Enhanced glutamate release into synaptic cleft during PTP may facilitate the coincident activation and contribute to downregulation of extrasynaptic NMDARs.
Footnotes
This work was supported by a grant (M103KV010008-06K2201-00810) from Brain Research Center of the 21st Century Frontier Research Program funded by the Ministry of Science and Technology, the Republic of Korea. J.S.L. is a postgraduate student supported by Program BK21 from the Ministry of Education. We are grateful to Drs. Neher and Sakaba for critical reading of this manuscript.
References
- Aiuchi T, Matsunaga M, Nakaya K, Nakamura Y. Effects of probes of membrane potential on metabolism in synaptosome. Biochim Biophys Acta. 1985;843:20–24. doi: 10.1016/0304-4165(85)90044-3. [DOI] [PubMed] [Google Scholar]
- Awatramani GB, Price GD, Trussell LO. Modulation of transmitter release by presynaptic resting potential and background calcium levels. Neuron. 2005;48:109–121. doi: 10.1016/j.neuron.2005.08.038. [DOI] [PubMed] [Google Scholar]
- Billups B, Forsythe ID. Presynaptic mitochondrial calcium sequestration influences transmission at mammalian central synapses. J Neurosci. 2002;22:5840–5847. doi: 10.1523/JNEUROSCI.22-14-05840.2002. [DOI] [PMC free article] [PubMed] [Google Scholar]
- Delaney KR, Tank DW. A quantitative measurement of the dependence of short-term synaptic enhancement on presynaptic residual calcium. J Neurosci. 1994;14:5885–5902. doi: 10.1523/JNEUROSCI.14-10-05885.1994. [DOI] [PMC free article] [PubMed] [Google Scholar]
- Delaney KR, Zucker RS, Tank DW. Calcium in motor nerve terminals associated with posttetanic potentiation. J Neurosci. 1989;9:3558–3567. doi: 10.1523/JNEUROSCI.09-10-03558.1989. [DOI] [PMC free article] [PubMed] [Google Scholar]
- Felmy F, Neher E, Schneggenburger R. Probing the intracellular calcium sensitivity of transmitter release during synaptic facilitation. Neuron. 2003;37:801–811. doi: 10.1016/s0896-6273(03)00085-0. [DOI] [PubMed] [Google Scholar]
- García-Chacón LE, Nguyen KT, David G, Barrett EF. Extrusion of Ca2+ from mouse motor terminal mitochondria via a Na+/Ca2+ exchanger increases post-tetanic evoked release. J Physiol. 2006;574:663–675. doi: 10.1113/jphysiol.2006.110841. [DOI] [PMC free article] [PubMed] [Google Scholar]
- Gopalakrishna R, Chen ZH, Gundimeda U. Modifications of cysteine-rich regions in protein kinase C induced by oxidant tumor promoters and enzyme-specific inhibitors. Methods Enzymol. 1995;252:132–146. doi: 10.1016/0076-6879(95)52016-3. [DOI] [PubMed] [Google Scholar]
- Habets RLP, Borst JGG. Post-tetanic potentiation in the rat calyx of Held synapse. J Physiol. 2005;564:173–187. doi: 10.1113/jphysiol.2004.079160. [DOI] [PMC free article] [PubMed] [Google Scholar]
- Habets RLP, Borst JGG. An increase in calcium influx contributes to post-tetanic potentiation at the rat calyx of Held synapse. J Neurophysiol. 2006;96:2868–2876. doi: 10.1152/jn.00427.2006. [DOI] [PubMed] [Google Scholar]
- Habets RLP, Borst JGG. Dynamics of the readily releasable pool during post-tetanic potentiation in the rat calyx of Held synapse. J Physiol. 2007;581:467–478. doi: 10.1113/jphysiol.2006.127365. [DOI] [PMC free article] [PubMed] [Google Scholar]
- Hosoi N, Sakaba T, Neher E. Quantitative analysis of calcium-dependent vesicle recruitment and its functional role at the calyx of Held synapse. J Neurosci. 2007;27:14286–14298. doi: 10.1523/JNEUROSCI.4122-07.2007. [DOI] [PMC free article] [PubMed] [Google Scholar]
- Ishikawa T, Takahashi T. Mechanisms underlying presynaptic facilitatory effect of cyclothiazide at the calyx of Held of juvenile rats. J Physiol. 2001;533:423–431. doi: 10.1111/j.1469-7793.2001.0423a.x. [DOI] [PMC free article] [PubMed] [Google Scholar]
- Joshi I, Yang Y-M, Wang L-Y. Coincident activation of metabotropic glutamate receptors and NMDA receptors (NMDARs) downregulates perisynaptic/extrasynaptic NMDARs and enhances high-fidelity neurotransmission at the developing calyx of Held synapse. J Neurosci. 2007;27:9989–9999. doi: 10.1523/JNEUROSCI.2506-07.2007. [DOI] [PMC free article] [PubMed] [Google Scholar]
- Kamiya H, Zucker RS. Residual Ca2+ and short-term synaptic plasticity. Nature. 1994;371:603–606. doi: 10.1038/371603a0. [DOI] [PubMed] [Google Scholar]
- Kamm KE, Stull JT. Dedicated myosin light chain kinases with diverse cellular functions. J Biol Chem. 2001;276:4527–4530. doi: 10.1074/jbc.R000028200. [DOI] [PubMed] [Google Scholar]
- Kim MH, Korogod N, Schneggenburger R, Ho WK, Lee SH. Interplay between Na+/Ca2+ exchangers and mitochondria in Ca2+ clearance at the calyx of Held. J Neurosci. 2005;25:6057–6065. doi: 10.1523/JNEUROSCI.0454-05.2005. [DOI] [PMC free article] [PubMed] [Google Scholar]
- Kirichok Y, Krapivinsky G, Clapham DE. The mitochondrial calcium uniporter is a highly selective ion channel. Nature. 2004;427:360–364. doi: 10.1038/nature02246. [DOI] [PubMed] [Google Scholar]
- Kopp-Scheinpflug C, Lippe WR, Dörrscheidt GJ, Rübsamen R. The medial nucleus of the trapezoid body in the gerbil is more than a relay: comparison of pre- and postsynaptic activity. J Assoc Res Otolaryngol. 2003;4:1–23. doi: 10.1007/s10162-002-2010-5. [DOI] [PMC free article] [PubMed] [Google Scholar]
- Korogod N, Lou X, Schneggenburger R. Presynaptic Ca2+ requirements and developmental regulation of posttetanic potentiation at the calyx of Held. J Neurosci. 2005;25:5127–5137. doi: 10.1523/JNEUROSCI.1295-05.2005. [DOI] [PMC free article] [PubMed] [Google Scholar]
- Korogod N, Lou X, Schneggenburger R. Posttetanic potentiation critically depends on an enhanced Ca2+ sensitivity of vesicle fusion mediated by presynaptic PKC. Proc Natl Acad Sci U S A. 2007;104:15923–15928. doi: 10.1073/pnas.0704603104. [DOI] [PMC free article] [PubMed] [Google Scholar]
- Lee D, Lee KH, Ho WK, Lee SH. Target cell-specific involvement of presynaptic mitochondria in post-tetanic potentiation at hippocampal mossy fiber synapses. J Neurosci. 2007;27:13603–13613. doi: 10.1523/JNEUROSCI.3985-07.2007. [DOI] [PMC free article] [PubMed] [Google Scholar]
- Lukas TJ, Mirzoeva S, Slomczynska U, Watterson DM. Identification of novel classes of protein kinase inhibitors using combinatorial peptide chemistry based on functional genomics knowledge. J Med Chem. 1999;42:910–919. doi: 10.1021/jm980573a. [DOI] [PubMed] [Google Scholar]
- Mochida S, Kobayashi H, Matsuda Y, Yuda Y, Muramoto K, Nonomura Y. Myosin II is involved in transmitter release at synapses formed between rat sympathetic neurons in culture. Neuron. 1994;13:1131–1142. doi: 10.1016/0896-6273(94)90051-5. [DOI] [PubMed] [Google Scholar]
- Moulder KL, Mennerick S. Reluctant vesicles contribute to the total readily releasable pool in glutamatergic hippocampal neurons. J Neurosci. 2005;25:3842–3850. doi: 10.1523/JNEUROSCI.5231-04.2005. [DOI] [PMC free article] [PubMed] [Google Scholar]
- Otis T, Zhang S, Trussell LO. Direct measurement of AMPA receptor desensitization induced by glutamatergic synaptic transmission. J Neurosci. 1996;16:7496–7504. doi: 10.1523/JNEUROSCI.16-23-07496.1996. [DOI] [PMC free article] [PubMed] [Google Scholar]
- Polo-Parada L, Plattner F, Bose C, Landmesser LT. NCAM 180 acting via a conserved C-terminal domain and MLCK is essential for effective transmission with repetitive stimulation. Neuron. 2005;46:917–931. doi: 10.1016/j.neuron.2005.05.018. [DOI] [PubMed] [Google Scholar]
- Regehr WG, Delaney KR, Tank DW. The role of presynaptic calcium in short-term enhancement at the hippocampal mossy fiber synapse. J Neurosci. 1994;14:523–537. doi: 10.1523/JNEUROSCI.14-02-00523.1994. [DOI] [PMC free article] [PubMed] [Google Scholar]
- Rozov A, Burnashev N, Sakmann B, Neher E. Transmitter release modulation by intracellular Ca2+ buffers in facilitating and depressing nerve terminals of pyramidal cells in layer 2/3 of the rat neocortex indicates a target cell-specific difference in presynaptic calcium dynamics. J Physiol. 2001;531:807–826. doi: 10.1111/j.1469-7793.2001.0807h.x. [DOI] [PMC free article] [PubMed] [Google Scholar]
- Ryan TA. Inhibitors of myosin light chain kinase block synaptic vesicle pool mobilization during action potential firing. J Neurosci. 1999;19:1317–1323. doi: 10.1523/JNEUROSCI.19-04-01317.1999. [DOI] [PMC free article] [PubMed] [Google Scholar]
- Sakaba T. Roles of the fast-releasing and slowly releasing vesicles in synaptic transmission at the calyx of Held. J Neurosci. 2006;26:5863–5871. doi: 10.1523/JNEUROSCI.0182-06.2006. [DOI] [PMC free article] [PubMed] [Google Scholar]
- Schneggenburger R, Meyer AC, Neher E. Released fraction and total size of a pool of immediately available transmitter quanta at a calyx synapse. Neuron. 1999;23:399–409. doi: 10.1016/s0896-6273(00)80789-8. [DOI] [PubMed] [Google Scholar]
- Schneggenburger R, Sakaba T, Neher E. Vesicle pools and short-term synaptic depression: lessons from a large synapse. Trends Neurosci. 2002;25:206–212. doi: 10.1016/s0166-2236(02)02139-2. [DOI] [PubMed] [Google Scholar]
- Srinivasan G, Kim JH, von Gersdorff H. The pool of fast releasing vesicles is augmented by myosin light chain kinase inhibition at the calyx of Held synapse. J Neurophysiol. 2008;99:1810–1824. doi: 10.1152/jn.00949.2007. [DOI] [PubMed] [Google Scholar]
- Stevens CF, Wesseling JF. Augmentation is a potentiation of the exocytotic process. Neuron. 1999;22:139–146. doi: 10.1016/s0896-6273(00)80685-6. [DOI] [PubMed] [Google Scholar]
- Takagishi Y, Futaki S, Itoh K, Espreafico EM, Murakami N, Murata Y, Mochida S. Localization of myosin II and V isoforms in cultured rat sympathetic neurones and their potential involvement in presynaptic function. J Physiol. 2005;569:195–208. doi: 10.1113/jphysiol.2005.095943. [DOI] [PMC free article] [PubMed] [Google Scholar]
- Tang Y, Zucker RS. Mitochondrial involvement in post-tetanic potentiation of synaptic transmission. Neuron. 1997;18:483–491. doi: 10.1016/s0896-6273(00)81248-9. [DOI] [PubMed] [Google Scholar]
- Tokuoka H, Goda Y. Myosin light chain kinase is not a regulator of synaptic vesicle trafficking during repetitive exocytosis in cultured hippocampal neurons. J Neurosci. 2006;26:11606–11614. doi: 10.1523/JNEUROSCI.3400-06.2006. [DOI] [PMC free article] [PubMed] [Google Scholar]
- Toullec D, Pianetti P, Coste H, Bellevergue P, Grand-Perret T, Ajakane M, Baudet V, Boissin P, Boursier E, Loriolle F. The bisindolylmaleimide GF 109203X is a potent and selective inhibitor of protein kinase C. J Biol Chem. 1991;266:15771–15781. [PubMed] [Google Scholar]
- Trussell LO, Zhang S, Raman IM. Desensitization of AMPA receptors upon multiquantal neurotransmitter release. Neuron. 1993;10:1185–1196. doi: 10.1016/0896-6273(93)90066-z. [DOI] [PubMed] [Google Scholar]
- Verstreken P, Ly CV, Venken KJT, Koh T-W, Zhou Y, Bellen HJ. Synaptic mitochondria are critical for mobilization of reserve pool vesicles at Drosophila neuromuscular junctions. Neuron. 2005;47:365–378. doi: 10.1016/j.neuron.2005.06.018. [DOI] [PubMed] [Google Scholar]
- Wingrove DE, Gunter TE. Kinetics of mitochondrial calcium transport. II. A kinetic description of the sodium-dependent calcium efflux mechanism of liver mitochondria and inhibition by ruthenium red and by tetraphenylphosphonium. J Biol Chem. 1986;261:15166–15171. [PubMed] [Google Scholar]
- Wong AYC, Graham BP, Billups B, Forsythe ID. Distinguishing between presynaptic and postsynaptic mechanisms of short-term depression during action potential trains. J Neurosci. 2003;23:4868–4877. doi: 10.1523/JNEUROSCI.23-12-04868.2003. [DOI] [PMC free article] [PubMed] [Google Scholar]
- Zucker RS, Regehr WG. Short-term synaptic plasticity. Annu Rev Physiol. 2002;64:355–405. doi: 10.1146/annurev.physiol.64.092501.114547. [DOI] [PubMed] [Google Scholar]