

Abstract
In common with other secondary motor areas, the macaque ventral premotor cortex (PMv) gives rise to corticospinal projections; it also makes numerous reciprocal corticocortical connections with the primary motor cortex (M1). Repetitive intracortical microstimulation (rICMS) of the PMv gives rise to movements of the hand and digits. To investigate whether these motor effects are dependent on the corticocortical interactions with M1, the effect of reversible inactivation of the M1 hand area was tested in three macaque monkeys with chronically implanted intracortical electrodes in the hand representations of M1 and PMv (rostral division, area F5). Monkeys were lightly sedated. Test EMG responses to rICMS were recorded from intrinsic hand muscles before and after microinjection of the GABA agonist muscimol in the M1 hand area. This not only greatly reduced EMG responses evoked from M1, but also reduced or abolished responses from F5, over a similar time course (20–50 min). Muscimol in M1 reduced the level of background EMG activity in the contralateral hand, which was paretic for several hours after injection. However, because EMG responses to direct activation of the corticospinal tract were significantly less affected than the responses to F5 stimulation, it is unlikely that reduced motoneuronal excitability explained the loss of the evoked responses from F5. Finally, muscimol injections in M1 greatly reduced the corticospinal volleys evoked by rICMS in F5. The results suggest that the motor effects evoked from F5 depend, at least in part, on corticocortical interactions with M1, leading to activation of M1 corticospinal outputs to hand muscles.
Keywords: hand, inactivation, macaque, motoneuron, motor cortex, premotor
Introduction
The ventral premotor cortex (PMv) is an important component of the “visuomotor grasping circuit” (Jeannerod et al., 1995), involving the posterior parietal cortex (area AIP), PMv, and primary motor cortex (M1). Areas F4 and F5 represent two functional subdivisions of the PMv (Rizzolatti et al., 1988); whereas F4 neurons are mainly related to the arm and face, F5 neurons are active when monkeys fixate, grasp and manipulate objects (Gallese et al., 1996; Murata et al., 1997; Raos et al., 2006; Umilta et al., 2007).
Consistent with the grasp-related activity in F5, repetitive intracortical microstimulation (rICMS) in this area evokes movements of hand and digits at low thresholds (Godschalk et al., 1995). The pathways mediating these responses are currently under investigation because these pathways are also likely to be involved in the control of grasp. In common with other secondary motor areas, the PMv is characterized both by its direct corticospinal (CS) projection to the cord and by its reciprocal corticocortical connections to M1. CS projections from F5 contribute only 4% of the entire frontal lobe projection (Dum and Strick, 1991), compared with 48.5% from M1 and large contributions from other secondary areas, such as the supplementary motor area (SMA) (18.5%) and the cingulate motor areas (21.3%). Furthermore, CS projections from the PMv do not project heavily to the caudal segments of the cervical enlargement, containing the motor nuclei supplying intrinsic and extrinsic hand muscles (He et al., 1993; Galea and Darian-Smith, 1994; Dum and Strick, 2002), and this has raised doubts as to whether the CS projections from the PMv mediate the digit movements evoked by rICMS within this area.
An alternative pathway is provided by the numerous corticocortical connections between the PMv and M1 (Muakkassa and Strick, 1979; Godschalk et al., 1984; Tokuno and Tanji, 1993; Dum and Strick, 2002; Dancause et al., 2006). A recent quantitative study (Dum and Strick, 2005) showed that the PMv provided more corticocortical projections to the M1 hand area than any other secondary motor area. Stimulation of secondary motor areas can activate M1 corticospinal neurons indirectly (Amassian et al., 1987; Shimazu et al., 2004), and in contrast to those from PMv, M1 corticospinal projections make strong connections to hand and digit muscles (He et al., 1993; Armand et al., 1997; Maier et al., 2002). These include direct cortico-motoneuronal (CM) projections (Porter and Lemon, 1993; Maier et al., 2002). CM projections to digit muscles are now known to arise from the most caudal part of M1 in the bank in of the central sulcus (CentS), whereas none originate from the PMv (Rathelot and Strick, 2006a).
If corticocortical activation of M1 corticospinal outputs plays a significant role in mediating motor responses from area F5, then inactivation of M1 should reduce or abolish these responses. We investigated reversible inactivation of the M1 hand area by microinjection of the GABAA agonist muscimol. As expected, muscimol abolished motor responses from M1, but it also greatly reduced the responses from F5. Results from a number of additional experiments were all consistent with muscimol blocking corticocortical interactions between F5 and M1.
Parts of this paper have been published previously as a preliminary report (Schmidlin et al., 2006).
Materials and Methods
Three purpose-bred adult macaque monkeys were used: one Macaca mulatta (CS25; male; age, 3.5 years, 4.5 kg) and two Macaca fascicularis (CS26 and CS27; both female; age, 6.5 and 4.5 years; 5.2 and 3.7 kg, respectively). All procedures were performed in accordance with the United Kingdom Animals (Scientific Procedures) Act 1986. The overall design of the approach used in CS26 and CS27 is indicated in Figure 1. Two extradural polymer grids, located over the hand representations of M1 and of F5 allowed subsequent implantation of chronic intracortical stimulating electrodes; in CS25, all electrodes were implanted at surgery. Motor effects evoked by rICMS at these sites were monitored and EMG responses recorded. The grids also allowed microinjection of muscimol at sites immediately adjacent to the stimulating electrodes.
Figure 1.
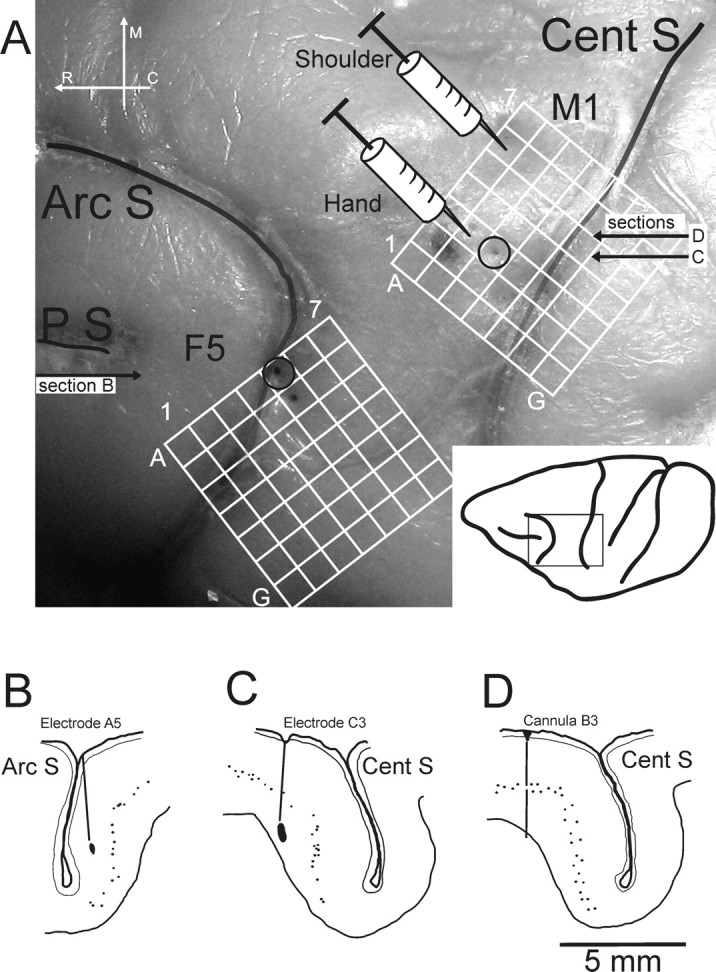
Experimental setup. A, Postmortem photograph showing the lateral view of part of the left hemisphere of the brain of CS27 (boxed area shown in the inset, bottom right). The CentS, the ArcS, and the principal sulcus (PS) are clearly visible. The superimpositions show the location of the chronic implanted grids over M1 and area F5 of the ventral premotor cortex. Each grid consisted of 7 × 7 holes with 1 mm spacing. The syringe symbols represent the location of the microinjection of muscimol or saline into the M1 hand region (location B3) or in a more proximal representation (shoulder; location A6), both defined by rICMS. Open circles at grid reference points C3 (for the M1 grid) and A5 (F5 grid) show the entry points of the main electrode tracks used for rICMS in M1 and F5, respectively. B–D, Histological reconstruction of parasagittal sections of the left hemisphere of CS27 at the level of the inferior limb of the ArcS (section B) and through the center of the M1 hand area (section C), showing the location of the chronically implanted stimulating electrodes used in this case, which were marked by a small electrolytic lesion during the terminal experiment. The tip of the F5 electrode (B) was located in layer III in the inferior bank of ArcS, whereas the tip of the M1 electrode (C) was located deep in layer VI in the rostral bank of the CentS. Section D is taken close to section C (A) and shows the track made by the microinjection cannula in M1 at location B3. Small dots indicate large pyramidal neurons in layer V. R, Rostral, M, medial, C, caudal.
Structural MRI
A magnetic resonance imaging (MRI) scan at the beginning of each study (Baker et al., 1999) allowed exact identification of the location, orientation, and extent of the rostral bank of the central sulcus (M1 hand area) and inferior limb of the arcuate sulcus (ArcS; F5 hand area) in each monkey. MRI was performed under heavy sedation induced with ketamine (Fort Dodge Animal Health; 10 mg · kg−1, i.m.) and medetomidine HCl (Domitor; Pfizer; 1.25 mg · kg−1, i.m.).
Implantation of grids, chamber, and PT electrodes
Under deep anesthesia (1.5–2% isoflurane in a 1:1 O2/N2O mixture), the monkey's head was fixed in a stereotaxic headholder and a rectangular craniotomy was made on the left side to allow access to both M1 and F5 hand areas. In CS25, small arrays of five microwires were implanted in each area as described previously (Cerri et al., 2003; Shimazu et al., 2004). In CS26 and CS27, two square polymer grids (3 × 8 × 8 mm) (see Fig. 1A) were implanted epidurally. The grids were machined from Tecapeek (Ensinger) and each contained 49 holes, each with a diameter of 300 μm and a spacing of 1 mm. The grids were located within a shallow chamber (inside dimensions, 22 × 11 × 6 mm), also made of Tecapeek, which was firmly fixed to the skull with bone screws and acrylic. Grids were fixed to the inner wall of the chamber by fine tungsten rods. The chamber was closed and sealed with a lid. In CS27, two fine tungsten stimulating electrodes were chronically implanted in the ipsilateral (left) medullary pyramidal tract (PT) (Olivier et al., 2001). After the surgery, an antibiotic (Terramycin LA, 20 mg · kg−1, i.m.; Pfizer,) was given. Monkeys received a full postoperative care routine, including administration of an analgesic drug (buprenorphine hydrochloride, 5–10 μg · kg−1, i.m.; Vetergesic; Reckitt and Colman).
Chronic investigation: use of sedative drug regimen
After the monkey had fully recovered from surgery, investigations were performed twice per week. The ketamine–medetomidine drug regimen used provided a consistent level of sedation accompanied by a steady, low level of muscle tone, which allowed testing of motor effects from the cortex under stable conditions of motoneuronal excitability. Each monkey was sedated using a low dose of ketamine (4 mg · kg−1, i.m.) mixed with medetomidine HCl (0.05 mg · kg−1, i.m.). After 10 min, the effect of medetomidine was partially reversed by intramuscular injection of a very small quantity of an antisedative reversing agent Antisedan (atipamezole, 0.8 mg · kg−1, i.m). The light level of sedation was subsequently maintained with injections of diluted ketamine (1/1 vol of saline); each dose was usually 2.5 mg · kg−1 (i.m.) given every 5–10 min. At the end of the experiment, the monkey was given an additional dose of Antisedan to facilitate recovery from sedation.
Implantation of chronic stimulating electrodes
In CS26 and CS27, mapping of the M1 and F5 hand areas was performed in the first few sessions after surgery, using varnish-insulated tungsten electrodes with tip impedances of 50–80 kΩ. Each electrode was connected by an insulated joint to short length of Teflon-insulated stainless-steel cable and a miniature socket. Using a pair of fine forceps, an electrode was introduced at a given grid location (see Fig. 1A) and, under microscopic control, was advanced by hand through the dura until the first signs of cortical activity were detected (typically 3 mm below the grid). rICMS was delivered as the electrode was advanced: a train of 12 biphasic pulses at 333 Hz, with each phase 0.2 ms in duration and delivered at a rate of 0.5 Hz from a Neurolog NL800 isolated constant-current stimulator (Digitimer). Current was monitored continuously on an oscilloscope. The electrode was carefully advanced in steps of ∼ 0.5 mm until a stable motor response involving the contralateral digits was obtained. After a period of 10–15 min to confirm that the motor response was stable, the electrode was fixed at this site by a small drop of superglue applied to the grid surface. The cable was led through a slot in the chamber wall and the connector set in dental acrylic just outside the chamber. Using this approach, both M1 and F5 were each chronically implanted with two to three electrodes. Examples of microelectrode location within the F5 and M1 grids are shown in Figure 1A.
At the end of each session, an anti-mitotic agent [5 flurouracil (5FU)] (Spinks et al., 2003) was flushed beneath the implanted grid and left in place for 5 min. The entire chamber was then thoroughly flushed with saline, closed, filled with saline, and sealed. The 5FU treatment was used to prevent dural thickening.
Experimental protocol
EMG recording.
At the beginning of each session, pairs of surface EMG electrodes were applied over two of the several muscles activated by rICMS delivered to M1 and F5 electrodes. The EMG was amplified using a Neurolog NL820/824 (Digitimer) preamplifier system, bandpass filtered at 10 Hz and 5 kHz and sampled at 10 kHz per channel using a 1401 interface (Cambridge Electronic Design).
rICMS.
For each monkey, the number of biphasic pulses in the rICMS train was optimized so as to produce a clear cut EMG response at low current threshold with a clear onset toward the end of the train or just after it (see Fig. 2B,C). The number of pulses was usually lower for M1 (6–9 pulses) than for F5 (11–14 pulses). For M1 the range of intensities varied between 20 and 80 μA. For F5, two different rICMS intensities were used: “juxtathreshold” intensities (close to threshold and set to evoke a clear EMG response in ∼75% of sweeps; these intensities ranged from 40 to 100 μA), and “suprathreshold” intensities, which were 25% higher than those used for juxtathreshold. Most of the experimental sessions were performed with just one of the electrodes implanted in each area. This “optimal” electrode was selected on the basis of (1) the low threshold of responses to rICMS and (2) to obtain motor responses in the same digit muscle from both M1 and F5.
Figure 2.

Analysis methods. A, Single sweep of rectified surface EMG activity recorded from the 1DI in CS27 and elicited by a train of 12 bipolar constant current ICMS pulses (indicated below B) delivered to the F5 hand area. ICMS intensity was 100 μA, pulse duration 0.2 ms. The EMG response was recorded before muscimol. The baseline EMG activity (B) was determined from the mean level of background rectified EMG in the 25 ms period before the stimulation train. The onset and offset of the response to ICMS was determined from an average of all the sampled sweeps (n = 50), as shown in B. For the sweep in A, the area of the response (A) was determined from the mean level of EMG activity within the response period (onset to offset). The peak amplitude of the response is given by P. B, Average of rectified EMG response to 50 stimulus trains (duty cycle 2 s). The gain is four times that in A. C, Reproducibility of responses. Averaged rectified EMG responses recorded from two hand muscles (left, 1DI; right, FDS after delivery of rICMS to the M1 hand area). Averages were obtained from three different recording sessions over an 8 d period; electrode location and current intensity (9 pulses, 40 μA) was the same for each session.
The EMG responses and motor effects evoked from a given electrode remained stable over the period of the experiment. Figure 2C shows examples of consistent EMG responses evoked by rICMS in M1 and recorded in three different sessions spanning an 8 d period.
PT stimulation.
In CS27, bipolar stimulation of the PT was performed using biphasic stimuli identical to those used for rICMS. Either single stimuli or a train of three stimuli at 333 Hz were used with a duty cycle of 0.5 Hz.
Muscimol inactivation.
Muscimol was injected close to the low-threshold electrode in the hand area of M1. In CS25, muscimol injections were made through a fine 33-gauge cannula glued to side of the electrode array. In CS26 and CS27, the depth of the cortical surface at the injection site was first determined by slowly advancing a tungsten microelectrode through the grid until cortical activity was detected. The electrode was then removed and replaced by a 33-gauge cannula with a beveled tip (Fig. 1A, syringe symbol). The cannula was connected by a fine polyethylene tube to a 10 μl Hamilton syringe containing muscimol (Sigma catalog #M-1523, 0.5% solution in saline). The cannula was lowered to a depth of 4.5 mm below the cortical surface and, after several minutes, 0.5 μl (0.25 μg) of muscimol was slowly injected over 2–3 min (0.1 μl was injected every 30 s). Two additional injections were then made at 3 and 1.5 mm from the cortical surface. The total volume injected per penetration was 1.5 μl (0.75 μg). In control sessions, an identical volume of saline was injected at the same site. In other sessions, muscimol was injected into the M1 face area (CS26, two sessions) or M1 shoulder area (CS27, two sessions) (see Fig. 1A). In these sessions, the area to be injected was first characterized by rICMS at the injection site.
Data acquisition.
In each session, several control sets of EMG responses (number of stimuli per block, n = 50) were recorded for rICMS delivered to M1 and F5 (and, in CS27, to PT stimulation). Subsequently, muscimol or saline were injected in M1 and additional sets of EMG responses were sampled for up to 60 min after the injection had been completed.
Behavioral assessment
Immediately after sedation was reversed in the recovery cage, any changes in hand and arm use by the monkey were evaluated. Video recordings were made of the paresis of the hand contralateral to the muscimol injection site. After the monkey had returned to its home cage, a detailed examination was performed of the precision grip (use of index and thumb to grip small pieces of fruit) and strength in the arm and digits.
Terminal experiment
Terminal experiments were performed as described by Maier et al. (2002), with all preparatory surgery performed under deep isoflurane anesthesia. A laminectomy was made over spinal segments C3 to Th1. When surgery was complete, isoflurane was discontinued and α-chloralose was given (50–80 mg · kg−1, i.v.). The animal was mounted in a spinal frame and headholder, with clamps on the vertebral column at Th3 and in the lumbar region, and then paralyzed with pancuronium bromide (Pavulon; Oregon-Technika) at a dose of 0.3 mg · kg−1 · h−1 (i.v.) and artificially ventilated at a rate of 45 cycles min−1. Adequacy of the anesthesia was continuously assessed by reference to the blood pressure, heart rate, and pupillary reflexes. Small doses (2–4 mg · kg−1, i.v.) of pentobarbitone (Sagatal; Rhone Merieux) were administered when necessary. Body temperature was carefully maintained between 37 and 39°C. Fluid balance and blood gases were monitored and maintained; each animal remained in good physiological condition throughout the recording. Mean blood pressure was maintained >80 mmHg. CS volleys evoked by rICMS delivered to the implanted electrodes were recorded from the dorsolateral funiculus at rostral (C3 or C4) and caudal (C8) levels of the cervical spinal cord (Shimazu et al., 2004). Volleys were recorded before and after microinjection of muscimol in M1, using a similar procedure as in the sedated condition.
Histology
At the end of the experiment, small electrolytic lesions were placed at the cortical and PT stimulation sites by passing DC current (20 μA for 20 s, tip positive). The animal was given an overdose of barbiturate and perfused through the heart with formal saline. The fixed cortex was photographed; entry points of stimulating microelectrodes and the microinjection cannula were clearly visible (Fig. 1A). All electrode sites were confirmed histologically. Frozen sections (30 μm) were cut, mounted, and Nissl stained. Each section was carefully inspected for electrode tracks and sample sections were digitized. Examples of typical microelectrode tracks are shown in Figure 1B (F5 track in inferior bank of the ArcS) and Figure 1C (M1 track in rostral bank of the CentS). A track made by the injection cannula is shown in Figure 1D.
Data analysis
All data were acquired and analyzed with Cambridge Electronic Design Spike2 software. EMG responses to rICMS were normalized to background (prestimulus) levels of activity, and a comparison made between responses before and at ∼40 min after the last injection of muscimol. An average of rectified EMG (50 sweeps) responses from the control (premuscimol) condition was first compiled (see Fig. 2B). The onset and offset of the EMG response were determined from this average (see Fig. 2B); response duration was usually 20–35 ms. The values for response duration derived from the control (premuscimol) data set were also used for the postmuscimol data.
A sweep-by-sweep analysis of the same block of trials was then conducted. For each sweep, four measures were determined. First, the presence or absence of a clear response within the onset–offset period was noted so that the response probability for the block could be calculated. Second, the mean level of background EMG activity was determined for the 25 ms period before the rICMS train (see Fig. 2A,B). Third, the area of the EMG response was calculated from the mean level of EMG between response onset and offset (see Fig. 2A, area under the curve, A). Finally the peak amplitude of the EMG response was determined from the largest peak within the predefined response period (see Fig. 2A, P). No stimulus artifacts were included in the measurements taken. The responses were normalized to the mean amplitude of the background level of EMG activity for that sweep and expressed as a ratio. For the response area measurements, this was [A − B/B] × 100%; this is referred to as the response area ratio. The normalized peak amplitude measurement [P − B/B] × 100% is referred to as the response peak ratio. A Mann–Whitney nonparametric test was used for statistical comparison between data sets recorded before and after muscimol.
Results
Abolition of EMG responses evoked from F5 by inactivation of M1 hand area
The main result of this study is illustrated by responses obtained in CS27 (see Fig. 3). rICMS in M1 and in F5 evoked movements of the digits, and clear EMG responses from both M1 and F5 were obtained from the first dorsal interosseous muscle (1DI) (see Fig. 3A–C, top row of averages). Microinjection of muscimol within 1 mm of the M1 stimulation site (Fig. 1A, syringe marked “hand”) produced a striking decrease in the EMG response evoked from M1 within 20 min, and the response was almost entirely abolished 40–50 min after the injection was completed (see Fig. 3C, bottom average). Strikingly, M1 inactivation also reduced and then abolished the digit movements and EMG response evoked from F5 (see Fig. 3A,B). This was true both for rICMS with an intensity just above threshold (see Fig. 3A, juxtathreshold) and an intensity ∼25% higher (see Fig. 3B, suprathreshold).
Figure 3.

Abolition of motor responses evoked by stimulation in F5 by muscimol injection in M1. A–C, Average rectified EMG responses from 1DI evoked by rICMS (pulse train shown in bottom trace) before and after a microinjection of muscimol into the M1 hand area. A, Averaged EMG response evoked by rICMS in the F5 hand area at an intensity close to threshold (juxtathreshold) for evoking a response (12 pulses, 80 μA). B, Responses evoked by rICMS in F5 at an intensity ∼25% above threshold (suprathreshold; 12 pulses, 100 μA). C, Responses evoked by rICMS in the M1 hand area (9 pulses, 45 μA). Control responses evoked before muscimol (A–C, top traces) were greatly reduced 20 min after the muscimol inactivation (middle traces). After 40–50 min (bottom traces), responses to F5 stimulation were completely abolished whereas those to M1 stimulation were very small. In this example, there was also a decrease in background EMG activity after muscimol microinjection. All averages are of 50 sweeps. D–F, Quantitative analysis of decrease of EMG responses after muscimol injection in M1. Stimulation details are as in A–C. Box plots show a decrease in the area ratio of the EMG responses evoked by rICMS before (pre) and after (post) (50 min after last injection of muscimol in the M1 hand area) injection of CS27. The plots show the median (thick horizontal bar) data between the 25 and 75% quartiles (box) and between 10 and 90% (error bars) of the area of the EMG response normalized to the background level of EMG activity (response area ratio) (see Materials and Methods). For these and all subsequent box plots, the smallest 5% and largest 5% of the data points were excluded. Data have been pooled from two sessions in which the same electrode configuration was used and muscimol injected into the same M1 hand area site. Note the difference in the relative sizes of the EMG responses evoked from F5 and from M1. A Mann–Whitney test showed the pre–post comparison to be significantly different in all three cases (D, p < 0.0001, n = 103, t = 9.36; E, p < 0.0001, n = 103, t = 9.32; F, p < 0.0001, n = 103; t = 12.43).
A further indication of the efficacy of the muscimol injection in the M1 hand area was that the monkey suffered from a paresis of the contralateral hand. This paresis resolved entirely 12–15 h after the injection.
Quantification of the effect of muscimol injection in M1
Figure 3D–F show the analysis of the 1DI EMG responses before and after an M1 muscimol injection. The box plots show the median value of the response area ratio (thick horizontal bar), the range of data between the 25 and 75% quartiles (box) and between 10 and 90% (error bar). The response area ratio was calculated by integrating the rectified EMG activity that occurred between response onset and offset (Fig. 2A) and normalizing it to the background level of EMG activity (Fig. 2A, B) (see Materials and Methods). The response area ratios were pooled from two separate sessions (103 sweeps in total per data set) in which the same electrode configuration was used and muscimol was injected into the same M1 hand area site. In each pair of box plots in Figure 3D–F, the left plot is control (preinjection) data and the right plot is data collected 40–50 min after injection of muscimol. The results are plotted for F5 stimulation with juxtathreshold (Fig. 3D) and suprathreshold (Fig. 3E) intensities, and for M1 (Fig. 3F). M1 stimulation evoked larger responses than did F5 (p < 0.0001; t = 9.65) (Fig. 3, note difference in ordinate scale in F vs D,E). Responses that were large and variable preinjection were small or absent after muscimol, and the before–after muscimol injection comparison was highly significant (p < 0.0001, Mann–Whitney) for all three sets of data.
Figure 4 shows results in the two other monkeys (CS25 and CS26). The area ratios for EMG responses evoked from F5 has been plotted before and 40–50 min after muscimol in the M1 hand area. The results from two experimental sessions were pooled (104 sweeps in all); for each monkey, the stimulation site was the same in both sessions, as was the injection site. In both cases, muscimol in M1 had a highly significant depressive effect on EMG responses evoked from F5 (p < 0.0001). In two sessions (one in CS26 and one in CS27), we tested the effect of raising the intensity of the F5 stimulation (by 20% above the suprathreshold level) or increasing the train length (from 12 to 15 pulses), but no responses were obtained after these procedures.
Figure 4.

Reduction in EMG responses evoked from area F5 by muscimol in M1 in two additional monkeys. A, B, Box plots show results for EMG response area ratio evoked by rICMS in the F5 hand area before (pre) and after (post) muscimol microinjection in M1 in CS26 (A) and CS25 (B); data were pooled from two sessions in each monkey. In both cases, the reduction after muscimol in M1 was highly significant (Mann–Whitney test: A, p < 0.0001, n = 104, t = 10.23; B, p < 0.0001, n = 104, t = 7.74; stimulation details: CS26, 12 pulses, 115 μA; CS25, 14 pulses, 120 μA). Box plots are as in Figure 3.
Comparing the results from the three monkeys, although there was a considerable range in the relative size of the responses in the different cases, the response area ratio showed that responses to F5 stimulation were markedly reduced after muscimol in M1. If the peak response measure, rather than the area ratio (see Materials and Methods) (see Fig. 6B) was compared, the same statistically significant (p < 0.0001) reduction in response size was found in all three monkeys. This was also the case if non-normalized data were compared. Finally, Table 1 shows that the probability of EMG responses to F5 stimulation, which was >80% in all three monkeys before muscimol, was reduced to between 6 and 21% postinjection.
Figure 6.

A–C, Comparison of effects of muscimol injection in M1 on background EMG activity (A), response to rICMS in F5 (B), and response to single stimuli delivered to the pyramidal tract (C). Box plots are as in Figure 3. A, The background level of EMG activity in the 1DI muscle was measured from the prestimulation period in before (pre) and after (post) muscimol injection in M1 hand area in CS 27. The reduction was significant (p < 0.0001; n = 103; t = 7.51). B, The peak ratio measure of responses to F5 stimulation, normalized to the background EMG (response peak ratio) (see Materials and Methods) was measured in the same session as for the data in A (12 pulses at 80 μA). The reduction in response was significant (p < 0.0001; n = 51; t = 6.61). C, Interleaved responses to direct stimulation of the PT (single pulses, 225 μA) were also recorded and their response peak ratio calculated. The reduction was not significant (p = 0.06; n = 51; t = 1.87). D, Histogram comparing the probability of EMG responses to rICMS in area F5 (left) or stimulation of the PT (right) before (pre) and after (post) inactivation of M1 hand area.
Table 1.
EMG Response probabilities before and after M1 muscimol injection
| Monkey | M1 |
F5 (juxtathreshold) |
F5 (suprathreshold) |
|||
|---|---|---|---|---|---|---|
| Pre | Post | Pre | Post | Pre | Post | |
| CS25 | 79% | 23% | 92% | 21% | ||
| CS26 | 100% | 6% | 85% | 15% | 95% | 6% |
| CS27 | 100% | 8% | 86% | 9% | 87% | 7% |
Effect of muscimol injections on the probability of EMG responses to rICMS delivered to M1 and area F5 in three macaque monkeys. The probability of EMG responses was assessed before (pre) and ∼50 min after (post) muscimol injection in the M1 hand area. Data from two separate experimental sessions were pooled for analysis. Two intensities of F5 stimulation (juxtathreshold and suprathreshold) were tested in CS26 and CS27. In CS25, only suprathreshold shocks were tested.
Localization of the stimulation and muscimol injection sites
The results presented above need to be interpreted in terms of the location of the M1 and F5 sites that were stimulated, and the site of muscimol injection. Table 2 lists the location of the electrodes used for evoking motor responses in contralateral digit muscles in each of the three monkeys. These locations were determined from the postmortem histological analysis and tracks identified from marker lesions and gliosis.
Table 2.
Location of chronic stimulating electrodes in the three monkeys
| Monkey | Location | Electrode code | Depth (mm) | Lamina | rICMS |
Experiment duration (weeks) | Current used (μA) | |
|---|---|---|---|---|---|---|---|---|
| Threshold (μA) | Effect | |||||||
| CS25 | ||||||||
| Electrode | M1 | 4 | 4.2 | VI/wm | 35 | I ext | 5 | 40–80 |
| Electrode | F5 | 3 | 2.6 | V | 55 | I abd | 5 | 70–120 |
| Cannula | M1 | 1.5–4.5 | ||||||
| CS26 | ||||||||
| Electrode | M1 | A4 | 3 | V | 12 | I flx | 16 | 20–50 |
| Electrode | F5 | C4 | 5 | III/V | 30 | I abd | 16 | 100–120 |
| Cannula | M1 | B5 | 1.5–4.5 | |||||
| CS27 | ||||||||
| Electrode | M1 | C3 | 3.9 | VI | 6 | II–V flx | 10 | 30–70 |
| Electrode | F5 | A5 | 4.5 | III | 40 | I ext | 7 | 40–80 |
| Cannula | M1 | B3 | 1.5–4.5 | |||||
Locations of electrodes are coded by grid position (see Fig 1A, CS26, CS27) or number in the implanted array (CS25). Locations were determined from postmortem histology; the depth (in millimeters) is the depth along the track from the pial surface measured in fixed tissue. The cortical lamina in which the electrode tip was located is also indicated. Motor effects and thresholds of rICMS at the beginning of the experimental period are given for each electrode. Experiments lasted for between 5 and 16 weeks, and the range of currents used in this period is indicated in the last column. All the M1 electrode and cannula tracks were in the rostral bank of the central sulcus. All the F5 electrode and cannula tracks were in the inferior bank of the arcuate sulcus. I, Thumb; II–V, fingers; ext, extension; flx, flexion; abd, abduction; add, adduction; wm, white matter.
F5 sites
Electrode tracks were parallel to the bank of the inferior limb of the arcuate sulcus (Fig. 1B, ArcS) (case CS27). In all three cases, the tip of the optimal F5 electrode was located in the bank of this sulcus, 2.6–5.0 mm from the entry point. In CS25, it was judged to be in layer V, in CS26 at the lamina III/V border, and in CS27 it was in lamina III (Fig. 1B).
M1 sites
Electrode tracks were parallel to the rostral bank of the central sulcus (Fig. 1C, CentS) (case CS27). The tip of the optimal M1 electrode was located 3.0–4.2 mm from the entry point. In CS25, the tip was in at the lamina VI/white matter border, in CS26 it was in lamina V, and in CS27 it was in lamina VI (Fig. 1C).
Motor effects of rICMS
Table 2 also lists the motor effects evoked from the optimal electrode sites in M1 and F5. The lowest threshold effects were all restricted to thumb (digit I) or finger movement (II-V). The muscles chosen for investigation were thenar muscles in CS25, and 1DI in both CS26 and CS27. Responses in these muscles were consistent over the recording period (5–16 weeks) (Table 2, Fig. 2C). It can be seen that rICMS thresholds were higher in F5 than in M1. There was a gradual increase in threshold during the experimental period.
Location of muscimol injection sites
The injection site in the hand area of M1 was between 1 and 2 mm from the optimal electrode site (Fig. 1A). In each monkey, this site was injected twice with muscimol and twice with control saline injections. The cannula tracks were recovered from the histological sections, and ran parallel to the electrode tracks in the bank of the central sulcus (Fig. 1D). The maximum depth of injection below the cortical entry point (determined by recording) was 4.5 mm; injections were also made at 3 and 1.5 mm from the entry point (see Materials and Methods).
Control experiments
Local mechanical depression caused by the injection cannula
We investigated whether the abolition of F5 responses could have resulted from the mechanical effect of inserting the injection cannula into the cortex. We found that, immediately after insertion of the cannula, the EMG responses to M1 or F5 stimulation remained at control levels. No change was detected for at least the first 5 min after muscimol injection.
Microinjection of saline
We also confirmed that control injections of the same volume of saline at the same M1 injection site were without effect on EMG responses. Figure 5A shows the area response ratio data for M1 muscimol injection in one session (same data as in Fig. 3E), whereas B shows data for saline injections at the same site in another session. Whereas muscimol in M1 greatly reduced the response to rICMS in F5 (p < 0.0001), there was no significant effect of saline (p = 0.57).
Figure 5.

Comparison of EMG responses recorded after microinjection in M1 of muscimol versus saline in monkey CS27. A, Box plot showing the normalized response area ratio of EMG responses evoked by F5 stimulation before (pre) and after (post) microinjection of 1.5 μl of 0.5% muscimol in the M1 hand area. There was a highly significant reduction in the EMG response (Mann–Whitney test, p < 0.0001; n = 103; t = 9.32). F5 stimulation: 12 pulses at 100 μA. B, Responses evoked by the same intensity of stimulation as in A but in a different session in which 1.5 μl of saline was microinjected at the same M1 site (number of sweeps, 92; Mann–Whitney test, NS, p = 0.57; n = 105; t = 0.58). Box plots are as in Figure 3.
Could the results be explained by subcortical reduction in excitability caused by inactivation of M1?
As well as reducing responses to rICMS, muscimol injection in M1 caused a reduction in the level of ongoing EMG activity (Fig. 3A–C), consistent with the paresis in the hand that was seen after monkeys recovered from sedation. Figure 6A shows that the mean amplitude of background EMG activity (Fig. 2A, B) fell significantly after muscimol injection (p < 0.0001). There was a considerable compression in the range of background EMG values, but some background EMG activity was always present.
Presumably, M1 inactivation reduced a tonic excitatory drive to the spinal cord and to the motoneuron pools of these muscles. Therefore, although the results presented above might suggest that the motor effects that resulted from rICMS in F5 were mediated through M1, an alternative explanation is that descending corticofugal activity arising from F5 itself failed to evoke any EMG responses because of an overall reduction in the excitability of the spinal circuitry controlling these same motoneuron pools. For example, corticospinal outputs originating from F5 failed to evoke EMG responses because of a reduced level of excitability at the spinal level.
To investigate this possibility, in the same experimental session, we measured the size of matched EMG responses of the same muscles to direct stimulation of the medullary PT (see Fig. 9). If the excitability at the spinal level was reduced after muscimol in M1, we reasoned that these responses, like those evoked from the cortex, should be absent or greatly reduced. Either single pulses or trains of three pulses were delivered to a pair of electrodes chronically implanted in the PT (Cerri et al., 2003). The PT intensity was set so as to evoke EMG responses with amplitudes similar to those evoked by rICMS in F5. The mean and median amplitude of the control responses to rICMS (Fig. 6B, pre) and to single-pulse PT stimulation (Fig. 6C, pre) were similar (Mann–Whitney test, p = 0.95; t = 0.97). Figure 6D shows that the response probability of control responses was also similar (90% for F5 and 88% for PT).
Figure 9.

Schematic of the possible mechanisms underlying F5–M1 interactions in the macaque motor cortex. rICMS in the M1 area (indicated by the black stimulating electrode) excites CS neurons (A–C) both directly and indirectly. The same CS neurons would have been inactivated by muscimol injections immediately adjacent to the stimulation site. Volleys in the CS tract evoked by rICMS can be recorded from the dorsolateral funiculus (DLF) at the upper cervical level (C3). Many CS axons originating in M1 terminate in the lower cervical cord (C8), where motoneurons of hand muscles are located. Stimulation in F5 excites other CS neurons (D) and also activates M1 CS neurons via indirect interneuronal networks that are activated by corticocortical projections (exemplified by cell E). Return projections from M1 to F5 are not shown. Under the present experimental conditions, rICMS in F5 leads to a net facilitation of CS outputs from M1 that activate hand motoneurons, leading to EMG responses in hand muscles such as 1DI. Any reduction of excitability at the spinal level caused by loss of tonic excitatory drive from M1 (inactivation of CS cells A–C) can be detected by testing the effects of direct stimulation of the CS tract via implanted PT electrodes. (See Discussion.)
The effect of an M1 muscimol injection on F5 versus PT evoked responses was quite different. The measure used here was the response peak ratio (Fig. 2A, P), which was normalized to the level of background EMG activity (see Materials and Methods). The peak response measure was used here because the EMG responses to PT stimulation were much briefer (6–8 ms) than those to rICMS (25 ms), so that the area measure was not an appropriate means of comparing them. It can be seen that, after muscimol, the peak of the EMG response to F5 stimulation was only ∼20% of its size before muscimol (Fig. 6B) (median value, 1750% before and 205% after), and this fall was highly significant (p < 0.0001). The amplitude of responses to PT stimulation, although attenuated after muscimol, fell by a much smaller margin, to ∼60% of the preinjection level, and they were still clearly present (Fig. 6C). This attenuation was not significant (NS; p = 0.06).
Figure 6D shows that the probability of responses evoked from F5 after muscimol was 90% before muscimol and only 11% after, whereas for PT evoked responses it was 88% before and 87% after muscimol. In other words, although the amplitude range of PT responses was somewhat reduced (Fig. 6C), their probability (Fig. 6D) remained at control levels, whereas F5 evoked responses were both smaller and much less common after muscimol. Therefore, although a reduction in spinal excitability might underlie some change in the F5 evoked responses, it cannot fully explain the dramatic reduction in their size and probability after muscimol injection in M1.
Hand muscle EMG responses facilitated after inactivation of other M1 areas
We wanted to establish whether injection of muscimol into the M1 hand area could have spread to inactivate F5. To test this, we investigated injections of the same amount of muscimol into M1 sites that were a short distance away from the M1 hand area electrode to see whether these injections would abolish the EMG responses to rICMS delivered to that electrode. In CS27, the M1 “shoulder” area (Fig. 1A, syringe marked “shoulder”) was injected, as was the M1 “face” area in CS26; the injections were made at sites where low-threshold rICMS-evoked movements of shoulder and face, respectively. These injection sites were ∼3–4 mm from the M1 hand area electrode, i.e., much closer than the F5 stimulation site, which was generally 7–10 mm away. Interestingly, inactivation of shoulder or face sites resulted in an enhancement of the hand muscle EMG response to stimulation in the hand area of M1. For the shoulder area injection in CS27, this enhancement was highly significant (p < 0.0001) for preinjection responses evoked by rICMS close to threshold (Fig. 7A). When the current was increased and preinjection response much larger (Fig. 7B), the postinjection response was still slightly enhanced (NS, p = 0.15). A significant increase in hand muscle responses was also seen after injection in the M1 face area of CS26 (p < 0.0001) (data not shown). In no case was any reduction in response postmuscimol observed. These results, which are probably attributable to inactivation of local intra-areal inhibitory circuits (Jacobs and Donoghue, 1991), argue against the spread or diffusion of muscimol from M1 to F5 as the reason for the abolition of the responses evoked from F5.
Figure 7.

Effect of muscimol injection in other areas of M1. Box plots show the response peak area of the EMG responses in 1DI elicited by rICMS delivered to the M1 hand area before (pre) and after (post) microinjection of 1.5 μl of 0.5% muscimol into an M1 site from which shoulder movements were evoked in CS27 (see Fig. 1A). A, Data for EMG responses evoked by a weak M1 shock (9 pulses, 40 μA). These responses were rather small in the preinjection period but were greatly increased after muscimol injection into the shoulder area (Mann–Whitney, p < 0.0001; n = 54; t = 5.89). B, Data for EMG responses evoked in the same session by a stronger M1 shock (9 pulses, 80 μA). The preinjection responses were much larger than in A; these responses were also slightly increased after muscimol, but to a much lesser extent than in A (Mann–Whitney, p = 0.15; n = 49; t = 1.55). The box plots are as in Figure 3.
M1 shoulder area inactivation produced a nonsignificant increase in the 1DI responses evoked from F5, in strong contrast to the abolition of these responses after M1 hand area injections.
Behavioral effects of muscimol microinjections in M1 hand area
The precision grip of the hand contralateral to the M1 hand area muscimol injection site (Fig. 1A, hand) was clearly affected for up to 12 h after injection (cf. Matsumura et al., 1991). The weakness and poverty of the monkey's hand function was in keeping with the reduction in ongoing (background) EMG activity, which was observed soon after the muscimol injection (Fig. 6A). On the day after the muscimol injection, no persisting deficits were observed in hand, digit, or upper limb movement. Muscle responses and rICMS thresholds at the M1 and F5 sites returned to control levels when retested 2–3 d after the injection. Injection of muscimol in other areas of M1 resulted in corresponding effect to the site of location, paresis of the shoulder in the case of injection of muscimol in the shoulder area (CS27), or light paresis of the face and mouth when muscimol was injected in the face area (CS26).
Terminal experiments: evidence for reduction in F5 evoked corticospinal descending activity after M1 inactivation.
The results presented above would predict that inactivation of the M1 hand area reduced the corticofugal activity evoked by rICMS in F5. Direct evidence for this was sought in a terminal experiment in each monkey, performed under chloralose anesthesia. In this experiment, averages were made of CS volleys recorded from the dorsolateral funiculus at the C3 spinal level (see Fig. 9). It was generally necessary to deliver multiple shocks to F5 to evoke any clear CS activity (cf. Shimazu et al., 2004), and this activity usually took the form of a late indirect or I-wave activity. These I-waves are thought to originate from trans-synaptic activation of corticospinal tract neurons (Amassian et al., 1987).
Two examples are given. In Figure 8A, before muscimol, repetitive stimulation of F5 with three shocks at 200 μA evoked a series of waves, the first of which began at ∼5.5 ms after the first stimulus. This was probably an I3 wave [Shimazu et al. (2004), their Figure 4B] and was evoked from the same F5 site that had been used in the chronic EMG experiments described above. Microinjection of muscimol in the M1 hand area greatly reduced the amplitude of this and other late waves.
Figure 8.

Effect of muscimol injection in M1 on corticospinal volleys evoked from F5 and M1 in a terminal experiment in CS27 under deep chloralose anesthesia. Volleys were recorded from the right dorsolateral funiculus at the C3 level and evoked by a train of shocks at 333 Hz delivered to the same F5 and M1 electrodes as used for the previous experiments. A, Averages of volleys (90 sweeps) in response to three F5 shocks at 200 μA, before and 50 min after a microinjection of 0.5% muscimol into the M1 hand area (1.5 μl) (positivity down). Note the absence of D waves evoked from F5; the volleys evoked are probably late I2 or I3 volleys and were abolished by muscimol injection in M1. B, Volleys in response to three shocks (bottom trace) to the M1 hand area at 150 μA. Note the clear D wave and loss of I waves after muscimol. C, Averages of responses to longer trains of rICMS at 150 μA delivered to F5 (11 shocks before and 12 shocks after). Once again, muscimol in M1 abolished most of the activity evoked from F5.
The responses from the M1 site are shown in Figure 8B. Before muscimol, repetitive stimulation of M1 (three shocks at 150 μA) evoked a more complex and larger amplitude series of volleys. Each M1 stimulus evoked a large direct (D)-wave (sharp volley at ∼1.0 ms after each shock); D-waves are known to arise from direct activation of corticospinal neurons (Amassian et al., 1987). The D-waves were followed by a series of I-waves, and this I-wave activity was considerably reduced after muscimol injection, whereas the D-wave activity was mostly unaffected (cf. Shimazu et al., 2004). Interestingly, the conduction velocity of the I-waves evoked from F5 (71 m · s−1) in Figure 8A was very similar to that of the I-waves evoked from M1 (81 m · s−1) (Fig. 8B).
The second example in Figure 8C shows volleys recorded in response to area F5 stimulation at the weaker intensity (150 μA) but using a train length of 11 shocks similar to that used in the EMG studies. This evoked a long series of complex waves which just outlasted the stimulus train. After muscimol in the M1 hand area, the volleys evoked from F5 were greatly reduced both in number and size.
Discussion
We have shown that the characteristic motor responses evoked in hand muscles by repetitive ICMS delivered to area F5 of the ventral premotor cortex were reduced or abolished by temporary inactivation of the M1 hand area (Figs. 3, 4). This reduction occurred with a time course similar to that for responses in the same muscles, evoked by M1 stimulation immediately adjacent to the injection site. The results raise the possibility that the responses from F5 are mediated, at least in part, through pathways including M1 corticospinal outputs influencing hand muscle motoneurons (Fig. 9).
Control experiments
The mechanical effects of microinjections in M1 could not have caused the depressive action on F5 outputs because no reduction was seen after control injections of saline. Numerous studies have shown that muscimol is a valuable tool to inactivate a limited volume of cortex (Kermadi et al., 1997; Rouiller et al., 1998; Brochier et al., 1999; Poliakov and Schieber, 1998; Schmidlin et al., 2004). The amount of muscimol injected (1.5 μl, 0.75 μg) would be expected to affect a volume of cortex extending ∼1 mm from the injection site (Martin, 1991). It is therefore unlikely that muscimol spread by diffusion from the M1 injection site to F5, a distance of ∼7–10 mm. This point is reinforced by the observation that no reduction in EMG responses from M1 hand area were seen after inactivation of M1 sites some 3–4 mm away (Fig. 1A); in fact, these responses were significantly facilitated (Fig. 7A). Injections in the M1 shoulder area also caused a nonsignificant increase in the amplitude of the hand muscle responses from area F5, further underlining the point that responses from F5 generally paralleled those from the M1 hand area.
A spinal or a cortical mechanism?
Muscimol injections in the M1 hand area also caused a significant reduction in ongoing, background EMG activity (Figs. 3A–C, 6A) and a paresis of the hand (cf. Matsumura et al., 1991). Thus, GABAergic blockade of the M1 hand area may have caused a loss of tonic CS excitatory drive to the spinal circuitry controlling hand muscle motoneurons (Fig. 9, M1 CS neurons A, B, and C). This raises the possibility that loss of spinal excitability could explain why descending CS volleys originating in F5 (Fig. 9, CS neuron D) produced little or no EMG response.
There are two lines of evidence that argue against the main result being caused by a spinal mechanism. First, if the loss of muscle responses to F5 stimulation was caused by a loss of excitability of hand motoneurons, then matched EMG responses to direct stimulation of the PT (Fig. 9) should also have been markedly reduced or abolished. This was clearly not the case: although responses to the PT were generally smaller and showed less variability after muscimol in M1 (Fig. 6C), the overall reduction in amplitude (to ∼60% of preinjection levels) was much less marked than for the responses evoked from area F5 (which in the same experimental session were down to ∼20% of control values) (Fig. 6B). Furthermore, the probability of response to the PT was unchanged after muscimol, whereas for responses to area F5 it was sharply reduced (Fig. 6D). Thus, although the results from PT stimulation confirm the reduction in spinal motoneuronal excitability, the marked difference between the PT and F5 evoked responses points to a cortical rather than a spinal mechanism.
The second line of evidence comes from direct recording from the corticospinal tract (Fig. 9) in terminal experiments under chloralose anesthesia in which the same cortical sites were stimulated and the same region of M1 inactivated. Repetitive stimulation of F5 evoked volleys in the dorsolateral funiculus (Fig. 8A,C) with typical late I-wave activity (Shimazu et al., 2004). This activity was substantially reduced after muscimol injection in M1 (Fig. 8). No D wave was detectable after F5 stimulation and the late I waves do not appear to be conducted by the corticospinal projections from F5: they have high conduction velocities, very similar to that of the D wave that was evoked from M1 and indicating that they are probably conveyed by fast corticospinal neurons whose cell bodies are uniquely located in M1. It is known that these neurons can be discharged by corticocortical inputs from other secondary motor areas (Amassian et al., 1987). All these findings suggest that the motor effects evoked from F5 involve close interactions with M1, as indicated in Figure 9.
Relation to previous studies
Wiesendanger et al. (1987) and Amassian et al. (1987) demonstrated that permanent lesions of M1 can block the motor effects from secondary motor areas such as the SMA, but none of these studies involved the PMv. The experiments reported here show that inactivation of the M1 hand area blocks the motor effects evoked from the PMv. They confirm our previous reports that suggested that motor effects elicited by single-pulse ICMS to F5 were mediated via M1: the evidence came from the short latency and brief time course of the F5–M1 interaction, indicating a local site of interaction, and the blockade of this interaction by muscimol injection in M1 (Cerri et al., 2003; Shimazu et al., 2004).
The important additional observation from the present study is that injections of muscimol in M1 also blocked the motor effects evoked by a repetitive ICMS protocol applied to the F5 hand representation. This protocol (typically ∼13 pulses at 333 Hz) is similar to that used to demonstrate the classical motor properties of motor cortical areas, including the ventral premotor cortex, with low-threshold effects in contralateral hand and finger muscles (Gentilucci et al., 1988; Godschalk et al., 1995). Our results suggest that this distinctive characteristic feature of the F5 subdivision of the PMv could be dependent on the integrity of M1 and may be mediated by connections between the F5 and M1. It is important to stress that F5 and M1 are reciprocally connected through distinct populations of corticocortical neurons (Dum and Strick, 2005). The results here should not be simply interpreted as M1 acting to “relay” motor outputs from F5, but rather that the integrity of these reciprocal connections is essential for neurons in F5 to gain access to the motor apparatus of the hand.
A previous report by Slovin et al. (2003) using optical imaging techniques showed that rICMS in one cortical motor area can lead to widespread physiological excitation of connected motor areas and this spread must be considered as contributing the motor output effects that are observed with rICMS, rather than assuming that they result solely from the stimulated area (Phillips and Porter, 1977).
The results reported here relate to acute inactivation of M1. Rather different mechanisms may be involved when M1 is inactivated by a permanent experimental lesion or by stroke. A number of studies have since identified powerful compensatory mechanisms which appear to allow the PMv to play a major role in the recovery process after chronic M1 lesions (Chollet et al., 1991; Liu and Rouiller, 1999; Nudo, 1999; Frost et al., 2003; Dancause et al., 2005; Ward, 2006; Ward and Frackowiak, 2006).
Nature of PMv–M1 connectivity
The PMv and the M1 hand area are richly interconnected (Muakkassa and Strick, 1979; Godschalk et al., 1984; Matelli et al., 1986; Ghosh et al., 1987; Dum and Strick, 2002, 2005). In the macaque, area F5 is the subdivision of the PMv related to hand and digit movements (Matelli et al., 1985, 1986), and is particularly strongly interconnected with the M1 hand representation (Matelli et al., 1986; Tokuno and Tanji, 1993). In the cebus monkey, Dum and Strick (2005) showed that the M1 digit representation, carefully defined electrophysiologically with rICMS, receives its strongest inputs from the digit representations in the PMv and dorsal premotor cortex; the PMv contributes ∼20% of the total corticocortical input labeled by tracer injection in the center of the M1 hand area.
It is likely that the local intracortical mechanisms that subserve the reciprocal connectivity between F5 and M1 are relatively indirect (Fig. 9). Single conditioning stimuli delivered to F5 produce powerful modulation of the later indirect (I2 and I3) waves of corticospinal activity evoked from M1, but have little or no effect on the D or early I1 waves (Shimazu et al., 2004). No evidence of direct monosynaptic responses in M1 to F5 stimulation have been published (Godschalk et al., 1984; Tokuno and Nambu, 2000). Finally, transneuronal retrograde labeling of the cortex after injections of the rabies virus into macaque hand muscles labeled CM neurons in the M1 hand representation in the rostral bank of the central sulcus; none was seen in PMv. Subsequent “tertiary” viral labeling of all cortical neurons directly connected to the labeled CM cells in M1 was also absent from PMv (Rathelot and Strick, 2006b).
Conclusion
The observations made in this study reinforce the concept that interactions between M1 and F5 hand representations may be of major importance in mediating outputs from PMv.
These results were obtained in lightly sedated monkeys (and data from terminal experiments under general anesthesia). Therefore, an unresolved issue is whether the motor effects evoked by PMv stimulation in the awake monkey are also suppressed by inactivation of the M1 hand area. Further investigations are also needed to determine whether F5-M1 interaction during natural behaviors, and especially during performance of visually guided grasp (Rizzolatti et al., 1998; Raos et al., 2006; Umilta et al., 2007) are mediated by similar pathways and mechanisms.
Footnotes
This work was supported by the Wellcome Trust and the Swiss National Science Foundation. We thank Alexander Kraskov and Numa Dancause for advice and Sam Shepherd, Gita Prabhu, Rachel Spinks, Jim Dick, Victor Baller, Ed Bye, David MacManus, and Robin Richards for their assistance.
References
- Amassian VE, Stewart M, Quirk GJ, Rosenthal JL. Physiological basis of motor effects of a transient stimulus to cerebral cortex. Neurosurgery. 1987;20:74–93. [PubMed] [Google Scholar]
- Armand J, Olivier E, Edgley SA, Lemon RN. Postnatal development of corticospinal projections from motor cortex to the cervical enlargement in the macaque monkey. J Neurosci. 1997;17:251–266. doi: 10.1523/JNEUROSCI.17-01-00251.1997. [DOI] [PMC free article] [PubMed] [Google Scholar]
- Baker SN, Philbin N, Spinks R, Pinches EM, Wolpert DM, MacManus DG, Pauluis Q, Lemon RN. Multiple single unit recording in the cortex of monkeys using independently moveable microelectrodes. J Neurosci Methods. 1999;94:5–17. doi: 10.1016/s0165-0270(99)00121-1. [DOI] [PubMed] [Google Scholar]
- Brochier T, Boudreau MJ, Pare M, Smith AM. The effects of muscimol inactivation of small regions of motor and somatosensory cortex on independent finger movements and force control in the precision grip. Exp Brain Res. 1999;128:31–40. doi: 10.1007/s002210050814. [DOI] [PubMed] [Google Scholar]
- Cerri G, Shimazu H, Maier MA, Lemon RN. Facilitation from ventral premotor cortex of primary motor cortex outputs to macaque hand muscles. J Neurophysiol. 2003;90:832–842. doi: 10.1152/jn.01026.2002. [DOI] [PubMed] [Google Scholar]
- Chollet F, DiPiero V, Wise RJ, Brooks DJ, Dolan RJ, Frackowiak RS. The functional anatomy of motor recovery after stroke in humans: a study with positron emission tomography. Ann Neurol. 1991;29:63–71. doi: 10.1002/ana.410290112. [DOI] [PubMed] [Google Scholar]
- Dancause N, Barbay S, Frost SB, Plautz EJ, Chen D, Zoubina EV, Stowe AM, Nudo RJ. Extensive cortical rewiring after brain injury. J Neurosci. 2005;25:10167–10179. doi: 10.1523/JNEUROSCI.3256-05.2005. [DOI] [PMC free article] [PubMed] [Google Scholar]
- Dancause N, Barbay S, Frost SB, Plautz EJ, Popescu M, Dixon PM, Stowe AM, Friel KM, Nudo RJ. Topographically divergent and convergent connectivity between premotor and primary motor cortex. Cereb Cortex. 2006;16:1057–1068. doi: 10.1093/cercor/bhj049. [DOI] [PubMed] [Google Scholar]
- Dum RP, Strick PL. The origin of corticospinal projections from the premotor areas in the frontal lobe. J Neurosci. 1991;11:667–689. doi: 10.1523/JNEUROSCI.11-03-00667.1991. [DOI] [PMC free article] [PubMed] [Google Scholar]
- Dum RP, Strick PL. Motor areas in the frontal lobe of the primate. Physiol Behav. 2002;77:677–682. doi: 10.1016/s0031-9384(02)00929-0. [DOI] [PubMed] [Google Scholar]
- Dum RP, Strick PL. Frontal lobe inputs to the digit representations of the motor areas on the lateral surface of the hemisphere. J Neurosci. 2005;25:1375–1386. doi: 10.1523/JNEUROSCI.3902-04.2005. [DOI] [PMC free article] [PubMed] [Google Scholar]
- Frost SB, Barbay S, Friel KM, Plautz EJ, Nudo RJ. Reorganization of remote cortical regions after ischemic brain injury: a potential substrate for stroke recovery. J Neurophysiol. 2003;89:3205–3214. doi: 10.1152/jn.01143.2002. [DOI] [PubMed] [Google Scholar]
- Galea MP, Darian-Smith I. Multiple corticospinal neuron populations in the macaque monkey are specified by their unique cortical origins, spinal terminations, and connections. Cereb Cortex. 1994;4:166–194. doi: 10.1093/cercor/4.2.166. [DOI] [PubMed] [Google Scholar]
- Gallese V, Fadiga L, Fogassi L, Rizzolatti G. Action recognition in the premotor cortex. Brain. 1996;119:593–609. doi: 10.1093/brain/119.2.593. [DOI] [PubMed] [Google Scholar]
- Gentilucci M, Fogassi L, Luppino G, Matelli M, Camarda R, Rizzolatti G. Functional organization of inferior area 6 in the macaque monkey. I. Somatotopy and the control of proximal movements. Exp Brain Res. 1988;71:475–490. doi: 10.1007/BF00248741. [DOI] [PubMed] [Google Scholar]
- Ghosh S, Brinkman C, Porter R. A quantitative study of the distribution of neurons projecting to the precentral motor cortex in the monkey (M. fascicularis) J Comp Neurol. 1987;259:424–444. doi: 10.1002/cne.902590309. [DOI] [PubMed] [Google Scholar]
- Godschalk M, Lemon RN, Kuypers HG, Ronday HK. Cortical afferents and efferents of monkey postarcuate area: an anatomical and electrophysiological study. Exp Brain Res. 1984;56:410–424. doi: 10.1007/BF00237982. [DOI] [PubMed] [Google Scholar]
- Godschalk M, Mitz AR, van der Burg H. Somatotopy of monkey premotor cortex examined with microstimulation. Neurosci Res. 1995;23:269–279. doi: 10.1016/0168-0102(95)00950-7. [DOI] [PubMed] [Google Scholar]
- He SQ, Dum RP, Strick PL. Topographic organization of corticospinal projections from the frontal lobe: motor areas on the lateral surface of the hemisphere. J Neurosci. 1993;13:952–980. doi: 10.1523/JNEUROSCI.13-03-00952.1993. [DOI] [PMC free article] [PubMed] [Google Scholar]
- Jacobs KM, Donoghue JP. Reshaping the cortical motor map by unmasking latent intracortical connections. Science. 1991;251:944–947. doi: 10.1126/science.2000496. [DOI] [PubMed] [Google Scholar]
- Jeannerod M, Arbib MA, Rizzolatti G, Sakata H. Grasping objects: the cortical mechanisms of visuomotor transformation. Trends Neurosci. 1995;18:314–320. [PubMed] [Google Scholar]
- Kermadi I, Liu Y, Tempini A, Rouiller EM. Effects of reversible inactivation of the supplementary motor area (SMA) on unimanual grasp and bimanual pull and grasp performance in monkeys. Somatosens Mot Res. 1997;14:268–280. doi: 10.1080/08990229770980. [DOI] [PubMed] [Google Scholar]
- Liu Y, Rouiller EM. Mechanisms of recovery of dexterity following unilateral lesion of the sensorimotor cortex in adult monkeys. Exp Brain Res. 1999;128:149–159. doi: 10.1007/s002210050830. [DOI] [PubMed] [Google Scholar]
- Maier MA, Armand J, Kirkwood PA, Yang HW, Davis JN, Lemon RN. Differences in the corticospinal projection from primary motor cortex and supplementary motor area to macaque upper limb motoneurons: an anatomical and electrophysiological study. Cereb Cortex. 2002;12:281–296. doi: 10.1093/cercor/12.3.281. [DOI] [PubMed] [Google Scholar]
- Martin JH. Autoradiographic estimation of the extent of reversible inactivation produced by microinjection of lidocaine and muscimol in the rat. Neurosci Lett. 1991;127:160–164. doi: 10.1016/0304-3940(91)90784-q. [DOI] [PubMed] [Google Scholar]
- Matelli M, Luppino G, Rizzolatti G. Patterns of cytochrome oxidase activity in the frontal agranular cortex of the macaque monkey. Behav Brain Res. 1985;18:125–136. doi: 10.1016/0166-4328(85)90068-3. [DOI] [PubMed] [Google Scholar]
- Matelli M, Camarda R, Glickstein M, Rizzolatti G. Afferent and efferent projections of the inferior area 6 in the macaque monkey. J Comp Neurol. 1986;251:281–298. doi: 10.1002/cne.902510302. [DOI] [PubMed] [Google Scholar]
- Matsumura M, Sawaguchi T, Oishi T, Ueki K, Kubota K. Behavioral deficits induced by local injection of bicuculline and muscimol into the primate motor and premotor cortex. J Neurophysiol. 1991;65:1542–1553. doi: 10.1152/jn.1991.65.6.1542. [DOI] [PubMed] [Google Scholar]
- Muakkassa KF, Strick PL. Frontal lobe inputs to primate motor cortex: evidence for four somatotopically organized “premotor” areas. Brain Res. 1979;177:176–182. doi: 10.1016/0006-8993(79)90928-4. [DOI] [PubMed] [Google Scholar]
- Murata A, Fadiga L, Fogassi L, Gallese V, Raos V, Rizzolatti G. Object representation in the ventral premotor cortex (area F5) of the monkey. J Neurophysiol. 1997;78:2226–2230. doi: 10.1152/jn.1997.78.4.2226. [DOI] [PubMed] [Google Scholar]
- Nudo RJ. Recovery after damage to motor cortical areas. Curr Opin Neurobiol. 1999;9:740–747. doi: 10.1016/s0959-4388(99)00027-6. [DOI] [PubMed] [Google Scholar]
- Olivier E, Baker SN, Nakajima K, Brochier T, Lemon RN. Investigation into non-monosynaptic corticospinal excitation of macaque upper limb single motor units. J Neurophysiol. 2001;86:1573–1586. doi: 10.1152/jn.2001.86.4.1573. [DOI] [PubMed] [Google Scholar]
- Phillips CG, Porter R. Corticospinal neurones. Their role in movement. New York: Academic; 1977. [PubMed] [Google Scholar]
- Poliakov AV, Schieber MH. Partial inactivation of the primary motor cortex hand area: effects on individuated finger movements. J Neurosci. 1998;18:9038–9054. doi: 10.1523/JNEUROSCI.18-21-09038.1998. [DOI] [PMC free article] [PubMed] [Google Scholar]
- Porter R, Lemon R. Corticospinal function and voluntary movement. Oxford: Clarendon; 1993. [Google Scholar]
- Raos V, Umilta MA, Murata A, Fogassi L, Gallese V. Functional properties of grasping-related neurons in the ventral premotor area F5 of the macaque monkey. J Neurophysiol. 2006;95:709–729. doi: 10.1152/jn.00463.2005. [DOI] [PubMed] [Google Scholar]
- Rathelot JA, Strick PL. Muscle representation in the macaque motor cortex: an anatomical perspective. Proc Natl Acad Sci USA. 2006a;103:8257–8262. doi: 10.1073/pnas.0602933103. [DOI] [PMC free article] [PubMed] [Google Scholar]
- Rathelot JA, Strick PL. The rostral and caudal zones of the primary motor cortex: differential projections upon hand motoneurons. Soc Neurosci Abstr. 2006b;32 806.16. [Google Scholar]
- Rizzolatti G, Camarda R, Fogassi L, Gentilucci M, Luppino G, Matelli M. Functional organization of inferior area 6 in the macaque monkey. II. Area F5 and the control of distal movements. Exp Brain Res. 1988;71:491–507. doi: 10.1007/BF00248742. [DOI] [PubMed] [Google Scholar]
- Rizzolatti G, Luppino G, Matelli M. The organization of the cortical motor system: new concepts. Electroencephalogr Clin Neurophysiol. 1998;106:283–296. doi: 10.1016/s0013-4694(98)00022-4. [DOI] [PubMed] [Google Scholar]
- Rouiller EM, Yu XH, Moret V, Tempini A, Wiesendanger M, Liang F. Dexterity in adult monkeys following early lesion of the motor cortical hand area: the role of cortex adjacent to the lesion. Eur J Neurosci. 1998;10:729–740. doi: 10.1046/j.1460-9568.1998.00075.x. [DOI] [PubMed] [Google Scholar]
- Schmidlin E, Wannier T, Bloch J, Rouiller EM. Progressive plastic changes in the hand representation of the primary motor cortex parallel incomplete recovery from a unilateral section of the corticospinal tract at cervical level in monkeys. Brain Res. 2004;1017:172–183. doi: 10.1016/j.brainres.2004.05.036. [DOI] [PubMed] [Google Scholar]
- Schmidlin EO, Brochier T, Maier MA, Lemon RN. Cortico-cortical interactions in macaque motor cortex investigated with intracortical microstimulation (ICMS) and transient inactivation with muscimol. Soc Neurosci Abstr. 2006;32 255.17. [Google Scholar]
- Shimazu H, Maier MA, Cerri G, Kirkwood PA, Lemon RN. Macaque ventral premotor cortex exerts powerful facilitation of motor cortex outputs to upper limb motoneurons. J Neurosci. 2004;24:1200–1211. doi: 10.1523/JNEUROSCI.4731-03.2004. [DOI] [PMC free article] [PubMed] [Google Scholar]
- Slovin H, Hildesheim R, Strick P, Grinvald A. Voltage-sensitive dye imaging in the motor cortex I. Intra- and intercortical connectivity revealed by microstimulation in the awake monkey. Soc Neurosci Abstr. 2003;29 554.8. [Google Scholar]
- Spinks RL, Baker SN, Jackson A, Khaw PT, Lemon RN. Problem of dural scarring in recording from awake, behaving monkeys: a solution using 5-fluorouracil. J Neurophysiol. 2003;90:1324–1332. doi: 10.1152/jn.00169.2003. [DOI] [PubMed] [Google Scholar]
- Tokuno H, Nambu A. Organization of nonprimary motor cortical inputs on pyramidal and nonpyramidal tract neurons of primary motor cortex: an electrophysiological study in the macaque monkey. Cereb Cortex. 2000;10:58–68. doi: 10.1093/cercor/10.1.58. [DOI] [PubMed] [Google Scholar]
- Tokuno H, Tanji J. Input organization of distal and proximal forelimb areas in the monkey primary motor cortex: a retrograde double labeling study. J Comp Neurol. 1993;333:199–209. doi: 10.1002/cne.903330206. [DOI] [PubMed] [Google Scholar]
- Umilta MA, Brochier T, Spinks RL, Lemon RN. Simultaneous recording of macaque premotor and primary motor cortex neuronal populations reveals different functional contributions to visuomotor grasp. J Neurophysiol. 2007;98:488–501. doi: 10.1152/jn.01094.2006. [DOI] [PubMed] [Google Scholar]
- Ward NS. The neural substrates of motor recovery after focal damage to the central nervous system. Arch Phys Med Rehabil. 2006;87:30–S35. doi: 10.1016/j.apmr.2006.08.334. [DOI] [PubMed] [Google Scholar]
- Ward NS, Frackowiak RS. The functional anatomy of cerebral reorganisation after focal brain injury. J Physiol (Paris) 2006;99:425–436. doi: 10.1016/j.jphysparis.2006.03.002. [DOI] [PubMed] [Google Scholar]
- Wiesendanger M, Seguin JJ, Kunzle H. The supplementary motor area, a control system for posture? In: Stein RB, Pearson KG, Smith RS, Redford JB, editors. Control of posture and locomotion. New York: Plenum; 1987. pp. 331–346. [Google Scholar]