Abstract
Extensive theoretical and experimental work on the neuronal correlates of visual attention raises two hypotheses about the underlying mechanisms. The first hypothesis, named biased competition, originates from experimental single-cell recordings that have shown that attention upmodulates the firing rates of the neurons encoding the attended features and downregulates the firing rates of the neurons encoding the unattended features. Furthermore, attentional modulation of firing rates increases along the visual pathway. The other, newer hypothesis assigns synchronization a crucial role in the attentional process. It stems from experiments that have shown that attention modulates gamma-frequency synchronization. In this paper, we study the coexistence of the two phenomena using a theoretical framework. We find that the two effects can vary independently of each other and across layers. Therefore, the two phenomena are not concomitant. However, we show that there is an advantage in the processing of information if rate modulation is accompanied by gamma modulation, namely that reaction times are shorter, implying behavioral relevance for gamma synchronization.
Keywords: computational, model, attention, gamma, synchronization, visual
Introduction
Our environment constantly provides us with large amounts of information. The brain has to select the relevant part of this information. This selection is called attention. Experimental work on the visual system has suggested a mechanism based on competition for the limited visual processing capacity at the different stages of the visual system to account for attention. This mechanism is referred to as biased competition (Moran and Desimone, 1985; Chelazzi et al., 1993; Desimone and Duncan, 1995; Chelazzi, 1999). The basic idea of biased competition is that, when multiple stimuli appear in the visual field, the firing rate of the neurons encoding the attended stimulus is biased over the neurons encoding unattended stimuli. The cells representing the attended stimulus will therefore win the competition and suppress the firing rate of the cells representing the unattended stimulus.
In recent years, oscillations in the gamma-frequency band (30–100 Hz) have been found in most species and brain areas investigated, including the visual cortex (Gray and Singer, 1989). Synchronization of neuronal activity in the gamma-frequency band has been shown to be involved in several fundamental functions in the brain. Notably, neurons selected by attentional mechanisms show enhanced gamma-frequency synchronization (Gruber et al., 1999; Steinmetz et al., 2000; Fries et al., 2001). In particular, Fries et al. (2001) measured from area V4 while macaque monkeys were attending behaviorally relevant stimuli. They found that neurons activated by the attended stimulus showed increased gamma-frequency synchronization compared with neurons activated by the distractor. Conversely, Roelfsema et al. (2004), who measured from V1, could not confirm this finding.
A computational model for biased competition has been proposed by Deco and Rolls (2005). They have shown that competition between pools of neurons combined with top-down biasing of this competition gives rise to a process that can be identified as attentional processing. However, they limit their analysis to studying rate effects. The effects on gamma synchronization are not addressed. This leaves some open questions: Is attention modulated by both rates and gamma synchronization? Are they both mutually exclusive or are they concomitant effects?
In this study, we address these questions by modeling one layer of the visual cortex with a network of integrate-and-fire (IF) neurons. Attention is modeled as an additional Poissonian input to the neurons encoding the attended stimulus. We find that the effect of the attentional bias can be both an increase in the rates or an increase in the gamma synchronization. Depending on the dynamical working regimen, one of the two effects is dominant. Rate modulation occurs over the whole range of parameters studied and can occur without accompanying gamma modulation. Conversely, gamma modulation never occurs without rate modulation. However, gamma modulation can be altered without affecting the present rate modulation. We further show that the mean rate in the pools encoding the stimulus is reached fastest in the working regimen in which gamma modulation is strongest. Altogether we show that gamma modulation and rate modulation are not concomitant effects. However, if both are present, the information is processed advantageously, i.e., reaction times (RTs) are shorter. This suggests that gamma modulation is behaviorally relevant.
The model was then extended to two layers, representing V1 and V4. We show that the attentional effects are stronger in the upper layer. This is in accordance with an increase of gamma-frequency modulation along the visual pathway and might be an explanation of why this effect has been found in V4 but not in V1.
Materials and Methods
Experimental paradigm
We propose a model to account for the results from the attentional visual task used by Fries et al. (2001). In this task, the monkey had to fixate a central spot. After 1500–2000 ms, two stimuli, consisting of black and white luminance grating, appeared. We will call the attended stimulus target and the one that is unattended the distractor. A cue indicated where to locate attention. The cue was either the color of the fixation spot or a line next to the fixation spot, pointing to the location of the target. After 500–5000 ms, one of the two stimuli changed its color to yellow. This change was close to the monkey's detection threshold. If the color change occurred in the target, the monkey had to respond by releasing a bar. If it occurred in the distractor, the monkey had to ignore it. The monkey was only rewarded if it released a bar after change in the target. The monkeys performed ∼85% correctly.
All recordings were done in the extrastriate cortical area V4 of the visual cortex. From the two presented stimuli, one was inside the recorded receptive field (RF), and one was outside. The condition in which the monkey was attending to the stimulus inside the RF is referred to as “with attention,” and the condition with attention outside the RF as “without attention.” To measure the synchronization between spikes and the local field potential (LFP), the spike-triggered average (STA) and its power spectrum are used (see below).
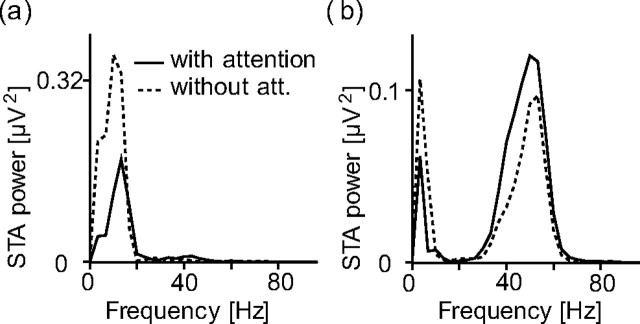
Fries et al. (2001) found that there are two dominating frequency bands in the STA during the stimulus period: one below 10 Hz and another between 35 and 50 Hz. During the delay period, in the with-attention condition, there was a reduction in the low-frequency synchronization (Fig. 1a). During the stimulus period, in the with-attention condition, there was a reduction in the low-frequency synchronization and an increase in the gamma-frequency synchronization (Fig. 1b). Simultaneously, the median of the firing rates was enhanced by 16% during the state of attention.
Figure 1.
STA power spectra. Dashed curve, Attention outside the RF; solid curve, attention into the RF. Adapted from Fries et al. (2001). a, Power spectrum of the delay period STAs. The delay period was the 1 s interval before stimulus onset. b, Power spectrum of the stimulus-period STAs. The stimulus period lasted from 300 ms after stimulus onset until one of the stimuli changed its color.
Theoretical framework
As a description at the neural level, we use models of neurons with leaky IF dynamics. We follow the model of Brunel and Wang (2001). A leaky IF unit consists of a single membrane capacitance Cm for integrating the charge delivered by synaptic input, a membrane resistance Rm, accounting for leakage currents through the membrane, and a fixed voltage threshold Vthr for spike initiation. The membrane charges up to its stationary value as long as the membrane potential stays below Vthr. If it reaches the threshold potential, an action potential is fired. All connected neurons receive an input, the circuit is shunted for a refractory time period τrefr, and the membrane potential is reset to Vreset.
Synaptic currents are mediated by the excitatory receptors AMPA and NMDA (activated by glutamate) and the inhibitory receptor GABAA (activated by GABA). There are two types of excitatory synapses. AMPA and NMDA receptors have different time constants: AMPA decays very fast (2 ms), whereas NMDA decays slowly (100 ms). The decay constant of GABA (10 ms) lies between the two. These decay constants determine the oscillation frequency of the network (see below).
The network is organized in pools. Pools are created because different parts of the network get different exposure to stimuli. Neurons in one pool are defined by increased mutual connection strength and by the input they receive. The synaptic efficacies are kept fixed through the simulation. They are set consistent with a Hebbian rule: the synapse between two cells is strong if they were active in a correlated manner in the past. Therefore, cells within one pool have strong recurrent connections (w+), whereas the connections between pools are weak (w−). Details for all the weights in the network (w+, w−, wI, wn) are given below.
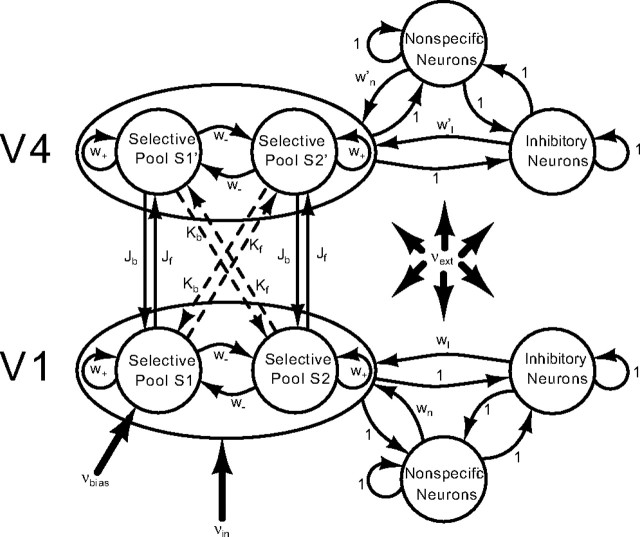
Our model, shown in Figure 2, consists of two layers (corresponding to V1 and V4). Each layer consists of 800 pyramidal neurons and 200 interneurons. These proportions are the ones observed in the cerebral cortex. The network is fully connected. Sparse connectivity has been shown to increase mainly the noise in the network as a result of finite size effects (Mattia and Del Giudice, 2002, 2004). Because noise was not an explicit point of this study, we used the simplification of all-to-all connectivity. Each layer is subdivided into four pools. There are three pools of excitatory neurons (the two selective pools and the nonspecific neurons) that are all connected to one pool of inhibitory neurons. The selective pools are the ones that receive the input, either externally (as in V1) or from the lower layer (as in V4). They have strong recurrent connections (w+). The nonspecific pool emulates the spontaneous activity in surrounding brain areas. Neurons in the nonspecific pool are connected to the selective excitatory pools by a feedforward connection of wn = (−fJb − fKb)/(1 − 2f) + w− in layer V4 and w′n = (−fJf − fKf)/(1 − 2f) + w− in layer V1. (f is the fraction of excitatory neurons in each selective pool, i.e., each selective pool contains f × NE neurons, NE being the total number of excitatory neurons in the network.) These connections normalize each layer so that the overall recurrent excitatory synaptic drive in the spontaneous state remains constant as the external connections Jf, Jb, Kf, and Kb are varied. The selective pools (S1, S2, S1′, S2′) of the two layers are connected to each other. Within one layer, this connection is given by w− = 1 − f(w+ − 1)/(1 − f), so that the overall recurrent excitatory drive in the spontaneous state remains constant as w+ is varied. Between the layers, we take into account that a stimulus that is a preferred one for S1 (S2) also provokes a strong stimulation of S1′ (S2′). Therefore, the J connections are stronger than the K connections (Kx = cJx, with c = 0.1).
Figure 2.
Schematic representation of the network. The network consists of inhibitory and excitatory neurons. The excitatory neurons are organized in three pools per layer: the nonspecific neurons and the two selective pools (S1, S2 or S1′, S2′) that receive the input encoding the stimulus vin. One of the two selective pools gets an additional bias vbias. All neurons in the network get an input vext that simulates the spontaneous activity in the cerebral cortex. The selective pools of the two layers are connected. There are strong (Jf) and weak (Kf) feedforward connections and strong (Jb) and weak (Kb) feedback connections. Recurrent connections are denoted as w+, and between-pool connections are denoted as w−. wI, w′I are the connection weights from the inhibitory to the excitatory pools, and wn, w′n are the connection weights from the nonspecific to the selective pools.
The two selective pools in layer V1 (S1, S2) encode two nonoverlapping RFs. The RFs in layer V4 are larger, each covering the two selective pools in V1. By having overlapping RFs, the competition in V4 is stronger than in V1. This is taken into account by setting the inhibitions to wI = 1 in V1 and w′I = 1.35 in V4.
By having only one inhibitory pool per layer, each layer has global inhibition. Deco and Rolls (2004) showed that, in a model with biased competition, inhibition has gradually increasing global character along the visual pathway. Because we implement only a minimal model in this study, we use global inhibition directly. The more active the excitatory pools are, the more active the inhibitory pool will be and, consequently, excitatory pools will compete. By introducing an external top-down bias, i.e., an increase of excitatory input to the pool representing the attended stimulus, the competition can be shifted in favor of a specific pool. This computational model implements therefore the biased competition hypothesis. Deco and colleagues have shown that local competition of neurons between pools combined with top-down biasing of this competition gives rise to a process that can be identified with attentional filtering (Deco et al., 2002; Szabo et al., 2004). This is in line with the biased-competition model of attention by Chelazzi et al. (1993).
In our model of attention, we assume that the stimulus (vin) is passed on to the modeled brain area V1 as a Poisson spike train of typically 250 Hz. The attentional bias (vbias) was modeled as a Poisson spike train of typically 4–8 Hz, received only by the attended pool S1. In addition to the recurrent connection, the network is exposed to an external current (vext), modeled as a Poisson spike train of 800 neurons, firing at 3 Hz. This is consistent with the spontaneous activity observed in the cerebral cortex.
In a network consisting of excitatory and inhibitory neurons with recurrent connections, oscillations are generated by a pyramidal-to-interneuron loop (Brunel and Wang, 2003). This oscillation frequency depends on the relative timescales of the decay constants. Faster excitation than inhibition, or a higher excitation/inhibition ratio, favors the feedback loop and gives rise to oscillations in the gamma range (Brunel and Wang, 2003). In our network, oscillations are therefore generated by adjusting the conductances gAMPA and gNMDA. An increase of gAMPA and a decrease of gNMDA is equivalent to an increase in the excitation/inhibition ratio and would increase oscillations. The conductances in our network are varied according to the following rule: gNMDA = gNMDA (1 − δ) and gAMPA = gAMPA (1 + 10δ). Throughout the paper, we will refer to the parameter δ as the gAMPA/gNMDA ratio. The factor 10 stems from the fact that, near the firing threshold, the ratio of NMDA/AMPA components becomes 10 in terms of charge entry, as stated by Brunel and Wang (2001). Therefore, to not change the spontaneous state, a decrease in gNMDA is compensated by a 10-fold increase in gAMPA. All recurrent conductances (both inhibitory and excitatory) are changed according to these rules. The excitation/inhibition ratio is adjusted so that the network only shows oscillations during the stimulus presentation.
All simulations were initiated with a period of 1000 ms in which no stimulus was presented, followed by a period of 1000 ms composed of the presentation of the stimuli and the attentional bias, followed by another 200 ms in which no stimulus was presented. The evolution of spiking activity was averaged over all the neurons in the pool and over 200 trials initialized with different random seeds.
The mathematical details of the network and a table with the default values for all the parameters can be found in the supplemental data (available at www.jneurosci.org as supplemental material).
Analysis
Local field potential.
In their experiment, Fries et al. (2001) use separate extracellular electrodes to record spikes and LFP activity. The spikes measured from one electrode belong to 2–10 neurons. They state that the LFP reflects the average transmembrane currents of neurons in a volume of a few hundred micrometers radius around the electrode tip.
In our simulations, we have access to all the spikes of all the neurons in one pool, and therefore we calculate the LFP as an average over all neurons in one pool. The LFP is thought to be a weighted average of the input signals of a neural population (for a revision, see Logothetis, 2003). Because it is not exactly clear what measure in a simulation corresponds to this, we used three different ways of calculating the LFP. The first method was to average the spike rates of all neurons in one pool. The second one was to average the membrane potentials of all neurons in one pool. The third one was to average the incoming synaptic currents to a neuron over all neurons. We found that, in our case, these three measurements were highly correlated and that the qualitative results did not depend on the way we computed the LFP. The results reported here are obtained using method one. From the similarity of the three measurements, one could deduce that looking at spike–spike correlations instead of spike–LFP correlations might suffice. However, to be able to compare our results with the experimental results, we still need to calculate the LFP.
Spike-triggered average.
To measure the synchronization between spikes and the LFP, we used the STA. We used the same method as Fries et al. (2001) to be able to compare our modeling results with the experimental ones. An explanatory figure of the way the STA is calculated is plotted in supplemental Figure 1 (available at www.jneurosci.org as supplemental material). Around each spike time, a window of predefined size (typically ±100 ms) is cut out of the LFP. These time windows are plotted as shaded areas. The average over all these windows is called the STA. To characterize the STA, we calculate its power spectrum, using a fast Fourier transformation. The resulting power spectrum is then normalized by dividing it by the total power in the spectrum. The idea behind the STA is that, if spike times have a reliable temporal relation to the local neuronal activity as measured by the LFP, these fluctuations add up during the averaging process. Otherwise, if there is no temporal relation between spike times and the activity of surrounding neurons, fluctuations in the LFP average out during averaging. We define the low-frequency range as 0–20 Hz and the gamma-frequency range as 35–65 Hz.
Attentional modulation.
We denote the stationary values of the averaged firing rate in the attended state with vatt and in the unattended state with vnoatt. The firing rate is averaged over the period from 200 ms after the stimulus onset until the end of the stimulus presentation. Similarly, we calculate the STA with all the spikes occurring in the period from 200 ms after the stimulus onset until the end of the stimulus presentation, once for the pool of neurons encoding the attended stimulus (STAatt), and once for the pool encoding the unattended stimulus (STAnoatt). The power spectrum of these two STAs we denote as pSTAatt and pSTAnoatt, respectively. The attentional modulation in the selective pools is then given by
with ξ being one of v or pSTA.
Results
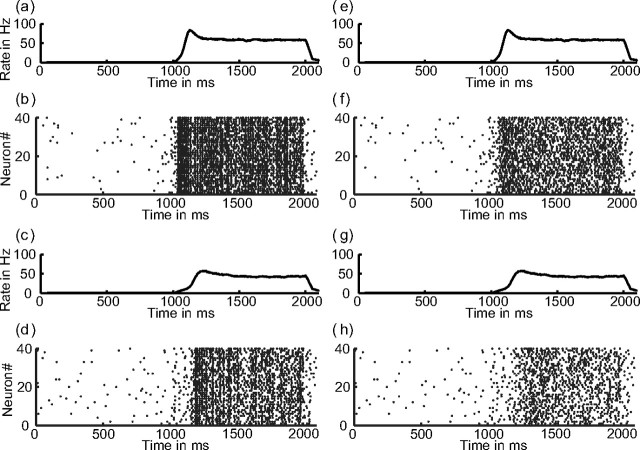
The aim of this study is to show the relationship between attentional rate modulation and attentional gamma modulation. First, we show how oscillations are generated in the network and that there are only oscillations in the gamma band if a stimulus is present. Then, we study the parameters that influence attentional modulation, in particular the attentional bias, inhibition, and the synchronization in the network. We show that rate modulation and gamma modulation are not concomitant but that it is advantageous if both are present. This suggests behavioral relevance for gamma modulation. Finally, we study attentional modulation in different layers and show that both gamma and rate modulation are stronger in the upper layer. This is compatible with an increase of attentional modulation along the visual pathway. Figure 3 shows a raster plot of a typical trial with neurons synchronizing after the stimulus onset at 1000 ms.
Figure 3.
Raster plot of 40 neurons from the selective pools in V1. Stimulus onset is at 1000 ms and stimulus offset at 2000 ms. a–d, Neurons in the oscillatory regimen (gAMPA/gNMDA ratio of 0.12). a, Average rate with attention. b, Spikes with attention. c, Average rate without attention. d, Spikes without attention. e–h, Neurons outside the oscillatory regimen (gAMPA/gNMDA ratio of 0.0).
Oscillation generation
As explained in Materials and Methods, the crucial parameter to generate oscillations in the network is the relative contribution of the slow NMDA and the fast AMPA receptors to the total synaptic currents.
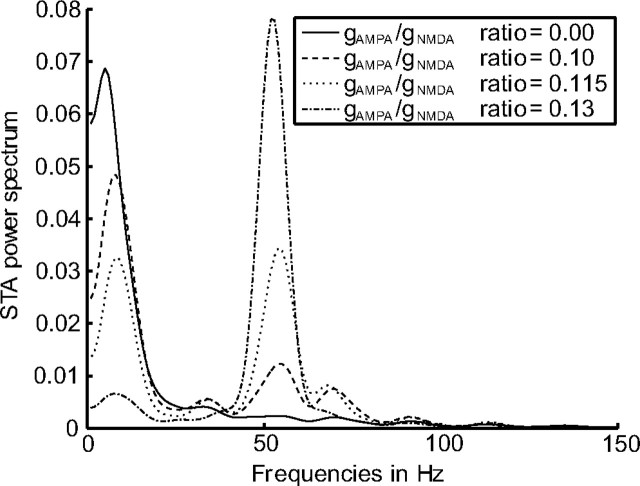
Figure 4 shows the power spectrum of the STA during the stimulus period for selected values of the gAMPA/gNMDA ratio. For low contributions of gAMPA (e.g., solid curve), there is little power in the gamma-frequency band, and for a high contribution of gAMPA (e.g., dash dotted curve), there is a lot of power in the gamma-frequency band.
Figure 4.
Changes in the STA power spectrum depending on the gAMPA/gNMDA ratio. For a selection of gAMPA/gNMDA ratios (indicated in the figure legend), we plot the power spectrum of the corresponding STAs. Averaged over 20 trials.
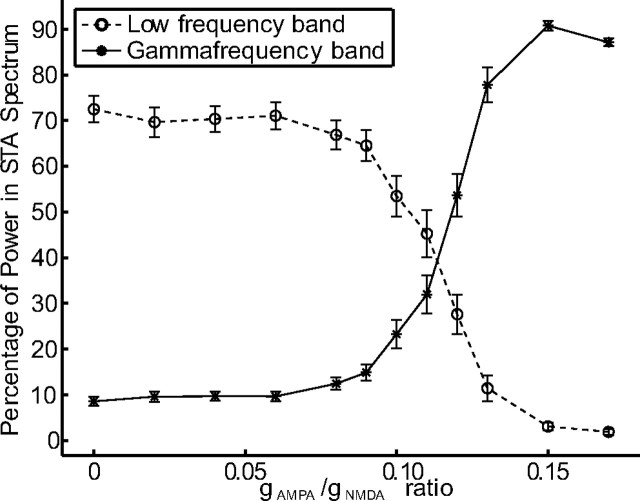
The effects on the low-frequency and the gamma-frequency band are shown separately in Figure 5. We plot the percentage of power in the STA for the low-frequency (dashed curve) and the gamma-frequency band (solid curve) against different values of the gAMPA/gNMDA ratio. The more gAMPA is increased, the stronger the oscillations in the gamma-frequency band and the weaker the oscillations in the low-frequency band. In the experiment by Fries et al. (2001), the peak values in the power spectrum of the STA were approximately equal for the low-frequency and the gamma-frequency band. Therefore, in the range of gAMPA/gNMDA from 0.11 to 0.13, the network exhibits the same power distribution as found in the experiment by Fries et al. (2001).
Figure 5.
Power in the low-frequency (0–20 Hz) and gamma-frequency (35–65 Hz) band of the STA depending on the gAMPA/gNMDA ratio. For each value of the gAMPA/gNMDA ratio, we plot the percentage of power in the low-frequency band (dashed curve) and in the gamma-frequency band (solid curve). The error bars indicate the 95% confidence intervals. Averaged over 20 trials.
Stimulus presentation
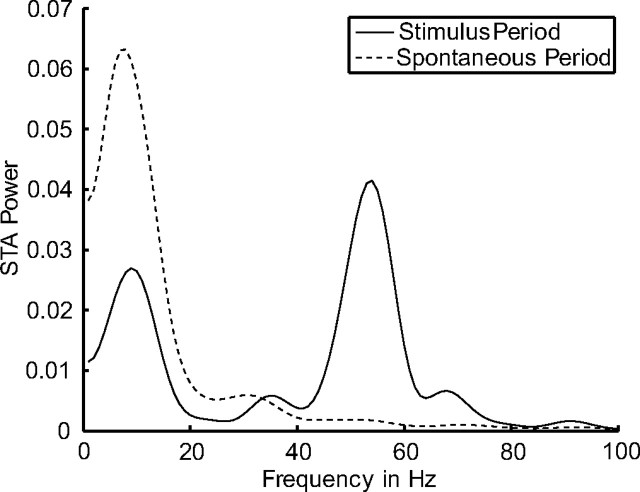
In the experimental findings by Fries et al. (2001), the peak in the gamma band of the power spectrum of the STA is only observed during the stimulus presentation. Our model has the same property (illustrated in Fig. 6). We plot the power spectrum of the STA on the y-axis against the frequencies on the x-axis. It demonstrates clearly the desired behavior, namely that almost all the power is in the low-frequency band during the delay (spontaneous) period before stimulus onset (dashed curve). During the stimulus presentation (solid curve), the percentages of power in the low-frequency band and in the gamma-frequency band are equilibrated.
Figure 6.
Example power spectrum of an STA comparing stimulus and delay (spontaneous) period. The power spectrum of an STA is plotted for the stimulus period (solid curve) and the delay period (dashed curve). Averaged over five trials.
Parameters that modify attentional modulation
What parameters does the attentional modulation of the rates and gamma-frequency synchronization depend on?
Bias
The most obvious parameter that influences attentional modulation is the applied bias (vbias). The modulation of the rates and the gamma-frequency synchronization both correlate positively with the bias (Fig. 7a). Additionally, we observe also that the total gamma power in the STA spectrum increases with the bias. The gamma power shown is the average of the gamma power in the two selective pools (S1, S2).
Figure 7.
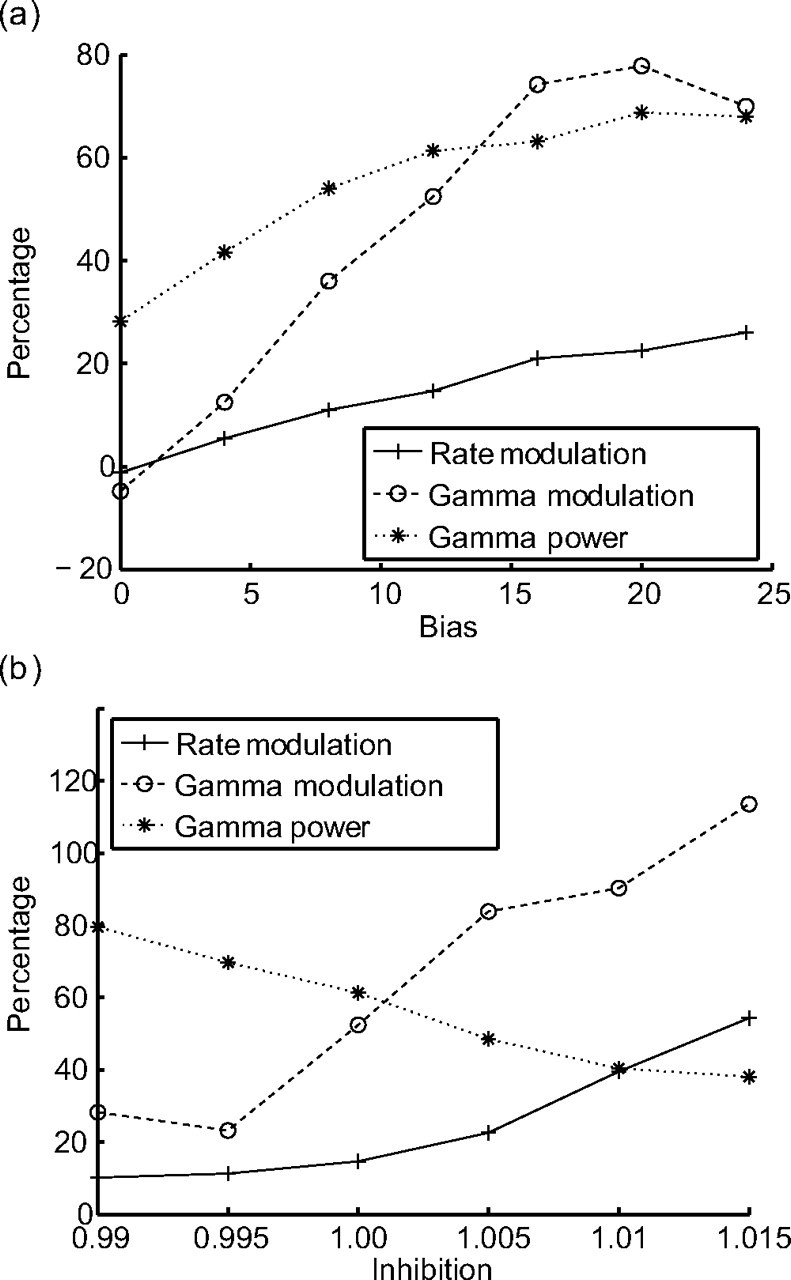
Dependences of attentional modulation on inhibition and bias. Gamma power (dotted curve) shows how much of the power of the spectrum is in the gamma band. Rate modulation (solid curve) and gamma modulation (dashed curve) show the difference between attended and unattended pools in percentage. Averaged over 200 trials. a, Gamma power, rate modulation, and gamma modulation as a function of bias. For increasing bias, synchronization, rate modulation, and gamma modulation increase. b, Gamma power, rate modulation, and gamma modulation as a function of inhibition. For increasing inhibition, synchronization decreases, whereas both rate modulation and gamma modulation increase.
Inhibition
Another parameter modifying attentional modulation is the inhibition in the network(wI). To study its influence, we modify the connection weights of the inhibitory pool to the selective pools. Again we observe that both the rate and the gamma-frequency modulation correlate positively with the inhibitory weights (Fig. 7b). However, contrary to the bias, the total power in the gamma-frequency band decreases with more inhibition and therefore shows a negative correlation with the attentional modulation.
Altogether, we observe that, with increasing competition (either higher bias or stronger inhibition), the attentional modulation in the network also increases. However, synchronization increases as a function of bias and decreases as a function of inhibition.
Level of synchronization in the network
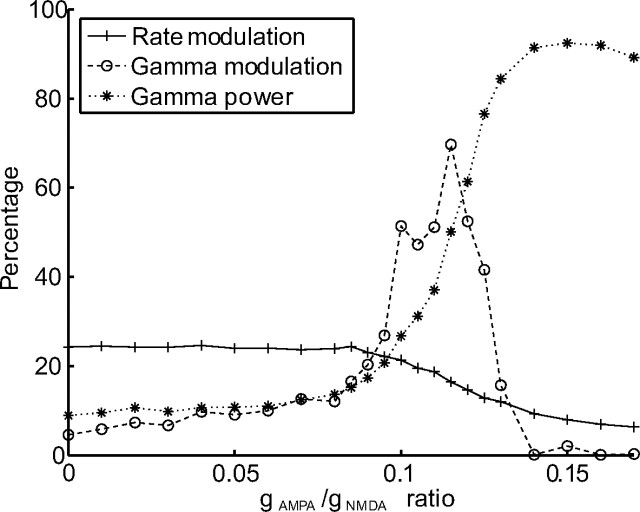
Next we studied how the attentional modulations were affected by directly modifying the level of gamma-frequency oscillation in the network. To do so, we adjusted the gAMPA/gNMDA ratio. The power in the gamma-frequency band increases monotonically with this ratio until reaching a level of >0.9, meaning that >90% of the power is concentrated in the gamma-frequency band (Fig. 8). The rate modulation as a function of the gAMPA/gNMDA ratio shows a constant decrease. The gamma-frequency modulation increases until a gAMPA/gNMDA ratio of ∼0.12 is reached and then decreases. In summary, rate and gamma-frequency modulation do not covary. The fact that rate modulation and gamma modulation can vary independently of each other should be considered as one of our main results. A comparison with the experimental findings by Fries et al. (2001) shows that, for a gAMPA/gNMDA ratio between 0.10 and 0.13, our model reveals similar attentional modulations.
Figure 8.
Rate modulation (solid) and gamma modulation (dashed) as a function of the gAMPA/gNMDA ratio. The main effect of increasing the gAMPA/gNMDA ratio is an increase in the network synchronization in the gamma band (dotted). The rate modulation decreases monotonically with the gAMPA/gNMDA ratio. The gamma modulation increases until a gAMPA/gNMDA ratio of ∼0.12 and then decreases to almost 0. The figure shows that either of the two types of attentional modulation can be predominant. Averaged over 200 trials.
If a stimulus is presented to the network, the rates in the selective pools (S1, S2) rise. The time it takes a pool to reach its mean frequency from stimulus onset is here referred to the RT. RTs are shortest for a gAMPA/gNMDA ratio of 0.12 (Fig. 9a). Furthermore, we observe that these RTs are different for the attended and the unattended pool, the ones of the attended pool being shorter. The difference in RT is shown in Figure 9b. The biggest difference in RT we find for a gAMPA/gNMDA ratio of ∼0.12, which is also the range at which attentional gamma modulations are strongest. A crucial observation is the fact that the RTs inversely correlate with the attentional modulation in the gamma band, i.e., the higher the attentional modulation, the shorter the RTs. Thus, our results show that gamma modulations make the system more efficient in terms of RTs, which suggests that gamma modulation has behavioral relevance.
Figure 9.
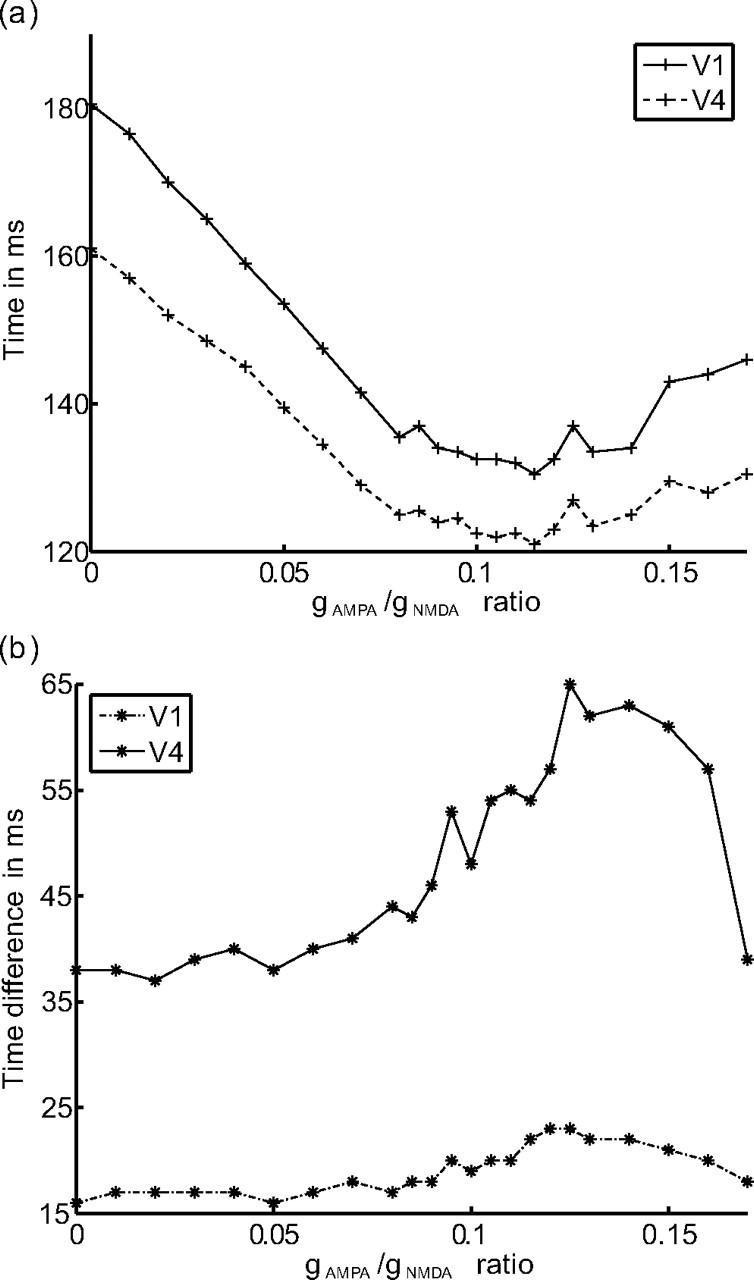
Reaction times. a, Average time to reach the mean activity level after stimulus presentation in the selective pools. A higher gAMPA/gNMDA ratio makes the rates rise faster. The mean activity level is reached fastest for a gAMPA/gNMDA ratio between 0.10 and 0.13. In this range, also the attentional gamma modulation is maximal. b, Time difference in reaching the mean activity level after stimulus presentation between the pools encoding the attended and the unattended stimulus. This difference is biggest for a gAMPA/gNMDA ratio ∼0.12, which is also the range in which attentional gamma modulation is maximal.
Comparison of two different layers
One of the goals of this work was to study the variation of attentional modulation along the visual pathway. To address this question, we compare the attentional modulation in two connected layers (V1, V4). The comparison shows that the modulatory effects in both layers are quite similar, although more pronounced in the upper layer (V4). The gamma modulation in the upper layer (V4) is up to 50% stronger than in the lower layer (V1). The rate modulation in V4 is ∼28% stronger than in V1 (Fig. 10a). In summary, we find that the attentional modulation is stronger in the upper layer than in the lower one. These modeling results are thus consistent with an increase of the gamma-frequency modulation along the visual pathway.
Figure 10.
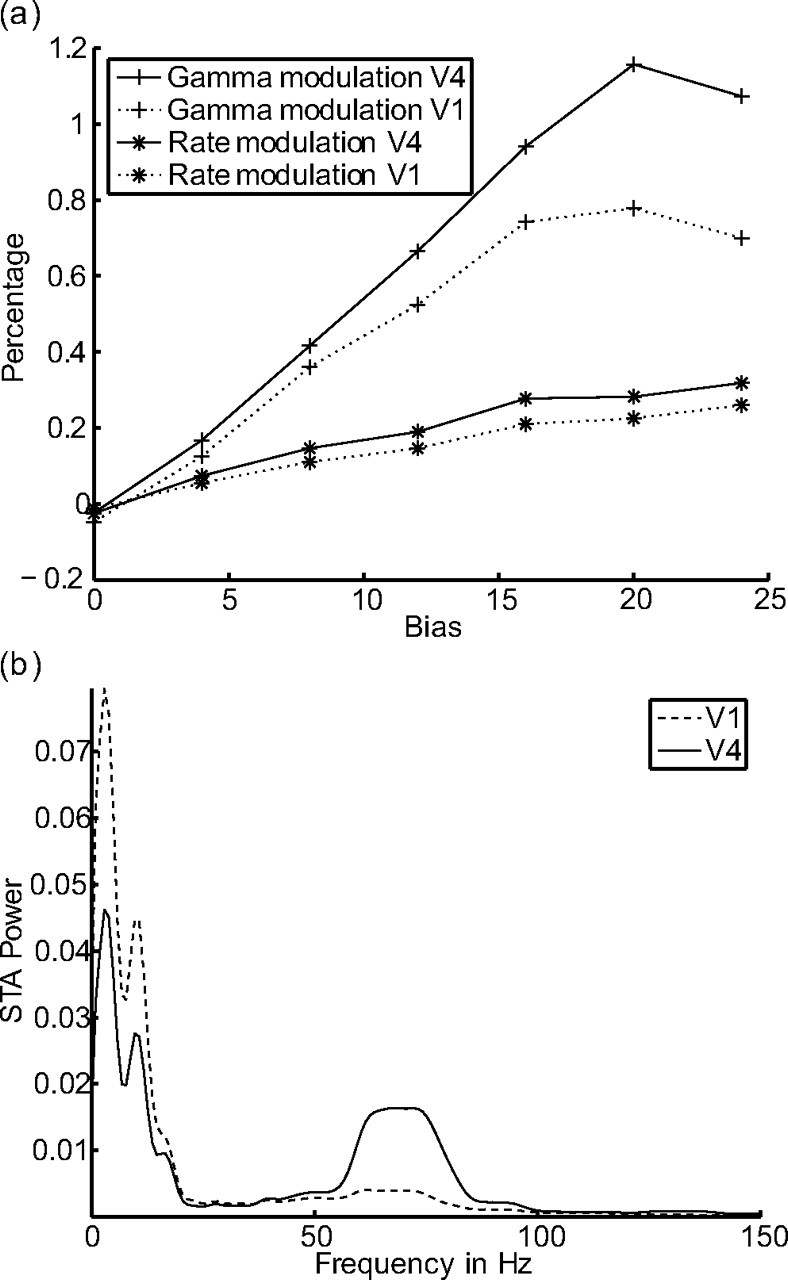
Comparison of attentional modulation in two layers. a, Differences in attentional modulation between the two layers V1 and V4. The gamma modulation in the upper layer is up to 50% stronger than in the lower layer. The rate modulation in V4 is up to 28% stronger than in V1. In general, modulations in V4 are stronger than modulations in V1. b, Different gAMPA/gNMDA ratio in the two layers. The gAMPA/gNMDA ratio in layer V1 is 0.0 and in layer V4 is 0.15. Layer V4 clearly synchronizes in the gamma-frequency band, whereas V1 does not.
In summary, we show that there is an increase in the gamma modulation from the lower layer to the upper layer even if the gAMPA/gNMDA ratio is the same in both layers. If we now modify this ratio independently in the different layers, we observe that whichever layer has its gAMPA/gNMDA ratio closer to 0.12 (which is the optimal ratio to evoke gamma oscillations) has the higher gamma synchronization and the higher gamma modulation. This means that the upper layer can oscillate at gamma frequency, although the lower layer shows no or very little synchronization in the gamma band (Fig. 10b).
In our model, we make the assumption that the gAMPA/gNMDA ratio increases in the posterior ventral cortex. Conversely, it is often claimed that the gAMPA/gNMDA ratio decreases toward prefrontal cortex, to stabilize memory. We assume here that the gAMPA/gNMDA ratio increases only along the posterior ventral cortex (in which memory is of less importance) and then decreases again toward prefrontal cortex.
Discussion
We study the two hypotheses of the neural correlates of attention with our computational framework. We implement a minimal model of leaky IF neurons that has global inhibition and is fully connected. Our network shows oscillations in the gamma-frequency range. Whether there are oscillations or not depends on the relative contributions of AMPA- and NMDA-mediated currents (gAMPA/gNMDA ratio). As Brunel and Wang (2003) state, the properties of the firing rhythm are determined essentially by the ratio of timescales of excitatory and inhibitory currents and by the balance between the mean recurrent excitation and inhibition. Faster excitation than inhibition, or a higher excitation/inhibition ratio, favors the feedback loop and oscillations in the gamma range.
These oscillations appear only when the stimulus is present. If one of the two inputs to the network is enhanced by an attentional bias, the synchronization between spikes and the local field potential in the gamma-frequency band is enhanced. The increase in gamma-frequency oscillations is stable over a wide range of input. We find that, depending on the gAMPA/gNMDA ratio, there is a range in which the attentional bias leads to either an increase in the firing rate or an increase in the gamma-frequency band synchronization. About a possible origin of this ratio in the real brain we can only speculate. The gAMPA/gNMDA ratio could be changed through slow synaptic plasticity or short-term synaptic plasticity induced by the attentional input.
Rate modulation can occur without gamma modulation, but gamma modulation never appears without rate modulation. However, the strength of gamma modulation can vary independently of rate modulation, which leads us to the main finding of this study, namely that the two proposed neural correlates of selective attention (increase in firing rate and increase in gamma-frequency synchronization) are not concomitant. Each seems to have a role of its own in the attentional process. Generally, our model network allows us to reproduce the main experimental finding from Fries et al. (2001).
We also show that, after stimulus presentation, rates rise quickest when the gamma modulations are strongest. This rise time can be interpreted as a reaction time of the system to a stimulus. The reaction times get shorter in the presence of gamma synchronization. The main reason is the fact that the probability to generate a postsynaptic spike is higher if the presynaptic spikes arrive synchronously and therefore in a more concentrated way in time (Salinas and Sejnowski, 2001). A more theoretical explanation for this behavior can be found in the work of Deco and Schürmann (1999). They study a dynamical neural system that has to discriminate different stimuli. They show that, if the discrimination is tuned to maximal reliability in minimal time, the network responds for different stimuli with different clusters of synchronized neurons. These synchronizations can be tuned to 40 Hz. In other words, if the information in spikes has to be maximal in minimal time, synchronization appears, which is consistent with the energy-based arguments of Abeles (1982). Synchronous firing generates spatiotemporal patterns in minimal time, because its energy is concentrated in time.
Furthermore, the difference in the RT between the attended and the unattended pool correlates with gamma modulation. Consequently, this suggests that the presence of gamma modulation is advantageous for the processing of the attended stimulus. Altogether, we show that rate and gamma modulation can vary independently, but to obtain an optimal information flow, gamma synchronization is necessary and the gAMPA/gNMDA ratio has to stay within a certain range. This sensibility has its origin in the nature of the network, and only experiments can show how sensitive the real brain is to this ratio. Gamma modulation therefore seems to have an essential behavioral relevance. This corresponds well with experimental findings. Pesaran et al. (2002) have shown that prestimulus fluctuations in visual gamma band synchronization predict the efficiency of detecting a subsequent change in a visual stimulus. Womelsdorf et al. (2006) analyze how RTs are related to gamma-band synchronization in visual areas. They show that the behavioral response time to a stimulus change can be predicted specifically by the degree of gamma-band synchronization among those neurons in monkeys' V4 visual area that are activated by the behaviorally relevant stimulus. In other words, trials leading to fast RTs contain more gamma-band power. They also show that this increase in gamma-band power is indeed an effect of selective attention and not just a general increase in arousal. Our findings about the RTs confirm this experimental result.
Extending our model to two layers, our results show that gamma-frequency synchronization is higher in the upper layer (V4) than in the lower layer (V1). We think that this is attributable to the fact that input to V1 is Poissonian, but input to V4 comes from V1. Because a one-layer network already shows oscillations in the gamma range, the input to V4 is not Poissonian anymore but oscillating in the gamma range. This facilitates the synchronization in V4. Moreover, we show that attentional modulations are stronger in V4 than in V1. Our findings are thus consistent with an increase of the gamma-frequency modulation along the visual pathway. Furthermore, if the gAMPA/gNMDA ratio is different in the different layers and is high enough in the upper layer, the neurons in the upper layer start to synchronize even when there is no or very little synchronization in the lower layer. Together, this might explain why in experimental work these modulations have been found in V4 (Fries et al., 2001) but not in V1 (Roelfsema et al., 2004).
Footnotes
This work was supported by the European Project “Brainsync,” by Spanish Research Project Grant BFU2007-61710, and by CONSOLIDER INGENIO 2010 (“Bilingualism and Cognitive Neuroscience”). We thank Albert Compte and Rita Almeida for helpful discussions as well as Marco Loh and Iva Ivanova for helpful comments on previous versions of this manuscript.
References
- Abeles, 1982.Abeles M. Role of the cortical neuron-integrator or coincidence detector. Israel J Med Sci. 1982;18:83–92. [PubMed] [Google Scholar]
- Brunel and Wang, 2001.Brunel N, Wang XJ. Effects of neuromodulation in a cortical network model of object working memory dominated by recurrent inhibition. J Comput Neurosci. 2001;11:63–85. doi: 10.1023/a:1011204814320. [DOI] [PubMed] [Google Scholar]
- Brunel and Wang, 2003.Brunel N, Wang XJ. What determines the frequency of fast network oscillations with irregular neural discharges? I. Synaptic dynamics and excitation-inhibition balance. J Neurophysiol. 2003;90:415–430. doi: 10.1152/jn.01095.2002. [DOI] [PubMed] [Google Scholar]
- Chelazzi, 1999.Chelazzi L. Serial attention mechanisms in visual search: a critical look at the evidence. Psychol Res. 1999;62:195–219. doi: 10.1007/s004260050051. [DOI] [PubMed] [Google Scholar]
- Chelazzi et al., 1993.Chelazzi L, Miller EK, Duncan J, Desimone R. A neural basis for visual-search in inferior temporal cortex. Nature. 1993;363:345–347. doi: 10.1038/363345a0. [DOI] [PubMed] [Google Scholar]
- Deco and Rolls, 2004.Deco G, Rolls ET. A neurodynamical cortical model of visual attention and invariant object recognition. Vision Res. 2004;44:621–642. doi: 10.1016/j.visres.2003.09.037. [DOI] [PubMed] [Google Scholar]
- Deco and Rolls, 2005.Deco G, Rolls ET. Neurodynamics of biased competition and cooperation for attention: a model with spiking neurons. J Neurophysiol. 2005;94:295–313. doi: 10.1152/jn.01095.2004. [DOI] [PubMed] [Google Scholar]
- Deco and Schürmann, 1999.Deco G, Schürmann B. Spatiotemporal coding in the cortex: information flow-based learning in spiking neural networks. Neural Comput. 1999;11:919–934. doi: 10.1162/089976699300016502. [DOI] [PubMed] [Google Scholar]
- Deco et al., 2002.Deco G, Pollatos O, Zihl J. The time course of selective visual attention: theory and experiments. Vision Res. 2002;42:2925–2945. doi: 10.1016/s0042-6989(02)00358-9. [DOI] [PubMed] [Google Scholar]
- Desimone and Duncan, 1995.Desimone R, Duncan J. Neural mechanisms of selective visual-attention. Annu Rev Neurosci. 1995;18:193–222. doi: 10.1146/annurev.ne.18.030195.001205. [DOI] [PubMed] [Google Scholar]
- Fries et al., 2001.Fries P, Reynolds JH, Rorie AE, Desimone R. Modulation of oscillatory neuronal synchronization by selective visual attention. Science. 2001;291:1560–1563. doi: 10.1126/science.1055465. [DOI] [PubMed] [Google Scholar]
- Gray and Singer, 1989.Gray CM, Singer W. Stimulus-specific neuronal oscillations in orientation columns of cat visual-cortex. Proc Natl Acad Sci U S A. 1989;86:1698–1702. doi: 10.1073/pnas.86.5.1698. [DOI] [PMC free article] [PubMed] [Google Scholar]
- Gruber et al., 1999.Gruber T, Müller MM, Keil A, Elbert T. Selective visual-spatial attention alters induced gamma band responses in the human EEG. Clin Neurophysiol. 1999;110:2074–2085. doi: 10.1016/s1388-2457(99)00176-5. [DOI] [PubMed] [Google Scholar]
- Logothetis, 2003.Logothetis NK. The underpinnings of the BOLD functional magnetic resonance imaging signal. J Neurosci. 2003;23:3963–3971. doi: 10.1523/JNEUROSCI.23-10-03963.2003. [DOI] [PMC free article] [PubMed] [Google Scholar]
- Mattia and Del Giudice, 2002.Mattia M, Del Giudice P. Population dynamics of interacting spiking neurons. Physical Rev E Stat Nonlin Soft Matter Phys. 2002;66 doi: 10.1103/PhysRevE.66.051917. 051917. [DOI] [PubMed] [Google Scholar]
- Mattia and Del Giudice, 2004.Mattia M, Del Giudice P. Finite-size dynamics of inhibitory and excitatory interacting spiking neurons. Physical Rev E Stat Nonlin Soft Matter Phys. 2004;70 doi: 10.1103/PhysRevE.70.052903. 052903. [DOI] [PubMed] [Google Scholar]
- Moran and Desimone, 1985.Moran J, Desimone R. Selective attention gates visual processing in the extrastriate cortex. Science. 1985;229:782–784. doi: 10.1126/science.4023713. [DOI] [PubMed] [Google Scholar]
- Pesaran et al., 2002.Pesaran B, Pezaris JS, Sahani M, Mitra PP, Andersen RA. Temporal structure in neuronal activity during working memory in macaque parietal cortex. Nat Neurosci. 2002;5:805–811. doi: 10.1038/nn890. [DOI] [PubMed] [Google Scholar]
- Roelfsema et al., 2004.Roelfsema PR, Lamme VA, Spekreijse H. Synchrony and covariation of firing rates in the primary visual cortex during contour grouping. Nat Neurosci. 2004;7:982–991. doi: 10.1038/nn1304. [DOI] [PubMed] [Google Scholar]
- Salinas and Sejnowski, 2001.Salinas E, Sejnowski TJ. Correlated neuronal activity and the flow of neural information. Nat Rev Neurosci. 2001;2:539–550. doi: 10.1038/35086012. [DOI] [PMC free article] [PubMed] [Google Scholar]
- Steinmetz et al., 2000.Steinmetz PN, Roy A, Fitzgerald PJ, Hsiao SS, Johnson KO, Niebur E. Attention modulates synchronized neuronal firing in primate somatosensory cortex. Nature. 2000;404:187–190. doi: 10.1038/35004588. [DOI] [PubMed] [Google Scholar]
- Szabo et al., 2004.Szabo M, Almeida R, Deco G, Stetter M. Cooperation and biased competition model can explain attentional filtering in the prefrontal cortex. Eur J Neurosci. 2004;19:1969–1977. doi: 10.1111/j.1460-9568.2004.03211.x. [DOI] [PubMed] [Google Scholar]
- Womelsdorf et al., 2006.Womelsdorf T, Fries P, Mitra PP, Desimone R. Gamma-band synchronization in visual cortex predicts speed of change detection. Nature. 2006;439:733–736. doi: 10.1038/nature04258. [DOI] [PubMed] [Google Scholar]


