Abstract
Auditory neurons are likely adapted to process complex stimuli, such as vocalizations, which contain spectrotemporal modulations. However, basic properties of auditory neurons are often derived from tone pips presented in isolation, which lack spectrotemporal modulations. In this context, it is unclear how to deduce the functional role of auditory neurons from their tone pip-derived tuning properties. In this study, spectrotemporal receptive fields (STRFs) were obtained from responses to multi-tone stimulus ensembles differing in their average spectrotemporal density (i.e., number of tone pips per second). STRFs for different stimulus densities were derived from multiple single-unit activity (MUA) and local field potentials (LFPs), simultaneously recorded in primary auditory cortex of cats. Consistent with earlier studies, we found that the spectral bandwidth was narrower for MUA compared with LFPs. Both neural firing rate and LFP amplitude were reduced when the density of the stimulus ensemble increased. Surprisingly, we found that increasing the spectrotemporal sound density revealed with increasing clarity an over-representation of response peaks at frequencies of ∼3, 5, 10, and 20 kHz, in both MUA- and LFP-derived STRFs. Although the decrease in spectral bandwidth and neural activity with increasing stimulus density can likely be accounted for by forward suppression, the mechanisms underlying the over-representation of the octave-spaced response peaks are unclear. Plausibly, the over-representation may be a functional correlate of the periodic pattern of corticocortical connections observed along the tonotopic axis of cat auditory cortex.
Keywords: auditory cortex, local field potential, receptive field, multi-unit activity, stimulus density, electrode array
Introduction
In auditory neuroscience, simple stimuli such as pure tones presented in isolation are commonly used to derive basic response properties of neurons such as characteristic frequency (CF), frequency selectivity, minimum latency, etc. Pure tones are usually presented with a fixed and relatively large interstimulus interval to avoid forward suppression (Wehr and Zador, 2005). However, pure tones presented with a large and constant interstimulus interval are not representative of natural sounds, such as vocalizations (Grace et al., 2003; Singh and Theunissen, 2003; Hsu et al., 2004), because they do not contain spectrotemporal modulations. Assuming that the auditory system is adapted to process natural sounds, it is questionable whether the functional role of auditory neurons can be deduced from their tone pip-derived properties. In this context, it seems necessary to use stimulus ensembles that allow assessment of the functional role of central neurons in complex sound environments.
Reverse correlation methods have provided a first step toward such an assessment (Aertsen and Johannesma, 1981; Eggermont et al., 1983; Klein et al., 2000; Escabí and Read, 2003). The characterization of neurons derived from reverse correlation is based on the spectrotemporal receptive field (STRF), which is the best linear estimate of the preferred stimulus of the neuron. The stimulus ensemble used to derive STRFs is typically composed of random broadband sounds that do not contain any autocorrelation structure in the time or frequency domains (Eggermont et al., 1983; Schreiner and Calhoun, 1994; Blake and Merzenich, 2002; Rutkowski et al., 2002). Stimulus ensembles composed of random overlapping tone pips (deCharms et al., 1998; Blake and Merzenich, 2002; Valentine and Eggermont, 2004) and dynamic ripple sounds have been used extensively because they simulate elementary features of complex sounds (Depireux et al., 2001; Miller et al., 2001, 2002; Qiu et al., 2003; Escabí and Read, 2005). Both multi-tone pip and ripple stimuli, although still artificial (i.e., not present in the natural environment), are presumably more natural than single nonoverlapping tone pips because they contain spectrotemporal modulations. Finally, STRFs have been derived from a set of conspecific vocalizations, which requires the use of a decorrelation procedure to remove the effects of spectrotemporal structure in the stimulus (Theunissen et al., 2000).
Recent studies, using single-tone pip stimuli, have suggested an octave-based organization in primary cortex (Brosch et al., 1999; Brosch and Schreiner, 2000; Kadia and Wang, 2003). The aim of the present study, in cortical field AI of cat, was to address whether the neural tuning properties obtained from complex stimuli could show an octave-based organization. STRFs were obtained from single- and multi-tone pip ensembles and derived from both multiple single-unit activity (MUA) and local field potentials (LFPs). MUA and LFPs, recorded simultaneously from the same electrodes, allowed us to investigate synaptic integration in AI neurons responding to complex acoustic environments. We found that multi-tone pip ensembles revealed an over-representation of response peaks at frequencies of ∼3, 5, 10, and 20 kHz, in both MUA- and LFP-derived STRFs. This over-representation was less evident for the single, nonoverlapping tone pip stimuli.
Materials and Methods
Animal preparation
At the time of the recordings, the average age of the cats (n = 30) was 232 d (range 150–319 d) and their average weight was 3309 g (range 1390–6000 g). We and others (Eggermont, 1996; Bonham et al., 2004) have shown that at 4 months of age, all aspects of cortical response properties including tonotopic maps are adult-like. All cats were deeply anesthetized by the intramuscular injection of 25 mg/kg (body weight) ketamine hydrochloride and 20 mg/kg (body weight) sodium pentobarbital. A mixture of 0.2 ml of acepromazine (0.25 mg ml−1) and 0.8 ml of atropine methyl nitrate (25 mg ml−1) was administered subcutaneously (∼0.25 ml/kg of body weight). The cat was secured with one screw cemented on the head without any other restraint, and there were no pressure points (such as ear bars). The wound margins were regularly infused with lidocaine, and additional acepromazine/atropine mixture was administered every 2–3 h. Throughout the experiment, typically every half hour, we tested that the anesthesia level was sufficient to ensure that pinna reflexes induced by touching the tragus were absent. We also carefully monitored the rate of breathing. The mean ketamine dose to maintain areflexive anesthesia in this set of cats was 8.6 ± 3.1 mg kg−1 h−1. At the end of the acute recording session, the cats were administered a lethal dose of sodium pentobarbital. The care and use of animals in this study were approved (#BI 2004-008) and reviewed on a yearly basis by the Life and Environmental Sciences Animal Care Committee of the University of Calgary. All cats were maintained and handled according to the guidelines set by the Canadian Council of Animal Care.
Acoustic stimulus presentation
Stimuli were generated in MATLAB and transferred to an RP2.1-based sound delivery system (Tucker-Davis Technologies). Acoustic stimuli for recording cortical activity were presented in an anechoic room from a speaker system (Fostex RM765 in combination with a Realistic Super-Tweeter) that produced a flat spectrum (±7 dB) between 2 and 40 kHz measured at the cat's head, but with a one-octave-wide dip of ∼15 dB around 1 kHz. The speaker system was placed ∼45° from the midline into the contralateral field, and ∼55 cm from the cat's left ear.
Tone pips used in auditory brainstem response (ABR) recordings and STRF estimation had gamma-envelopes given by: δ(t) = (t/4)2 exp(−t/4), where t is time in milliseconds. The duration of these pips over half-peak amplitude was ∼15 ms, whereas the total duration of the pip was 50 ms. Calibration and monitoring of tone pip stimuli was accomplished with a condenser microphone and amplifier (Brüel & Kjaer 4134 and 2636, respectively), placed just above the animal's head and facing the speaker. The harmonic distortion of the system was evaluated and found to be negligible: between 2 and 3 kHz; the amplitude of the first harmonic was on average 55 dB lower than the 65 dB SPL (sound pressure level) fundamental. The ear contralateral to the speaker (ipsilateral to the cortex recorded from) was filled with an ear mold substance (Dur-A-Sil; Insta-Mold Products).
The characteristic frequency and tuning properties of AI neurons were first determined using “single-tone stimuli” (STS), consisting of 27 or 38 gamma-tone frequencies, covering five (0.31–10, 0.62–20, 1.25–40 kHz) or seven (0.31–40 kHz) octaves, and presented at eight intensities (−5 to +65 dB SPL, in 10 dB steps). Each frequency–intensity combination was repeated 10 times at a rate of 4/s in pseudorandom order.
Two “multi-tone stimuli” (MTS) were next used to derive neuronal STRFs, as detailed by Eggermont (2006). Either 81 or 113 gamma-tone frequencies were used, again covering the same five or seven octaves as the STS, with a density of 16 frequencies per octave. The onsets of tone pips at each frequency was Poisson-distributed with a different realization for each frequency, ensuring no correlation between stimulus-onset times at different frequencies. Two different mean rates were used in the Poisson generator to compose moderate-density MTS (MTS_20, 4 pips/s/octave) and high-density MTS (MTS_120, 24 pips/s/octave). The overall presentation rate of each of the MTS then depends on the number of octaves used: 20/s (MTS_20) and 120/s (MTS_120) for MTS covering five octaves, and 28/s (MTS_20) and 166/s (MTS_120) for MTS covering seven octaves. The Poisson generator had a dead time of 50 ms (equal to the duration of the tone pips), to avoid the overlap of tone pips of identical frequency; however, tone pips of different frequencies could overlap. These stimulus ensembles lasted 900 s and were presented at an intensity level of 65 dB SPL. Their envelope spectra were low-pass in shape, with a cutoff frequency of ∼20 Hz and 30 Hz for MTS_20 and MTS_120, respectively (see supplemental Figs. S1 and S2, available at www.jneurosci.org as supplemental material).
To measure the acoustic characteristics of the free-range cat room (1.7 × 3.45 m in floor size and 3 m high, floor and walls tiled), two speakers (Realistic Minimus 3.5; RadioShack) were attached on each side and just above the door level at the narrow end of the room and received the same input signal. The MTS_120 sound stimulus was played and the A-weighted sound level in the cat room measured using a Quest Electronics model 1800 sound level meter at 12 equidistant points 10 cm above floor level, averaged 68 dB SPL with a range of ±4 dB. The sound spectrum measured in the center of the room varied by less than ±3 dB up to 20 kHz (the cutoff frequency of the test speaker). The background noise level was 42 dB SPL at 1 kHz sloping down at ∼18 dB/octave to reach a plateau of ∼18 dB SPL at 6 kHz. There were no visible peaks in the background spectrum.
Auditory threshold estimation
Hearing sensitivity was determined from ABR thresholds in an anechoic room. We used the component in the ABRs that was detectable at the lowest sound levels; this was nearly always wave 4, putatively representing synchronized input to the inferior colliculus. ABRs were recorded with needle electrodes in ipsilateral and contralateral muscles covering both mastoids. ABRs were evoked with tone pips at frequencies of 3, 4, 6, 8, 12, 16, 24, and 32 kHz, and presented at a rate of 10 Hz. The signals were amplified and bandpass-filtered between 300 and 3000 Hz using a DAM 500 (World Precision Instruments) differential amplifier and averaged with a Brüel & Kjaer (type 2034) dual signal analyzer in the signal enhancement mode. We used artifact rejection and local lidocaine infusion to avoid contamination of the ABR by muscle action potentials. At high stimulus levels, an average of 20–50 recordings sufficed to obtain clear responses, but at near-threshold levels, an average of 200–300 recordings was obtained twice. We decreased the SPL in step sizes of 10 dB until the responses were nonreproducible. Threshold was defined as the highest SPL that yielded a nonreproducible response, plus 5 dB. Hearing threshold was assessed by comparing the ABR thresholds obtained in cats in the present study with a set of reference ABR thresholds from 13 normal-hearing cats that were not part of this study.
Recording and spike separation procedure
In 14 cats, we used two arrays of eight tungsten microelectrodes (FHC), each with impedances between 1 and 2 MΩ. These electrodes were arranged in a 4 × 2 configuration; interelectrode distance within rows and columns was 0.5 mm. In 16 cats, we used two arrays of 16 tungsten microelectrodes (MicroProbe), each also with impedance between 1 and 2 MΩ. These electrodes were arranged in an 8 × 2 configuration; interelectrode distance within rows was 0.25 mm and 0.5 mm between rows.
Each electrode array was oriented such that all electrodes were touching the cortical surface, and then the arrays were manually and independently advanced using a Narishige M101 hydraulic microdrive. The signals were amplified 10,000 times with filter cutoff frequencies set at 2 Hz and 7.5 kHz. The amplified signals were processed by an RX5 multichannel data acquisition system (Tucker-Davis Technologies). Spikes were extracted from a 0.3–3 kHz bandpass-filtered signal and LFPs from a 2–40 Hz bandpass filtered signal. In this way, we were able to extract spike and LFP data simultaneously. Spike sorting was done off-line using an automated procedure based on principal component analysis filtering, and K-means clustering was implemented in MATLAB (MathWorks). The spike times and waveforms were stored. For statistical purposes, the separated single-unit spike trains were added again to form a multi-unit spike train, thereby eliminating potential contributions from thalamocortical afferents or fast spikes from interneurons.
The distinction between cortical fields AI and anterior auditory field (AAF) was based on the reversal of the tonotopic frequency gradient and the frequency-tuning curve bandwidth at 20 dB above threshold, units in AAF being more broadly tuned. The demarcation of AI and the posterior fields was based on response latency, clearness of frequency tuning, and nonmonotonicity. Thus, long-latency, narrow-frequency tuning, and strongly nonmonotonic rate intensity functions were used to assign neurons to posterior auditory field.
Data analysis
The methodology for computing STRFs was developed by Valentine and Eggermont (2004). Briefly, STRFs for MUA were determined by constructing poststimulus time histograms (PSTHs), with time bins of 1 ms for each frequency. In other words, spikes falling in the averaging time window (starting at the stimulus onset and lasting 100 ms) are counted. Because the average interstimulus interval in the stimulus ensemble is smaller than the averaging time window (100 ms), a spike can be counted in the PSTH of several pip frequencies. The mean firing rate, obtained by dividing the number of spikes per second by the number of stimuli per second, is the dependent variable displayed in the STRFs. STRFs for LFPs were obtained by a similar procedure, except that the LFP waveforms (0–100 ms after stimulus onset) were averaged for each appropriate tone pip frequency. All STRFs were smoothed with a uniform 5 × 5 bin window.
For both STS and MTS stimulation, units were classified as being tuned to a single frequency or to multiple frequencies by a fully automated “peak detection” algorithm. In essence, the algorithm consisted of two steps: determining the subset of frequencies to which the MUA or LFP response was statistically significant, and identifying the distinct peaks, or response local maxima, in this significant subset. In more detail, the algorithm operated as follows.
Step 1.
The time window in which the baseline-corrected time marginal (i.e., a STRF collapsed to just the time domain by averaging across frequency) was at least 25% of the peak response was determined. The baseline firing rate was derived from the mean activity 0–10 ms after stimulus onset, averaged across frequency.
Step 2.
The frequency marginal (i.e., a STRF collapsed to the frequency domain by averaging across time) was obtained, by averaging over the time window obtained in step 1.
Step 3.
Each bin of the frequency marginal obtained in step 2 was checked for significance above the baseline rate. The criterion chosen for a significant response was 4 SD above the baseline mean (SD is derived from the baseline firing rate, i.e., neural activity 0–10 ms after stimulus onset).
Step 4.
Each distinct group of frequencies identified in step 3 constitutes at least one distinct response peak. To determine whether a group of significant frequencies contained more than one distinct peak, all local maxima and minima on the baseline-corrected frequency marginal were identified. If, in addition to the “global” maximum of a significant, distinct group of frequencies, a local maximum was surrounded by two local minima, both <80% of the local maximum, the local maximum was classified as a separate, additional peak.
Step 5.
All peaks identified in step 4 were required to be separated by at least one-fifth octave. If a given pair of peaks was not, the smaller peak of the pair was not counted.
The results of the algorithm were visually checked on a substantial subset of our database, and the algorithm and the eye overwhelmingly agree on what constitutes a distinct frequency peak on an STRF (see Figs. 2–5).
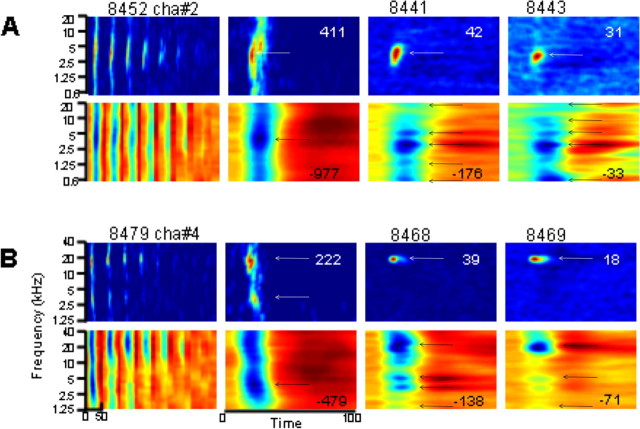
Figure 2.
Examples of STRF obtained from LFPs (second and fourth rows) and MUA (first and third rows) from two electrodes (recordings were not simultaneous). The tuning curves are shown in the first column; responses over a 50 ms window (from stimulus onset) obtained with intensity levels between −5 (right) and 65 dB SPL (left) are stacked. The second column shows the STRF derived from the STS condition at the same level used for deriving STRF from MTS, namely at 65 dB SPL. The third and fourth columns show the STRFs derived from MTS_20 and MTS_120, respectively. Numbers within each panel (columns 2–4) indicate the maximum firing rate (for MUA, first and third rows) and the negative peak amplitude (for LFPs, second and fourth rows). For MUA (first and third rows), the color scale indicates the firing rate, from dark blue (minimal responses, corresponding to spontaneous firing rate) to dark red (maximal responses). For LFPs (second and fourth rows), the color indicates the amplitude of the potentials, from dark blue (negative potentials, which correspond to excitatory synaptic potentials; see Results, Individual examples) to dark red (positive potentials). Black arrows indicate peak frequencies detected by the algorithm (see Materials and Methods).
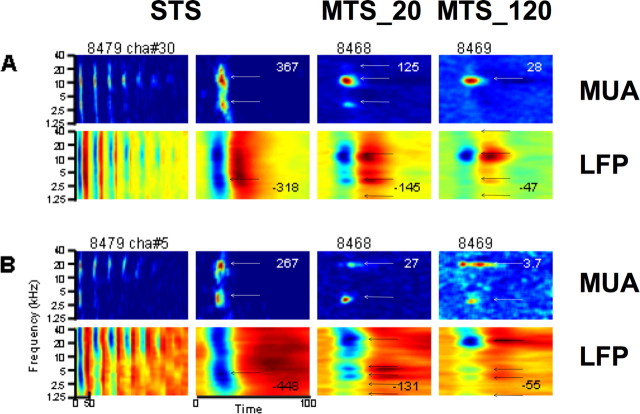
Figure 3.
Examples of STRF obtained simultaneously from LFPs (second and fourth rows) and MUA (first and third rows) from two electrodes. Same labeling convention as in Figure 2.
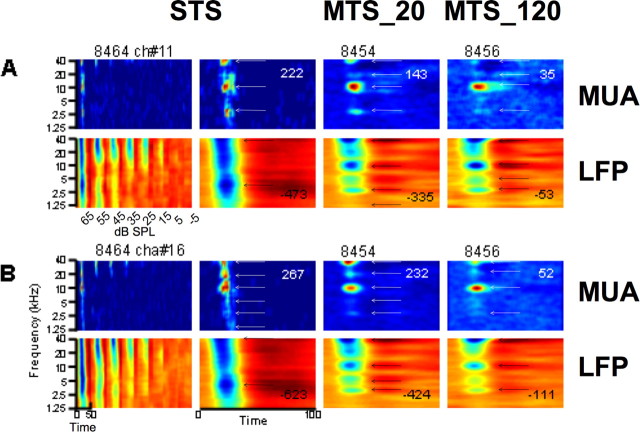
Figure 4.
Examples of STRF obtained simultaneously from LFPs (second and fourth rows) and MUA (first and third rows) from two electrodes. Same labeling convention as in Figure 2.
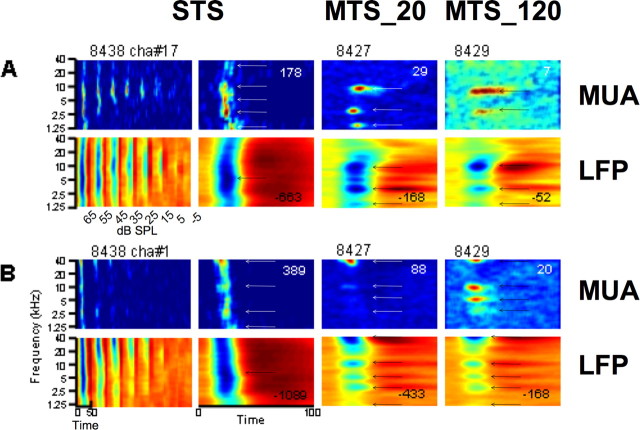
Figure 5.
Examples of STRF obtained simultaneously from LFPs (second and fourth rows) and MUA (first and third rows) from two electrodes. Same labeling convention as in Figure 2.
To assess whether the percentage of peaks found at any given frequency was statistically higher than a hypothesized value, we used the proportion test. A Z score (z) was calculated, in which z = (pobs − Pho)/σ, where pobs is the observed probability for having a peak at any given frequency, Pho is the hypothesized probability for having a peak at this frequency, and σ is the SD of the sampling distribution (σ = [Pho (1 − Pho)/n]0.5, where n is the sample size). We chose Pho to be equal to the expected probability of having a peak at any given frequency in case of a uniform distribution. Because the frequency range was divided into 29 frequency bins (with center frequency ranging between 0.3 and 37 kHz on a log scale), Pho = 1/29 = 0.0345. The P value for any value of z (obtained from pobs) was then obtained from the normal cumulative distribution function. A peak frequency was considered as being statistically “over-represented” when p < 0.0017 (we used a Bonferroni correction; P value of 0.05 was divided by the total number of comparisons, i.e., 29).
In addition to constructing histograms of the distributions of peak frequencies for both single- and multi-tuned populations across our sample of MUA- and LFP-derived STRFs, we also computed averaged normalized (on maximum firing rate), baseline-corrected STRFs and frequency marginals. For comparing whether “valleys” (local minima) were statistically different from “peaks” (local maxima) on the averaged frequency marginals, the bootstrap method was used for calculating a confidence interval for the means. For each group (single-peaked and multi-peaked neurons), each stimulus condition (STS, MTS_20, and MTS_120) and each recorded signal (MUA and LFPs), the data were independently resampled for each frequency. That is, if the size of a given sample (a given frequency for a given group, stimulus condition, and recorded signal) was 250, we resampled 2000 times the sample by choosing randomly 250 data in the initial sample. The desired (1 − α) * 100% bootstrap confidence interval was then calculated, in which the two boundaries were q1 = Nα/2 and q2 = N − q1 + 1. For α = 0.05 and N = 2000, q1 = 50 and q2 = 1951. A local minimum was then considered as statistically different from a local maximum when the confidence intervals did not overlap.
Results
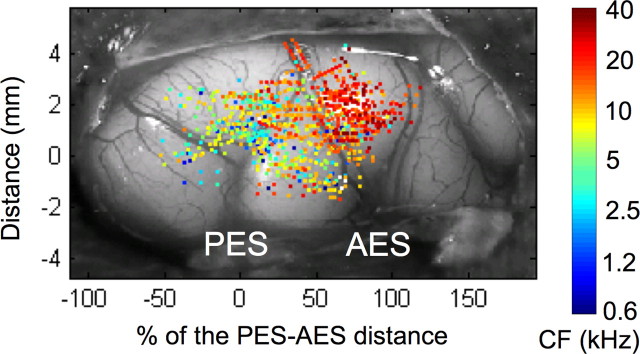
The data collection and most of the analyses were done in the laboratory of the senior author (J.J.E.). We examined the frequency tuning of neurons in cat AI. MUA was obtained from 978 penetrations in 30 adult cats. LFPs were recorded simultaneously with MUA on the same electrodes (see Materials and Methods), from 1150 penetrations in 24 adult cats. The number of recordings is larger for LFPs compared with MUA because, for some penetrations, clear STRFs were obtained from LFPs but not from spikes. The spatial distribution of all recording penetrations (Fig. 1) indicates that AI was fully and homogeneously sampled.
Figure 1.
Spatial distribution of cortical recording sites in the 30 normal-hearing cats superimposed on a typical view of auditory cortex. For each cat, the distance between the tips of the anterior ectosylvian sulcus (AES) and the posterior ectosylvian sulcus (PES) was normalized to 100%. The y-axis represents the distance (in millimeters) in the ventro-dorsal direction from the tip of the PES. The colors of dots indicate the characteristic frequency of neurons.
Individual examples
MUA and LFPs were obtained from STS and from two ensembles of MTS, which differed in spectrotemporal density (see Materials and Methods). Neural responses obtained from STS are shown in “STRF form” (time–frequency representation) to facilitate comparisons with STRFs obtained from MTS (Figs. 2–5). However, it is important to keep in mind that STRFs derived from STS are a static representation of neural tuning and do not reflect dynamic spectrotemporal processing of neurons.
In Figure 2, two sets (A and B) of MUA tuning curves derived from STS (first column of each top row) are shown as stacked responses over a 50 ms window between −5 and 65 dB SPL. “STRFs” derived from STS at 65 dB SPL (second column) are relatively broad in frequency (nearly the full 5 octaves), whereas STRFs derived from MTS_20 (third column) and MTS_120 (fourth column) are much narrower (<1 octave). This decrease in response spectral bandwidth with increase in spectrotemporal stimulus density is in broad agreement with earlier studies that used similar stimulus ensembles (Blake and Merzenich, 2002; Valentine and Eggermont, 2004). One notes that the example shown in B is multi-peaked in the STS condition and single-peaked in the MTS condition. STRFs obtained from LFPs (bottom rows of A and B) have a large spectral bandwidth at all stimulus densities, and several distinct peaks or best frequencies (BFs) in the MTS condition (at ∼1.5, 3, 5, and 20 kHz; columns 3 and 4); these peaks are not present in the STRFs derived from MUA or in STRFs derived from LFPs in the STS condition. Note that the peak response values (indicated in each panel) decrease strongly with increasing stimulus density (from 411 spikes/stimulus/s for STS to 31 spikes/stimulus/s for the MTS with 120 stimuli/s). The same happens for the negative peak amplitude of the LFP.
Figure 3 shows examples of MUA-derived STRFs with two BFs in the STS and MTS_20 conditions at 65 dB SPL. Responses in A and B were obtained from simultaneous recordings but from electrodes in different arrays. The STRFs derived from MUA for STS and MTS (columns 2–4) show BFs that are separated by ∼2 and 3 octaves (A and B, respectively). In A, the STRFs derived from LFPs and MUA for the two MTS conditions (columns 3 and 4) are roughly similar (at least for the “main” peaks at 3 and 10 kHz). In panel B, the STRFs derived from LFPs present additional peaks at ∼1.25, 2, and 5 kHz compared with STRFs derived from MUA. One notes that the peak of negative amplitude on an LFP-derived STRF does not necessarily correspond to the peak firing rate on a MUA-derived STRF: in B, for the MTS_20 condition (column 3), the BF for MUA is ∼3 kHz, whereas the BF for LFPs is ∼20 kHz. Also in this example, the peak response values decrease with increasing stimulus density.
In Figure 4, A and B, responses were obtained from simultaneous recordings from two electrodes in the same array. In A, the BFs found in the two MTS conditions are also present in the STS condition. However, in B, the peaks are much clearer (i.e., well separated by frequencies that evoke little activity) for MTS_20 (column 3) compared with STS (column 2). In A and B, the main BFs are separated by two octaves and one octave, respectively. It can be observed that whereas the electrodes for the recordings shown in A and B were distant from each other by 1250 μm, the STRFs derived from LFPs (bottom rows) are very similar. Interestingly, they present multiple peaks at ∼1.5, 3, 10, and 40 kHz; that is, separated from each other by about one or two octaves. In these examples, the peak that is still clearly “visible” at 20 kHz (Fig. 4A,B, MTS_20 condition) is not detected as a peak by the algorithm (black arrows). This is accounted for by the fact that this peak is not considered different from the peak at ∼40 kHz, because no local minimum <80% was found between the two peaks (see Materials and Methods). Note, again, the decrease in peak response with increasing stimulus density.
Figure 5, A and B (top rows), shows examples of STRFs derived from MUA that suggest strong nonlinearities with stimulus density. Responses in A and B were obtained from simultaneous recordings but from electrodes in different arrays. In A, the MUA-STRF derived from STS at 65 dB SPL (column 2) is relatively broad and does not present well separated peaks. The STRF obtained in the MTS_20 condition (column 3) shows three clear BFs, with a maximum at ∼10 kHz (where responses were relatively weak in the STS condition). In B, the MUA-STRF derived from STS at 65 dB SPL (column 2) is broad but shows a clear BF at ∼40 kHz and three additional peaks (less clearly) at ∼1.5, 3, and 10 kHz. The STRFs derived from MTS conditions (columns 3 and 4) show a main peak at ∼40 kHz and 3 “minor” peaks at 3, 5, and 10 kHz. STRFs derived from MUA were somewhat different from those derived from LFPs. In A, for the MTS_120 condition (column 4), the STRF derived from LFPs presents peaks at 1.5, 3, and 10 kHz, whereas the STRF derived from MUA presents peaks at 3 and 10 kHz. In B, for the two MTS conditions (columns 3 and 4), the peaks in STRFs derived from MUA are also found in STRFs derived from LFPs. One notes that STRFs derived from LFPs in the MTS conditions shown in B are very similar to those shown in Figure 4, obtained from a different animal. On the other hand, STRFs derived from LFPs in A and B (Fig. 5) are very different from each other, even though the recordings were simultaneous. This result is important because it tends to rule out the hypothesis that the multi-peaked STRFs, with peaks mainly at 3, 5, 10, 20, and 40 kHz, are caused by the characteristics of the stimulus spectrum (see Materials and Methods and Discussion).
The examples shown in Figures 2–5 corroborate previous studies (Blake and Merzenich, 2002; Valentine and Eggermont, 2004) reporting that STRFs can be reliably obtained from a stimulus ensemble composed of random tone pips. In addition, the present study suggests that STRFs can also be reliably derived from LFPs. Because LFPs reflect compound postsynaptic potentials from well synchronized inputs, they can be used to investigate the effect of cortical synaptic integration as a function of stimulus density. The examples given in Figures 2–5 illustrate that increasing the density of the stimulus ensemble dramatically changes MUA and LFP responses. STRFs become more selective in frequency and show more complex responses (especially for LFPs, with the presence of many peaks separated by one or two octaves) with increased stimulus density. This is not the result of a second-order correlation structure of the multi-tone stimuli that would favor octave-separated response peaks. The autocorrelation structure of the multi-tone stimuli, conditional on a response–peak frequency, was flat (see Figs. S3–S6, available at www.jneurosci.org as supplemental material). In addition, STRFs derived from MUA can be considerably different from those derived from LFPs.
Group data
Single- and multi-peaked neurons
CFs of cortical neurons were obtained from all recordings. Consistent with our earlier study (Noreña and Eggermont, 2002), CFs for MUA and LFPs are fairly well correlated (r2 = 0.52) (Fig. 6A). For LFPs, the distribution of CFs shows two small peaks near 3 and 5 kHz (however, nonsignificantly over-represented; see Materials and Methods), and a broad peak (significantly over-represented) ∼15 kHz. For MUA, the distribution of CFs presents the largest peak near 15 kHz and additional peaks at 3, 5, and 10 kHz (however, only peaks at 5, 10, and 15 kHz are significantly over-represented). The distribution of CFs for both LFPs and MUA is consistent with the cat's hearing (lowest behavioral thresholds at ∼2–3 and 10–15 kHz; Elliott et al., 1960), and also corroborates our earlier study (Noreña et al., 2006). The distribution of threshold at CF as a function of CF for LFPs and MUA (Fig. 6B) is also consistent with the cat's hearing. Maximum firing rates, peak LFP amplitude, and bandwidth of the excitatory part of the STRFs are all strongly dependent on the stimulus density (Table 1).
Figure 6.
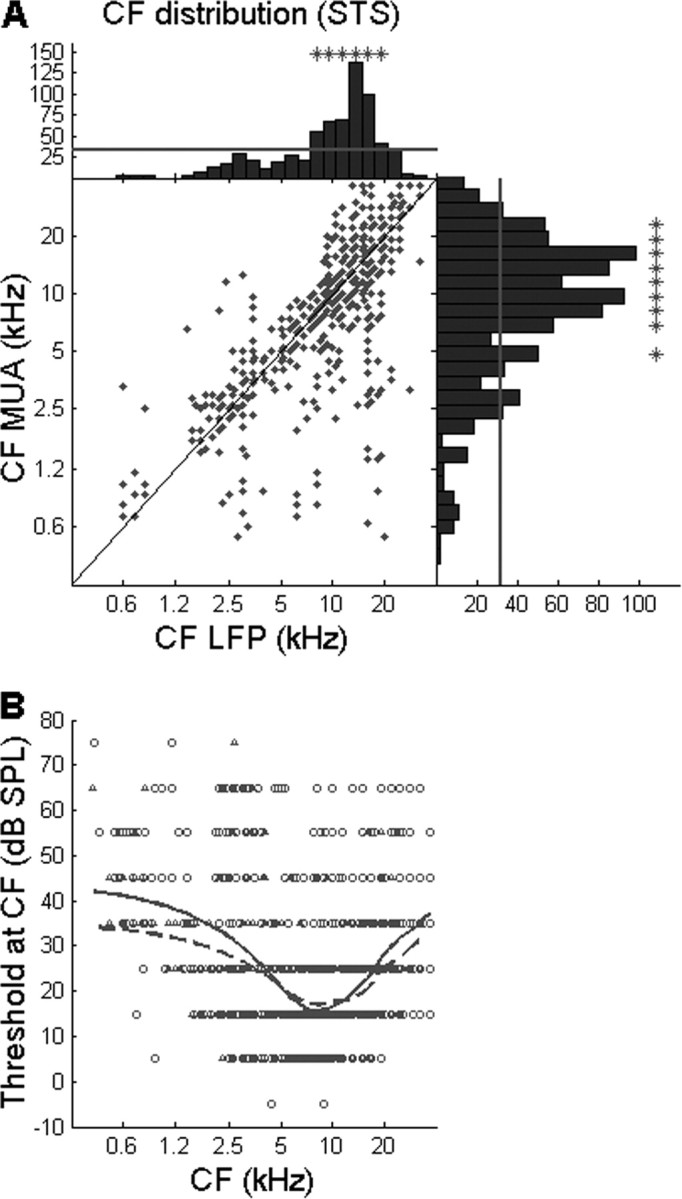
A, CF derived from MUA in STS condition as a function of CF derived from LFPs in the STS condition. Histograms showing the distribution of CF for MUA and LFPs are shown at the right and top of the panel, respectively. The diagonal represents exact correspondence between the CFs. An asterisk above histogram bars indicates a significant over-representation of the corresponding characteristic frequency (vs a uniform distribution, p < 0.0017; see Materials and Methods). B, Threshold at CF as a function of CF derived from MUA (circles) and LFPs (triangles). The continuous (MUA) and dashed (LFPs) lines represent the locally weighted regression lines.
Table 1.
Properties of STRFs for different stimulus densities
| n | Maximum instantaneous firing rate (spikes/s/stim) or maximum instantaneous LFP amplitude (μV/stim) | Bandwidth (octave) | ||
|---|---|---|---|---|
| MUA | ||||
| Single-tuned | STS | 374 (42%) | 206 ± 121 | 3.0 ± 1.8 |
| MTS_20 | 383 (39%) | 35 ± 52 | 0.9 ± 0.8 | |
| MTS_120 | 434 (59%) | 20 ± 26 | 0.5 ± 0.4 | |
| Multi-tuned | STS | 521 (58%) | 240 ± 149 | 3.5 ± 1.4 |
| MTS_20 | 608 (61%) | 71 ± 69 | 2.1 ± 0.9 | |
| MTS_120 | 301 (41%) | 33 ± 30 | 1.4 ± 0.7 | |
| LFP | ||||
| Single-tuned | STS | 767 (72%) | 356 ± 213 | 3.9 ± 1.5 |
| MTS_20 | 252 (19%) | 145 ± 109 | 2.9 ± 2.0 | |
| MTS_120 | 248 (20%) | 77 ± 85 | 1.0 ± 0.6 | |
| Multi-tuned | STS | 292 (28%) | 451 ± 238 | 4.3 ± 1.8 |
| MTS_20 | 1072 (81%) | 169 ± 102 | 4.1 ± 1.1 | |
| MTS_120 | 977 (80%) | 54 ± 36 | 2.4 ± 1.0 |
The first data column gives the number and fraction of single- versus multi-tuned units and LFPs for each stimulus condition. The second column gives the maximum instantaneous spike firing rate (in spikes per second per stimulus) or maximum instantaneous LFP amplitude (in microvolts per stimulus). The third column gives the bandwidth (in octaves), defined as the count of frequencies evoking significant responses (at least 4 SD above baseline activity) multiplied by the octave-spacing between neighboring frequencies. Note that both activity and bandwidth decrease with increasing stimulus density for both single- and multi-tuned MUA and LFPs. These differences are all statistically significant at least at p < 0.05 (post-hoc, pairwise Tukey-test comparisons under ANOVA), except for the pair STS and MTS_20 for multi-tuned LFPs. Note also that both activity and bandwidth increase from single- to multi-peaked MUA or LFPs under all stimulus conditions (always significantly), the single exception being multi-tuned LFP amplitudes under MTS_120, which are smaller in the multi-tuned population.
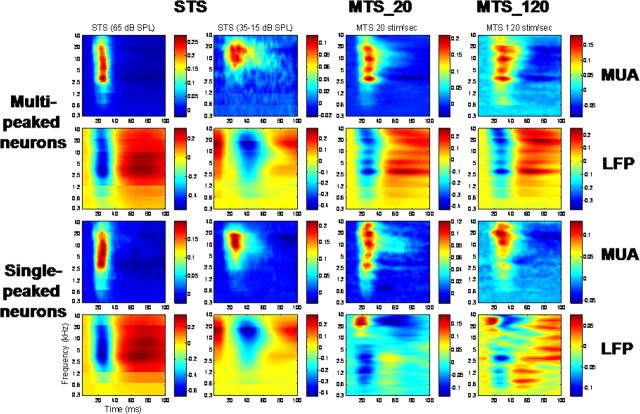
Using an automated algorithm for detecting spectral response peaks (see Materials and Methods), both MUA- and LFP-derived STRFs were classified as either single- or multi-peaked. Individual-case STRFs obtained under STS and MTS conditions were baseline-corrected, normalized on maximum excitation, and averaged across single- and multi-peaked populations (Fig. 7). The upper two rows show results for multi-peaked neurons (top row, multi-unit; second row, LFPs), whereas the bottom two rows reflect the average for all single-tuned neurons (third row, multi-unit; bottom row, LFPs). The first two columns show results for STS at levels of 65 dB SPL and an average of 15–35 dB SPL, respectively. The third column shows results for the MTS_20 and the fourth column, results for the MTS_120. For both single- and multi-peaked neurons in the STS condition, a dominant peak in average activity is visible at ∼3 kHz on both MUA- and LFP-derived STRFs at 65 dB SPL (column 1). However, this is not so at lower SPLs (column 2), where the peak lies between 10 and 20 kHz. Most striking is that multi-peaked and, to a lesser extent, single-peaked neurons in both MTS conditions at 65 dB SPL (columns 3–4) show pronounced octave-spaced peaks in both MUA and LFPs at ∼3, 5, 10, and 20 kHz. Moreover, for both multi- and single-peaked LFPs, and for multi-peaked (but not single-peaked) MUA, the dominant peak is again at 3 kHz, just as under STS conditions.
Figure 7.
Averaged normalized STRFs (each STRF is normalized on its own maximum) in multi-peaked neurons (first and second rows) and single-peaked neurons (third and fourth rows) derived from MUA (first and third rows) and LFPs (second and fourth rows), obtained from single-tone stimulation (first column, 65 dB SPL; second column, 35–15 dB SPL), moderate-density multi-tone stimulation (20 stimuli/s; third column, 65 dB SPL), and high-density multi-tone stimulation (120 stimuli/s; fourth row, 65 dB SPL).
The averaged STRFs for single-peaked LFPs under MTS conditions show an inversion of LFP polarity for frequencies above ∼10 kHz. The explanation for this inversion may be as follows. LFPs are thought to reflect the sum of synaptic potentials in a local group of neurons (Mitzdorf, 1985; Kaur et al., 2004). The polarity of LFPs is dependent on the position of the recording electrode relative to the synaptic potentials (LFPs are negative if the electrode is close to the current sinks). R. Lazar and R. Metherate [unpublished observations, reported by Kaur et al. (2004)] observed that the current sinks evoked by a stimulus at CF lie at a different location than those evoked by a stimulus at frequencies remote from CF. The polarity changes in LFPs that we observed at higher frequencies might then be accounted for by frequency-dependent positions of current sinks relative to the recording electrode.
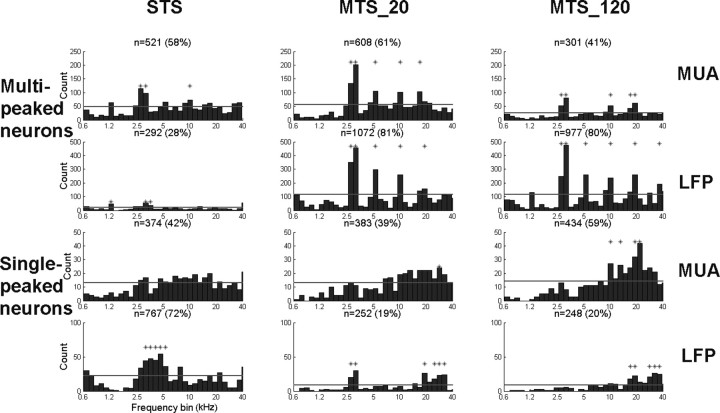
Consistent with our findings based on averaged neural activity (Fig. 7), the distribution of best frequency peaks, obtained using our automated algorithm (see Materials and Methods), shows the over-representation of frequencies mainly at ∼3, 5, 10, and 20 kHz (and also at some lower frequencies) (Fig. 8). The top two rows show results for multi-peaked neurons (top row, multi-unit; second row, LFPs), whereas the bottom two rows reflect the average for all single-tuned neurons (third row, multi-unit; bottom row, LFPs). The first columns show results for STS at 65 dB SPL. The second column shows results for the MTS_20, and the third column, those for the MTS_120. The number and percentage of recordings are indicated above each panel. Again, this over-representation is most obvious for multi-peaked neurons under MTS conditions (both MUA and LFPs), and is less obvious but visible (and significant) for multi-peaked neurons under the STS condition. The effect of sound density is particularly striking for LFPs: although only 28% of recordings present multi-tuned properties in the single-tone condition, they are 80% in multi-tone conditions. In contrast, clear octave-spaced peaks are not seen for single-tuned neurons under any stimulus condition.
Figure 8.
Histograms showing the distribution of BFs in multi-peaked (first and second rows) and single-peaked (third and fourth rows) neurons, for MUA (first and third rows) and LFPs (second and fourth row) for single-tone stimulation (first column), moderate-density multi-tone stimulation (second column), and high-density multi-tone stimulation (third column). An asterisk above histogram bars indicates a significant over-representation of the corresponding peak frequency (vs a uniform distribution, p < 0.0017; see Materials and Methods). The number and percentage of neurons are indicated above each panel.
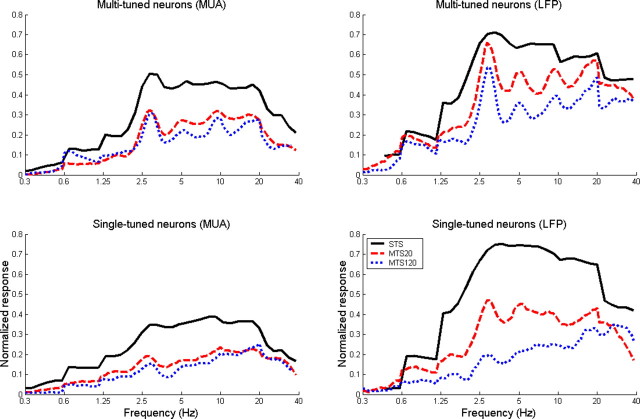
Average normalized, baseline-corrected frequency marginals of single and multi-peaked neurons (MUA and LFPs) for all stimulus conditions (STS and MTS) are shown in Figure 9. Peaks in the frequency marginals were statistically compared with adjacent valleys with the bootstrap method (see Materials and Methods). Frequencies for peaks and valleys were chosen to be the same in all groups and conditions; they were chosen to correspond to frequencies of the local maxima and minima in multi-peaked, LFP-derived marginals under the MTS_120 condition. Specifically, the local minima were located at 3856, 6484, and 12,968 Hz, and the local maxima at 2973, 5221, 10,000 and 20,000 Hz. In both single- and multi-peaked neurons (MUA and LFPs), the peak at ∼3 kHz is significantly enhanced compared with the adjacent valley at 3856 Hz under all stimulus conditions except STS with single-peaked neurons. On the other hand, the other peak frequencies (5, 20, and 20 kHz) are statistically different from adjacent valleys only in multi-peaked neurons and the MTS conditions. This octave-spacing of response peaks is more pronounced for LFPs than for MUA.
Figure 9.
Average of the normalized frequency marginals for multi-peaked (first row) and single-peaked (second row) neurons obtained from MUA (first column) and LFPs (second column), for STS (black line), moderate-density multi-tone stimulation (red line), and high-density multi-tone stimulation. Broken bars (with thick, continuous, and dotted lines, for STS, MTS_20, and MTS_120, respectively) indicate statistically significant differences between peaks and adjacent valleys (see Materials and Methods).
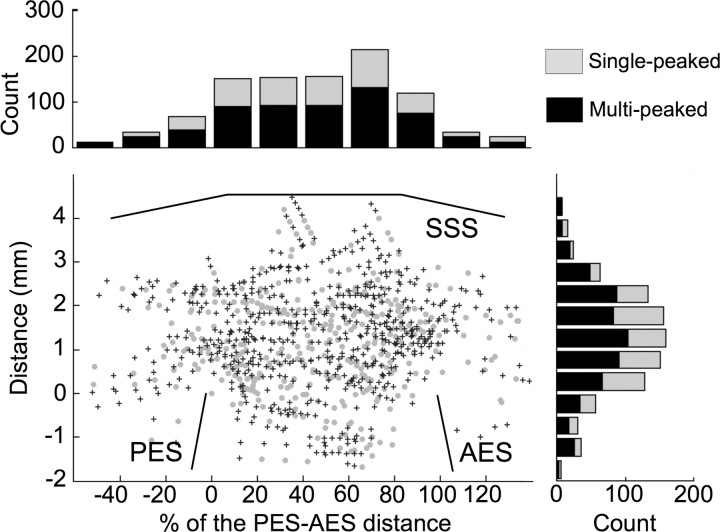
Finally, Sutter and Schreiner (1991) reported that multi-peaked neurons were mostly localized in the dorsal part of AI. To address whether the multi-peaked neurons obtained in the present study are found in a specific part of AI, the locations of single- and multi-peaked neurons are shown in Figure 10. This figure suggests that there is no spatial segregation between single- and multi-peaked neurons, as defined in our study (see Materials and Methods).
Figure 10.
Spatial locations of single- and multi-peaked neurons with corresponding distributions per 20% of PES-AES distance (horizontal) and per 0.5 mm distance (vertical). Crosses and circles indicate the location of single- and multi-peaked neurons, respectively. SSS, Superior sylvian sulcus; PES, posterior ectosylvian sulcus; AES, anterior ectosylvian sulcus.
Discussion
The present study addressed the effects of sound density on STRFs derived from LFPs and MUA in AI of cats. Our results corroborate earlier reports showing that the increase in the stimulus density strongly reduces neural responses at all frequencies and the spectral bandwidth (Figs. 2–5) (Blake and Merzenich, 2002; Valentine and Eggermont, 2004). In addition, this study shows that the decrease in neural responses related to the density of the stimulus is systematically larger at some frequencies relative to others. As a result, in a spectrotemporally dense acoustic environment, neurons are often multi-peaked at over-represented BFs (most prominently at ∼3, 5, 10, and 20 kHz), separated from each other by ∼1 octave. This result has never been reported in the literature.
The phenomenon of forward suppression can account for the overall decrease in neural responses related to the increase in the density of the stimulus (Blake and Merzenich, 2002; Valentine and Eggermont, 2004). Increasing stimulus density shortens the interstimulus interval, with the consequence that neural responses induced by a given stimulus may influence the responses induced by the next stimulus. In this context, studies of spectrotemporal integration with a two-tone interaction paradigm have shown that a modulating tone with a frequency from inside the tuning curve usually attenuated the response related to the probe tone (Calford and Semple, 1995; Brosch et al., 1999; Brosch and Schreiner, 2000). This suppressive effect, which can be accounted for by postsynaptic inhibition and synaptic depression (Galarreta and Hestrin, 1998; Varela et al., 1999; Wehr and Zador, 2005), could last hundreds of milliseconds, well beyond the average interstimulus interval for the multi-tone stimuli (50 ms and 8 ms for MTS_20 and MTS_120, respectively). The preferential reduction of responses at certain frequencies (i.e., our “valleys”) when the sound density is increased could be explained by a smaller excitation-to-inhibition ratio at these frequencies.
Potentially, the relatively smaller decrease of neural activity at some frequencies (i.e., our octave-spaced peaks) could potentially be accounted for by the characteristics of the sound spectrum, i.e., larger sound levels or harmonics at these frequencies. However, the transfer function of the sound delivery system (see Materials and Methods) was roughly flat and no specific peak level could be found at the over-represented frequencies. It is also clear that harmonic distortion cannot account for our results. In addition, the STRF-peak frequency-conditional autocorrelation functions of the MTS were completely flat. Furthermore, LFPs, which are likely sensitive enough to reveal peaks and dips in the transfer function of the stimulus delivery system, do not show any significant peaks or dips in activity (except the one at ∼3 kHz) in the single-tone stimulus condition (Figs. 7–9).
Interestingly, previous studies using a two-tone interaction paradigm have reported an octave-based functional organization in auditory cortex of macaque (Brosch et al., 1999), cats (Brosch and Schreiner, 2000) and marmosets (Kadia and Wang, 2003). Indeed, the modulation (suppression or enhancement) induced by the modulating tone is maximal when its frequency is one octave below or above the probe tone frequency. Moreover, it has been shown that CFs in multi-peaked neurons were separated by one octave on average (Kadia and Wang, 2003). Finally, an increase in the average spontaneous firing synchrony has been reported in the primary auditory cortex of cats when the CFs of these neurons were separated by ∼1 octave (Eggermont, 1993). Although these studies suggested that primary auditory cortex exhibits an octave-based functional organization, the over-representation of octave-spaced response peaks has never been reported in the literature. These differences between the findings in this study and others could be accounted for by the fact that they did not focus on the distribution of BFs and, as such, did not reveal any over-representation of some frequencies as our present study does. This may also be related to the use of different animals (marmoset and macaque), and to stimulating in free field (allowing ear canal resonance; see below) versus closed field (Brosch and Schreiner, 1997, 2000; Brosch et al., 1999). More importantly, a critical difference between this study and others may be stimulus-based. Indeed, whereas the distribution of the MUA-derived peaks shows a somewhat increased representation of frequencies at ∼3, 5, 10, and near 20 kHz in the STS condition (multi-tuned neurons), only the peaks at 3 and 10 kHz are statistically significant. On the other hand, in the MTS condition (and multi-tuned neurons), the increased representation at 3, 5, 10, and 20 kHz is largely statistically significant. In summary, whereas multi-tuned neurons in single-tone condition may present octave-spaced over-represented frequencies, the over-representation at these frequencies is much more pronounced in multi-tone conditions.
Mechanisms of over-representation
The potential mechanisms that could account for the increasing over-representation in AI of specific frequencies at octave-spaced intervals, with increasing stimulus density, are unclear. It is clear, however, that the “neural” audiogram (Fig. 6B) does not contribute to such an over-representation. Theoretically, the prevailing acoustic environment of the cats could have had an effect on cortical map organization during the maturation period or even perhaps at the adult stage (Zhang et al., 2001; Noreña et al., 2006). However, no resonance was recorded in the cat's room (see Materials and Methods). The kittens were obtained from different breeders and their tuning was found at the same preferred frequencies regardless of the litter. This suggests that even the early acoustic environment (<6 weeks postnatally) cannot account for the findings. In addition, it is not clear how the cats' own vocalizations (meows, harmonic complex with a fundamental of 500–550 Hz, and up to 10 harmonics, the strongest harmonic being the fourth one; Eggermont, 2001) would induce an over-representation of the frequencies observed, even if they are harmonics of the fundamental, as is approximately the case.
On the other hand, spectral filtering induced by ear canal and pinnae, which, for instance, is used as an acoustical cue for the localization of sound elevation, could potentially account for the over-representation of some frequencies. In this context, it has been shown that the cat's ear canal induces a maximal amplification (>20 dB) of the frequency band centered ∼3 kHz for a large range of azimuth and elevation values (Musicant et al., 1990; Rice et al., 1992). This local amplification could account, at least in part, for the over-representation we observe at 3 kHz, especially in the LFP data. Interestingly, it has been shown that typical, normal-hearing cats and cats raised in a low-noise chamber presented a “normal pathology,” i.e., an increase in the threshold of auditory nerve fibers with CF near 3 kHz (Liberman, 1978). This “normal pathology” could be related, at least in part, to the ear canal resonance at this frequency, i.e., making this frequency range more susceptible to damages caused by noise exposure. In our study, however, the averaged thresholds of neurons with CF near 3 kHz are not increased (Fig. 6B).
Although ear canal resonance is a plausible explanation for the over-representation observed at 3 kHz, the over-representation of frequencies at ∼5, 10, and 20 kHz remains puzzling. Although speculative, a plausible explanation for the over-representation at these higher frequencies may be an octave-spaced pattern in corticocortical connectivity. Indeed, it has been shown in cat auditory cortex that corticocortical connections showed a periodic pattern along the tonotopic axis [Wallace et al. (1991), their Fig. 5B]. Thus, frequencies at octave distances from the amplified 3 kHz peak could receive stronger synaptic excitatory inputs through corticocortical connections. This local increase in excitatory synaptic input could also account for less suppression of neural activity at these frequencies when the density of the stimulus ensemble is increased (see above). This hypothesis is consistent with the very clear pattern of periodic peaks present in LFPs, because they partially reflect synaptic inputs coming from corticocortical connections (Kaur et al., 2004).
So far, the relationship between the cortical representation of a given frequency and the perception/performance at that frequency is unclear. Recanzone et al. (1993) found in owl monkeys a correlation between the cortical area representing the standard frequency and the improvement in a frequency discrimination task; however, the study by Brown et al. (2004) in cats did not corroborate this result. More recently, Han et al. (2007) showed that rats reared in a single-frequency tonal environment showed an enlarged cortical representation of that frequency and impaired performance in a perceptual discrimination task at that frequency (and improved performance at adjacent frequencies).
Finally, the hypothesis outlined above predicts that any acoustic environment with a dominant spectral peak will induce a relative increase in neural activity at octave-spaced frequencies from this peak. This octave-based organization could enhance neural activity when the fundamental and the first harmonic of a complex stimulus are simultaneously presented (Kadia and Wang, 2003). This could serve the purpose of grouping harmonic components into a single auditory object and/or enhancing the cortical saliency (increase of firing rate, for instance) of harmonic sounds relative to the background noise that usually does not present a harmonic structure.
Footnotes
This work was supported by the Alberta Heritage Foundation for Medical Research, the National Sciences and Engineering Research Council of Canada, a Canadian Institutes of Health-New Emerging Team grant, and the Campbell McLaurin Chair for Hearing Deficiencies.
References
- Aertsen AM, Johannesma PI. The spectro-temporal receptive field. A functional characteristic of auditory neurons. Biol Cybern. 1981;42:133–143. doi: 10.1007/BF00336731. [DOI] [PubMed] [Google Scholar]
- Blake DT, Merzenich MM. Changes of AI receptive fields with sound density. J Neurophysiol. 2002;88:3409–3420. doi: 10.1152/jn.00233.2002. [DOI] [PubMed] [Google Scholar]
- Bonham BH, Cheung SW, Godey B, Schreiner CE. Spatial organization of frequency response areas and rate/level functions in the developing AI. J Neurophysiol. 2004;91:841–854. doi: 10.1152/jn.00017.2003. [DOI] [PubMed] [Google Scholar]
- Brosch M, Schreiner CE. Time course of forward masking tuning curves in cat primary auditory cortex. J Neurophysiol. 1997;77:923–943. doi: 10.1152/jn.1997.77.2.923. [DOI] [PubMed] [Google Scholar]
- Brosch M, Schreiner CE. Sequence sensitivity of neurons in cat primary auditory cortex. Cereb Cortex. 2000;10:1155–1167. doi: 10.1093/cercor/10.12.1155. [DOI] [PubMed] [Google Scholar]
- Brosch M, Schulz A, Scheich H. Processing of sound sequences in macaque auditory cortex: response enhancement. J Neurophysiol. 1999;82:1542–1559. doi: 10.1152/jn.1999.82.3.1542. [DOI] [PubMed] [Google Scholar]
- Brown M, Irvine DR, Park VN. Perceptual learning on an auditory frequency discrimination task by cats: association with changes in primary auditory cortex. Cereb Cortex. 2004;14:952–965. doi: 10.1093/cercor/bhh056. [DOI] [PubMed] [Google Scholar]
- Calford MB, Semple MN. Monaural inhibition in cat auditory cortex. J Neurophysiol. 1995;73:1876–1891. doi: 10.1152/jn.1995.73.5.1876. [DOI] [PubMed] [Google Scholar]
- deCharms RC, Blake DT, Merzenich MM. Optimizing sound features for cortical neurons. Science. 1998;280:1439–1443. doi: 10.1126/science.280.5368.1439. [DOI] [PubMed] [Google Scholar]
- Depireux DA, Simon JZ, Klein DJ, Shamma SA. Spectro-temporal response field characterization with dynamic ripples in ferret primary auditory cortex. J Neurophysiol. 2001;85:1220–1234. doi: 10.1152/jn.2001.85.3.1220. [DOI] [PubMed] [Google Scholar]
- Eggermont JJ. Functional aspects of synchrony and correlation in the auditory nervous system. Concepts Neurosci. 1993;4:105–129. [Google Scholar]
- Eggermont JJ. Differential maturation rates for response parameters in cat primary auditory cortex. Aud Neurosci. 1996;2:309–327. [Google Scholar]
- Eggermont JJ. Properties of correlated neural activity clusters in cat auditory cortex resemble those of neural assemblies. J Neurophysiol. 2006;96:746–764. doi: 10.1152/jn.00059.2006. [DOI] [PubMed] [Google Scholar]
- Eggermont JJ, Aertsen AM, Johannesma PI. Quantitative characterisation procedure for auditory neurons based on the spectro-temporal receptive field. Hear Res. 1983;10:167–190. doi: 10.1016/0378-5955(83)90052-7. [DOI] [PubMed] [Google Scholar]
- Elliott DN, Stein L, Harrison MJ. Determination of absolute-intensity thresholds and frequency-difference thresholds in cats. J Acoust Soc Am. 1960;32:380–384. [Google Scholar]
- Escabí MA, Read HL. Representation of spectrotemporal sound information in the ascending auditory pathway. Biol Cybern. 2003;89:350–362. doi: 10.1007/s00422-003-0440-8. [DOI] [PubMed] [Google Scholar]
- Escabí MA, Read HL. Neural mechanisms for spectral analysis in the auditory midbrain, thalamus, and cortex. Int Rev Neurobiol. 2005;70:207–252. doi: 10.1016/S0074-7742(05)70007-6. [DOI] [PubMed] [Google Scholar]
- Galarreta M, Hestrin S. Frequency-dependent synaptic depression and the balance of excitation and inhibition in the neocortex. Nat Neurosci. 1998;1:587–594. doi: 10.1038/2822. [DOI] [PubMed] [Google Scholar]
- Galván VV, Chen J, Weinberger NM. Long-term frequency tuning of local field potentials in the auditory cortex of the waking guinea pig. J Assoc Res Otolaryngol. 2001;2:199–215. doi: 10.1007/s101620010062. [DOI] [PMC free article] [PubMed] [Google Scholar]
- Grace JA, Amin N, Singh NC, Theunissen FE. Selectivity for conspecific song in the zebra finch auditory forebrain. J Neurophysiol. 2003;89:472–487. doi: 10.1152/jn.00088.2002. [DOI] [PubMed] [Google Scholar]
- Han YK, Köver H, Insanally MN, Semerdjian JH, Bao S. Early experience impairs perceptual discrimination. Nat Neurosci. 2007;10:1191–1197. doi: 10.1038/nn1941. [DOI] [PubMed] [Google Scholar]
- Hsu A, Woolley SM, Fremouw TE, Theunissen FE. Modulation power and phase spectrum of natural sounds enhance neural encoding performed by single auditory neurons. J Neurosci. 2004;24:9201–9211. doi: 10.1523/JNEUROSCI.2449-04.2004. [DOI] [PMC free article] [PubMed] [Google Scholar]
- Kadia SC, Wang X. Spectral integration in A1 of awake primates: neurons with single- and multipeaked tuning characteristics. J Neurophysiol. 2003;89:1603–1622. doi: 10.1152/jn.00271.2001. [DOI] [PubMed] [Google Scholar]
- Kaur S, Lazar R, Metherate R. Intracortical pathways determine breadth of subthreshold frequency receptive fields in primary auditory cortex. J Neurophysiol. 2004;91:2551–2567. doi: 10.1152/jn.01121.2003. [DOI] [PubMed] [Google Scholar]
- Klein DJ, Depireux DA, Simon JZ, Shamma SA. Robust spectrotemporal reverse correlation for the auditory system: optimizing stimulus design. J Comput Neurosci. 2000;9:85–111. doi: 10.1023/a:1008990412183. [DOI] [PubMed] [Google Scholar]
- Liberman MC. Auditory-nerve response from cats raised in a low-noise chamber. J Acoust Soc Am. 1978;63:442–455. doi: 10.1121/1.381736. [DOI] [PubMed] [Google Scholar]
- Miller LM, Escabí MA, Schreiner CE. Feature selectivity and interneuronal cooperation in the thalamocortical system. J Neurosci. 2001;21:8136–8144. doi: 10.1523/JNEUROSCI.21-20-08136.2001. [DOI] [PMC free article] [PubMed] [Google Scholar]
- Miller LM, Escabí MA, Read HL, Schreiner CE. Spectrotemporal receptive fields in the lemniscal auditory thalamus and cortex. J Neurophysiol. 2002;87:516–527. doi: 10.1152/jn.00395.2001. [DOI] [PubMed] [Google Scholar]
- Mitzdorf U. Current source-density method and application in cat cerebral cortex: investigation of evoked potentials and EEG phenomena. Physiol Rev. 1985;65:37–100. doi: 10.1152/physrev.1985.65.1.37. [DOI] [PubMed] [Google Scholar]
- Musicant AD, Chan JC, Hind JE. Direction-dependent spectral properties of cat external ear: new data and cross-species comparisons. J Acoust Soc Am. 1990;87:757–781. doi: 10.1121/1.399545. [DOI] [PubMed] [Google Scholar]
- Noreña A, Eggermont JJ. Comparison between local field potentials and unit cluster activity in primary auditory cortex and anterior auditory field in the cat. Hear Res. 2002;166:202–213. doi: 10.1016/s0378-5955(02)00329-5. [DOI] [PubMed] [Google Scholar]
- Noreña AJ, Gourévitch B, Aizawa N, Eggermont JJ. Spectrally enhanced acoustic environment disrupts frequency representation in cat auditory cortex. Nat Neurosci. 2006;9:932–939. doi: 10.1038/nn1720. [DOI] [PubMed] [Google Scholar]
- Qiu A, Schreiner CE, Escabí MA. Gabor analysis of auditory midbrain receptive fields: spectro-temporal and binaural composition. J Neurophysiol. 2003;90:456–476. doi: 10.1152/jn.00851.2002. [DOI] [PubMed] [Google Scholar]
- Recanzone GH, Schreiner CE, Merzenich MM. Plasticity in the frequency representation of primary auditory cortex following discrimination training in adult owl monkeys. J Neurosci. 1993;13:87–103. doi: 10.1523/JNEUROSCI.13-01-00087.1993. [DOI] [PMC free article] [PubMed] [Google Scholar]
- Rice JJ, May BJ, Spirou GA, Young ED. Pinna-based spectral cues for sound localization in cat. Hear Res. 1992;58:132–152. doi: 10.1016/0378-5955(92)90123-5. [DOI] [PubMed] [Google Scholar]
- Rutkowski RG, Shackleton TM, Schnupp JW, Wallace MN, Palmer AR. Spectrotemporal receptive field properties of single units in the primary, dorsocaudal and ventrorostral auditory cortex of the guinea pig. Audiol Neurootol. 2002;7:214–227. doi: 10.1159/000063738. [DOI] [PubMed] [Google Scholar]
- Schreiner CE, Calhoun BM. Spectral envelope coding in cat primary auditory cortex: properties of ripple transfer functions. Aud Neurosci. 1994;11:39–61. [Google Scholar]
- Singh NC, Theunissen FE. Modulation spectra of natural sounds and ethological theories of auditory processing. J Acoust Soc Am. 2003;114:3394–3411. doi: 10.1121/1.1624067. [DOI] [PubMed] [Google Scholar]
- Sutter ML, Schreiner CE. Physiology and topography of neurons with multipeaked tuning curves in cat primary auditory cortex. J Neurophysiol. 1991;65:1207–1226. doi: 10.1152/jn.1991.65.5.1207. [DOI] [PubMed] [Google Scholar]
- Theunissen FE, Sen K, Doupe AJ. Spectral-temporal receptive fields of nonlinear auditory neurons obtained using natural sounds. J Neurosci. 2000;20:2315–2331. doi: 10.1523/JNEUROSCI.20-06-02315.2000. [DOI] [PMC free article] [PubMed] [Google Scholar]
- Valentine PA, Eggermont JJ. Stimulus dependence of spectro-temporal receptive fields in cat primary auditory cortex. Hear Res. 2004;196:119–133. doi: 10.1016/j.heares.2004.05.011. [DOI] [PubMed] [Google Scholar]
- Varela JA, Song S, Turrigiano GG, Nelson SB. Differential depression at excitatory and inhibitory synapses in visual cortex. J Neurosci. 1999;19:4293–4304. doi: 10.1523/JNEUROSCI.19-11-04293.1999. [DOI] [PMC free article] [PubMed] [Google Scholar]
- Wallace MN, Kitzes LM, Jones EG. Intrinsic inter- and intralaminar connections and their relationship to the tonotopic map in cat primary auditory cortex. Exp Brain Res. 1991;86:527–544. doi: 10.1007/BF00230526. [DOI] [PubMed] [Google Scholar]
- Wehr M, Zador AM. Synaptic mechanisms of forward suppression in rat auditory cortex. Neuron. 2005;47:437–445. doi: 10.1016/j.neuron.2005.06.009. [DOI] [PubMed] [Google Scholar]
- Zhang LI, Bao S, Merzenich MM. Persistent and specific influences of early acoustic environments on primary auditory cortex. Nat Neurosci. 2001;4:1123–1130. doi: 10.1038/nn745. [DOI] [PubMed] [Google Scholar]


