

Abstract
Long-lasting neuronal plasticity as well as long-term memory (LTM) requires de novo synthesis of proteins through dynamic regulation of gene expression. cAMP-responsive element (CRE)-mediated gene transcription occurs in an activity-dependent manner and plays a pivotal role in neuronal plasticity and LTM in a variety of species. To study the physiological role of inducible cAMP early repressor (ICER), a CRE-mediated gene transcription repressor, in neuronal plasticity and LTM, we generated two types of ICER mutant mice: ICER-overexpressing (OE) mice and ICER-specific knock-out (KO) mice. Both ICER-OE and ICER-KO mice show no apparent abnormalities in their development and reproduction. A comprehensive battery of behavioral tests revealed no robust changes in locomotor activity, sensory and motor functions, and emotional responses in the mutant mice. However, long-term conditioned fear memory was attenuated in ICER-OE mice and enhanced in ICER-KO mice without concurrent changes in short-term fear memory. Furthermore, ICER-OE mice exhibited retardation of kindling development, whereas ICER-KO mice exhibited acceleration of kindling. These results strongly suggest that ICER negatively regulates the neuronal processes required for long-term fear memory and neuronal plasticity underlying kindling epileptogenesis, possibly through suppression of CRE-mediated gene transcription.
Keywords: fear conditioning, amygdala kindling, CRE-mediated gene transcription, ICER, CREB, immediate early genes
Introduction
Dynamic regulation of cAMP-responsive element (CRE)-mediated gene transcription is an important mechanism of adaptation to environmental changes in the brain (Silva et al., 1998; Lonze and Ginty, 2002; Carlezon et al., 2005). Studies in Aplysia (Bartsch et al., 1995, 1998), Drosophila (Yin et al., 1994, 1995), and mice (Bourtchuladze et al., 1994) have firmly established a conserved importance of the CRE-mediated gene transcription and CRE-binding protein (CREB) for memory across species. Although a strong connection between CREB and neuronal plasticity underlying learning and memory has been demonstrated (Bourtchuladze et al., 1994; Schulz et al., 1999; Barco et al., 2002; Pittenger et al., 2002; Ahmed and Frey, 2005; Warburton et al., 2005) (but see Gass et al., 1998; Balschun et al., 2003), the outcome of CRE-mediated gene transcription depends on the competitive binding of several dimerized transcription factors, including activators and repressors of gene transcription. In mammals, these factors are products of the CREB/CRE modulator (CREM)/activating transcription factor 1 (ATF1) gene family (Lee and Masson, 1993; Sassone-Corsi, 1995; Montminy, 1997; Mayr and Montminy, 2001).
Among its family members, the inducible cAMP early repressor (ICER) protein is unique in that it is highly inducible in response to stimuli and it is a potent endogenous repressor of CRE-mediated gene transcription (for review, see Foulkes and Sassone-Corsi, 1996; Mioduszewska et al., 2003). ICER is transcribed from the internal P2 promoter of the CREM gene (Molina et al., 1993; Stehle et al., 1993) and contains DNA-binding domains but lacks activation domains. Thus, ICER homodimers and/or ICER heterodimers, comprising ICER plus other members of the CREB/CREM/ATF1 family, bind efficiently to CREs and competitively block DNA binding of other family members to suppress CRE-dependent transcription (Stehle et al., 1993; Tinti et al., 1996; Lamas et al., 1997; Misund et al., 2007). Although basal ICER levels in the brain are relatively low, except for several sensory and neuroendocrine centers (Kell et al., 2004), drastic upregulation of ICER has been demonstrated in response to a variety of stimuli, including ones linked to neuronal excitation, suggesting that ICER plays a role in the regulation of higher-order brain functions (Rydelek-Fitzgerald et al., 1996; Konopka et al., 1998; Staiger et al., 2000; Storvik et al., 2000; Shepard et al., 2005; Green et al., 2006).
Although the importance of inhibitory regulation in long-term memory (LTM) has become more evident (Abel et al., 1998; Chen et al., 2003; Lepicard et al., 2006), the role of the unique endogenous CREB antagonist ICER on LTM is essentially unknown and unstudied. To our knowledge, only one study exists; using a virus vector, Mouravlev et al. (2006) showed that restricted overexpression of ICER in the hippocampus leads to memory deficits in aged rats but not in younger ones. Here, we generated two types of ICER mutant mice, ICER-overexpressing (OE) and ICER-knock-out (KO) mice, to examine the role of ICER in LTM and kindling. Our results indicate that ICER acts as a negative regulator of long-lasting changes in neuronal plasticity and long-term fear memory.
Materials and Methods
Generation of ICER mutant mice
Generation of ICER-overexpressing mice.
Full-length ICER cDNA was amplified using cDNA synthesized from C57BL/6J mouse brain total RNA as a template. Pfu DNA polymerase and primers (5′-CGGGATCCACTTTATTTTGGACTGTGGTAC-3′ and 5′-CGGAATTCAGTTTCATCTCCAGTTACAGCC-3′) containing BamHI or EcoRI sites (underlined) were used for the PCR reaction. The amplified cDNA was cut with BamHI plus EcoRI and subcloned into pBlueScript (Stratagene). The sequence of the insert was confirmed by double-strand DNA sequencing. We obtained cDNA clones corresponding to alternative spliced variants, including ICER-I, ICER-Iγ, ICER-II, and ICER-IIγ.
To construct the ICER-I and ICER-II transgenes (Fig. 1A), we subcloned the entire coding sequence of cDNA into a vector pNN265 and then into pNN279, as described previously (Kojima et al., 1998). To distinguish the ICER-II transgene from the ICER-I transgene, the Simian virus 40 (SV40) poly(A)-signal sequence of the ICER-I transgene (Fig. 1A, SV40pA1) was replaced with a sequence (Fig. 1A, SV40pA2) derived from ptTA plasmid (Clontech). The transgene was excised from the vector and gel purified. The transgene was microinjected into the pronuclei of fertilized eggs, and then the transgene-injected eggs were transplanted into the oviducts of pseudopregnant mice. We obtained three lines of mice carrying the ICER-I transgene (lines I-15, I-19, and I-23) and one line of mice carrying the ICER-II transgene (line II).
Figure 1.

Characterization of ICER-OE mice. A, Transgene constructs for ICER transgenic mice generation were composed of a promoter region from the Ca2+/calmodulin-dependent protein kinase IIα gene (pCaMKIIα), 5′-untranslated region (5′-UTR) derived from pNN265, 3′-untranslated region containing a poly(A) signal sequence (SV40pA1 or SV40pA2), and either ICER-I or ICER-II cDNA. The probes for detecting transgenic ICER mRNAs are indicated by thick lines (Probe 1 and Probe 2). B, Expression of transgenic ICER mRNA in mouse brain. Sagittal sections from an ICER-I-OE mouse (line I-15) and a non-TG littermate were hybridized with digoxigenin-labeled cRNA probe 1. The transgene-derived ICER-I mRNA was preferentially expressed in forebrain structures. Scale bars, 500 μm. A coronal section from ICER-II-OE mice (line II) was hybridized with digoxigenin-labeled cRNA probe 2. ICER mRNA was highly expressed in layers II–III and V–VI of neocortex, hippocampus, piriform cortex, and amygdala. Scale bars, 500 μm. C, Northern blot analysis of total RNA prepared from the forebrain of non-TG and ICER-OE mice (lines I-15 and II). 32P-labeled probe 1 hybridized to transgenic ICER-I mRNA (left, I-15) and 32P-labeled probe 2 hybridized to both ICER-I and ICER-II mRNAs (right, I-15 and II). Endogenous ICER mRNA in non-TG mice was below the detection limit of probe 2 under the condition used (non-TG). D, Quantitative RT-PCR detection of ICER mRNA in the hippocampus of each transgenic line. Each value was calculated from four to six independent samples and presented as means ± SEM of mRNA levels normalized to mRNA levels of non-TG mice. E, Western blot analysis of protein lysates prepared from the hippocampi of non-TG and ICER-OE mice (lines I-15, I-23, and II); blots were probed with anti-CREM antibody. The 19 kDa band corresponding to ICER protein is indicated by an arrow.
Line I-15 was generated using B6/C3H/F1 eggs, and lines I-19, I-23, and II were generated using C57BL/6J eggs. The transgene-positive lines were established by crossing founders with C57BL/6J mice. The genotypes of ICER-I-OE mice were determined by PCR of tail DNA using transgene-specific primers to amplify the DNA sequence of SV40pA1 (which corresponds to Probe 1 in Fig. 1A): 5′-TGGAACTGATGAATGGGAGCAG-3′ and 5′-AGTGCAGCTTTTTCCTTTGTGG-3′. The genotypes of ICER-II-OE mice were determined by PCR using transgene-specific primers to amplify the DNA sequence of SV40pA2: 5′-GATCCTGCAAGCCTCGTCGTC-3′ and 5′-CTGATACTTCCCGTCCGCCAG-3′. We did not include the analyses of line I-19 in this study.
Generation of ICER knock-out mice.
Clones containing the CREM gene were obtained from a bacterial artificial chromosome (BAC) library derived from a C57BL/6J female mouse (BACPAC Resource Center of Children's Hospital Oakland Research Institute) by screening the library with an ICER-I cDNA probe. A ∼12 kbp EcoRV–SacI DNA fragment containing the exon of CREM gene P2 promoter was subcloned into pBlueScript. For the construction of the targeting vector, two loxP sequences were inserted in 5′- and 3′-flanking regions of the P2 exon. For positive selection of recombinant embryonic stem (ES) clones, the phosphoglycerate kinase (PGK)–neo cassette was inserted in reverse into the P2 exon in the 3′ direction (Fig. 2A). The diphtheria toxin A gene was also inserted into the 5′-end of the targeting vector to provide negative selection for random insertion. Next, the targeting vector was linearized, gel purified, and electroporated into MS12 cells, the ES cells established from C57BL/6 mice (Kawase et al., 1994). Recombinant ES cells were then selected in the presence of neomycin (G418). To confirm the homologous recombination of the targeting vector within the CREM gene, we analyzed recombinant ES clones by Southern blot analysis (Fig. 2B). Briefly, ES genomic DNA was digested with EcoRI and electrophoresed on 0.7% agarose gels. After electrophoresis, the DNA was transferred to nylon membranes using standard procedures described by Sambrook et al. (1989). Using the 32P-labeled probe, we detected two bands in heterozygous DNA, one containing the loxP sites and PGK–neo cassette and the other containing the preintegration site in the wild-type (WT) allele (Fig. 2A).
Figure 2.

Generation of ICER-KO mice. A, For construction of the targeting vector, two loxP sequences (arrowheads) were inserted into the 5′- and 3′-flanking region of the P2 exon of the CREM gene. For negative and positive selection of recombinant ES clones, a PGK–neo cassette (neo) flanked by frt sequences and a diphtheria toxin A gene (DT-A), respectively, were inserted into the targeting vector. The P2 exon flanked by two loxP sequences was deleted by microinjecting a Cre recombinase-expressing vector into the fertilized eggs carrying the targeted genomic allele. The location of the probe used for Southern blot analysis is indicated by a thick line. E, EcoRI; S, SacI. B, Southern blot analysis of genomic DNA prepared from WT and recombinant (Targeted) ES cells. A 32P-labeled DNA probe detected a single 15.0 kb EcoRI fragment in WT cells and an additional 8.1 kb fragment in targeted cells. C, PCR-based genotyping of ICER-KO mice; the primer pair (arrows) specific for the P2 exon distinguished WT, heterozygous (+/−), and homozygous (KO) mice. D, ICER-specific primer pair (described in the supplemental Materials and Methods, available at www.jneurosci.org as supplemental material) was used to amplify the PCR products from brain cDNA prepared from the RNA of WT mice but not from brain cDNA prepared from the RNA of KO mice. E, Western blot analysis of lysates prepared from hippocampi of WT, ICER-KO, and ICER-OE (line II) mice. Blots were probed with anti-CREM or anti-CREB antibody. We detected no apparent difference in CREM isoform and CREB expression levels in all groups of mice. The additional band corresponding to ICER protein in ICER-OE mice is indicated by an arrow.
The selected ES clone was microinjected into mouse blastocysts and then transplanted into pseudopregnant mice. To confirm germ-line transmission, we bred several lines of chimeric mice with C57BL/6J mice. Resulting mice carrying the targeted genomic locus in haploid were bred with C57BL/6J mice to obtain fertilized eggs. We then deleted the P2 exon flanked by two loxP sequences by microinjecting a plasmid containing Cre recombinase into the fertilized eggs. Mice carrying the P2 exon deletion were screened by Southern blot analysis, as described above, and by PCR using the following primer pair (Fig. 2A, arrows): 5′-CTTCATGAGCTACAACTCTG-3′ and 5′-AGATCACTGCCTTAGTCAAC-3′. We also confirmed the deletion of the P2 exon by direct DNA sequencing of the PCR product. To maintain the breeding colony, we mated heterozygous ICER-KO male mice with C57BL/6J females. Heterozygous offspring from these matings were used to produce homozygous ICER-KO mice used in the experiments.
Experimental animals.
Lines of ICER-OE and ICER-KO mice were housed in groups of three to five in a controlled environment with a 12 h light/dark cycle (lights on at 7:00 A.M.), a humidity of 50 ± 10%, and a room temperature of 23 ± 1°C. Food and water were available ad libitum. After weaning the mice, we determined their genotypes by PCR of tail DNA. At 2–5 months of age, male offspring of the ICER mutant lines (generations 2–13 for ICER-OE and generations 3–9 for ICER-KO, each obtained by backcrossing with C57BL/6J mice) were subjected to experiments.
Mice were moved from the breeding facility to the holding room at least 1 week before the beginning of testing, individually housed, supplied with food and water ad libitum, and kept under the same standard housing conditions. Nontransgenic (non-TG) and WT littermates were used as control animals for ICER-OE and ICER-KO mice, respectively. All animal experiments were performed in accordance with regulations outlined by Japanese law and National Institutes of Health guidelines and were approved by the RIKEN Brain Science Institute and Okinawa Institute of Science and Technology.
Molecular biological methods
RNA preparation and Northern blot analysis.
Brains were quickly removed and rinsed with ice-cold PBS, and dissected tissue samples were frozen on dry ice and stored at −80°C until use. Total RNA was prepared by using Trizol reagent (Invitrogen) and treatment with RNase-free DNase I.
Four micrograms of forebrain total RNA was electrophoresed on gels containing formaldehyde and transferred onto nylon membranes using standard procedures (Sambrook et al., 1989). ICER-I transgene-derived mRNA and ICER mRNAs (both ICER-I and ICER-II, and both endogenous and transgenic mRNAs) were detected using 32P-labeled probe 1 and probe 2 (Fig. 2A), respectively. After hybridization and washing, radioactive signals on the membrane were analyzed with a BAS 5000 Bioimaging Analyzer (Fuji Film).
Quantitative reverse transcription-PCR.
One microgram of DNase I-treated hippocampal total RNA was converted into cDNA using an oligo-dT12–18 primer and reverse transcriptase (SuperScript II; Invitrogen). An aliquot of the cDNA was used as a template for real-time PCR using ABI 7500 (Applied Biosystems). SYBR Green PCR Master Mix was used according to the instructions of the manufacturer. The sequences of the primers for detecting ICER and CREM transcripts were as follows: ICER, 5′-TGGACTGTGG TACGGCCAAT-3′ and 5′-CAGTTTCATCTCCAGTTACA-3′; and CREM, 5′- CAGAGCTATGCTCTGCCACAGA-3′ and 5′-GGCAAATGACCATGGAAACAG-3′. ICER and CREM mRNA levels were normalized according to glyceraldehyde-3′-phosphate dehydrogenase mRNA levels, as an internal control; the mRNA levels of each transgenic line were presented relative to those of non-TG mice.
In situ hybridization.
In situ hybridization was used to detect transgenic ICER mRNA in brain sections from each ICER-OE line. Briefly, brains were quickly removed and frozen on dry ice. Cryostat sections (12 μm thick) were dried at 42°C and kept at −80°C until use. Digoxigenin-labeled cRNAs complementary to SV40pA1 (Fig. 1A, Probe 1) and ICER mRNA-specific sequences (Fig. 1A, Probe 2) were prepared and used as probes to detect transgene-derived ICER-I transcripts and ICER mRNAs (both ICER-I and ICER-II, and both endogenous and transgenic mRNAs), respectively. Procedures for pretreatment of sections, hybridization, and detection were performed according to the instructions of the manufacturer (Roche Diagnosis).
Protein sample preparation and Western blot analysis.
Brains were quickly removed from the skull and dissected on ice. Tissue was homogenized in boiled 1% SDS in PBS using a glass Teflon homogenizer. The homogenate was further boiled for 5 min and centrifuged at 12,000 × g for 10 min, and the resulting supernatant was stored at −80°C. Protein concentration was determined using a DC protein assay kit (Bio-Rad).
Equal amount of the supernatant in each mouse group was mixed with SDS sample buffer, boiled for 5 min, and subsequently separated on a 15% SDS-polyacrylamide gel. The separated proteins were transferred onto nitrocellulose membranes (Schleicher & Schuell) and probed with anti-CREM antibody (Santa Cruz Biotechnology) and anti-CREB antibody (New England Biolabs). After incubation with horseradish peroxidase-conjugated secondary antibody, immunoreactive signals were visualized on x-ray film by ECL detection reagents (GE Healthcare). Images were digitized with a scanner, and band intensity was quantified by densitometry using the public domain program NIH Image (available at http://rsb.info.nih.gov/nih-image/).
Behavioral tests
All equipments used in the behavioral experiments were made by O'Hara & Co. unless specified otherwise.
Behavioral test battery.
Mice were 9–10 weeks of age at the beginning of testing; each group consisted of 12 males that were consecutively run through all tests of the battery.
Home-cage activity.
Mice were housed individually in cages with bedding, food, and water. A 12 h light/dark cycle (lights on at 7:00 A.M.) was used. Mice were allowed to habituate for 1 d before monitoring their 24 h activity for 3 consecutive days using AS-TIME (version 2) activity sensors. The infrared sensors detected a heat-radiating mouse body. Change in the relative position of the body to the sensor was counted as a unit of activity. Activity measures were collected per 10 min bins, and averaged total activity per light or dark phase was calculated.
Open-field test.
Spontaneous motor activity, exploratory behavior, and emotional responses to a novel environment were measured in an open-field test. Mice were placed into a corner of the open field (50 × 50 × 50 cm, white acrylic floor and transparent walls) and allowed to explore for 15 min. On the first day, performance was assessed under low-light conditions (28 lux). On the following day, performance was assessed under bright-light conditions (150 lux). Distance traveled and time spent in the center of the field were measured.
Light/dark transition test.
To assess visual perception and anxiety level, we placed a mouse in the dark compartment of a light/dark box and allowed it to freely move between light and dark compartments for 10 min. Each compartment measured 20 × 20 × 25 cm; the lighted compartment was illuminated at 500 lux. Latency to enter the lit compartment and distance traveled within each compartment were recorded.
Elevated plus-maze test.
We used an elevated plus maze to further assess the anxiety levels of the mice. The maze (elevated 50 cm above the floor) consisted of four arms (25 × 5 cm), and a central platform made of white acrylic; two opposite arms were open, and the other two arms were enclosed by 15-cm-high transparent walls (room was illuminated at 40 lux). A mouse was placed in the center platform, positioned to face one of the open arms, and allowed to explore the maze for 10 min. Time spent in the different arms and the number of arm entries were recorded.
Acoustic startle and prepulse inhibition.
Hearing, general reflexes, and sensorimotor gating were examined in acoustic startle and prepulse inhibition tests. Loud noise-provoked startle (120 dB/40 ms, 10 trials, 10–30 s intertrial interval) and startle inhibition caused by 74, 78, and 82 dB prepulse tones (4 pairs/10 trials, 20 ms prepulse 80 ms ahead of a 120 dB signal) were analyzed according to Binder et al. (2001). Mouse was placed into a plastic chamber, and the chamber was fixed on a platform connected to an acceleration sensor, which was located inside a sound-attenuating box. The sensor measured acceleration velocity and transformed it into a voltage, which, after amplification, served as a startle value.
Rotarod test.
Motor coordination and motor learning were assessed by placing mice onto a rotating rod. We increased the rotation speed from 4 to 40 rotations per minute in 5 min. The length of time an animal stayed on the rotating rod was recorded. A session consisted of four trials separated by 10 min intervals.
Wire hanging test.
Muscle strength and grip were tested by forcing animals to hang onto a stainless steel wire (wire diameter, 2 mm and 1 cm apart) located 30 cm above the floor. Latency to drop down was recorded (cutoff time, 300 s).
Hotplate test.
Pain sensitivity was assessed by placing animals on a 55°C hotplate and recording the latency to lick a paw (MK-350C; Muromachi Kikai).
Fear conditioning.
Both initial assessment of electrical shock sensitivity and fear conditioning were performed in a clear acrylic chamber (10 × 10 × 25 cm in height) with a stainless steel grid floor (2 mm diameter rods, 5 mm apart). The chamber was placed in a soundproof box facing a wall-mounted charge-coupled device (CCD) camera connected to a video monitor and a computer (Power Macintosh G4; Apple Computers). The grid floor was wired to a shock generator. An auditory signal was supplied from a loudspeaker located in the ceiling of the box. The fear conditioning experiment was run using Image FZC version 2.20 software (O'Hara & Co., Ltd.), which is based on the public domain program NIH Image.
Electrical foot-shock sensitivity.
Sensitivity of the ICER mutant mice to electrical foot shock was assessed in naive groups of mice from each line. A mouse was placed in the chamber, and series of stimulations were delivered, starting at an intensity of 0.01 mA and increasing gradually until evoking a paw flick and vocalization. The threshold intensities for paw flick and vocalization of mutant and control mice of each line were compared.
Conditioning.
Adult (3–5 months old) naive male mice were used in this experiment. On the conditioning day, mice were brought to an experimental room and individually placed in a chamber, and, after a 60 s exploratory period, a tone (10 kHz, 70 dB) was delivered for 10 s; this served as the conditioned stimulus (CS). The CS coterminated with the unconditioned stimulus (US), a scrambled electrical foot shock (0.3 mA, 1 s). The CS–US pairing was delivered twice at 20 s intervals, and, 50 s later, the animal was returned to its home cage. The chamber was wiped with ethanol after the conditioning of each animal.
Testing.
The mice were subjected to three types of memory tests sequentially: (1) 1 h after conditioning, short-term tone-dependent fear memory was examined; (2) 24 h after conditioning, long-term tone-dependent fear memory was examined; and (3) 48 h after conditioning, long-term context-dependent fear memory was examined. Tone-dependent fear memory tests were conducted in a new chamber to separate tone-dependent fear memory from context-dependent fear memory. This chamber, although of the same size and located in the same soundproof box, differed from the conditioning chamber in that it was made of Plexiglas, had white screens on the side and back walls, and had a flat floor covered with wood chips. To further distinguish experimental contexts, the tone-dependent tests were conducted under the low illumination (30 lux during tone test vs 120 lux during conditioning) and lower background fan noise (50 dB during tone test vs 55 dB during conditioning). The duration of the entire test was 120 s. Mice were brought to the experimental room and placed in the chamber, and, after 60 s, the tone was presented for 60 s without the foot shock. During the context-dependent fear memory test, animals were placed in the original conditioning chamber for 30 s, and then freezing was measured for 60 s without delivery of either the tone or the foot shock. In this test, the conditioning chamber served as the background CS for the animal.
Throughout the experiment, behavior was recorded via CCD camera (two frames per second), and freezing was measured as an index of fear. Freezing was defined as complete immobility (excluding movement required for heartbeat and respiration) lasting longer than 1 s; freezing was automatically calculated by the program. In pilot experiments, an experienced human observer confirmed the efficiency of the automatic freezing scoring. Summed-freezing time was scored as the percentage of freezing within a specified period (60 s).
Odor discrimination task.
Odor discrimination memory of the mice was examined according to Rescorla and Durlach (1981) with some modifications. Briefly, mice were housed individually and were maintained for 4 d on a 23.5 h water-deprivation schedule; water was supplied in two 15 ml bottles from 1:00 P.M. to 1:30 P.M. Water intake was measured, and, if a mouse had consumed <2 ml, water was provided for an additional 60 min (4:00 P.M. to 5:00 P.M.). On the training day (1:00 P.M. to 1:30 P.M.), mice were supplied with two bottles of water containing either 0.1% vanilla essence or 0.3% almond essence; one of the bottles also contained 12.5% (w/v) glucose (counterbalanced between vanilla- and almond-odorized water and animal genotype). Liquid consumption was measured, and, if needed, additional water was supplied for 60 min. After three consecutive training days, mice were returned to the ad libitum water regimen for 3 d before reinstating water deprivation 24 h before the test. During the test, mice were given access to two bottles containing either the vanilla- or the almond-odorized water but lacking glucose. After a 30 min test session, the consumption of water from the two bottles was measured by weighing the bottles. Finally, we calculated the ratio of consumption of odorized water that previously contained glucose versus total water consumption during the test.
Amygdala kindling
Adult male mice 2.5–4 months of age weighing 20–32 g were anesthetized with 17 μl/g body weight (intraperitoneally) of 2.5% Avertin. A bipolar electrode made of twisted Teflon-insulated stainless steel wires (each wire was 100 μm in diameter; A-M Systems) was implanted stereotaxically into the left basolateral amygdala (2.4 mm anterior to interaural 0, 2.8 mm lateral to the midline, 4.8 mm ventral to the skull surface). The positioning of the electrode was based on the bregma coordinate system provided by Paxinos and Franklin (2001). After a 10 d recovery period, mice received one electrical stimulation (1 s train of 60 Hz rectangular pulses) through the electrode per day, except for the first day when the intensity of the stimulus was determined individually for each mouse. To determine the intensity of stimulus, each animal was given a series of stimulations (beginning at 100 μA and gradually increasing every 90 s) until afterdischarges (ADs) were observed, and this intensity was used thereafter. ADs were recorded from the left amygdala through the electrode, digitized at 10 kHz, and analyzed using PowerLab software (ADInstruments). Animal behavior was observed, and convulsive stage was classified according to a modified version of Racine's criteria (Racine, 1972) as follows: stage 1, rhythmic mouth and facial movement; stage 2, head nodding; stage 3, unilateral forelimb clonus; stage 4, rearing and bilateral forelimb clonus; stage 5, falling and/or hindlimb clonus; stage 6, bouncing and/or jumping. Mice were defined as fully kindled when they had stage 5 or severer convulsions on 3 consecutive days within the set maximum number of stimulations (20 d for ICER-OE mice and 15 d for ICER-KO mice).
Statistical analysis
Data were analyzed using SPSS 14.0 (SPSS) and StatView (SAS Institute). ANOVA followed by post hoc test or t test was used to compare data between mutant and control groups. The χ2 test was used to compare the percentage induction of the fully kindled state in each line of mice. For all statistical analyses, a probability level of 0.05 or lower was considered to be statistically significant.
Results
ICER is overexpressed in the forebrain neurons of ICER transgenic mice
To elucidate the physiological roles of ICER, we generated transgenic mice that constitutively overexpress ICER-I or ICER-II in the brain. Three independent ICER-OE lines were analyzed: ICER-I-15, ICER-I-23, and ICER-II. We used the promoter for Ca2+/calmodulin-dependent protein kinase IIα (CaMKIIα) to express ICER in the forebrain (Kojima et al., 1997). In situ hybridization of ICER-I-OE brain sections probed with an ICER-I transgene-specific probe (Fig. 1A, Probe 1) showed that transgene-derived ICER mRNA was preferentially expressed in the forebrain, including the olfactory bulb, neocortex, hippocampus, striatum, and anterior part of the inferior colliculus (Fig. 1B). High levels of transgenic ICER-I mRNA were also expressed in the amygdala and piriform cortex (data not shown). Low but significant levels of transgene expression were detected in cells of the thalamus and hypothalamus. Transgene-positive cells, however, were rare in the medulla and cerebellum. The transgene-derived ICER-I mRNA was also observed in the Purkinje cell layer of lobule X of cerebellum. No obvious difference was observed in the mRNA distribution of different ICER-I-OE lines (data not shown). Brain sections from ICER-II-OE mice were analyzed with another ICER-specific probe (Fig. 1A, Probe 2). As with ICER-I-OE mice, ICER mRNA was highly expressed in the amygdala and piriform cortex in ICER-II-OE mice (Fig. 1B), confirming that transgene-derived ICER mRNA is expressed in these areas. The forebrain-specific expression pattern of ICER mRNA in ICER-II mice was similar to that of ICER-I-OE mice (data not shown).
Northern blot analyses using the ICER-I-transgene-specific probe (Probe 1) revealed transgene-derived ICER-I mRNA (∼1.5 kb in length) expression in the forebrain of line I-15 mice (Fig. 1C, left). Blots hybridized with the ICER-specific probe (Probe 2) showed expression of transgene-derived ICER-II mRNA (∼1.0 kb in length) in the forebrain of ICER-II mice (Fig. 1C, right). Although high levels of transgene-derived ICER mRNA were detected in ICER-OE mice, endogenous ICER mRNA was hardly detected in non-TG mice, indicating that the amount of endogenous ICER mRNA is normally very low in the absence of stimuli. This observation further confirmed our ICER induction results from the electrical kindling of C57BL/6J mice, demonstrating very low levels of endogenous ICER under basal conditions (supplemental Fig. 1B,C, available at www.jneurosci.org as supplemental material).
To more accurately evaluate basal and overexpression levels of ICER in each transgenic line, we measured ICER mRNA levels in the hippocampus by using quantitative reverse transcription (RT)-PCR and ICER-specific primers (Fig. 1D). Normalized ICER mRNA levels in the hippocampus of I-15, I-23, and II mice were ∼50-fold, 90-fold, and 400-fold, respectively, of endogenous levels. ICER mRNA was significantly overexpressed in each transgenic line (t test: non-TG vs I-15, t(8) = 10.0, p < 0.001; I-23, t(6) = 13.4, p < 0.001; II, t(8) = 6.2, p < 0.001). The neocortex of each type of transgenic mouse also showed similar levels of overexpression (data not shown).
To assess ICER protein expression in I-15, I-23, and II transgenic mice, we performed Western blot analysis of hippocampal lysates from these mice using anti-CREM antibodies (Fig. 1E). A 19 kDa band representing ICER protein showed increased signal intensity. However, we could not identify the band representing endogenous ICER protein in non-TG samples, probably attributable to assay sensitivity limits. The ratio of the intensity of each transgenic line (I-15, I-23, and II) was 1.0, 1.2, and 2.1, respectively.
Neither overexpression nor disruption of ICER affects the expression of other CREB/CREM family members
To generate ICER-specific KO mice, we deleted the P2 exon, which encodes the 5′ coding sequence of ICER, from the CREM gene (Fig. 2A). PCR using specific primers (Fig. 2A, arrows) was used to distinguish the genotypes of WT mice from those of heterozygous (+/−) and homozygous (ICER-KO) ICER mice (Fig. 2C). A highly sensitive RT-PCR assay using the same ICER-specific primers (as those used in the experiments summarized in supplemental Fig. 1; for sequences, see supplemental Materials and Methods, available at www.jneurosci.org as supplemental material) did not detect ICER transcripts from total cDNA synthesized from ICER-KO mouse brain mRNA (Fig. 2D).
To assess the effects of ICER overexpression or disruption on the expression of other CREM isoforms, we measured promoter-1-driven CREM transcripts in the forebrain of WT, ICER-OE (line II), and ICER-KO mice. CREM mRNA levels measured using quantitative RT-PCR were 1.0 ± 0.3 in WT mice (n = 6), 1.0 ± 0.3 in ICER-OE mice (n = 6), and 0.8 ± 0.1 in ICER-KO mice (n = 4). No significant differences were observed in the CREM mRNA levels in ICER-OE and ICER-KO brains. We also assessed CREM and CREB protein levels in the hippocampus of WT, ICER-OE (line II), and ICER-KO mice by Western blotting with anti-CREM and anti-CREB antibodies (Fig. 2E). As shown in the figure, immunoblotting with anti-CREM antibodies detected multiple protein bands corresponding to forms of CREMs, including one representing ICER, with molecular weights ranging from 15 to 75 kDa. Anti-CREB antibodies detected two bands having molecular weights between 32 and 42 kDa. Except for the band corresponding to ICER protein in the ICER-OE samples, no apparent and reproducible increase or decrease of CREM and CREB isoforms was observed. Thus, neither overexpression nor deletion of ICER led to apparent changes in the basal expression of other CREM and CREB family members, which contrasts with the reported effects of the loss of major CREB isoforms (Hummler et al., 1994; Blendy et al., 1996).
General behavioral characterization of ICER mutant mice
In overall appearance, ICER-OE and ICER-KO mice were indistinguishable from their littermates, although line I-23 and II mice were slightly lighter in body weight. ICER mutant mice showed normal reproductive behavior and no anomalous premature mortality. Histological examination of brains from the ICER mutants did not reveal any obvious morphological abnormalities at the light-microscopic level.
An overview of the results of general behavioral characterization of ICER mutant mice is presented in Table 1. ICER mutant mice, both ICER-OE mice and ICER-KO mice, did not show major differences in their general behavioral profile compared with control animals. Briefly, ICER-I-15 mice showed decreased activity during the dark phase of the light cycle, spent more time in the center of the open field during testing in both low and bright lighting conditions, had shorter fall latency in the hanging wire test, and had a tendency to travel shorter distances in the light/dark transition test. No significant changes in other characteristics were observed. The only behavioral differences were ICER-I-23 mice had a tendency to ride the rotarod for shorter times during the first two trials, ICER-II mice were less active in the brightly lit open field and showed weaker startle responses, and ICER-KO mice avoided the bright compartment in the light/dark transition test. All other tests did not reveal any significant differences between the ICER mutant mice and controls. Although each behavior requires additional investigation, overall, the results of the behavioral battery confirmed the absence of any profound deficits in hearing, eyesight, locomotor activity, or emotional domains in the ICER mutant mice that would constrain additional cognitive assessment.
Table 1.
Summary of the general behaviors of ICER mutant mice
| Task/index | Mouse lines |
||||
|---|---|---|---|---|---|
| ICER-OE |
ICER-KO | ||||
| I-15 | I-23 | II | |||
| Home-cage activity | |||||
| Activity value (unitb) | |||||
| Light phase | Control | 5468 ± 398 | 5012 ± 598 | 4621 ± 277 | 5595 ± 321 |
| Mutant | 4505 ± 385 | 4191 ± 346 | 4582 ± 657 | 5458 ± 565 | |
| Dark phase | Control | 27970 ± 1761 | 22350 ± 1976 | 22782 ± 1436 | 19335 ± 1117 |
| Mutant | 22754 ± 1425* | 23176 ± 1535 | 22744 ± 2057 | 21239 ± 1867 | |
| Open field (low light) | |||||
| Total distance (cm) | Control | 6002 ± 252 | 5196 ± 261 | 5775 ± 293 | 6564 ± 454 |
| Mutant | 5689 ± 230 | 4883 ± 248 | 5551 ± 289 | 5694 ± 213 | |
| Time in center (%) | Control | 10.45 ± 1.06 | 6.72 ± 1.12 | 11.20 ± 1.64 | 9.42 ± 0.53 |
| Mutant | 14.10 ± 1.35* | 8.27 ± 0.92 | 11.58 ± 1.05 | 11.23 ± 1.14 | |
| Open field (bright light) | |||||
| Total distance (cm) | Control | 4436 ± 279 | 4053 ± 298 | 5126 ± 360 | 5173 ± 378 |
| Mutant | 4300 ± 193 | 3918 ± 202 | 4096 ± 225* | 4368 ± 243 | |
| Time in center (%) | Control | 5.28 ± 0.63 | 5.30 ± 0.85 | 6.73 ± 1.21 | 5.60 ± 0.71 |
| Mutant | 7.73 ± 0.70* | 4.37 ± 0.37 | 7.54 ± 0.70 | 6.02 ± 0.87 | |
| Light/dark transition | |||||
| Latency to enter light compartment (s) | Control | 42.4 ± 9.2 | 80.9 ± 21.9 | 57.3 ± 8.6 | 57.9 ± 10.1 |
| Mutant | 34.1 ± 4.8 | 92.3 ± 25.1 | 102.6 ± 28.1 | 136.9 ± 23.8** | |
| Distance traveled (cm) | |||||
| Light compartment | Control | 1083.9 ± 99.7 | 765.3 ± 68.0 | 828.6 ± 50.0 | 805.1 ± 79.9 |
| Mutant | 965.1 ± 82.9a | 687.4 ± 85.0 | 688.6 ± 74.0 | 545.7 ± 48.6 | |
| Dark compartment | Control | 1973.2 ± 94.3 | 1810.3 ± 115.4 | 1816.2 ± 97.9 | 1920.3 ± 152.3 |
| Mutant | 1736.5 ± 72.9a | 1695.6 ± 68.2 | 1758.2 ± 83.2 | 1897.3 ± 119.0 | |
| Elevated plus maze | |||||
| Time in open arms (%) | Control | 17.50 ± 1.96 | 8.95 ± 1.24 | 15.81 ± 2.54 | 13.81 ± 1.92 |
| Mutant | 20.40 ± 2.08 | 7.24 ± 1.96 | 12.28 ± 1.70 | 16.67 ± 3.18 | |
| Total entries (#) | Control | 20.59 ± 1.80 | 41.50 ± 2.42 | 47.75 ± 3.49 | 49.83 ± 2.55 |
| Mutant | 21.35 ± 2.54 | 41.58 ± 3.94 | 44.00 ± 2.73 | 46.00 ± 2.58 | |
| Startle | |||||
| Startle value (unitc) | Control | 2.93 ± 0.41 | 2.68 ± 0.52 | 3.21 ± 0.46 | 2.85 ± 0.35 |
| Mutant | 2.40 ± 0.37 | 2.15 ± 0.39 | 1.35 ± 0.24** | 3.71 ± 0.33 | |
| Prepulse inhibition | |||||
| Inhibition (%) | |||||
| 74 dB | Control | 48.5 ± 4.2 | 49.3 ± 5.8 | 27.4 ± 6.4 | 24.3 ± 6.1 |
| Mutant | 48.2 ± 4.5 | 48.3 ± 4.7 | 33.0 ± 7.1 | 24.9 ± 4.4 | |
| 78 dB | Control | 52.1 ± 4.5 | 52.1 ± 7.0 | 38.8 ± 6.7 | 34.9 ± 4.6 |
| Mutant | 54.8 ± 5.0 | 55.7 ± 6.0 | 39.2 ± 8.9 | 37.2 ± 4.4 | |
| 82 dB | Control | 60.8 ± 4.7 | 58.6 ± 6.0 | 43.3 ± 5.8 | 39.3 ± 5.4 |
| Mutant | 64.9 ± 4.2 | 60.7 ± 6.8 | 51.6 ± 5.0 | 46.0 ± 4.5 | |
| Rotarod | |||||
| Latency to fall (s) | |||||
| Trial 1 | Control | 70.0 ± 13.5 | 75.1 ± 7.7 | 61.8 ± 14.8 | 44.3 ± 9.8 |
| Mutant | 42.9 ± 10.1 | 42.2 ± 9.9a | 62.0 ± 11.4 | 74.0 ± 16.0 | |
| Trial 2 | Control | 87.0 ± 13.7 | 97.1 ± 10.4 | 86.8 ± 14.1 | 90.0 ± 13.4 |
| Mutant | 79.6 ± 12.8 | 63.6 ± 10.9a | 82.6 ± 11.7 | 109.3 ± 15.2 | |
| Trial 3 | Control | 136.6 ± 9.8 | 117.8 ± 7.2 | 124.1 ± 15.3 | 138.8 ± 7.3 |
| Mutant | 104.8 ± 13.9 | 105.1 ± 11.0a | 87.7 ± 15.0 | 135.9 ± 17.7 | |
| Trial 4 | Control | 154.3 ± 9.7 | 119.1 ± 12.2 | 138.3 ± 10.4 | 146.6 ± 8.0 |
| Mutant | 120.3 ± 14.6 | 108.3 ± 14.0a | 106.5 ± 8.7 | 150.3 ± 13.9 | |
| Hanging wire test | |||||
| Latency to fall (s) | Control | 272.9 ± 10.1 | 190.6 ± 23.8 | 194.0 ± 25.6 | 249.6 ± 24.7 |
| Mutant | 168.9 ± 19.0*** | 192.9 ± 23.9 | 135.0 ± 17.8 | 247.9 ± 23.0 | |
| Hot plate test | |||||
| Latency to paw lick (s) | Control | 6.18 ± 0.34 | 8.38 ± 0.75 | 7.00 ± 0.55 | 7.08 ± 0.43 |
| Mutant | 6.78 ± 0.38 | 7.66 ± 0.47 | 6.03 ± 0.38 | 7.43 ± 0.33 | |
| Body weight (g) | Control | 25.0 ± 0.4 | 27.8 ± 0.4 | 27.1 ± 0.3 | 25.6 ± 0.5 |
| Mutant | 25.2 ± 0.5 | 25.9 ± 0.4** | 24.1 ± 0.2*** | 25.5 ± 0.6 | |
Data are presented as mean ± SEM. Behavioral tests were performed as described in Materials and Methods. n = 12 for each group of animals used in all experiments (in the light/dark transition test, three data sets were lost because of a technical problem).
*p < 0.05;
**p < 0.01;
***p < 0.001.
aMain effect of genotype, marginal significance (0.05 < p < 0.06).
b,cFor detailed unit explanation, see Materials and Methods.
For additional in-depth behavioral analysis, only lines with the minimum and maximum ICER-OE levels were studied (I-15 and II, respectively), alongside the ICER-KO line.
Long-term retention of conditioned fear is altered in ICER mutant mice
After fear conditioning and after the retention test, we observed increased ICER mRNAs in the amygdala of C57BL/6J mice (supplemental Fig. 1A, available at www.jneurosci.org as supplemental material). This prompted us to examine the emotional memory in ICER mutant mice. Before fear conditioning, we first assessed the sensitivity of each mouse line to foot shock. The threshold currents for evoking behavioral signs, paw flick and vocalization, in different groups are presented in Table 2. Although there was no difference between I-15, KO, and corresponding control mice in the current intensities observed to induce each behavioral response, the thresholds for both paw flick and vocalization were significantly higher in ICER-II mice compared with those in non-TG littermates (for flick, t(21) = 2.98, p < 0.01; for vocalization, t(21) = 3.25, p < 0.01), suggesting that a >400-fold overexpression of ICER-II might alter sensitivity to foot shock. Therefore, we used a 0.3 mA foot shock for fear conditioning; this current level sufficiently induced vocalization and/or a jump reaction in all mice, including ICER-II mice.
Table 2.
Shock sensitivity in ICER mutant mice
| Mice | Threshold current (mA) |
|
|---|---|---|
| Paw flick | Vocalization | |
| ICER-I-15 | ||
| Non-TG (6) | 0.03 ± 0.00 | 0.08 ± 0.01 |
| TG (4) | 0.03 ± 0.01 | 0.07 ± 0.00 |
| ICER-II | ||
| Non-TG (12) | 0.04 ± 0.01 | 0.06 ± 0.01 |
| TG (11) | 0.06 ± 0.01* | 0.20 ± 0.04* |
| ICER-KO | ||
| WT (8) | 0.03 ± 0.00 | 0.07 ± 0.01 |
| KO (8) | 0.03 ± 0.00 | 0.07 ± 0.01 |
Shock sensitivity was measured in terms of threshold current, as described in Materials and Methods. The number of mice per group is indicated in parentheses. Values shown are averages ± SEM.
*p < 0.01.
After conditioning with two pairs of tone and foot shock, the mice were sequentially tested for short-term (1 h) and long-term (24 h) tone-dependent fear memory, followed by long-term context-dependent fear memory (48 h). There was no significant difference between ICER-OE lines and corresponding non-TG mice in conditioned freezing to the tone 1 h after conditioning (Fig. 3A,B). A two-way ANOVA (genotype and tone presentation) confirmed the absence of a significant effect of genotype (line I-15, F(1,36) = 0.07, p = 0.80; line II, F(1,30) = 0.31, p = 0.58). This result indicates that the short-term memory (STM) of tone-dependent, conditioned fear was not affected by the overexpression of ICER. On the other hand, freezing was significantly attenuated in ICER-OE mice when tested 24 h after conditioning. A two-way ANOVA (genotype and tone) revealed a significant effect of genotype (line I-15, F(1,36) = 7.12, p < 0.05; line II, F(1,30) = 5.13, p < 0.05) and a significant interaction between genotype and tone presentation (line I-15, F(1,36) = 9.03, p < 0.01; line II, F(1,30) = 9.66, p < 0.01). Post hoc test confirmed that ICER-OE mice froze significantly less than non-TG mice during tone presentation (line I-15 and line II, p < 0.01). Context-dependent freezing tested 48 h after conditioning was also impaired in ICER-OE mice (line I-15 and line II, p < 0.001). Thus, overexpression of either ICER-I or ICER-II specifically impaired long-term fear memory in both tone-dependent and context-dependent tasks without affecting STM.
Figure 3.

Fear conditioning in ICER-OE mice. A, B, Conditioned freezing to tone and context was measured in lines I-15 (A) and II (B) and was compared with conditioned freezing displayed by non-TG littermates. No difference was observed between non-TG mice and both ICER-OE lines of mice at 1 h after conditioning (1-h tone). However, 24 h (24-h tone) and 48 h (48-h context) after conditioning, tone-dependent and context-dependent freezing, respectively, were significantly attenuated in ICER-OE mice. Data are means ± SEM; number of animals tested are in parentheses. **p < 0.01, ***p < 0.001 compared with non-TG littermates.
Next, we examined conditioned freezing in ICER-KO mice, which, as opposed to ICER-OE mice, express no ICER. We conditioned ICER-KO mice using the same parameters we used for ICER-OE mice: two pairings of a 10 s tone (70 dB) and a 1 s foot shock (0.3 mA) in the conditioning chamber. ICER-KO mice and their WT littermates exhibited a similar level of freezing to the conditioned tone in the 1 h test (two-way ANOVA: genotype, F(1,22) = 0.31, p = 0.58). There was a tendency for greater freezing in ICER-KO mice during both pretone and tone presentation in the long-term tone-dependent fear memory test (24 h), although this tendency did not reach statistical significance (two-way ANOVA: genotype, F(1,22) = 3.93, p = 0.06) (Fig. 4A). ICER-KO mice also showed no apparent difference in context-dependent freezing measured 48 h after conditioning (t(22) = 0.76, p = 0.45).
Figure 4.

Fear conditioning in ICER-KO mice. A, Conditioned freezing to tone and context after subjecting mice to a strong training protocol. KO mice and WT littermates exhibited similar freezing levels during the tone-dependent test performed 1 h (1-h tone) and 24 h (24-h tone) after conditioning and during the context-dependent test performed 48 h after conditioning (48-h context). B, Conditioned freezing to tone and context after subjecting mice to a weak training protocol. We observed no significant differences in conditioned freezing between KO and WT mice 1 h after conditioning (1-h tone). However, KO mice showed increased freezing during both pre-tone and tone presentation at the tone-dependent test performed 24 h after conditioning (24-h tone). Context-dependent freezing in KO mice was also enhanced when tested 48 h after conditioning (48-h context). Data are means ± SEM; number of animals are in parentheses. *p < 0.05, **p < 0.01 compared with WT littermates.
We hypothesized that the training protocol used in the previous experiments might have prevented us from detecting a difference in conditioned fear response between WT and ICER-KO mice because of a ceiling effect. To test this, we conditioned ICER-KO mice using a relatively weak protocol: single pairing of a 3 s tone (70 dB) and a 0.5 s foot shock (0.3 mA). Both ICER-KO and WT mice exhibited the same degree of freezing to the tone measured 1 h after conditioning (two-way ANOVA: genotype, F(1,19) = 0.45, p = 0.51) (Fig. 4B). Moreover, the level of freezing was similar to that observed with the stronger stimuli used previously (Fig. 4A), demonstrating that this weaker shock protocol is sufficient to produce short-term fear memory. However, in the long-term tone-dependent fear memory test (24 h), ICER-KO mice demonstrated significantly greater freezing before and during tone presentation (Fig. 4B). A two-way ANOVA revealed a significant effect of genotype (F(1,19) = 8.20, p < 0.01) but no significant interaction between genotype and tone presentation (F(1,19) = 2.27, p = 0.15). ICER-KO mice also demonstrated significantly greater freezing in the long-term, context-dependent memory test 48 h after conditioning (t(19) = 3.01, p < 0.01). Together, these results suggest that weak conditioning in ICER-KO mice produced greater long-term conditioned fear memory than in WT mice.
Odor discrimination memory is not affected in ICER mutant mice
The findings of Green et al. (2006) highlighted the involvement of CREB/ICER interactions in the regulation of reward learning and addiction in the nucleus accumbens. To examine whether ICER is critical for learning and memory in a domain unrelated to fear, ICER mutant mice were tested on an odor discrimination task, another classical conditioning paradigm using odors as CS and glucose-containing water as US. On test day, mice were given a choice between two bottles: one contained odorized water that was previous paired with glucose, and the other contained odorized water never paired with glucose. Table 3 lists the ratios of consumption of odorized glucose-containing water to total liquid consumption during 30 min of the third training session, and the ratios of consumption of the odorized water consumption previously paired with glucose to total water consumption during the test. During training, all mice consistently preferred to drink glucose-containing water, regardless of the type of odor (vanilla or almond). During the test conducted 4 d after training, all mice preferred to drink the odorized water that was previously paired with glucose. There was no significant difference in glucose preference and in odor discrimination memory between ICER mutant and control mice. A two-way ANOVA (genotype and test) showed no significant effect of genotype in each line (I-15, F(1,22) = 0.59, p = 0.45; II, F(1,22) = 0.31, p = 0.58; KO, F(1,28) = 0.30, p = 0.59). Thus, neither overexpression nor deletion of ICER affects odor memory. This indicates that ICER does not necessarily play a role in all types of memory.
Table 3.
Odor discrimination test in ICER mutant mice
| Mice | Ratio of water consumption |
|
|---|---|---|
| Training | Test | |
| ICER-I-15 | ||
| Non-TG (12) | 0.87 ± 0.04 | 0.82 ± 0.06 |
| TG (12) | 0.84 ± 0.04 | 0.74 ± 0.06 |
| ICER-II | ||
| Non-TG (19) | 0.72 ± 0.05 | 0.89 ± 0.02 |
| TG (13) | 0.82 ± 0.07 | 0.84 ± 0.03 |
| ICER-KO | ||
| WT (12) | 0.78 ± 0.03 | 0.75 ± 0.07 |
| KO (12) | 0.76 ± 0.06 | 0.84 ± 0.04 |
Odor discrimination test was performed as described in Materials and Methods. Training, The ratio of consumption of glucose-containing odorized water versus total water consumption during the last training session. Test, The ratio of consumption of odorized water that previously contained glucose versus total water consumption during test. Values are averages ± SEM. The number of mice per group is indicated in parentheses.
Kindling development is altered in ICER mutant mice, but basal seizure activity is unchanged
Kindling (Goddard, 1967) represents another form of long-lasting neuronal plasticity that shares some features with memory and is considered to be a model of epileptogenesis (Cain, 1989; Bading, 1999; McIntyre et al., 2002; Morimoto et al., 2004; Albensi et al., 2007). We observed a transient increase in ICER mRNAs in the brain of C57BL/6J mice after kindling stimulation (supplemental Fig. 1B,C, available at www.jneurosci.org as supplemental material). Similarly, an increase in ICER mRNAs was found in the hippocampus, as well as other brain regions in response to seizures evoked by electroconvulsive shock (Rydelek-Fitzgerald et al., 1996), kainite (Konopka et al., 1998), and pilocarpine (Porter et al., 2008). To study the relationship between ICER upregulation and downregulation and epileptogenesis, we examined kindling development in ICER-OE mice (lines I-15 and II) and ICER-KO mice. Electrical stimuli were applied to the left amygdala once a day, and stimulus-induced ADs and behavioral responses were monitored. Brief and transient ADs were evoked by the first stimulation in most of the animals examined (First stimulation in Table 4). At the same time, the majority of mice (I-15, 90.0%; II, 88.9%; KO, 87.5%) did not show a convulsive response after the initial stimulation. There was no statistical difference in the duration of ADs between each ICER mutant mouse line and its corresponding control (I-15, t(20) = 0.62, p = 0.54; II, t(27) = 0.42, p = 0.68; KO, t(37) = 0.55, p = 0.59). Thus, neither overexpression nor deletion of ICER affected basal neuronal excitability to electrical stimulation of the amygdala.
Table 4.
Afterdischarge duration during kindling in ICER mutant mice
| Mice | First stimulation (s) | Convulsive stage |
||
|---|---|---|---|---|
| Stage 1 (s) | Stage 3 (s) | Fully kindled (s) | ||
| ICER-I-15 | ||||
| Non-TG (12) | 9.5 ± 2.7 | 16.4 ± 2.7 | 19.8 ± 2.2 | 23.4 ± 1.4 |
| TG (10) | 7.7 ± 1.5 | 11.5 ± 2.8 | 20.3 ± 1.4 | 28.5 ± 3.4 |
| ICER-II | ||||
| Non-TG (11) | 13.3 ± 1.4 | 16.0 ± 0.5 | 22.1 ± 2.2 | 22.6 ± 1.4 |
| TG (18) | 14.2 ± 1.5 | 13.8 ± 1.7 | 20.4 ± 1.0 | 26.3 ± 2.4 |
| ICER-KO | ||||
| WT (23) | 13.5 ± 1.4 | 14.0 ± 1.0 | 22.0 ± 1.2 | 25.7 ± 1.8 |
| KO (16) | 12.4 ± 1.7 | 15.3 ± 1.7 | 18.6 ± 1.6 | 25.5 ± 2.9 |
Duration of ADs was measured as described in Materials and Methods. Convulsive stage was determined according to the descriptions of Racine (1972) (see also Materials and Methods). AD values shown are averages ± SEM. Number of mice per group is indicated in parentheses.
Both the convulsive stage and the duration of ADs gradually progressed in all the groups of mice over 15–20 d. AD duration in each stage, days required to reach each stage, and percentage induction of the fully kindled state in each line are summarized in Table 4 and Figure 5. Whereas the number of days required to reach stage 1 was not different between ICER-OE and corresponding non-TG mice, ICER-OE mice took longer to develop more profound seizures (Fig. 5A,B). Statistical analysis (t tests) conducted on the data of each convulsive stage showed significant differences between ICER-OE and non-TG mice (ICER I-15: stage 2, p < 0.01; stages 3–4, p < 0.001; stage 5, p < 0.05; ICER II: stages 3–5 and fully kindled, p < 0.001). Moreover, in contrast to the majority of non-TG mice, only a portion of ICER-OE mice reached the fully kindled state within the 20 d stimulation period (Fig. 5D). Significant differences were also observed in the percentage induction of fully kindled state between ICER-OE and non-TG mice (ICER I-15: χ2(1) = 7.10, p < 0.01; ICER II: χ2(1) = 6.97, p < 0.01). Thus, overexpression of ICER (either ICER-I or ICER-II) profoundly attenuates kindling development.
Figure 5.
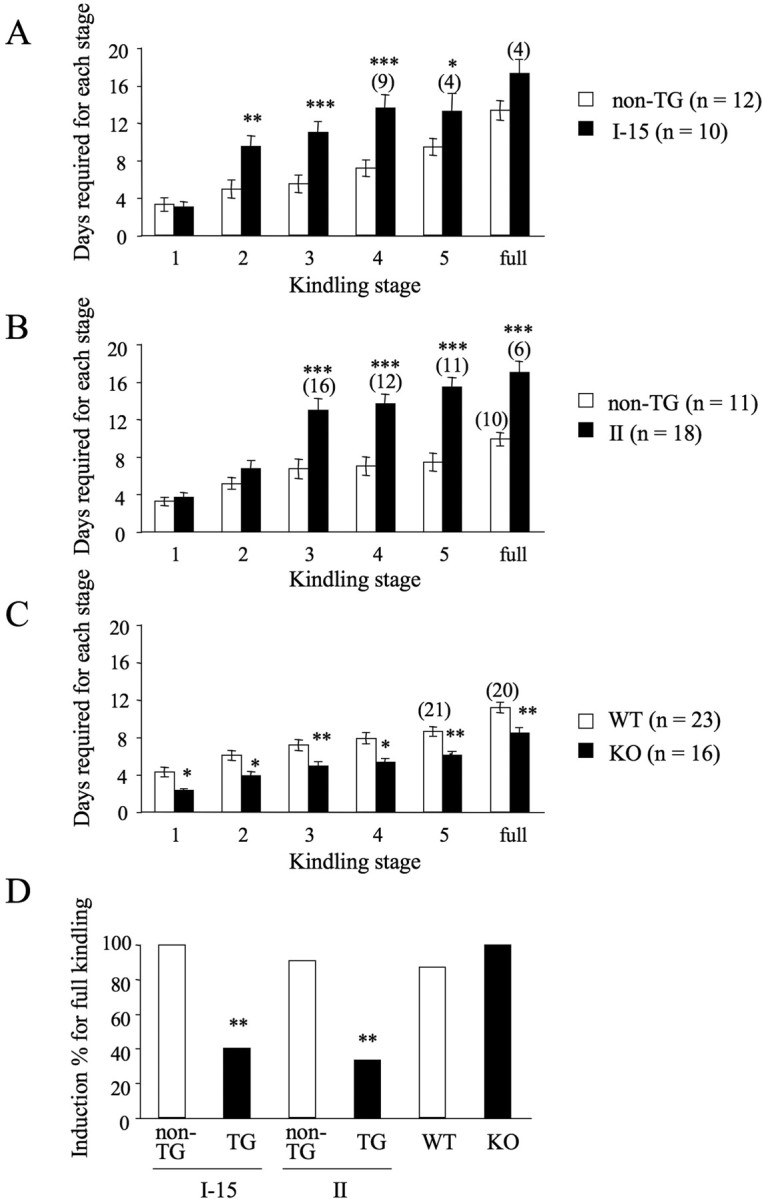
Amygdala kindling in ICER-OE and ICER-KO mice. Days required to reach each convulsive stage. A–C, Mice were defined as fully kindled (“full”) when they had stage 5 or severer convulsions on 3 consecutive days: ICER-OE mice I-15 (A), II (B), and ICER-KO mice (C). Development of kindling was retarded in ICER-OE mice (lines I-15 and II). In contrast, ICER-KO mice showed accelerated kindling. Data are means ± SEM. Numbers in parentheses (n = x), Total mice number per group; (x), number of mice that reached a particular convulsive stage in case the number is fewer than the total mice number per group. D, Percentage induction of fully generalized kindling in ICER-OE and ICER-KO mice. Only some ICER-OE mice reached a fully kindled state, in contrast to the majority of nonmutant controls and ICER-KO mice. *p < 0.05, **p < 0.01, ***p < 0.001 compared with nonmutant littermates.
In stark contrast to attenuation of kindling in ICER-OE mice, ICER-KO mice required less stimulation to reach each convulsive stage compared with their WT littermates, starting from stage 1 (Fig. 5C). Statistical analysis with t tests revealed that there were significant differences between ICER-KO and WT mice (stages 1–2, p < 0.05; stages 3–4 and fully kindled, p < 0.01; stage 5, p < 0.001). Moreover, 100% of the KO mice reached the fully kindled state within the 15 d stimulation period, whereas some 13% of the WT mice did not (Fig. 5D), although this difference did not reach significance. ICER-KO data show that the lack of ICER significantly accelerated kindling development. Together, data from ICER-OE and ICER-KO mice strongly support the idea that ICER is an important negative regulator of kindling development.
Discussion
To investigate the role of ICER, an inducible isoform of CREM transcription factors, in neuronal plasticity and memory, we generated two types of ICER mutant mice: (1) ICER-OE mice, which overexpress ICER in the adult forebrain; and (2) ICER-KO mice, which specifically lack ICER transcripts. ICER-OE mice specifically displayed impaired long-term fear memory, leaving STM intact, and retarded kindling development. In contrast, ICER-KO mice demonstrated enhanced conditioned fear during LTM tests after undergoing a weak conditioning protocol and accelerated kindling.
No compensatory changes of CREM/CREB members in ICER mutant mice
Immunoblot analysis of hippocampal proteins showed that both ICER-OE mice and ICER-KO mice displayed CREM- and CREB-positive signals comparable with those of WT mice (Fig. 2E). Thus, although the compensatory changes (upregulation and downregulation) of other CREB and CREM isoforms have been observed after manipulating CREB levels (Hummler et al., 1994; Blendy et al., 1996; Sakai et al., 2002), a similar compensation did not occur after ICER manipulation. As opposed to the levels of constitutively expressed CREB and other CREM isoforms, basal levels of ICER isoforms are generally low (Stehle et al., 1993; Sassone-Corsi, 1998; Kell et al., 2004). Therefore, it is plausible that the deletion of the ICER gene would not cause the same extent of compensation as that after the manipulation of constitutively expressed major isoforms. Moreover, use of the CaMKIIα promoter to achieve restricted overexpression in mature forebrain neurons (Mayford et al., 1996; Kojima et al., 1997) may prevent developmental compensation or drastic developmental phenotypes in ICER-OE mice.
Both ICER-OE and ICER-KO mice did not show apparent gross morphological brain abnormalities. Although viral-driven overexpression of ICER induces apoptosis in cultured neurons (Jaworski et al., 2003; Mioduszewska et al., 2007), abnormal apoptotic cells were not detected in our ICER-OE brains using the terminal deoxynucleotidyl transferase-mediated dUTP nick end labeling assay (data not shown). The absence of major differences in the general behavior among ICER mutant mice (Table 1) probably stems from the inducible character of ICER and the restriction of its overexpression to the adult forebrain. Virus-mediated overexpression of ICER-IIγ in rat nucleus accumbens causes a mild decrease in locomotor activity and an anxiogenic-like behavior (Green et al., 2006). However, it is difficult to directly compare these results with our results because of differences in the animal species used, methods used, and regional specificity of overexpression.
Negative regulation of long-term fear memory by ICER
Although profound deficits were essentially absent in basic behavioral parameters, ICER mutant mice did exhibit altered fear memory (Figs. 3, 4). This alteration (at least for the tone-dependent memory) was specific to LTM, because the STM test conducted 1 h after conditioning did not show any changes. Both ICER-OE lines of mice (I-15 and II) consistently exhibited lower levels of freezing in tone- and context-dependent LTM tests, although the altered threshold of foot-shock sensitivity in line II, overexpressing ∼400-fold ICER than WT, complicates interpretation of the results of this line. Impairment of long-term fear memory in ICER-OE mice resembles that of CREB mutant mice (Bourtchuladze et al., 1994; Kogan et al., 1997; Kida et al., 2002) and is consistent with the role of ICER as an endogenous CREB antagonist. Moreover, because the disruption of the CREB gene leads to the significant upregulation of CREM isoforms, ICER in particular (Hummler et al., 1994), our results raise a possibility that behavioral phenotypes of CREB-KO mice may, in part, be a result of the increase in ICER rather than solely the lack of CREB. Importantly, the phenotype of ICER-KO mice is opposite to that of ICER-OE mice. Under the weaker conditioning protocol, ICER-KO mice froze more during long-term tone-dependent and context-dependent tests (Fig. 4). These results suggest that fear memory was enhanced in ICER-KO mice. During the long-term tone-dependent test, these mice froze more both during tone presentation and also during the 60 s period in the new chamber preceding the tone. This increase in freezing may be a reflection of an enhanced degree of generalization between experimental procedures in ICER-KO mice, which occurred despite our efforts to distinguish experimental contexts between the conditioning and the tone-dependent test. Although we tried to distinguish the test context by using a different chamber and by changing other conditions (for details, see Materials and Methods), ICER-KO mice may be still generalizing these situations as a result of similar features, handling, transportation from the home cage to the chamber, and other uncontrollable experimental environments. The previous exposure to the fear-related tone cue in this new chamber in the course of the 1 h tone test may have further contributed to this reaction. The alternative possibility of the contribution of generalized fearfulness in conditioned ICER-KO mice cannot be completely excluded. The similar scenario has been shown previously in Aplysia and in rats. In Aplysia, the blockade of CREB2 repressor allows long-term facilitation after a single pulse of serotonin is delivered, which normally leads only to short-term facilitation (Bartsch et al., 1995). In rats, viral-driven overexpression of CREB promotes the formation of long-term fear memory after a massed training protocol, which normally leads to no or weak LTM (Josselyn et al., 2001). Upregulation of ICER in the amygdala, a brain area crucial for fear conditioning (Paré et al., 2004; LeDoux, 2007), after training and after CS presentation in conditioned animals (supplemental Fig. 1A, available at www.jneurosci.org as supplemental material) may act to limit the consolidation of fear memory. Balance of CREB/ICER function may be a crucial determinant for LTM formation. Aggravation of age-dependent memory decline in ICER-transfected rats was proposed to be a result of additional exaggeration of an imbalance in CREB/ICER regulation that occurs with aging (Mouravlev et al., 2006). In contrast to fear memory, we demonstrated that both ICER-OE and ICER-KO animals did not differ from controls in odor discrimination task (Table 3), indicating that ICER is not necessarily involved in all types of memory. Additional examination of other types of memory is necessary to reveal a broader picture for the CREB/ICER-related memory system of the brain. Using conventional ICER mutant mice, we cannot exactly determine whether the memory phenotype of the ICER mutant mice is caused by the alteration in the acquisition process or in the extinction process. To distinguish these two possibilities, future study using the inducible transgenic and conditional KO approaches should be required.
Negative regulation of kindling epileptogenesis by ICER
Besides memory, another form of long-lasting plasticity in the brain takes place in the course of kindling (Goddard, 1967). Kindling development, similarly to LTM formation, depends on de novo protein synthesis (Cain et al., 1980). CRE DNA-binding activity of CREB is transiently upregulated in the hippocampus after kindling stimulation (Kashihara et al., 2000). Because the ICER promoter contains CRE-like elements, it is plausible that it may be activated during and play a role in kindling development. In fact, we observed ICER mRNA to be upregulated in the brain of C57BL/6J mice after electrical kindling stimulation (supplemental Fig. 1B,C, available at www.jneurosci.org as supplemental material). Manipulations of ICER levels did not affect basal seizure activity (First stimulation in Table 4). However, additional daily stimulation caused bidirectional changes in kindling development in ICER mutant mice, with the development of kindling being significantly attenuated in ICER-OE mice and accelerated in ICER-KO mice (Table 4, Fig. 5). These results strongly suggest that ICER plays significant roles in this type of neuronal plasticity. This is further supported by recent findings that CREM/ICER null mutant mice have higher frequency of spontaneous seizures after pilocarpine-induced status epilepticus (Porter et al., 2008). The increased ICER levels in ICER-OE mice may retard kindling by attenuating and “localizing” hyperexcitation, which results as a consequence of day-to-day restriction of excessive gene transcription during kindling. Conversely, in ICER-KO mice, the absence of ICER releases endogenous suppression of CRE-dependent gene expression, thereby making these mice more prone to seizure development.
ICER as a CRE-mediated gene transcription repressor in neuronal plasticity and fear memory
Several studies using different types of stimulation including kindling stimulation (supplemental Fig. 1B–D, available at www.jneurosci.org as supplemental material) have demonstrated that upregulation of ICER lasts longer than upregulation of other immediate early genes, such as c-fos (Luckman and Cox, 1995; Konopka et al., 1998; Bisler et al., 2002). After being induced by stimuli, ICER has been proposed to reach certain concentrations in the nucleus, suppressing gene transcription and eventually switching off the CRE-mediated gene transcription initiated by incoming stimuli, including those that are related to learning (Fig. 6) (Sassone-Corsi, 1995; Mayr and Montminy, 2001; Stehle et al., 2001; Bisler et al., 2002; Mioduszewska et al., 2003). This hypothesis is supported by the observations that ICER attenuates c-fos expression in cultured cells (Monaco and Sassone-Corsi, 1997; Misund et al., 2007), that increased ICER expression after nociception injection coincides with decreased c-Fos expression (Gottlieb et al., 2007), and that kindling stimulus-induced c-Fos expression was attenuated by overexpression of ICER in vivo (supplemental Fig. 2, available at www.jneurosci.org as supplemental material). Besides affecting c-fos, ICER can potentially affect the expression of numerous CRE-containing genes, for example, genes that encode transcription factors (JunD, Krox-20, Krox-24), genes that encode neurotransmitter-related proteins (somatostatin, galanin, enkephalin, calcitonin gene-related peptide, vasoactive intestinal peptide, CRF, β-adrenergic receptor, inducible nitric oxide synthase) and genes that encode growth factors (insulin, brain-derived neurotrophic factor), all the products of which are involved in neuronal plasticity (Mayr and Montminy, 2001). Recent study has demonstrated that ICER downregulates the expression of α1 subunit of GABAA receptor (Hu et al., 2008). This may give a clue on the physiological role of inhibitory neurotransmission in fear memory (Paré et al., 2004).
Figure 6.

Simplified schematic diagram of the hypothetical involvement of ICER in the transcription of CRE-containing genes. Other CREMs are omitted for simplification. In WT mice, CREB is phosphorylated by protein kinases activated through neuronal excitation, and then phosphorylated CREB activates CRE-containing gene transcription. Dephosphorylation of CREB by protein phosphatase inactivates CREB activity and stops gene transcription. Suppression of activated gene transcription is also achieved by ICER. Phosphorylated CREB binds to the P2 promoter of the CREM/ICER gene and induces ICER expression. ICER is a transcription repressor that suppresses CRE-dependent activation of gene expression, as well as ICER expression itself, by forming an ICER homodimer and/or an ICER-CREB heterodimer. In ICER-OE mice, suppression of CRE-mediated gene transcription (as well as ICER gene expression) is enhanced by an excess amount of ICER. In ICER-KO mice, lack of ICER causes prolonged activation of CRE-mediated gene transcription that results from the loss of an ICER-mediated suppression mechanism. Accumulated gene products resulted from the transcription–translation of the gene are indicated as filled squares. P, Phosphate group; P2, intronic promoter of the CREM/ICER gene.
In conclusion, we found that the overexpression of ICER impairs long-term fear memory and kindling, whereas the deletion of the ICER gene facilitates both. Our results provide strong evidence that ICER acts as a negative regulator of the long-term neuronal plasticity underlying LTM and kindling, possibly through suppression of plasticity-related gene expression. By this way, ICER may play both negative and positive roles, respectively, in attenuating memory formation especially after weak learning and in preventing excessive plasticity, leading to exaggerated fear memories or epileptogenesis. These findings make ICER a promising bidirectional agent to study, with regard to its relationship to memory disorders and pathological epileptogenesis. Additional studies will reveal the contribution of ICER to different types of long-term neuronal plasticity as well as reveal the detailed mechanisms behind this contribution. Additionally, the systematic screening of mRNA species with altered expression profiles in ICER mutant mice might help us to identify the downstream components of CRE-mediated gene transcription in vivo.
Footnotes
This work was supported in part by research grants from the Ministry of Education, Culture, Sports, Science, and Technology of Japan. We thank Mitsuhiro Kimura, Masayuki Inada, Naomi Yamazaki-Mihira, Nobuko Kume, Michiko Arai, and Masako Suzuki for technical assistance. MS12 cells were a generous gift from the Meiji Dairies Corporation.
References
- Abel T, Martin KC, Bartsch D, Kandel ER. Memory suppressor genes: inhibitory constraints on the storage of long-term memory. Science. 1998;279:338–341. doi: 10.1126/science.279.5349.338. [DOI] [PubMed] [Google Scholar]
- Ahmed T, Frey JU. Plasticity-specific phosphorylation of CaMKII, MAP-kinases and CREB during late-LTP in rat hippocampal slices in vitro. Neuropharmacology. 2005;49:477–492. doi: 10.1016/j.neuropharm.2005.04.018. [DOI] [PubMed] [Google Scholar]
- Albensi BC, Oliver DR, Toupin J, Odero G. Electrical stimulation protocols for hippocampal synaptic plasticity and neuronal hyper-excitability: are they effective or relevant? Exp Neurol. 2007;204:1–13. doi: 10.1016/j.expneurol.2006.12.009. [DOI] [PubMed] [Google Scholar]
- Bading H. Nuclear calcium-activated gene expression: possible roles in neuronal plasticity and epileptogenesis. Epilepsy Res. 1999;36:225–231. doi: 10.1016/s0920-1211(99)00053-4. [DOI] [PubMed] [Google Scholar]
- Balschun D, Wolfer DP, Gass P, Mantamadiotis T, Welzl H, Schütz G, Frey JU, Lipp H-P. Does cAMP responsive element-binding protein have a pivotal role in hippocampal synaptic plasticity and hippocampus-dependent memory? J Neurosci. 2003;23:6304–6314. doi: 10.1523/JNEUROSCI.23-15-06304.2003. [DOI] [PMC free article] [PubMed] [Google Scholar]
- Barco A, Alarcon JM, Kandel ER. Expression of constitutively active CREB protein facilitates the late phase of long-term potentiation by enhancing synaptic capture. Cell. 2002;108:689–703. doi: 10.1016/s0092-8674(02)00657-8. [DOI] [PubMed] [Google Scholar]
- Bartsch D, Ghirardi M, Skehel PA, Karl KA, Herder SP, Chen M, Bailey CH, Kandel ER. Aplysia CREB2 represses long-term facilitation: relief of repression converts transient facilitation into long-term functional and structural change. Cell. 1995;83:979–992. doi: 10.1016/0092-8674(95)90213-9. [DOI] [PubMed] [Google Scholar]
- Bartsch D, Casadio A, Karl KA, Sarodio P, Kandel ER. CREB1 encodes a nuclear activator, a repressor, and a cytoplasmic modulator that form a regulatory unit critical for long-term facilitation. Cell. 1998;95:211–223. doi: 10.1016/s0092-8674(00)81752-3. [DOI] [PubMed] [Google Scholar]
- Binder EB, Kinkead B, Owens MJ, Kilts CD, Nemeroff CB. Enhanced neurotensin neurotransmission is involved in the clinically relevant behavioral effects of antipsychotic drugs: evidence from animal models of sensorimotor gating. J Neurosci. 2001;21:601–608. doi: 10.1523/JNEUROSCI.21-02-00601.2001. [DOI] [PMC free article] [PubMed] [Google Scholar]
- Bisler S, Schleicher A, Gass P, Stehle JH, Zilles K, Staiger JF. Expression of c-Fos, ICER, Krox-24 and JunB in the whisker-to-barrel pathway of rats: time course of induction upon whisker stimulation by tactile exploration of an enriched environment. J Chem Neuroanat. 2002;23:187–198. doi: 10.1016/s0891-0618(01)00155-7. [DOI] [PubMed] [Google Scholar]
- Blendy JA, Kaestner KH, Schmid W, Gass P, Schütz G. Targeting of the CREB gene leads to up-regulation of a novel CREB mRNA isoform. EMBO J. 1996;15:1098–1106. [PMC free article] [PubMed] [Google Scholar]
- Bourtchuladze R, Frenguelli B, Blendy J, Cioffi D, Schütz G, Silva AJ. Deficient long-term memory in mice with a targeted mutation of the cAMP-responsive element binding protein. Cell. 1994;79:59–68. doi: 10.1016/0092-8674(94)90400-6. [DOI] [PubMed] [Google Scholar]
- Cain DP. Long-term potentiation and kindling: how similar are the mechanisms? Trends Neurosci. 1989;12:6–10. doi: 10.1016/0166-2236(89)90146-x. [DOI] [PubMed] [Google Scholar]
- Cain DP, Corcoran ME, Staines WA. Effects of protein synthesis inhibition on kindling in the mouse. Exp Neurol. 1980;68:409–419. doi: 10.1016/0014-4886(80)90097-7. [DOI] [PubMed] [Google Scholar]
- Carlezon WA, Jr, Duman RS, Nestler EJ. The many faces of CREB. Trends Neurosci. 2005;28:436–445. doi: 10.1016/j.tins.2005.06.005. [DOI] [PubMed] [Google Scholar]
- Chen A, Muzzio IA, Malleret G, Bartsch D, Verbitsky M, Pavlidis P, Yonan AL, Vronskaya S, Grody MB, Cepeda I, Gilliam TC, Kandel ER. Inducible enhancement of memory storage and synaptic plasticity in transgenic mice expressing an inhibitor of ATF4 (CREB-2) and C/EBP proteins. Neuron. 2003;39:655–669. doi: 10.1016/s0896-6273(03)00501-4. [DOI] [PubMed] [Google Scholar]
- Foulkes NS, Sassone-Corsi P. Transcription factors coupled to the cAMP-signalling pathway. Biochim Biophys Acta. 1996;1288:F101–F121. doi: 10.1016/s0304-419x(96)00025-x. [DOI] [PubMed] [Google Scholar]
- Gass P, Wolfer DP, Balschun D, Rudolph D, Frey U, Lipp H-P, Schütz G. Deficits in memory tasks of mice with CREB mutations depend on gene dosage. Learn Mem. 1998;5:274–288. [PMC free article] [PubMed] [Google Scholar]
- Goddard GV. Development of epileptic seizures through brain stimulation at low intensity. Nature. 1967;214:1020–1021. doi: 10.1038/2141020a0. [DOI] [PubMed] [Google Scholar]
- Gottlieb HB, Fleming TM, Ji L, Cunningham JT. Identification of central nervous system sites involved in the water diuresis response elicited by central microinjection of nociceptin/Orphanin FQ in conscious rats via c-Fos and inducible cAMP early repressor immunocytochemistry. J Neuroendocrinol. 2007;19:531–542. doi: 10.1111/j.1365-2826.2007.01559.x. [DOI] [PubMed] [Google Scholar]
- Green TA, Alibhai IN, Hommel JD, DiLeone RJ, Kumar A, Theobald DE, Neve RL, Nestler EJ. Induction of inducible cAMP early repressor expression in nucleus accumbens by stress or amphetamine increases behavioral responses to emotional stimuli. J Neurosci. 2006;26:8235–8242. doi: 10.1523/JNEUROSCI.0880-06.2006. [DOI] [PMC free article] [PubMed] [Google Scholar]
- Hu Y, Lund IV, Gravielle MC, Farb DH, Brooks-Kayal AR, Russek SJ. Surface expression of GABAA receptors is transcriptionally controlled by the interplay of CREB and its binding partner ICER. J Biol Chem. 2008;283:9328–9340. doi: 10.1074/jbc.M705110200. [DOI] [PMC free article] [PubMed] [Google Scholar]
- Hummler E, Cole TJ, Blendy JA, Ganss R, Aguzzi A, Schmid W, Beermann F, Schütz G. Targeted mutation of the CREB gene: compensation within the CREB/ATF family of transcription factors. Proc Natl Acad Sci USA. 1994;91:5647–5651. doi: 10.1073/pnas.91.12.5647. [DOI] [PMC free article] [PubMed] [Google Scholar]
- Jaworski J, Mioduszewska B, Sanchez-Capelo A, Figiel I, Habas A, Gozdz A, Proszynski T, Hetman M, Mallet J, Kaczmarek L. Inducible cAMP early repressor, an endogenous antagonist of cAMP responsive element-binding protein, evokes neuronal apoptosis in vitro. J Neurosci. 2003;23:4519–4526. doi: 10.1523/JNEUROSCI.23-11-04519.2003. [DOI] [PMC free article] [PubMed] [Google Scholar]
- Josselyn SA, Shi C, Carlezon WA, Jr, Neve RL, Nestler EJ, Davis M. Long-term memory is facilitated by cAMP response element-binding protein overexpression in the amygdala. J Neurosci. 2001;21:2404–2412. doi: 10.1523/JNEUROSCI.21-07-02404.2001. [DOI] [PMC free article] [PubMed] [Google Scholar]
- Kashihara K, Sato K, Akiyama K, Ishihara T, Hayabara T, Abe K. Temporal profile of CRE DNA-binding activity in the rat hippocampus following a kindling stimulation. Epilepsy Res. 2000;40:171–177. doi: 10.1016/s0920-1211(00)00123-6. [DOI] [PubMed] [Google Scholar]
- Kawase E, Suemori H, Takahashi N, Okazaki K, Hashimoto K, Nakatsuji N. Strain difference in establishment of mouse embryonic stem (ES) cell lines. Int J Dev Biol. 1994;38:385–390. [PubMed] [Google Scholar]
- Kell CA, Dehghani F, Wicht H, Molina CA, Korf HW, Stehle JH. Distribution of transcription factor inducible cyclicAMP early repressor (ICER) in rodent brain and pituitary. J Comp Neurol. 2004;478:379–394. doi: 10.1002/cne.20290. [DOI] [PubMed] [Google Scholar]
- Kida S, Josselyn SA, de Ortiz SP, Kogan JH, Chevere I, Masushige S, Silva AJ. CREB required for the stability of new and reactivated fear memories. Nat Neurosci. 2002;5:348–355. doi: 10.1038/nn819. [DOI] [PubMed] [Google Scholar]
- Kogan JH, Frankland PW, Blendy JA, Coblentz J, Marowitz Z, Schütz G, Silva AJ. Spaced training induces normal long-term memory in CREB mutant mice. Curr Biol. 1997;7:1–11. doi: 10.1016/s0960-9822(06)00022-4. [DOI] [PubMed] [Google Scholar]
- Kojima N, Wang J, Mansuy IM, Grant SG, Mayford M, Kandel ER. Rescuing impairment of long-term potentiation in fyn-deficient mice by introducing Fyn transgene. Proc Natl Acad Sci USA. 1997;94:4761–4765. doi: 10.1073/pnas.94.9.4761. [DOI] [PMC free article] [PubMed] [Google Scholar]
- Kojima N, Ishibashi H, Obata K, Kandel ER. Higher seizure susceptibility and enhanced tyrosine phosphorylation of N-methyl-d-aspartate receptor subunit 2B in fyn transgenic mice. Learn Mem. 1998;5:429–445. [PMC free article] [PubMed] [Google Scholar]
- Konopka D, Szklarczyk AW, Filipkowski RK, Trauzold A, Nowicka D, Hetman M, Kaczmarek L. Plasticity- and neurodegeneration-linked cyclic-AMP responsive element modulator/inducible cyclic-AMP early repressor messenger RNA expression in the rat brain. Neuroscience. 1998;86:499–510. doi: 10.1016/s0306-4522(98)00046-3. [DOI] [PubMed] [Google Scholar]
- Lamas M, Molina C, Foulkes NS, Jansen E, Sassone-Corsi P. Ectopic ICER expression in pituitary corticotroph AtT20 cells: effects on morphology, cell cycle, and hormonal production. Mol Endocrinol. 1997;11:1425–1434. doi: 10.1210/mend.11.10.9987. [DOI] [PubMed] [Google Scholar]
- LeDoux J. The amygdala. Curr Biol. 2007;17:R868–R874. doi: 10.1016/j.cub.2007.08.005. [DOI] [PubMed] [Google Scholar]
- Lee KA, Masson N. Transcriptional regulation by CREB and its relatives. Biochim Biophys Acta. 1993;1174:221–233. doi: 10.1016/0167-4781(93)90191-f. [DOI] [PubMed] [Google Scholar]
- Lepicard EM, Mizuno K, Antunes-Martins A, von Hertzen LS, Giese KP. An endogenous inhibitor of calcium/calmodulin-dependent kinase II is up-regulated during consolidation of fear memory. Eur J Neurosci. 2006;23:3063–3070. doi: 10.1111/j.1460-9568.2006.04830.x. [DOI] [PubMed] [Google Scholar]
- Lonze BE, Ginty DD. Function and regulation of CREB family transcription factors in the nervous system. Neuron. 2002;35:605–623. doi: 10.1016/s0896-6273(02)00828-0. [DOI] [PubMed] [Google Scholar]
- Luckman SM, Cox HJ. Expression of inducible cAMP early repressor (ICER) in hypothalamic magnocellular neurons. Mol Brain Res. 1995;34:231–238. doi: 10.1016/0169-328x(95)00167-q. [DOI] [PubMed] [Google Scholar]
- Mayford M, Bach ME, Huang YY, Wang L, Hawkins RD, Kandel ER. Control of memory formation through regulated expression of a CaMKII transgene. Science. 1996;274:1678–1683. doi: 10.1126/science.274.5293.1678. [DOI] [PubMed] [Google Scholar]
- Mayr B, Montminy M. Transcriptional regulation by the phosphorylation-dependent factor CREB. Nat Rev Mol Cell Biol. 2001;2:599–609. doi: 10.1038/35085068. [DOI] [PubMed] [Google Scholar]
- McIntyre DC, Poulter MO, Gilby K. Kindling: some old and some new. Epilepsy Res. 2002;50:79–92. doi: 10.1016/s0920-1211(02)00071-2. [DOI] [PubMed] [Google Scholar]
- Mioduszewska B, Jaworski J, Kaczmarek L. Inducible cAMP early repressor (ICER) in the nervous system—a transcriptional regulator of neuronal plasticity and programmed cell death. J Neurochem. 2003;87:1313–1320. doi: 10.1046/j.1471-4159.2003.02116.x. [DOI] [PubMed] [Google Scholar]
- Mioduszewska B, Jaworski J, Szklarczyk AW, Klejman A, Kaczmarek L. Inducible cAMP early repressor (ICER)-evoked delayed neuronal death in the organotypic hippocampal culture. J Neurosci Res. 2007;86:61–70. doi: 10.1002/jnr.21469. [DOI] [PubMed] [Google Scholar]
- Misund K, Steigedal TS, Laegreid A, Thommesen L. Inducible cAMP early repressor splice variants ICER I and IIgamma both repress transcription of c-fos and chromogranin A. J Cell Biochem. 2007;101:1532–1544. doi: 10.1002/jcb.21267. [DOI] [PubMed] [Google Scholar]
- Molina CA, Foulkes NS, Lalli E, Sassone-Corsi P. Inducibility and negative autoregulation of CREM: an alternative promoter directs the expression of ICER, an early response repressor. Cell. 1993;75:875–886. doi: 10.1016/0092-8674(93)90532-u. [DOI] [PubMed] [Google Scholar]
- Monaco L, Sassone-Corsi P. Cross-talk in signal transduction: Ras-dependent induction of cAMP-responsive transcriptional repressor ICER by nerve growth factor. Oncogene. 1997;15:2493–2500. doi: 10.1038/sj.onc.1201636. [DOI] [PubMed] [Google Scholar]
- Montminy M. Transcriptional regulation by cyclic AMP. Annu Rev Biochem. 1997;66:807–822. doi: 10.1146/annurev.biochem.66.1.807. [DOI] [PubMed] [Google Scholar]
- Morimoto K, Fahnestock M, Racine RJ. Kindling and status epilepticus models of epilepsy: rewiring the brain. Prog Neurobiol. 2004;73:1–60. doi: 10.1016/j.pneurobio.2004.03.009. [DOI] [PubMed] [Google Scholar]
- Mouravlev A, Dunning J, Young D, During MJ. Somatic gene transfer of cAMP response element-binding protein attenuates memory impairment in aging rats. Proc Natl Acad Sci USA. 2006;103:4705–4710. doi: 10.1073/pnas.0506137103. [DOI] [PMC free article] [PubMed] [Google Scholar]
- Paré D, Quirk GJ, Ledoux JE. New vistas on amygdala networks in conditioned fear. J Neurophysiol. 2004;92:1–9. doi: 10.1152/jn.00153.2004. [DOI] [PubMed] [Google Scholar]
- Paxinos G, Franklin KBJ. The mouse brain in stereotaxic coordinates. San Diego: Academic; 2001. [Google Scholar]
- Pittenger C, Huang YY, Paletzki RF, Bourtchouladze R, Scanlin H, Vronskaya S, Kandel ER. Reversible inhibition of CREB/ATF transcription factors in region CA1 of the dorsal hippocampus disrupts hippocampus-dependent spatial memory. Neuron. 2002;34:447–462. doi: 10.1016/s0896-6273(02)00684-0. [DOI] [PubMed] [Google Scholar]
- Porter BE, Lund IV, Varodayan FP, Wallace RW, Blendy JA. The role of transcription factors cyclic-AMP responsive element modulator (CREM) and inducible cyclic-AMP early repressor (ICER) in epileptogenesis. Neuroscience. 2008;152:829–936. doi: 10.1016/j.neuroscience.2007.10.064. [DOI] [PMC free article] [PubMed] [Google Scholar]
- Racine RJ. Modification of seizure activity by electrical stimulation. II. Motor seizure. Electroencephalogr Clin Neurophysiol. 1972;32:281–294. doi: 10.1016/0013-4694(72)90177-0. [DOI] [PubMed] [Google Scholar]
- Rescorla RA, Durlach PJ. Within-event learning in pavlovian conditioning. In: Spear NE, Miller RR, editors. Information processing in animals: memory mechanisms. Hillsdale, NJ: Erlbaum; 1981. pp. 81–111. [Google Scholar]
- Rydelek-Fitzgerald L, Vaidya VA, Terwilliger RZ, Duman RS. Electroconvulsive seizure increases the expression of CREM (cyclic AMP response element modulator) and ICER (inducible cyclic AMP early repressor) in rat brain. J Neurochem. 1996;66:429–432. doi: 10.1046/j.1471-4159.1996.66010429.x. [DOI] [PubMed] [Google Scholar]
- Sakai N, Thome J, Newton SS, Chen J, Kelz MB, Steffen C, Nestler EJ, Duman RS. Inducible and brain region-specific CREB transgenic mice. Mol Pharmacol. 2002;61:1453–1464. doi: 10.1124/mol.61.6.1453. [DOI] [PubMed] [Google Scholar]
- Sambrook J, Fritsch EF, Maniatis T. Molecular cloning: a laboratory manual. Cold Spring Harbor, NY: Cold Spring Harbor Laboratory; 1989. [Google Scholar]
- Sassone-Corsi P. Transcription factors responsive to cAMP. Annu Rev Cell Dev Biol. 1995;11:355–377. doi: 10.1146/annurev.cb.11.110195.002035. [DOI] [PubMed] [Google Scholar]
- Sassone-Corsi P. Coupling gene expression to cAMP signalling: role of CREB and CREM. Int J Biochem Cell Biol. 1998;30:27–38. doi: 10.1016/s1357-2725(97)00093-9. [DOI] [PubMed] [Google Scholar]
- Schulz S, Siemer H, Krug M, Höllt V. Direct evidence for biphasic cAMP responsive element-binding protein phosphorylation during long-term potentiation in the rat dentate gyrus in vivo. J Neurosci. 1999;19:5683–5692. doi: 10.1523/JNEUROSCI.19-13-05683.1999. [DOI] [PMC free article] [PubMed] [Google Scholar]
- Shepard JD, Liu Y, Sassone-Corsi P, Aguilera G. Role of glucocorticoids and cAMP-mediated repression in limiting corticotropin-releasing hormone transcription during stress. J Neurosci. 2005;25:4073–4081. doi: 10.1523/JNEUROSCI.0122-05.2005. [DOI] [PMC free article] [PubMed] [Google Scholar]
- Silva AJ, Kogan JH, Frankland PW, Kida S. CREB and memory. Annu Rev Neurosci. 1998;21:127–148. doi: 10.1146/annurev.neuro.21.1.127. [DOI] [PubMed] [Google Scholar]
- Staiger JF, Bisler S, Schleicher A, Gass P, Stehle JH, Zilles K. Exploration of a novel environment leads to the expression of inducible transcription factors in barrel-related columns. Neuroscience. 2000;99:7–16. doi: 10.1016/s0306-4522(00)00166-4. [DOI] [PubMed] [Google Scholar]
- Stehle JH, Foulkes NS, Molina CA, Simonneaux V, Pevet P, Sassone-Corsi P. Adrenergic signals direct rhythmic expression of transcriptional repressor CREM in the pineal gland. Nature. 1993;365:314–320. doi: 10.1038/365314a0. [DOI] [PubMed] [Google Scholar]
- Stehle JH, von Gall C, Korf HW. Analysis of cell signalling in the rodent pineal gland deciphers regulators of dynamic transcription in neural/endocrine cells. Eur J Neurosci. 2001;14:1–9. doi: 10.1046/j.0953-816x.2001.01627.x. [DOI] [PubMed] [Google Scholar]
- Storvik M, Lindén AM, Kontkanen O, Lakso M, Castrén E, Wong G. Induction of cAMP response element modulator (CREM) and inducible cAMP early repressor (ICER) expression in rat brain by uncompetitive N-methyl-d-aspartate receptor antagonists. J Pharmacol Exp Ther. 2000;294:52–60. [PubMed] [Google Scholar]
- Tinti C, Conti B, Cubells JF, Kim KS, Baker H, Joh TH. Inducible cAMP early repressor can modulate tyrosine hydroxylase gene expression after stimulation of cAMP synthesis. J Biol Chem. 1996;271:25375–25381. doi: 10.1074/jbc.271.41.25375. [DOI] [PubMed] [Google Scholar]
- Warburton EC, Glover CP, Massey PV, Wan H, Johnson B, Bienemann A, Deuschle U, Kew JN, Aggleton JP, Bashir ZI, Uney J, Brown MW. cAMP responsive element-binding protein phosphorylation is necessary for perirhinal long-term potentiation and recognition memory. J Neurosci. 2005;25:6296–6303. doi: 10.1523/JNEUROSCI.0506-05.2005. [DOI] [PMC free article] [PubMed] [Google Scholar]
- Yin JC, Wallach JS, Vecchio MD, Wilder EL, Zhou H, Quinn WG, Tully T. Induction of a dominant-negative CREB transgene specifically blocks long-term memory in Drosophila melanogaster. Cell. 1994;79:49–58. doi: 10.1016/0092-8674(94)90399-9. [DOI] [PubMed] [Google Scholar]
- Yin JC, Del Vecchio M, Zhou H, Tully T. CREB as a memory modulator: induced expression of a dCREB2 activator isoform enhances long-term memory in Drosophila. Cell. 1995;81:107–115. doi: 10.1016/0092-8674(95)90375-5. [DOI] [PubMed] [Google Scholar]