

Abstract
Behavioral states regulate how information is processed in local neuronal circuits. Here, we asked whether dendrodendritic synaptic interactions in the olfactory bulb vary with brain and behavioral states. To examine the state-dependent change of the dendrodendritic synaptic transmission, we monitored changes in field potential responses in the olfactory bulb of urethane-anesthetized and freely behaving rats. In urethane-anesthetized rats, granule-to-mitral dendrodendritic synaptic inhibition was larger and longer when slow waves were present in the electroencephalogram (slow-wave state) than during the fast-wave state. The state-dependent alternating change in the granule-to-mitral inhibition was regulated by the cholinergic system. In addition, the frequency of the spontaneous oscillatory activity of local field potentials and periodic discharges of mitral cells in the olfactory bulb shifted in synchrony with shifts in the neocortical brain state. Freely behaving rats showed multilevel changes in dendrodendritic synaptic inhibition that corresponded to diverse behavioral states; the inhibition was the largest during slow-wave sleep state, and successively smaller during light sleep, awake immobility, and awake moving states. These results provide evidence that behavioral state-dependent global changes in cholinergic tone modulate dendrodendritic synaptic inhibition and the information processing mode in the olfactory bulb.
Keywords: dendrodendritic synapses, state, olfactory bulb, cholinergic, sleep, evoked field potential
Introduction
The mode of information processing in local neuronal circuits in the brain changes with different behavioral states and has been associated with local oscillatory activity or electroencephalogram (EEG) patterns (Steriade et al., 1993). The hippocampus, for example, shows theta-band oscillatory activity during exploratory behavior, when it processes neocortical inputs, and shows irregular slow waves with sharp waves and ripples during slow-wave sleep, quiet wakefulness, and consummatory behavior, when it presumably transfers temporarily stored information to the neocortex (Buzsáki, 1989). To functionally analyze the CNS, it is thus critical to understand the state-dependent changes in information processing modes within particular functional regions of the brain.
The olfactory bulb (OB) is the first processing center of the olfactory system in the vertebrate brain and contains maps representing the molecular features of odorants (Mori et al., 1999, 2006; Takahashi et al., 2004). The OB has a cortical structure with well-ordered neuronal circuits and a characteristic synaptic organization (Shepherd et al., 2004). Mitral cells, the principal neurons in the OB, extend their long lateral dendrites in the external plexiform layer (EPL) and form numerous dendrodendritic reciprocal synaptic connections with the spines of granule cells (Rall and Shepherd, 1968; Price and Powell, 1970) (see Fig. 1A). The dendrodendritic synapses mediate recurrent and lateral inhibition and the synchronized periodic activity of mitral cells (Rall and Shepherd, 1968; Yokoi et al., 1995; Kashiwadani et al., 1999; Schoppa, 2006). Although the molecular and cellular mechanisms of dendrodendritic synaptic transmission have been studied extensively (Isaacson and Strowbridge, 1998; Schoppa et al., 1998; Chen et al., 2000; Xiong and Chen, 2002), it remains unknown whether and how the internal state of the brain modulates dendrodendritic synaptic transmission and local circuit activity in the OB.
Figure 1.
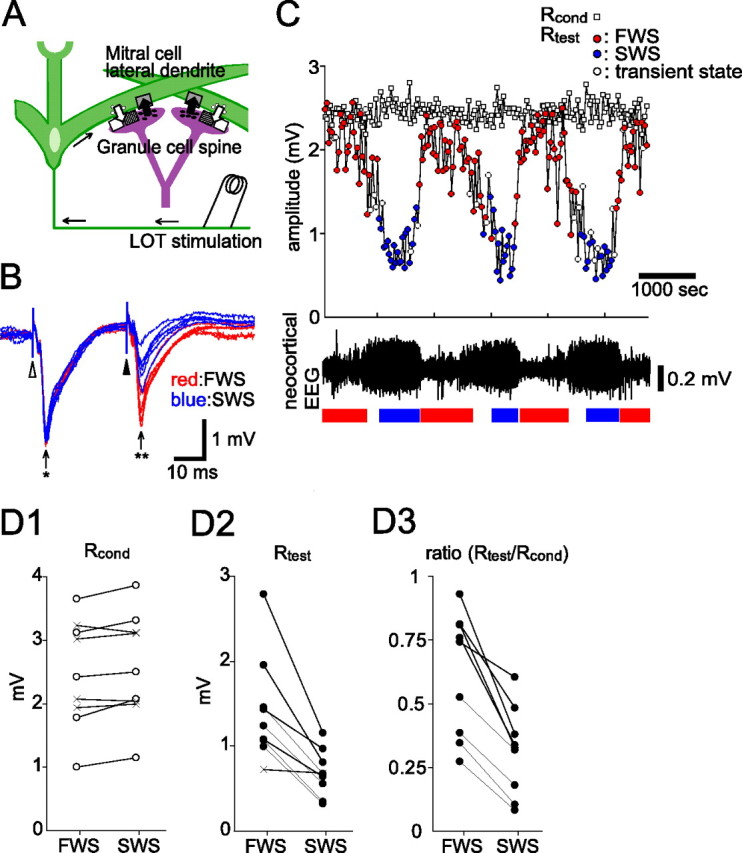
Granule-to-mitral inhibition is stronger during SWS than during FWS in the OB of urethane-anesthetized rats. A, A schematic diagram of dendrodendritic reciprocal synapses between mitral cell lateral dendrites and granule cell spines. Open arrows, glutamatergic excitatory input; closed arrows, GABAergic inhibitory input; white square, AMPA receptor; shaded square, NMDA receptor; gray square, GABAA receptor. B, Field potential responses in the EPL evoked by paired LOT stimulation. The ISI was 30 ms. Six traces obtained during the fast-wave state (red traces, FWS) and slow-wave state (blue traces, SWS) are overlaid. Responses to the conditioning stimulus (an arrow with asterisk) showed only small changes with behavioral state, whereas responses to the test stimulus (an arrow with two asterisks) changed dramatically between FWS and SWS. C, Chronological plots of the amplitudes of responses to the conditioning LOT stimulation (Rcond, open squares) and to the test LOT stimulation (Rtest, circles). The colors of the circles indicate the brain state of the animal when paired LOT stimulation was applied. Red, FWS; blue, SWS; white, transient state. The bottom trace indicates the neocortical EEG. Under urethane anesthesia, the neocortical EEG typically shows a periodic alternation between FWS and SWS. The periods of typical FWS are shown by red bars and typical SWS by blue bars. D1–D3, Averaged amplitudes of Rcond (D1), Rtest (D2), and their ratio (Rtest/Rcond; D3) in individual animals. The ISI was 30 ms. Each connected pair of marks represents the data from a single animal. The open circles in D1 indicate that Rcond was significantly larger during SWS than during FWS (p < 0.01, two-tailed t test). The closed circles in D2 and D3 indicate that Rtest and the ratio Rtest/Rcond were significantly smaller during SWS than during FWS, respectively (p < 0.01, two-tailed t test). Cross marks indicate that the values were not significantly different between the two states.
The OB receives centrifugal inputs from neuromodulatory systems, including cholinergic (Ichikawa and Hirata, 1986), noradrenergic (McLean et al., 1989), and serotonergic (McLean and Shipley, 1987) systems. The activity of the neuromodulatory systems changes with the behavioral state of the animal. Because granule cells in the OB express muscarinic acetylcholine receptors on their spines in the EPL (Crespo et al., 2000), we hypothesized that the state-dependent change in cholinergic input might regulate dendrodendritic synaptic transmission in the OB in a state-dependent manner.
As a first step to examine whether brain states regulate the dendrodendritic synaptic interactions, we recorded field potentials in the EPL of the OB evoked by stimulation of the lateral olfactory tract (LOT) in urethane-anesthetized rats while using neocortical EEG to monitor the global brain state. Under urethane anesthesia, the cortical EEG shows a periodic alternation between a slow-wave state (SWS) and a fast-wave state (FWS) (Détári et al., 1997; Balatoni and Détári, 2003; Murakami et al., 2005). The former resembles the EEG pattern during the slow-wave sleep state, and the latter corresponds to the shallower stage of anesthesia stage III-3 of the Guedel stage of anesthesia (Friedberg et al., 1999). Furthermore, we recorded LOT-evoked field potentials in freely behaving animals to examine the behavioral state-dependent change of granule-to-mitral inhibition.
Materials and Methods
Recordings from anesthetized animals.
Experiments were performed on 30 male adult Wistar rats (9–13 weeks old; 225–295 g; Japan SLC). Animals were anesthetized with an intraperitoneal injection of urethane (1.2 g/kg), prepared for acute electrophysiological recording from the OB according to methods described previously (Nagayama et al., 2004; Murakami et al., 2005), and placed in a stereotaxic apparatus (SR-6N; Narishige). Body temperature was maintained at 37.5°C using a homeothermic heating pad (ATB-1100; Nihon Kohden). Respiratory rhythms were detected using a piezo transducer (MLT 1010; AD Instruments). Before the surgery, 0.1% lidocaine was injected subcutaneously at the site of the incision. All experiments were performed in accordance with the guidelines of the Physiological Society of Japan and the animal experiment committee of The University of Tokyo.
For EEG recordings, a stainless-steel screw was threaded into the bone above the occipital cortex (6 mm posterior to bregma, 3.5 mm lateral to the midline). Another screw was threaded into the bone above the cerebellum (1.5 mm posterior to lambda) as a reference. For recording LOT-evoked field EPSPs (fEPSPs) and oscillatory local field potentials (OLFPs), one or two tungsten electrodes (0.1 MΩ; Microprobe) were inserted to the OB in the EPL and/or granule cell layer (GCL). For recording extracellular single units, a tungsten electrode (5.0 MΩ; Microprobe) was inserted to the OB. Single-unit activities were recorded exclusively from the EPL or mitral cell layer. The recorded potentials were amplified (AB-610J; Nihon Kohden) and filtered (0.5–100 Hz for occipital EEG, 0.08 Hz to 10 kHz for fEPSP, 0.5–100 or 0.08 Hz to 10 kHz for OLFP, and 150 Hz to 3 kHz for single-unit recording; AB-610J and EW-610J; Nihon Kohden). The recorded signals were stored in a computer via an analog-to-digital (A/D) converter with Spike2 software (Cambridge Electronic Design). For intracellular recordings from mitral cells, we used a glass micropipette (40–120 MΩ) filled with 2 m potassium acetate. The CSF was drained from the cisterna magna to minimize the pulsation of the brain. The recorded membrane potentials were amplified (MEZ-8300 and JZ-102J; Nihon Kohden) and stored in a computer with the EEG signals.
For electrical stimulation of the LOT, we applied square current pulses (0.1 ms in duration, 0.1–1.5 mA) using a concentric stainless-steel electrode (EKB-5002K; diameter, 240 μm; Eikou Kagaku). The stimulus intensity was set to the minimum voltage that evoked the maximal LOT-evoked field potential in the OB. The position of the recording microelectrode in different layers of the OB was determined by monitoring the configuration of the LOT-evoked field potential (Rall and Shepherd, 1968). We used the paired LOT stimulation method (Mori and Takagi, 1978) to estimate the strength of granule-to-mitral inhibition. In the paired LOT stimulation method, the LOT was stimulated twice with equal intensity at various interstimulus intervals (ISIs). For the intracellular recording experiment, single LOT stimulation was used.
For drug application, we made a plastic pool, glued it onto the skull around the dorsal surface of the OB, and perfused oxygenated artificial CSF (ACSF; 37.5°C) through it continuously (flow rate, 1 ml/min). The ACSF contained (in mm) 124 NaCl, 3 KCl, 1.3 MgSO4, 2 CaCl2, 1.25 NaH2PO4, 26 NaHCO3, and 10 glucose, and was bubbled with 95% O2 and 5% CO2 (Chen et al., 2000). In pharmacological experiments, we used paired LOT stimulation at a 50 ms ISI to optimize the observation of state-dependent changes. The dura was removed locally around the recording site. The drug concentration was 10 times higher than usual for in vitro studies because of the difficulties of permeation. Picrotoxin, (−)-scopolamine hydrobromide, and carbamylcholine chloride (carbachol) were purchased from Sigma, and dl-APV was purchased from Tocris Bioscience.
Recordings from freely behaving animals.
Six male adult rats were anesthetized with intraperitoneal injections of medetomidine (0.50 mg/kg) and ketamine (75.0 mg/kg). Additional doses of medetomidine (0.13 mg/kg) and ketamine (18.8 mg/kg) were given every 3 h. Animals were mounted in a stereotaxic apparatus and body temperature was maintained at 37.5°C by a heating pad (ATB-1100; Nihon Kohden).
For recording electromyograms (EMGs), Teflon-insulated stainless-steel electrodes (catalog #790900; A-M Systems) were implanted in the neck muscle. For recording EEGs, a stainless-steel screw was threaded into the bone above the occipital cortex (6 mm posterior to bregma, 3.5 mm lateral to the midline). Another screw was threaded into the bone above the cerebellum (1.5 mm posterior to lambda) as a reference. Additional screws were threaded into the bone as anchors. For recording LOT-evoked fEPSPs, twisted stainless-steel electrodes (catalog #790900; A-M Systems) were implanted in the GCL of the OB and the LOT (1.7 mm anterior to bregma, 4.0 mm lateral to the midline). All of these electrodes were fixed by dental cement, connected to an electrode interface board (EIB-27; Neuralynx), and covered with a polypropylene cap.
After a 1 week recovery period, the neck muscle EMG, neocortical EEG, and LOT-evoked fEPSP in the GCL were recorded simultaneously. Animals moved freely within an acrylic cage to which they were habituated, and recording was performed during the light period (5:00 A.M. to 5:00 P.M.). The neck muscle EMG, neocortical EEG, and fEPSP in the GCL were amplified with a headstage preamplifier (HS-27; Neuralynx) and amplifier (Lynx-8, Neuralynx; AB-610J, Nihon Kohden), filtered (0.5 Hz to 1 kHz for neocortical EEG, 0.08 Hz to 10 kHz for fEPSP in the GCL, 50 Hz to 10 kHz for neck muscle EMG; AB-610J; Nihon Kohden), and stored in a computer via an A/D converter with Spike2 software (Cambridge Electronic Design). We chose the intensity of paired LOT stimulation such that the change in the response to the test stimulus was observed clearly in each animal. The ISI was 20 ms. Paired LOT stimulation was performed once per minute for a total of 100 times per day. We only used the data in which the response to the conditioning stimulus did not change clearly after the paired LOT stimulation experiments. No rats showed startle responses to LOT stimulation.
We classified behavioral states into five categories: awake moving, awake immobility, light sleep, slow-wave sleep, and rapid eye movement (REM) sleep (see Fig. 7A). To evaluate the behavioral states, we monitored the neck muscle EMG, neocortical EEG, and the animal's behavior on-line. The awake moving and awake immobility states were characterized by the presence of tonic activity of the neck muscle and a fast neocortical EEG (see Fig. 7B). The two awake states were differentiated by the movement and posture of the rats. Sleep states (light sleep, slow-wave sleep, and REM sleep) were determined by the absence of tonic activity of the neck muscle. The three sleep states were differentiated by the pattern of the neocortical EEG (Radulovacki et al., 1984). Light sleep was characterized by spindles and <50% δ slow waves, slow-wave sleep was characterized by having 50% or more δ slow waves, and REM sleep was characterized by a high-frequency, low-amplitude EEG and by the absence of neck muscle activity except for occasional muscle twitches. The behavioral states of the animals were determined finally by off-line observation during the 10 s before and after the LOT stimulation.
Figure 7.

Behavioral state-dependent multilevel changes in the granule-to-mitral inhibition in freely behaving rats. A, We classified behavioral states into five categories on the basis of the behavior, neck muscle EMG, and neocortical EEG. B, Examples of neck muscle EMG and neocortical EEG in each behavioral state. During the awake moving and awake immobility states, we observed tonic activity in the neck muscle and high-frequency waves in the EEG. During the slow-wave sleep state, the neck muscle showed no tonus and the neocortical EEG had a slow-wave pattern. The time window of each trace is 20 s. C, Field potential responses recorded in the GCL of the OB to paired LOT stimulation in a freely behaving rat. LOT-evoked field potentials during awake moving (3 red traces), awake immobility (3 yellow traces), light sleep (3 light blue traces), slow-wave sleep (3 dark blue traces), and REM sleep (3 green traces) states are overlaid. These traces were aligned by the potential just before the test stimulus (indicated by arrow). The ISI was 20 ms. The broken black line indicates the average of 10 responses to a single LOT stimulation. Note that the amplitude of the response to the test stimulus was the smallest during the slow-wave sleep state. D, Chronological plots of the amplitude of the test response (Rtest) and the conditioning response (Rcond). Paired LOT stimulation was applied once every 60 s and 100 times per day. White squares indicate Rcond, and colored circles indicate Rtest. The different colors indicate behavioral states of the animal when paired LOT stimulation was applied: red, awake moving; yellow, awake immobility; light blue, light sleep; dark blue, slow-wave sleep; green, REM sleep. Note that Rtest/Rcond decreases during sleep states, and is lowest during the slow-wave sleep state. E1–E3, Quantitative comparison of the amplitude of Rcond (E1), Rtest (E2), and Rtest/Rcond (E3) across distinct behavioral states (red, awake moving; yellow, awake immobility; light blue, light sleep; dark blue, slow-wave sleep; green, REM sleep; means ± SD). The amplitude of Rcond did not show clear differences across behavioral states. In contrast, the amplitude of Rtest and the ratio Rtest/Rcond were significantly different across the awake moving, awake immobility, light sleep, and slow-wave sleep states (**p < 0.01; ***p < 0.001, ANOVA combined with Tukey's post hoc test). The amplitude of Rtest and the ratio Rtest/Rcond did not show significant differences between the light sleep state and REM sleep state.
Analysis.
To distinguish the SWS from the FWS using EEG in anesthetized animals, we calculated the ratio of slow-wave (0.5–2 Hz) EEG power to total (0.25–500 Hz) EEG power for 5 s before and 5 s after the onset of the LOT stimulation. If this ratio was >0.5, the LOT stimulation trial was assigned to the SWS, and if <0.3, to the FWS (Murakami et al., 2005). Otherwise, the trial was assigned to the transient state.
We measured the peak amplitude of the fEPSP evoked by the conditioning stimulus and that of test stimulus. The peak amplitude of the fEPSP evoked by the conditioning stimulus was measured from the baseline (Rcond). The peak amplitude of the fEPSP evoked by the test stimulus was measured by subtracting the averaged traces of responses to single LOT stimulations from the trace of the response to the second LOT stimulation of a pair (Rtest). Then, the ratio Rtest/Rcond was calculated. For chronological plots of fEPSP amplitude, paired LOT stimulation was delivered every 30 or 60 s. To measure the duration of suppression, we compared Rcond and Rtest in each ISI and each state, and defined the duration of suppression as the period in which Rtest is significantly smaller than Rcond (p < 0.05, two-tailed t test). In intracellular recording experiments, the peak amplitude of the LOT-evoked IPSP was measured from the resting membrane potential (IPSP amplitude). The IPSP duration was measured by the period from LOT stimulation to the time when the membrane potential was back to resting level. The IPSP decay time was measured as the period from the peak amplitude of the IPSP to 1/e amplitude of the IPSP. The value of IPSP integral was calculated by measuring the area under resting membrane potential during IPSP duration. We only used the data in which resting membrane potential was stable (less than −40 mV) and LOT-evoked IPSP was clearly observed (>5 mV). For statistical analysis, 31–40 recordings were used in each state and each cell. The duration of the LOT-evoked suppression of spontaneous spike discharges of mitral/tufted cells were determined by the period in which the firing rate was less than half of the spontaneous firing rate.
The cross-correlograms of OLFPs in the EPL and GCL (see Fig. 5A2) were calculated during selected 200 s periods after bandpass filtering between 20 and 100 Hz using Spike2 software. The power spectra of OLFPs in the EPL (see Fig. 5A3) were calculated during selected 200 s periods using Spike2 software. To create the pseudocolor spectrogram of OLFP (see Fig. 5B), the recording period (1600 s) was divided into 320 partitions (5 s each). The power spectra of OLFPs in the GCL were calculated during each 5 s period. The resolution of the frequency of the power spectra was 0.24 Hz. The power of each frequency of the OLFP was given a color and aligned chronologically by using IGOR Pro (WaveMetrics). Maximum power (indicated by red) was set to 0.0004 mV2. The peak frequencies of OLFPs in the GCL (see Fig. 5C) were determined by the frequency that had the strongest power between 30 and 120 Hz during selected 100 s periods in each state. The resolution of the power spectra was 0.49 Hz.
Figure 5.

State-dependent change in spontaneous OLFP in the OB of urethane-anesthetized rats. A1, Simultaneous recordings of OLFPs in the EPL (top trace) and GCL (bottom trace). The oscillation frequency of the OLFP was higher during FWS than during SWS. A2, Cross-correlograms of OLFP recorded in the EPL and GCL during FWS (top graph; sampled for 200 s, filtered at 20–100 Hz) and during SWS (bottom graph; 200 s, 20–100 Hz). The dotted line indicates time 0. Note that the OLFPs in the EPL and in the GCL are negatively correlated. A3, Power spectrum of the OLFP recorded in the EPL during FWS (top graph; sampled for 200 s) and during SWS (bottom graph; 200 s). B, The frequency of OLFP shifted in synchrony with the shift of brain states between FWS and SWS. OLFPs in the GCL were recorded continuously, and the power spectrum during each 5 s was calculated. This pseudocolor display of the spectrogram chronologically represents the intensity of power at each frequency. The magnitude of the power at each frequency is shown by color (right inset). x-Axis, Time (bin, 5 s); y-axis, frequency (bin, 0.24 Hz). The bottom trace indicates the neocortical EEG. C, Summary plot of the state-dependent change of OLFP peak frequency in the GCL in each animal (n = 10).
To obtain phase histograms of the spike discharges of mitral cells, OLFPs in the GCL were filtered (40–80 Hz), and filtered OLFP peaks were detected. One cycle of the OLFP (peak-to-peak period) was divided into 360° (bin, 2°), and all spike discharges of a mitral cell (during 200 s) were plotted in raster plots and histograms during both FWS and SWS to determine the phase relationship. An averaged field potential of the GCL was also calculated in the same 200 s. Time 0 refers to the time of the OLFP peak. Spike autocorrelograms of discharges of mitral cells were calculated both during FWS and during SWS in selected 800 s periods and are shown as raster plots and spike rates created using Spike2 software. The peak of the spike rate at time 0 was eliminated from the autocorrelogram.
In chronic experiments, the amplitudes of Rcond and Rtest were measured as described above. For statistical analysis, the data obtained during 3 d (297–300 recordings) was used in each animal. The power of the frequency range from 60 to 90 Hz of OLFP was calculated during 10 s in each state. We used the data during the period in which LOT stimulation was not performed. The statistical significance of behavioral state-dependent changes of the amplitudes of Rcond, Rtest, and their ratio (Rtest/Rcond) were examined by ANOVA combined with Tukey's post hoc test. Other statistical comparisons were made with two-tailed t tests.
Results
Enhanced granule-to-mitral dendrodendritic inhibition during the slow-wave state in anesthetized rats
To monitor changes in dendrodendritic synaptic transmission between mitral cells and granule cells during changes in brain state, we delivered paired stimulations to the LOT during SWS and FWS and recorded the field potentials evoked in the EPL of the OB of urethane-anesthetized rats (Fig. 1B). A conditioning LOT stimulation (open arrowhead) elicited an initial transient negativity, which reflects the antidromic spike activity of mitral cells, followed by a large negativity (fEPSP), which reflects the activity of mitral-to-granule dendrodendritic excitatory synapses (Rall and Shepherd, 1968). We then applied a test LOT stimulation (closed arrowhead) with the same intensity 30 ms after the conditioning stimulus. The test LOT-evoked fEPSP was suppressed by the conditioning LOT stimulation, as reported previously (Nicoll, 1969, 1971; Shepherd, 1972; Stewart and Scott, 1976; Mori and Takagi, 1978).
A conditioning LOT stimulation elicits large and prolonged IPSPs in mitral cells (Mori and Takagi, 1978) that prevent the antidromic spikes evoked by test LOT stimulation from invading the somata or backpropagating along the lateral dendrites of mitral cells (Xiong and Chen, 2002); this in turn prevents the activation of mitral-to-granule dendrodendritic excitatory synapses. Thus, the magnitude and time course of the suppression of the test LOT-evoked fEPSP faithfully reflect the magnitude and time course of IPSPs in mitral cells evoked by the conditioning LOT stimulation (Mori and Takagi, 1978). We examined whether there is a state-dependent change in the magnitude of granule-to-mitral dendrodendritic inhibition by recording the fEPSP responses to paired LOT stimulation while simultaneously monitoring the brain state by recording the EEG from the neocortex. Whereas the amplitudes of the fEPSPs evoked by the conditioning stimulus changed only slightly between the brain states, the amplitude of the LOT-evoked test fEPSP changed dramatically depending on the brain state (Fig. 1B). A chronological comparison of the neocortical EEG and the LOT-evoked fEPSP (Fig. 1C) showed that the alternation in the amplitude of the test LOT-evoked fEPSP was clearly in phase with the alternation of the EEG pattern between FWS and SWS. During the gradual transition from FWS to SWS, the suppression of the test LOT-evoked field potential gradually increased to reach a maximum at the SWS. At the transition from SWS to FWS, the suppression rapidly decreased and only a small suppression was observed during the FWS.
In nine urethane-anesthetized rats, we compared the averaged amplitudes of the conditioning LOT-evoked fEPSP (Fig. 1D1, Rcond), test LOT-evoked fEPSP (Fig. 1D2, Rtest), and their ratio (Fig. 1D3, Rtest/Rcond) during FWS and SWS. In five of nine animals, Rcond was slightly but significantly larger during SWS than during FWS (mean increase 5%; p < 0.01, two-tailed t test). In eight animals, Rtest was significantly and clearly smaller during SWS than during FWS (mean decrease, 49%; p < 0.01, two-tailed t test). And in all nine animals, the ratio Rtest/Rcond was significantly and clearly smaller during SWS than during FWS (mean decrease, 52%; p < 0.01, two-tailed t test). These results indicate that LOT-evoked granule-to-mitral dendrodendritic synaptic inhibition is larger during SWS than during FWS in urethane-anesthetized rats. We next measured the suppression of the test LOT-evoked fEPSP during SWS and during FWS at various conditioning-to-test intervals. The suppression lasted longer during SWS than during FWS (Figs. 2A,B). The mean duration of suppression was 35–45 ms during FWS and 63–73 ms during SWS (n = 4 rats).
Figure 2.
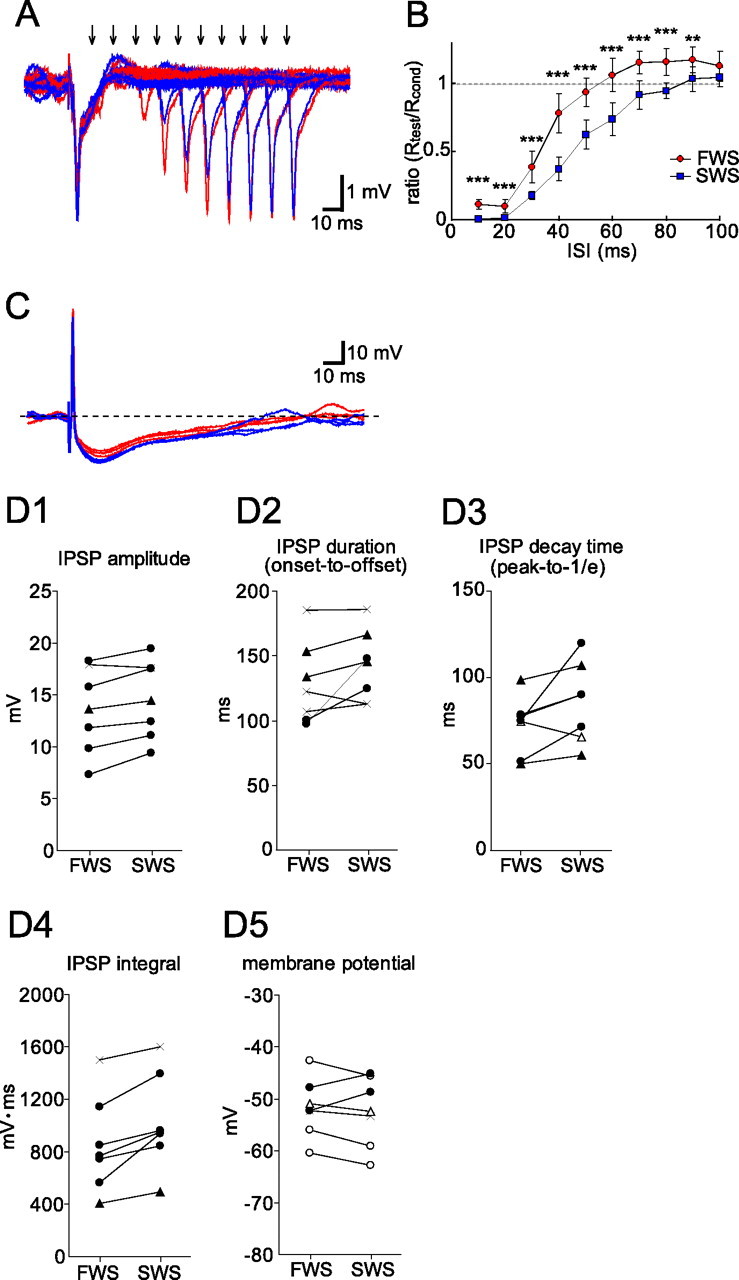
Granule-to-mitral inhibition is longer during SWS than during FWS in the OB of urethane-anesthetized rats. A, LOT-evoked field potentials in the EPL were recorded at various conditioning-to-test intervals from 10 to 100 ms. Arrows indicate the times of the test LOT stimulations. Artifacts of the test LOT stimulation were eliminated. Recordings during FWS are shown by red traces and those during SWS by blue traces. B, The ratio of Rtest and Rcond (Rtest/Rcond, mean ± SD) was plotted against ISI. Means and SD were calculated from 9 to 20 recordings at each ISI and in each state in one animal (**p < 0.01; ***p < 0.001, two-tailed t tests with Bonferroni's correction). The suppression of the test LOT-evoked response by the conditioning LOT stimulation was stronger and longer during SWS than during FWS. C, An intracellular recording from a mitral cell showing an antidromic spike and a long-lasting IPSP induced by the LOT stimulation. LOT-evoked IPSPs during FWS (3 red traces) were overlaid with those during SWS (3 blue traces). The IPSP tended to be larger and longer during SWS than during FWS despite the same resting membrane potential. D1–D5, Averaged IPSP amplitude (D1), IPSP duration (onset-to-offset; D2), IPSP decay time (peak-to-1/e; D3), IPSP integral (D4), and resting membrane potential (D5) in individual cells. Filled circles and filled triangles in D1–D5 indicate that the value was significantly larger during SWS than during FWS (filled circles, p < 0.01; filled triangles, p < 0.05; two-tailed t test). Open circles and open triangles in D3 and D5 indicate that the value was significantly smaller during SWS than during FWS (open circles, p < 0.01; open triangles, p < 0.05; two-tailed t test). Cross marks indicate that the value was not significantly different between the two states.
To examine state-dependent changes in granule-to-mitral dendrodendritic inhibition directly, we simultaneously recorded intracellular LOT-evoked IPSPs and neocortical EEG. In a representative mitral cell, LOT stimulation elicited an antidromic spike and a large IPSP (Fig. 2C). The LOT-evoked IPSP tended to be larger and longer during SWS than during FWS. In seven mitral cells, we obtained stable intracellular recordings that lasted for >6 min and compared the averaged IPSP amplitude (Fig. 2D1), IPSP duration (Fig. 2D2), IPSP decay time (Fig. 2D3), IPSP integral (Fig. 2D4), and resting membrane potential (Fig. 2D5) in each state. Six of the seven mitral cells had significantly higher IPSP amplitudes during SWS than during FWS (p < 0.05, two-tailed t test). In addition, IPSP duration increased during SWS in four cells, IPSP decay time was longer during SWS than during FWS in six cells (p < 0.05, two-tailed t test), and in six cells the value of IPSP integral was larger during SWS than during FWS (p < 0.05, two-tailed t test). Resting membrane potential was slightly more hyperpolarized during SWS in four cells, whereas it was slightly more depolarized during SWS in two cells. Thus, during SWS, resting membrane potential tended to be more hyperpolarized whereas the IPSP amplitude increased significantly in most cells. This suggests that the increase in IPSP is not attributable to a change in the IPSP driving force caused by a change in the resting membrane potential of mitral cells, but to the increase in the granule-to-mitral synaptic inhibition. Using extracellular single-unit recordings from mitral cells, we also found that the duration of the LOT-evoked suppression of spike discharges tended to be longer during SWS than during FWS (data not shown) (n = 4 mitral cells), again indicating that the granule-to-mitral inhibition tend to be longer during SWS than during FWS.
To confirm that the observed state-dependent change in the magnitude of the test LOT-evoked fEPSP was caused by the change in the granule-to-mitral dendrodendritic inhibition, we examined the effects of pharmacological blockers of dendrodendritic synaptic transmission. As illustrated in Figure 1A, the LOT-evoked activation of mitral-to-granule dendrodendritic excitatory synapses activates NMDA receptors on granule cell spines, which results in the activation of granule-to-mitral dendrodendritic inhibitory synapses and the activation of GABAA receptors on mitral cell dendrites (Schoppa et al., 1998; Chen et al., 2000). Thus, blocking the NMDA receptors on granule cell spines or GABAA receptors on mitral cells should suppress the LOT-evoked dendrodendritic inhibition of mitral cells. We made a pool on the dorsal surface of the OB and perfused ACSF, ACSF containing the NMDA receptor antagonist APV (500 μm), or ACSF containing the GABAA receptor antagonist picrotoxin (500 μm) through the pool while we recorded the fEPSP responses to the paired LOT stimulation from the EPL of the dorsal OB. APV application completely eliminated the suppression of the test LOT-evoked fEPSP, Rtest, induced by the conditioning LOT stimulation (Fig. 3A) (n = 5/5). This is consistent with the idea that the blockade of the NMDA receptors on granule cells prevents conditioning LOT-evoked activation of mitral-to-granule excitatory synapses from activating granule-to-mitral inhibitory synapses, resulting in the diminished suppression of the test LOT-induced fEPSP. Picrotoxin also completely eliminated the suppression of the test LOT-evoked fEPSP (Fig. 3B) (n = 3/4), supporting the idea that conditioning LOT-evoked IPSPs induced by granule-to-mitral dendrodendritic inhibition suppress test LOT-induced fEPSPs.
Figure 3.

Pharmacological blocking of dendrodendritic synaptic interaction abolishes state-dependent change of Rtest. A, Chronological plots of the Rcond (squares) and Rtest (circles) generated by paired LOT stimulation during ACSF perfusion on the dorsal surface of the OB. The ISI was 50 ms. Black circles indicate Rtest during perfusion with ACSF containing APV (NMDA receptor antagonist, 500 μm). APV perfusion increased Rtest to the level of Rcond, indicating that the decrease of Rtest is mediated by NMDA receptors. The bottom trace indicates the neocortical EEG. White bar, FWS; black bar, SWS. B, Chronological plots during perfusion with ACSF containing picrotoxin (GABAA receptor antagonist, 500 μm). Picrotoxin perfusion increased Rtest, indicating that the decrease of Rtest is mediated by GABAA receptors. The bottom trace indicates the neocortical EEG. White bar, FWS; black bar, SWS.
Cholinergic regulation of granule-to-mitral dendrodendritic inhibition in anesthetized rats
The OB receives neuromodulatory inputs from cholinergic neurons in the basal forebrain that show behavioral state-dependent changes in their activity (Manns et al., 2000; Lee et al., 2005). This raises the possibility that the state-dependent change in the dendrodendritic inhibition is caused by the state-dependent change in the cholinergic input to the OB. To examine this possibility, we perfused a cholinergic antagonist and agonist over the dorsal surface of the OB using the perfusion method described above. Blocking the muscarinic acetylcholine receptors with (−)-scopolamine hydrobromide (300 μm) increased the suppression of Rtest measured during FWS to the level of suppression of Rtest measured during SWS, so that the state-dependent alternating change in the amplitude of Rtest disappeared (Fig. 4A1–B). However, scopolamine had little effect on Rcond. In all three rats examined, scopolamine perfusion caused a significant decrease in the Rtest/Rcond ratio measured during FWS (p < 0.01) (Fig. 4C). The results are consistent with the idea that the enhanced cholinergic inputs suppress the granule-to-mitral dendrodendritic inhibition more during FWS than during SWS.
Figure 4.

Cholinergic input regulates granule-to-mitral inhibition. A1, Field potential responses in the EPL evoked by paired LOT stimulation during FWS before (3 red traces) and during (3 black traces) perfusion with scopolamine (muscarinic acetylcholine receptors antagonist, 300 μm) are overlaid. The ISI was 50 ms. Note that Rtest showed a large amount decrease during scopolamine perfusion. A2, Field potential responses to paired LOT stimulation during SWS before (3 blue traces) and during (3 black traces) scopolamine perfusion are overlaid. B, Chronological plots of Rcond (squares) and Rtest (circles) to paired LOT stimulation during ACSF perfusion on the dorsal surface of the OB. The colors of the circles indicate the brain state: red, FWS; blue, SWS; white, transient state. Scopolamine perfusion decreased Rtest during FWS to the level of Rtest during SWS, indicating that granule-to-mitral inhibition is regulated by muscarinic acetylcholine receptors. The bottom trace indicates the neocortical EEG. Red bar, FWS; blue bar, SWS. C, Summary plot of the averaged ratio (Rtest/Rcond) of paired LOT stimulation before and during scopolamine perfusion (n = 3). Filled circles, p < 0.01; filled triangles, p < 0.05; cross marks, no significant difference; two-tailed t test. D1, Field potential responses to paired LOT stimulation during FWS before (3 red traces) and during (3 black traces) perfusion with carbachol (nonselective acetylcholine receptor agonist, 500 μm) are overlaid. D2, Field potential responses to paired LOT stimulation during SWS before (3 blue traces) and during (3 black traces) carbachol perfusion are overlaid. Note that Rtest increased during carbachol perfusion. E, Chronological plots of Rcond (squares) and Rtest (circles) to paired LOT stimulation during ACSF perfusion on the dorsal surface of the OB. Carbachol perfusion increased Rtest during both FWS and SWS, indicating that granule-to-mitral inhibition is suppressed by cholinergic input. The bottom trace is the neocortical EEG. F, Summary plot of the averaged ratio of paired LOT stimulation before and during carbachol perfusion (n = 3). Filled circles, p < 0.01; two-tailed t test.
In accordance with the idea that the cholinergic inputs suppress the granule-to-mitral dendrodendritic inhibition, perfusion of a nonselective acetylcholine receptor agonist, carbachol (500 μm), diminished the suppression of Rtest such that the state-dependent alternating change in the degree of suppression of Rtest was not detectable (Fig. 4D1–E). In all three rats examined, carbachol perfusion caused a significant increase in the Rtest/Rcond ratio (p < 0.01) (Fig. 4F). These results are also consistent with the idea that the state-dependent change in the cholinergic input to the OB causes a state-dependent change in the granule-to-mitral inhibition via muscarinic acetylcholine receptors.
State-dependent changes in the frequency of oscillatory local field potentials in anesthetized rats
During the spontaneous inhalation of room air or during odor stimulation, the OB shows prominent and characteristic OLFPs (30–80 Hz) that reflect synchronized periodic synaptic inputs from mitral cells to granule cells (Eeckman and Freeman, 1990; Shepherd et al., 2004; Lagier et al., 2007). Because granule-to-mitral dendrodendritic synaptic inhibition contributes to the generation of the synchronized oscillatory activity (Shepherd, 1972; Schoppa, 2006), we hypothesized that if the internal state of the brain modulates the dendrodendritic synaptic inhibition, it would also modulate the property of OLFPs.
To examine this possibility, we recorded OLFPs in both the EPL and GCL of urethane-anesthetized rats during the spontaneous inhalation of room air (Fig. 5A1) and checked whether there was a state-dependent change in the frequency of the OLFPs. The cross-correlogram between OLFPs in the EPL and GCL showed that these OLFPs had negative correlation both during FWS and during SWS (Fig. 5A2), suggesting that granule cells extending their dendrites from the GCL to the EPL participate in generating the OLFPs (Shepherd et al., 2004). A power spectrum analysis of the OLFPs showed a large peak at a frequency of 42 Hz (half-width ranged between 40 and 46 Hz) during SWS (Fig. 5A3) and a smaller peak at a much higher frequency (65 Hz, half-width ranged between 59 and 66 Hz) during FWS. The change in the frequency of the OLFP is therefore precisely in synchrony with the alternation of the neocortical EEG between FWS and SWS, as exemplified in Figure 5B. In all rats examined (n = 10 animals), the frequency of the peak power of the OLFP was higher during FWS (64 Hz in average, half-width ranged between 58 and 70 Hz) than during SWS (42 Hz in average, half-width ranged between 36 and 49 Hz; p < 0.001) (Fig. 5C).
Because precisely timed granule-to-mitral dendrodendritic inhibition plays a key role in generating the synchronized oscillatory activity of mitral cells (Kashiwadani et al., 1999; Schoppa, 2006), the state-dependent change in the magnitude and duration of granule-to-mitral inhibition is consistent with the state-dependent change in the frequency of the OLFPs. The enhanced granule-to-mitral synaptic inhibition during SWS would induce larger and longer IPSPs in mitral cells, resulting in OLFPs of lower frequency. In contrast, decreased granule-to-mitral inhibition during FWS may cause weaker and shorter IPSPs in mitral cells resulting in a higher frequency of the OLFPs.
To further examine these possibilities, we recorded spike discharges of mitral cells during the spontaneous inhalation of room air (Fig. 6A) and compared the periodic nature of the spike discharges of mitral cells during FWS and SWS. The spike discharges of mitral cells were in phase with the OLFPs both during FWS and during SWS (Fig. 6B), and typically occurred during the peak of the negativity and the rising phase of the OLFP in the GCL (observation in six mitral cells). In accordance with the higher-frequency oscillation of the local potential during FWS than during SWS, we observed a state-dependent change in the frequency of periodic spike discharges of mitral cells. An autocorrelation analysis showed that most mitral cells (four cells of five cells examined in detail) tended to fire periodically at a higher frequency (67 Hz) during FWS than during SWS (56 Hz) (Fig. 6C). This observation is also consistent with the idea that enhanced granule-to-mitral synaptic inhibition during SWS induces longer IPSPs in mitral cells, resulting in a lower frequency of OLFPs.
Figure 6.
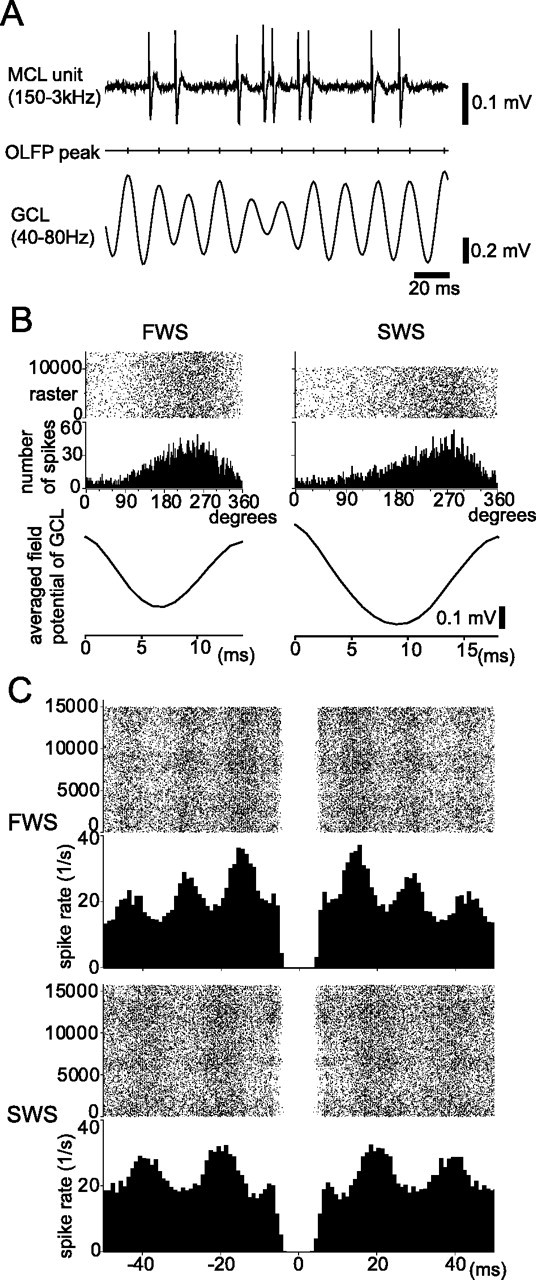
State-dependent change in the oscillatory spike discharges of mitral cells. A, Simultaneous recordings of mitral cell spike activity (top trace) and OLFPs in the GCL (bottom trace) during the spontaneous respiration of room air. As a reference for the phase histogram of mitral cell firing in B, the positive peaks of OLFP are noted (middle trace). B, Raster plots of spike discharges (top traces) and corresponding histograms (phase histogram, middle) are shown in relation to the phase of the OLFP (bottom trace, one averaged cycle of the OLFP). Both during FWS (left) and during SWS (right), this mitral cell fired mostly in phase with the OLFP. Note that the duration of one cycle of the oscillation is longer during SWS than during FWS. C, Spike autocorrelogram of the spike discharges of a mitral cell during FWS (recorded for 800 s) and during SWS (800 s). The highest peak of the autocorrelogram is located at 15 ms (67 Hz) during FWS and at 18 ms (56 Hz) during SWS.
State-dependent multilevel change in granule-to-mitral dendrodendritic inhibition in behaving rats
We next examined whether behavioral states also regulate granule-to-mitral dendrodendritic synaptic inhibition in freely behaving rats. We recorded LOT-evoked field potentials in the GCL of the OB of freely behaving rats using electrodes implanted in the GCL (Figs. 7). We classified behavioral states into five different categories (awake moving, awake immobility, light sleep, slow-wave sleep, and REM sleep states) (Fig. 7A) based on the neck muscle EMG (Fig. 7B, top traces), neocortical EEG (Fig. 7B, bottom traces), and the behavior of the rats. We compared the response to paired LOT stimulation recorded in the GCL to estimate the magnitude of granule-to-mitral inhibition in each behavioral state (Fig. 7C). For stable recording in freely behaving animals, we recorded evoked field potentials in the GCL of the OB, so the large positive deflection of the evoked field potentials would also reflect mitral-to-granule excitatory synaptic inputs. We found that the amplitude of the response to the test stimulus was the smallest during slow-wave sleep.
The amplitudes of Rcond and Rtest during sleep-wake cycles are plotted in Figure 7D. Changes in behavioral state caused little change in the field potential responses to the conditioning LOT stimulation (Fig. 7E1, Rcond), whereas it induced large and multilevel changes in the amplitudes of the responses to the test LOT stimulation (Fig. 7E2, Rtest). Thus, the ratio (Rtest/Rcond) was also the smallest during slow-wave sleep state and was successively larger during the light sleep, awake immobility, and awake moving states (Fig. 7E3). The Rtest and Rtest/Rcond ratio during REM sleep state were similar to that during light sleep state. In all six animals examined, the amplitude of Rtest and the Rtest/Rcond ratio were the smallest during slow-wave sleep state and became successively larger during the light sleep, awake immobility, and awake moving states (supplemental Fig. 1A2,A3, available at www.jneurosci.org as supplemental material). These results suggest that granule-to-mitral inhibition was the largest during slow-wave sleep state, and successively smaller during light sleep, awake immobility, and awake moving states. We also examined whether the frequency of OLFP changes in state-dependent manner in freely behaving animals. We compared the power of 60–90 Hz range OLFP during awake moving state with that during slow-wave sleep state. In all six animals, 60–90 Hz power of OLFP was significantly larger during awake moving state than during slow-wave sleep state (supplemental Fig. 1B, available at www.jneurosci.org as supplemental material) (p < 0.001, two-tailed t test). This result suggests that the probability of occurrence of high-frequency gamma-range OLFP is higher during awake moving state than during slow-wave sleep state, and is also consistent with the idea that during the awake moving state, higher-frequency of OLFP occurs via the partial suppression of granule-to-mitral inhibition. These results provide evidence that behavioral state-dependent changes of granule-to-mitral inhibition and synchronized oscillatory activity occur not only in urethane-anesthetized animals but also in freely behaving animals.
Discussion
State-dependent changes in granule-to-mitral dendrodendritic synaptic inhibition
An overwhelming majority of synapses in the EPL of the OB are dendrodendritic reciprocal synapses between granule cell spines and mitral/tufted cell dendrites (Shepherd et al., 2004), suggesting that dendrodendritic synapses have a dominant role in information processing in the OB. The present results provide evidence that granule-to-mitral dendrodendritic synaptic inhibition is controlled not only by previous synaptic activity (Nakanishi, 1995; Lüscher and Keller, 2004), but also by behavioral state, and that the cholinergic system is a strong candidate for the regulation of the granule-to-mitral inhibition in a state-dependent manner (Fig. 8). The dendrodendritic synaptic inhibition, frequency of OLFPs, and periodic discharges of mitral cells in the OB all shifted in synchrony with shifts in the brain states. Under urethane anesthesia, we observed stronger and longer granule-to-mitral inhibition and lower frequencies of OLFPs and periodic spike discharges of mitral cells during SWS. An increase in the magnitude and duration of granule-to-mitral inhibition during SWS would result in the elongation of each cycle of the oscillation and thus a decrease in the frequency of the OLFPs and the periodic spike discharges of mitral cells. Furthermore, in freely behaving rats, the dendrodendritic inhibition was the largest during slow-wave sleep state. The multilevel behavioral state-dependent changes in granule-to-mitral inhibition suggest that the magnitude of recurrent inhibition and lateral inhibition of mitral and tufted cells differs among distinct behavioral states. The present results thus suggest that the OB network containing the dendrodendritic reciprocal synapses can produce distinct synchronized firing patterns of output neurons in accordance with the state-dependent change in the granule-to-mitral dendrodendritic inhibition and engage in distinct information processing modes that reflect diverse behavioral states.
Figure 8.

Schematic diagram of state-dependent cholinergic neuromodulation in the OB and piriform cortex (PC). During awake states and FWS (left), high levels of cholinergic input partially suppress granule-to-mitral synaptic inhibition (filled arrows), but not mitral-to-granule synaptic excitation (open arrows at dendrodendritic synapses). In the PC, which is a part of olfactory cortex, high levels of cholinergic input partially and presynaptically suppress recurrent collateral inputs (blue), but not mitral axon inputs (green), to pyramidal cells. During the slow-wave sleep state and SWS (right), low levels of cholinergic inputs release the partial suppression of granule-to-mitral inhibition in the OB and the partial suppression of recurrent collateral inputs in the PC. The broken arrow indicates possible spread of activation from one spine to neighboring spines. Each type of square indicates one type of receptor. Open arrows, Excitatory synapses; closed arrows, inhibitory synapses.
We previously reported state-dependent sensory gating in the olfactory cortex and noted that changes in behavioral state caused little change in the average magnitude of mitral cell responses to odorants (Murakami et al., 2005). The present results indicate that the oscillatory spike discharges of the mitral cells change in a state-dependent manner (Fig. 6). The change in the synchronized oscillatory activity of mitral cells may play a key role in the state-dependent gating in the olfactory cortex (Murakami et al., 2005), and in the different mitral cell responses to odorants in anesthetized mice and awake mice (Rinberg et al., 2006).
Intracellular recording experiments confirmed the state-dependent change in the magnitude of LOT-evoked IPSPs (Fig. 2C), although the observed change in the IPSP magnitude was relatively small compared with the change in Rtest during paired LOT stimulation. Intracellular recordings from the mitral cell soma can effectively record IPSPs induced at the soma or proximal dendrites, but may not effectively record IPSPs induced at distal parts of the long lateral dendrites of mitral cells. We speculate that changes in the amplitude and duration of IPSPs in the lateral dendrites affect the spread of activation along the lateral dendrites. This, in turn, greatly influences all of the mitral-to-granule synapses located on distal parts of the lateral dendrites and therefore the magnitude of Rtest.
The cholinergic system sets the dynamic states in the OB
The present results show that the state-dependent change in cholinergic inputs to the OB plays a pivotal role in the state-dependent change in granule-to-mitral inhibition. The cholinergic system has neuromodulatory effects on almost every region of the brain (Everitt and Robbins, 1997), but targets its major influence to selected synapses in each region. In the hippocampus, it has been suggested that high levels of acetylcholine during active waking set the appropriate conditions in the hippocampal neuronal circuit for encoding new information from the entorhinal cortex; this is accomplished by partially suppressing the recurrent excitatory connections in CA3 and the Schaffer collateral synapses in CA1 (Hasselmo, 1999). In contrast, the lower levels of acetylcholine during the slow-wave sleep state release this suppression and may allow a stronger spread of activity within the hippocampus and a stronger output from the hippocampus to the entorhinal cortex.
In the OB, high levels of acetylcholine during awake states and FWS may partially suppress the granule-to-mitral synaptic inhibition, but not the mitral-to-granule synaptic excitation. The partial suppression of granule-to-mitral inhibition may optimize the dendrodendritic synaptic interactions to generate synchronized oscillatory activity in mitral cells within an appropriate range of frequencies. The precisely timed synchronized activity of mitral cells associated with different glomeruli is presumably critical during awake states for effectively activating olfactory cortex neurons that function as coincidence detectors (Kashiwadani et al., 1999; Mori et al., 1999; Schoppa, 2006; Yoshida and Mori, 2007).
Because synaptic inhibition from granule cells to mitral cell lateral dendrites may block the spread of action potentials along the lateral dendrites (Xiong and Chen, 2002), the present results suggest that the spread of spikes and the concomitant spread of activation of mitral-to-granule synapses along the lateral dendrites are regulated in a state-dependent manner. Partial suppression of granule-to-mitral inhibition caused by high cholinergic tone during awake states might recruit an appropriate number of mitral cells to synchronize their activity. In contrast, lower levels of acetylcholine during the slow-wave sleep state release the partial suppression of granule-to-mitral inhibition. During the slow-wave sleep state or SWS with limited olfactory sensory inputs, neuronal circuits in the OB may not be processing the olfactory sensory inputs, but rather may be receiving synaptic inputs from centrifugal fibers from the olfactory cortex.
In the piriform cortex, acetylcholine partially and presynaptically suppress associational fiber excitatory synapses but not mitral axon excitatory synapses on pyramidal cells during awake states (Hasselmo and Bower, 1992). During SWS with low levels of acetylcholine, the olfactory cortex is isolated from the olfactory sensory inputs (Murakami et al., 2005) and is in the mode of slow-wave oscillation presumably generated by release of the cholinergic suppression of recurrent association fiber inputs to pyramidal cells. In fact, we observed respiration rhythm-independent slow-wave activity both in the olfactory cortex and in the OB during slow-wave sleep (Y. Tsuno and H. Manabe, unpublished observation), suggesting that the centrally generated slow-wave oscillation travels from the olfactory cortex to the OB during the slow-wave sleep state. Thus, the cholinergic system may coordinate a shift in the information processing mode in the olfactory cortex and OB.
It remains unanswered whether the acetylcholine regulates the dendrodendritic inhibition by directly affecting the granule cells or affecting other types of bulbar neurons. A recent in vitro study reported that activation of pirenzepine-sensitive M1 receptors potentiates the excitability of granule cells by decreasing afterhyperpolarization and augmenting afterdepolarization (Pressler et al., 2007). Thus, although cholinergic input potentiates granule cell excitability, it causes suppression of granule-to-mitral inhibition. Another in vitro study showed multiple and opposing effect of cholinergic input to the OB (Castillo et al., 1999), suggesting that cholinergic input has several different targets within the neuronal circuits of the OB in addition to regulating the granule-to-mitral dendrodendritic synapses.
Possible functional significance of enhanced granule-to-mitral inhibition during the slow-wave sleep state
A characteristic feature of dendrodendritic reciprocal synapses is that the postsynaptic machinery at the mitral-to-granule excitatory synapse can directly influence the presynaptic machinery for GABA release at the granule-to-mitral inhibitory synapse. In fact, calcium influx through NMDA receptors into the granule cell spine can directly trigger the presynaptic release of GABA without the activation of voltage-gated Ca2+ channels at the presynaptic spine (Isaacson and Strowbridge, 1998; Schoppa et al., 1998; Chen et al., 2000; Egger et al., 2005). Thus, a possible reason for the enhancement of the granule-to-mitral inhibition is the enhancement of the intracellular Ca2+ concentration at the granule cell spines during sleep states. The elevation of Ca2+ might be critical for plastic changes at the dendrodendritic synapses in the main OB. Because the formation of olfactory and pheromonal memories involves long-lasting plastic changes at dendrodendritic reciprocal synapses in the main and accessory OBs, respectively (Kaba and Nakanishi, 1995; Brennan and Keverne, 1997), the enhanced granule-to-mitral inhibition might be relevant to the long-lasting plasticity of dendrodendritic synapses associated with olfactory memory during slow-wave sleep. Odor learning induces a substantial increase in inhibitory neurotransmission (Wilson et al., 1987; Brennan and Keverne, 1997). In addition, the formation and persistence of pheromonal memories have been associated with an increase in the length of the postsynaptic densities of the dendrodendritic synapses between mitral cells and granule cells in the accessory OB (Matsuoka et al., 2004).
Recent in vitro study reported state-dependent insertion of GABAA receptors in the pyramidal cells of the rat visual cortex (Kurotani et al., 2008). Thus, state-dependent insertion or modulation of GABAA receptors of the postsynaptic membrane (Gaiarsa et al., 2002; Jacob et al., 2008) of mitral cells might explain our results of state-dependent change of granule-to-mitral inhibition. Additional studies are necessary to systematically examine the time course and cellular mechanisms of the state-dependent change in the granule-to-mitral dendrodendritic synaptic inhibition during olfactory learning and subsequent sleep states in behaving animals.
Dendrodendritic reciprocal synapses in the OB provide a simple and excellent model system with which to study the cellular and circuit mechanisms for behavioral state-dependent memory encoding and consolidation.
Footnotes
This work was supported by a Grant-in-Aid for Scientific Research on Priority Areas from Ministry of Education, Culture, Sports, Science, and Technology, Japan and a Grant-in-Aid for Scientific Research (S) from the Japan Society for the Promotion of Science (JSPS). Y.T. was supported by JSPS Research Fellowships. We thank M. Murakami, H. Manabe, M. Yamaguchi, H. Nagao, I. Yoshida, S. Nagayama, and the members of the Department of Physiology at The University of Tokyo for valuable discussions and comments. We also thank T. Kato and K. Nakao for technical advice and W. R. Chen for critical comments on this manuscript and valuable advice.
References
- Balatoni B, Détári L. EEG related neuronal activity in the pedunculopontine tegmental nucleus of urethane anaesthetized rats. Brain Res. 2003;959:304–311. doi: 10.1016/s0006-8993(02)03768-x. [DOI] [PubMed] [Google Scholar]
- Brennan PA, Keverne EB. Neural mechanisms of mammalian olfactory learning. Prog Neurobiol. 1997;51:457–481. doi: 10.1016/s0301-0082(96)00069-x. [DOI] [PubMed] [Google Scholar]
- Buzsáki G. Two-stage model of memory trace formation: a role for “noisy” brain states. Neuroscience. 1989;31:551–570. doi: 10.1016/0306-4522(89)90423-5. [DOI] [PubMed] [Google Scholar]
- Castillo PE, Carleton A, Vincent JD, Lledo PM. Multiple and opposing roles of cholinergic transmission in the main olfactory bulb. J Neurosci. 1999;19:9180–9191. doi: 10.1523/JNEUROSCI.19-21-09180.1999. [DOI] [PMC free article] [PubMed] [Google Scholar]
- Chen WR, Xiong W, Shepherd GM. Analysis of relations between NMDA receptors and GABA release at olfactory bulb reciprocal synapses. Neuron. 2000;25:625–633. doi: 10.1016/s0896-6273(00)81065-x. [DOI] [PubMed] [Google Scholar]
- Crespo C, Blasco-Ibáñez JM, Brinon JG, Alonso JR, Domínguez MI, Martínez-Guijarro FJ. Subcellular localization of m2 muscarinic receptors in GABAergic interneurons of the olfactory bulb. Eur J Neurosci. 2000;12:3963–3974. doi: 10.1046/j.1460-9568.2000.00289.x. [DOI] [PubMed] [Google Scholar]
- Détári L, Semba K, Rasmusson DD. Responses of cortical EEG-related basal forebrain neurons to brainstem and sensory stimulation in urethane-anaesthetized rats. Eur J Neurosci. 1997;9:1153–1161. doi: 10.1111/j.1460-9568.1997.tb01469.x. [DOI] [PubMed] [Google Scholar]
- Eeckman FH, Freeman WJ. Correlations between unit firing and EEG in the rat olfactory system. Brain Res. 1990;528:238–244. doi: 10.1016/0006-8993(90)91663-2. [DOI] [PubMed] [Google Scholar]
- Egger V, Svoboda K, Mainen ZF. Dendrodendritic synaptic signals in olfactory bulb granule cells: local spine boost and global low-threshold spike. J Neurosci. 2005;25:3521–3530. doi: 10.1523/JNEUROSCI.4746-04.2005. [DOI] [PMC free article] [PubMed] [Google Scholar]
- Everitt BJ, Robbins TW. Central cholinergic systems and cognition. Annu Rev Psychol. 1997;48:649–684. doi: 10.1146/annurev.psych.48.1.649. [DOI] [PubMed] [Google Scholar]
- Friedberg MH, Lee SM, Ebner FF. Modulation of receptive field properties of thalamic somatosensory neurons by the depth of anesthesia. J Neurophysiol. 1999;81:2243–2252. doi: 10.1152/jn.1999.81.5.2243. [DOI] [PubMed] [Google Scholar]
- Gaiarsa JL, Caillard O, Ben-Ari Y. Long-term plasticity at GABAergic and glycinergic synapses: mechanisms and functional significance. Trends Neurosci. 2002;25:564–570. doi: 10.1016/s0166-2236(02)02269-5. [DOI] [PubMed] [Google Scholar]
- Hasselmo ME. Neuromodulation: acetylcholine and memory consolidation. Trends Cogn Sci. 1999;3:351–359. doi: 10.1016/s1364-6613(99)01365-0. [DOI] [PubMed] [Google Scholar]
- Hasselmo ME, Bower JM. Cholinergic suppression specific to intrinsic not afferent fiber synapses in rat piriform (olfactory) cortex. J Neurophysiol. 1992;67:1222–1229. doi: 10.1152/jn.1992.67.5.1222. [DOI] [PubMed] [Google Scholar]
- Ichikawa T, Hirata Y. Organization of choline acetyltransferase-containing structures in the forebrain of the rat. J Neurosci. 1986;6:281–292. doi: 10.1523/JNEUROSCI.06-01-00281.1986. [DOI] [PMC free article] [PubMed] [Google Scholar]
- Isaacson JS, Strowbridge BW. Olfactory reciprocal synapses: dendritic signaling in the CNS. Neuron. 1998;20:749–761. doi: 10.1016/s0896-6273(00)81013-2. [DOI] [PubMed] [Google Scholar]
- Jacob TC, Moss SJ, Jurd R. GABA(A) receptor trafficking and its role in the dynamic modulation of neuronal inhibition. Nat Rev Neurosci. 2008;9:331–343. doi: 10.1038/nrn2370. [DOI] [PMC free article] [PubMed] [Google Scholar]
- Kaba H, Nakanishi S. Synaptic mechanisms of olfactory recognition memory. Rev Neurosci. 1995;6:125–141. doi: 10.1515/revneuro.1995.6.2.125. [DOI] [PubMed] [Google Scholar]
- Kashiwadani H, Sasaki YF, Uchida N, Mori K. Synchronized oscillatory discharges of mitral/tufted cells with different molecular receptive ranges in the rabbit olfactory bulb. J Neurophysiol. 1999;82:1786–1792. doi: 10.1152/jn.1999.82.4.1786. [DOI] [PubMed] [Google Scholar]
- Kurotani T, Yamada K, Yoshimura Y, Crair MC, Komatsu Y. State-dependent bidirectional modification of somatic inhibition in neocortical pyramidal cells. Neuron. 2008;57:905–916. doi: 10.1016/j.neuron.2008.01.030. [DOI] [PMC free article] [PubMed] [Google Scholar]
- Lagier S, Panzanelli P, Russo RE, Nissant A, Bathellier B, Sassoè-Pognetto M, Fritschy JM, Lledo PM. GABAergic inhibition at dendrodendritic synapses tunes gamma oscillations in the olfactory bulb. Proc Natl Acad Sci U S A. 2007;104:7259–7264. doi: 10.1073/pnas.0701846104. [DOI] [PMC free article] [PubMed] [Google Scholar]
- Lee MG, Hassani OK, Alonso A, Jones BE. Cholinergic basal forebrain neurons burst with theta during waking and paradoxical sleep. J Neurosci. 2005;25:4365–4369. doi: 10.1523/JNEUROSCI.0178-05.2005. [DOI] [PMC free article] [PubMed] [Google Scholar]
- Lüscher B, Keller CA. Regulation of GABAA receptor trafficking, channel activity, and functional plasticity of inhibitory synapses. Pharmacol Ther. 2004;102:195–221. doi: 10.1016/j.pharmthera.2004.04.003. [DOI] [PubMed] [Google Scholar]
- Manns ID, Alonso A, Jones BE. Discharge properties of juxtacellularly labeled and immunohistochemically identified cholinergic basal forebrain neurons recorded in association with the electroencephalogram in anesthetized rats. J Neurosci. 2000;20:1505–1518. doi: 10.1523/JNEUROSCI.20-04-01505.2000. [DOI] [PMC free article] [PubMed] [Google Scholar]
- Matsuoka M, Kaba H, Moriya K, Yoshida-Matsuoka J, Costanzo RM, Norita M, Ichikawa M. Remodeling of reciprocal synapses associated with persistence of long-term memory. Eur J Neurosci. 2004;19:1668–1672. doi: 10.1111/j.1460-9568.2004.03271.x. [DOI] [PubMed] [Google Scholar]
- McLean JH, Shipley MT. Serotonergic afferents to the rat olfactory bulb: I. Origins and laminar specificity of serotonergic inputs in the adult rat. J Neurosci. 1987;7:3016–3028. doi: 10.1523/JNEUROSCI.07-10-03016.1987. [DOI] [PMC free article] [PubMed] [Google Scholar]
- McLean JH, Shipley MT, Nickell WT, Aston-Jones G, Reyher CK. Chemoanatomical organization of the noradrenergic input from locus coeruleus to the olfactory bulb of the adult rat. J Comp Neurol. 1989;285:339–349. doi: 10.1002/cne.902850305. [DOI] [PubMed] [Google Scholar]
- Mori K, Takagi SF. An intracellular study of dendrodendritic inhibitory synapses on mitral cells in the rabbit olfactory bulb. J Physiol. 1978;279:569–588. doi: 10.1113/jphysiol.1978.sp012362. [DOI] [PMC free article] [PubMed] [Google Scholar]
- Mori K, Nagao H, Yoshihara Y. The olfactory bulb: coding and processing of odor molecule information. Science. 1999;286:711–715. doi: 10.1126/science.286.5440.711. [DOI] [PubMed] [Google Scholar]
- Mori K, Takahashi YK, Igarashi KM, Yamaguchi M. Maps of odorant molecular features in the Mammalian olfactory bulb. Physiol Rev. 2006;86:409–433. doi: 10.1152/physrev.00021.2005. [DOI] [PubMed] [Google Scholar]
- Murakami M, Kashiwadani H, Kirino Y, Mori K. State-dependent sensory gating in olfactory cortex. Neuron. 2005;46:285–296. doi: 10.1016/j.neuron.2005.02.025. [DOI] [PubMed] [Google Scholar]
- Nagayama S, Takahashi YK, Yoshihara Y, Mori K. Mitral and tufted cells differ in the decoding manner of odor maps in the rat olfactory bulb. J Neurophysiol. 2004;91:2532–2540. doi: 10.1152/jn.01266.2003. [DOI] [PubMed] [Google Scholar]
- Nakanishi S. Second-order neurones and receptor mechanisms in visual- and olfactory-information processing. Trends Neurosci. 1995;18:359–364. doi: 10.1016/0166-2236(95)93929-r. [DOI] [PubMed] [Google Scholar]
- Nicoll RA. Inhibitory mechanisms in the rabbit olfactory bulb: dendrodendritic mechanisms. Brain Res. 1969;14:157–172. doi: 10.1016/0006-8993(69)90037-7. [DOI] [PubMed] [Google Scholar]
- Nicoll RA. Pharmacological evidence for GABA as the transmitter in granule cell inhibition in the olfactory bulb. Brain Res. 1971;35:137–149. doi: 10.1016/0006-8993(71)90600-7. [DOI] [PubMed] [Google Scholar]
- Pressler RT, Inoue T, Strowbridge BW. Muscarinic receptor activation modulates granule cell excitability and potentiates inhibition onto mitral cells in the rat olfactory bulb. J Neurosci. 2007;27:10969–10981. doi: 10.1523/JNEUROSCI.2961-07.2007. [DOI] [PMC free article] [PubMed] [Google Scholar]
- Price JL, Powell TP. The synaptology of the granule cells of the olfactory bulb. J Cell Sci. 1970;7:125–155. doi: 10.1242/jcs.7.1.125. [DOI] [PubMed] [Google Scholar]
- Radulovacki M, Virus RM, Djuricic-Nedelson M, Green RD. Adenosine analogs and sleep in rats. J Pharmacol Exp Ther. 1984;228:268–274. [PubMed] [Google Scholar]
- Rall W, Shepherd GM. Theoretical reconstruction of field potentials and dendrodendritic synaptic interactions in olfactory bulb. J Neurophysiol. 1968;31:884–915. doi: 10.1152/jn.1968.31.6.884. [DOI] [PubMed] [Google Scholar]
- Rinberg D, Koulakov A, Gelperin A. Sparse odor coding in awake behaving mice. J Neurosci. 2006;26:8857–8865. doi: 10.1523/JNEUROSCI.0884-06.2006. [DOI] [PMC free article] [PubMed] [Google Scholar]
- Schoppa NE. Synchronization of olfactory bulb mitral cells by precisely timed inhibitory inputs. Neuron. 2006;49:271–283. doi: 10.1016/j.neuron.2005.11.038. [DOI] [PubMed] [Google Scholar]
- Schoppa NE, Kinzie JM, Sahara Y, Segerson TP, Westbrook GL. Dendrodendritic inhibition in the olfactory bulb is driven by NMDA receptors. J Neurosci. 1998;18:6790–6802. doi: 10.1523/JNEUROSCI.18-17-06790.1998. [DOI] [PMC free article] [PubMed] [Google Scholar]
- Shepherd GM. Synaptic organization of the mammalian olfactory bulb. Physiol Rev. 1972;52:864–917. doi: 10.1152/physrev.1972.52.4.864. [DOI] [PubMed] [Google Scholar]
- Shepherd GM, Chen WR, Greer CA. The synaptic organization of the brain. Ed 5. New York: Oxford UP; 2004. Olfactory bulb; pp. 165–216. [Google Scholar]
- Steriade M, McCormick DA, Sejnowski TJ. Thalamocortical oscillations in the sleeping and aroused brain. Science. 1993;262:679–685. doi: 10.1126/science.8235588. [DOI] [PubMed] [Google Scholar]
- Stewart WB, Scott JW. Anesthetic-dependent field potential interactions in the olfactory bulb. Brain Res. 1976;103:487–499. doi: 10.1016/0006-8993(76)90447-9. [DOI] [PubMed] [Google Scholar]
- Takahashi YK, Kurosaki M, Hirono S, Mori K. Topographic representation of odorant molecular features in the rat olfactory bulb. J Neurophysiol. 2004;92:2413–2427. doi: 10.1152/jn.00236.2004. [DOI] [PubMed] [Google Scholar]
- Wilson DA, Sullivan RM, Leon M. Single-unit analysis of postnatal olfactory learning: modified olfactory bulb output response patterns to learned attractive odors. J Neurosci. 1987;7:3154–3162. doi: 10.1523/JNEUROSCI.07-10-03154.1987. [DOI] [PMC free article] [PubMed] [Google Scholar]
- Xiong W, Chen WR. Dynamic gating of spike propagation in the mitral cell lateral dendrites. Neuron. 2002;34:115–126. doi: 10.1016/s0896-6273(02)00628-1. [DOI] [PubMed] [Google Scholar]
- Yokoi M, Mori K, Nakanishi S. Refinement of odor molecule tuning by dendrodendritic synaptic inhibition in the olfactory bulb. Proc Natl Acad Sci U S A. 1995;92:3371–3375. doi: 10.1073/pnas.92.8.3371. [DOI] [PMC free article] [PubMed] [Google Scholar]
- Yoshida I, Mori K. Odorant category profile selectivity of olfactory cortex neurons. J Neurosci. 2007;27:9105–9114. doi: 10.1523/JNEUROSCI.2720-07.2007. [DOI] [PMC free article] [PubMed] [Google Scholar]