Abstract
The onset and vector of orienting behaviors, such as saccades, are controlled by commands that descend from a population of neurons in deep layers of the superior colliculus (dSC). In this study, to characterize the role of the collicular local circuitry that generates the spatiotemporal pattern of command activity in the dSC neuronal population, responses evoked by single-pulse electrical stimulation in superficial layers of the superior colliculus (sSC) were analyzed by a 64-channel field potential recording system (planar electrode, 8 × 8 pattern; 150 μm interelectrode spacing) in slices obtained from 16- to 22-d-old mice. A negative field potential with short latency and short duration spatially restricted to the recording sites in sSC was evoked adjacent to the stimulation site. After bath application of 10 μm bicuculline, the same stimulus induced a large negative field response with long duration that spread from sSC to dSC. The dSC potential initially showed a positive response, presumably because of reversal of the negative potential that originated in sSC, and then a long negative response that spread horizontally as far as 1 mm. These responses disappeared after application of an NMDA receptor antagonist, 2-amino-5-phosphonovelarate, indicating that NMDA receptors have an important role in the generation of these responses. Simultaneous whole-cell patch-clamp recordings showed that the long-lasting negative field potentials corresponded to the depolarization accompanying burst spike activity of SC neurons. The present study revealed an extensive excitatory network in the dSC that may contribute to the generation of activity by a large population of neurons that discharge before a saccade.
Keywords: field potential, patch clamp, signal propagation, slice, burst, saccade
Introduction
The mammalian superior colliculus (SC) plays a pivotal role in the sensory–motor processing responsible for orienting behaviors (Dean et al., 1989). The superficial layers of the SC (sSC) receive retinotopically organized visual inputs (Cynader and Berman, 1972), whereas the deeper layers (dSC) send descending commands for the initiation of orienting movements (Huerta and Harting, 1982; May, 2005). More than three decades ago, studies showed that movement vectors are topographically represented in the dSC (Robinson, 1972; Schiller and Stryker, 1972; Wurtz and Goldberg, 1972) and that this motor map is in register with the map of the visual field in sSC. Since then, a large number of studies were devoted to clarifying the functions of these layers (for review, see Wurtz and Albano, 1980; Sparks, 1986; Fecteau and Munoz, 2006).
Studies demonstrated that the movement fields of individual neurons in dSC are large and coarsely tuned, which indicates that saccades with particular vectors are encoded by a large population of dSC neurons (McIlwain, 1975, 1982; Sparks et al., 1976; Lee et al., 1988). The circuits that organize this activity have been studied in vitro in slice preparations (for review, see Isa and Saito, 2001; Grantyn et al., 1984; Lee et al., 1997, 2007; Isa et al., 1998; Meredith and Ramoa, 1998; Lo and Mize, 2000; Schmidt et al., 2001; Isa, 2002; Isa and Sparks, 2006; Neale and Salt, 2006; Kaneda et al., 2008). Furthermore, profiles of field potential responses at different depths evoked by sSC stimulation were measured by single-electrode recordings in anesthetized rats (Katsuta and Isa, 2003) and monkeys (Nikitin and Isa, 2004). However, these studies were performed using whole-cell recordings from individual neurons or field recording in one plane; hence, the information about the spatial and temporal properties of the whole population of dSC cells remained indirect and limited (Saito and Isa, 2004, 2005).
The in vitro studies did show that single-pulse stimulation of the sSC induces synaptic responses in dSC neurons that are amplified into strong bursting spike responses and long-lasting depolarization when GABAA-mediated inhibition is suppressed (Lee et al., 1997, 2001; Isa et al., 1998; Saito and Isa, 2003).
This functional link between the sSC and dSC was proposed as the circuit responsible for the execution of short-latency orienting behaviors, such as express saccades (Isa, 2002). In this study, we used the MED probe (Oka et al., 1999), in which a 64-channel multielectrode array is attached to the dish on which an SC slice is mounted, to directly measure the spatiotemporal profile of field potentials. We combined this system with whole-cell recordings to clarify the relationship between the field potentials and intracellular potentials of individual cells. First, the results show the utility of this recording technique as well as its limitations. Second, the results reveal the spatiotemporal spread of activity in dSC after the localized stimulation of cells in sSC. This spread of activity within dSC may be responsible for the recruitment of the large population of dSC cells that discharge before a saccade.
Materials and Methods
The experimental protocol was approved by the Animal Research Committee of the National Institute of Natural Science. All efforts were made to minimize both the suffering and number of animals used in this study.
Slice preparations
Coronal, sagittal, or oblique slices (300 μm thick) of the SC were prepared from 16- to 22-d-old C57BL/6 mice. The animals were deeply anesthetized with ether and decapitated. The brains were quickly removed and submerged in ice-cold modified Ringer solution for 4–6 min. The modified Ringer solution contained (in mm) 200 sucrose, 2.5 KCl, 1.25 NaH2PO4, 10 MgSO4 0.5 CaCl2, 26 NaHCO3, and 11 glucose and was bubbled with 95% O2–5% CO2, pH 7.4. Slices were then cut with a Microslicer (DTK-2000; Dosaka) and incubated in standard Ringer solution at room temperature for >1 h before recording. The standard Ringer solution contained (in mm) 125 NaCl, 2.5 KCl, 2 CaCl2, 1 MgCl2, 26 NaHCO3, 1.25 NaH2PO4, and 25 glucose and was bubbled with 95% O2–5% CO2, pH 7.4.
Recordings and analyses
Field potential recording
Preparation of multielectrode array.
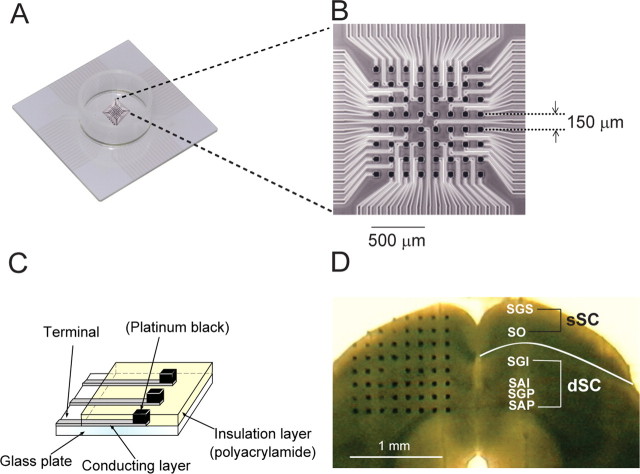
As shown in Figure 1, the MED probe (MED-P5155; Panasonic) consisted of an array of 64 planar microelectrodes, each 50 × 50 μm, arranged in an 8 × 8 pattern with a 150 μm interpolar distance. For sufficient adhesion of the slice to the probe, the surface of the MED probe was treated with 0.1% polyethylenimine (P-3143; Sigma) in 25 mm borate buffer, pH 8.4, for 8 h at room temperature. The probe surface was rinsed three times with sterile distilled water before use.
Figure 1.
Introduction of the recording system. A, The Multielectrode dish. B, A higher magnification view of an 8 × 8 array of 64 planar microelectrodes with an interpolar distance of 150 μm located at the bottom of the dish. The size of each electrode is 50 × 50 μm. C, The microelectrode structure. The surface of each electrode is coated with platinum black, resulting in a dramatically low impedance (7–10 KΩ). D, Fresh coronal slice of the SC overlying a multielectrode array. The SGS and the SO are in the superficial layer (sSC). The SGI, stratum album intermediale (SAI), stratum griseum profundum (SGP), and stratum album profundum (SAP) are in the dSC.
Electrophysiological recording.
Slices were placed on the center of the MED probe, positioned to cover the 8 × 8 array, on an upright microscope (DM LFS; Leica) and continuously superfused with the standard Ringer solution at 33–34°C. The slices were then left for 15 min to sufficiently attach to the electrode array. A single-planar microelectrode of the 64 available was selected by the 64-switch box and used for stimulation. Bipolar constant current pulses (180 μA, 0.1 ms negative pulse and 0.1 ms positive pulse) were initiated by the data acquisition software (MED64 Condutor 3.1TM; Panasonic). Evoked field potentials at the remaining 63 sites in the SC slices were recorded simultaneously with the multichannel recording system (MED64 system; Panasonic) at a 20 kHz sampling rate. To examine the effects of antagonists, bicuculline methobromide (Bic; 10 μm), 6-cyano-7-nitroquinoxaline-2,3-dione (CNQX; 10 μm), and d-2-amino-5-phosphonovaleric acid (APV; 50 μm) (all from Sigma) were bath perfused.
Current source density analysis.
A two-dimensional current source density (CSD) analysis method was used (Shimono et al., 2002). The field potential responses were recorded with low-pass filtering at 100 Hz. The data were spatially smoothed by 3 × 3-weighted average kernel (0 ⅛ 0, ⅛ ½ ⅛, and 0 ⅛ 0), and the results were convolved with a 3 × 3 Laplacian kernel (0 1 0, 1 −4 1, and 0 1 0) to produce a discrete approximation of the second spatial derivative. The medium was considered ohmic with a homogeneous conductance.
Whole-cell patch-clamp recordings
Electrophysiological recording.
In some experiments, whole-cell patch-clamp recordings were performed under visual control from the neurons in the SC slices simultaneously with the multichannel field potential recordings. Patch pipettes were prepared from borosilicate glass capillaries and were filled with the following internal solution containing (in mm) 150 K-gluconate, 10 KCl, 0.2 EGTA, 2 MgCl2, 2 Na2ATP, 0.5 Na3GTP, 10 HEPES, and 0.1 spermine, pH 7.3. To stain the patch-clamped neurons, biocytin (5 mg/ml; Sigma) was dissolved in the internal solution. The resistance of the electrodes was 4–8 MΩ in Ringer solution. The actual membrane potentials were corrected by the liquid junction potential of −10 mV. The osmolarity of the intrapipette solution was 280–290 mOsm/L. The whole-cell recordings used a patch-clamp amplifier (EPC-7; List) connected through a Digidata1322A analog/digital interface card (Molecular Devices). The data were acquired using a pClamp system (pClamp 8.0; Molecular Devices).
Histological procedures.
After whole-cell recordings, slices were fixed with 4% paraformaldehyde in 0.12 m phosphate buffer, pH 7.4, for more than 2 d at 4°C. After fixation, biocytin-filled neurons were visualized by the ABC method. Details were described previously (Isa et al., 1998).
Results
Effects of sSC stimulation on field potential of different layers
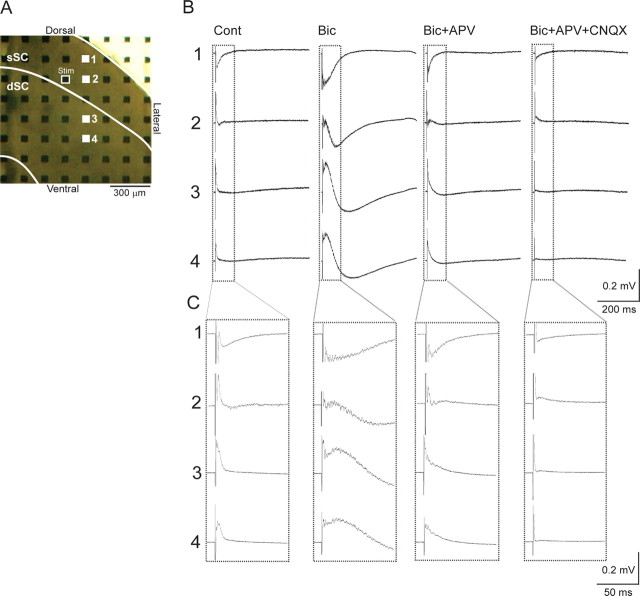
Single-pulse stimulation at 180 μA in the ventral part of the sSC [stratum opticum (SO)] (Fig. 2A, open square) evoked a negative field response (Fig. 2B,C, Cont) with short latency and short duration (latency, 3.05 ± 2.09 ms; duration, 82.37 ± 37.40 ms; n = 32 slices, average ± SD) in the adjacent recording site (in this case, recording electrode 1) just dorsolateral to the stimulation. In comparison, the negative field response was smaller and the latency longer at electrode 2, located ventrally to electrode 1 in the sSC. No clear negative response was observed in the dSC (electrodes 3 and 4). These results indicate that stimulation in the sSC induced excitatory synaptic potentials in the sSC, but that measurable field potentials were not generated in dSC.
Figure 2.
The field responses evoked by stimulation in the sSC. A, The position of microelectrodes on a slice. The boundary between sSC and dSC is indicated by a white line. The electrode outlined in white was the stimulating electrode and the remaining 63 electrodes were recording electrodes. The responses from electrodes 1–4 are shown in B. B, Field potentials from representative electrodes 1–4 elicited by a biphasic pulse (positive 0.1 ms and negative 0.1 ms, 180 μA) to the stimulating electrode under four conditions, control (Cont), 10 μm Bic, 10 μm Bic and 50 μm APV (Bic+APV), and 10 μA Bic, 50 μm APV, and 10 μm CNQX (Bic+APV+CNQX). C, The same records shown within the dotted lines in B, but in a faster time sweep and focused on the events shortly after the electrical stimulation.
In contrast, when 10 μm bicuculline, a GABAA receptor antagonist, was applied, the same stimulation induced much larger and longer negative responses (Fig. 2B,C, Bic) at electrodes 1 and 2 (duration, 121.77 ± 55.95 ms, averaged from responses at recording sites in sSC from 32 slices). In addition, a large positive field response was observed at electrodes 3 and 4 with a latency similar to the negative field response at electrode 1 (Fig. 2C), and at a latency shorter than that of the negative response. At electrode 3, the initial response that was positive and started to decline at a latency of 21 ms, became negative at 64 ms, and lasted for 283 ms. The average duration of responses at recording electrodes in the dSC from 32 slices was 352.10 ± 132.10 ms. Such biphasic, positive–negative field responses were observed also at electrode site 4, but their time course was slower than those at electrode 3. Thus, the negative field responses appeared to have spread gradually within dSC.
These large, long-duration responses were greatly reduced by coapplication of 50 μm APV, an NMDA receptor antagonist (Fig. 2B,C, Bic+APV). The subsequent addition of 10 μm CNQX, an AMPA/kainate receptor antagonist, almost completely suppressed the responses (Fig. 2B,C, Bic+APV+CNQX). The above results were reliably observed in all 32 slices.
Spread of activity over 64-channel recording sites
The evoked responses from all 63 recording electrodes are shown for the control, Bic, and Bic+APV conditions in Figure 3A–C, respectively. The traces at the stimulating electrodes (in the open red squares) were calculated by interpolation from the horizontally adjacent electrodes. To illustrate the spatiotemporal profile of the field potential responses, two-dimensional computed color images were constructed from the 63-channel data and interpolated for display (Fig. 3D–F). Electrical stimulation at sSC (marked with closed white squares) induced negative field potentials with short latencies under control conditions. The stimulation evoked negative responses dorsal to the stimulation site. This may reflect the fact that afferent pathways to the sSC, such as the retinotectal and corticotectal fibers travel in the SO, and ascend through stratum griseum superficiale (SGS) in a ventral to dorsal direction before synapsing with dendrites of the sSC neurons in the dorsal portion of the SGS. Positive field responses were observed ventral to the stimulation site, which represents the current source. The negative field potential in the sSC did not appear to have spread to the dSC. However, after application of 10 μm Bic (Fig. 3E), the same stimulus induced a large negative field response with long duration that spread widely within the dSC. The stimulation initially induced large negative responses across the dorsal portion of the sSC. This region became a strong current sink and the layers ventral to the stimulation site became a huge source of current. Then the negative responses gradually spread within the dSC for ∼60 ms after the stimulation. The activation field was expanded at around the border between the sSC and dSC, and became as wide as 1 mm in the horizontal direction in the dSC. The activation field gradually shifted ventrally in the dSC and disappeared ∼300–500 ms after stimulation. These large, long-lasting responses did not occur in the presence of Bic and 50 μm APV; only a short-latency small response was present in the sSC (Fig. 3F).
Figure 3.
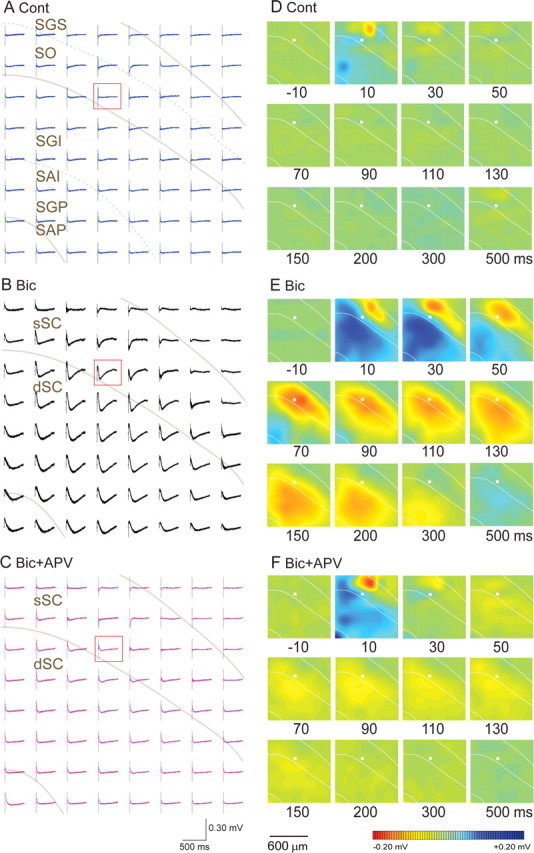
The spatial distribution of the field responses. A–C, The 64-channel field potentials (the same results as those shown in Fig. 2B) in the control, Bic, and Bic+APV conditions, respectively. Gray curved lines indicate the boundary between sSC and dSC and the ventral border of the dSC. Gray curved dotted lines indicate the boundaries between the SGS/SO and SGI/SAI layers. D–F, Computed color images of field potentials from A–C, respectively, demonstrate the spatial distribution of responses at each time point. As indicated in the color bar, negative potentials are in red and positive ones in blue. White lines indicate the dorsal boundary of the SC, boundary between the sSC and dSC, and ventral border of the dSC. The locations of stimulating electrodes are shown by the white squares. Abbreviations are as in Figure 2.
To obtain measures of current sources and sinks of the evoked responses shown in Figure 3, two-dimensional CSD analyses were performed (Fig. 4). The evoked response could be characterized as a current sink-source dipole and the current sink gradually shifted ventrally to the dSC (Fig. 4D). The current sink occupied a narrower range (Fig. 4D) than did the respective field potentials (Fig. 3B). Then, the CSD decreased to baseline shortly after the activation spread into the dSC. In general, CSD analyses are in good agreement with the location of synaptic inputs when the focus of activation is narrow, for instance, in the case of cerebral cortex (Mitzdorf and Singer, 1978). In the present case, however, especially after Bic application, a high-amplitude excitation was induced in a wide area over the sSC and dSC. In such a case, if we take differentiation of the field potentials recorded at adjacent sites, all of which were strongly activated by excitatory input, the result does not properly reflect the areas activated by excitatory synaptic inputs. This appears to be a limitation of the CSD analysis in the present case. Thus, we decided not to use the CSD analysis and applied only field potential analyses in the following sections.
Figure 4.
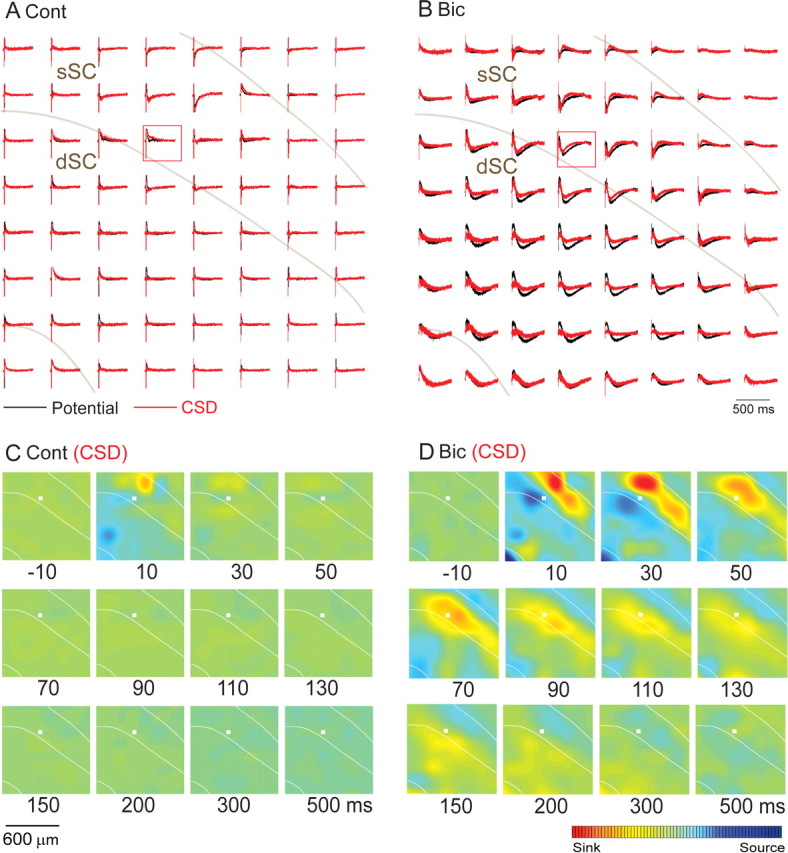
The CSD analysis. A, B, Results of CSD analyses are shown in red traces, whereas the raw field potential data are in black traces under control (A) and Bic (B) conditions. C, D, Computed color images of the CSD results from A and B, respectively. As shown on the color bar, sinks are shown in red and sources in blue.
Relationship between the field recordings and intracellular potentials
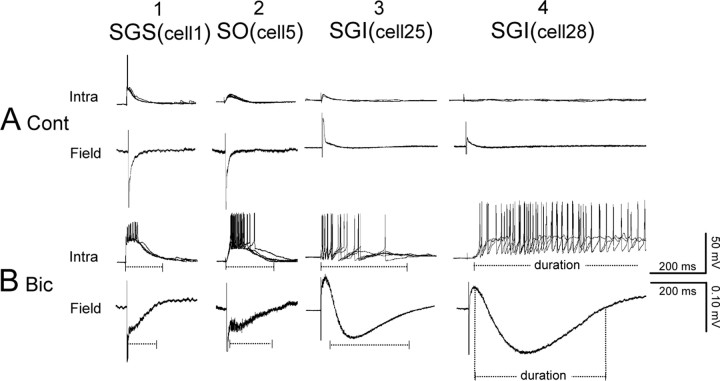
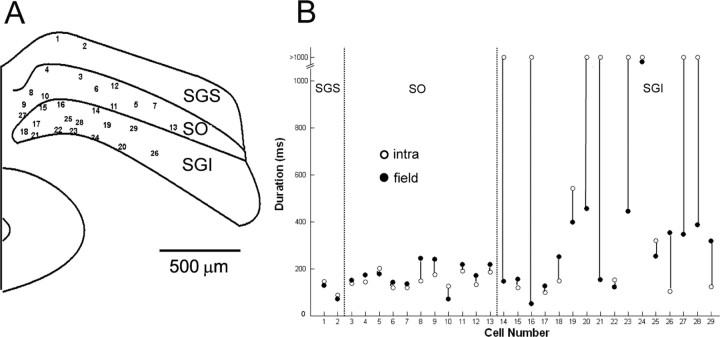
To clarify the relationship between the field responses and intracellular potentials, we analyzed the electrically evoked responses in individual neurons from sSC (in the SGS and the SO) and from dSC [in the stratum griseum intermediale (SGI)] by whole-cell patch-clamp recording simultaneously with the field potential recordings. The slices were stimulated by the planar electrodes located at the dorsal portion of the SGS. Neurons at the edges of the planar electrodes, <50 μm, were randomly selected for recording, and the intracellular potentials were compared with the field recordings. Under control conditions (Fig. 5A), sSC stimulation elicited monosynaptic EPSPs, as judged from their short, fixed latencies (∼3 ms), in both of the two SGS cells recorded in the present study. The field potentials close to this cell exhibited negative potentials with time courses similar to those of the intracellular EPSPs. SGS stimulation also induced monosynaptic EPSPs in all 11 recorded SO neurons. Negative field responses were also induced in the SO, but usually their amplitudes were smaller than those recorded in the SGS. Monosynaptic EPSPs were induced only in a few SGI neurons (2 of 16cells); in most cases, SGS stimulation induced no responses in SGI neurons (14 of 16 cells). As described above (Fig. 2), SGS stimulation induced no field response in the SGI, or only a small, short-latency positive component, which was thought to represent the reversal of the negative response that originated in the SGS. After application of 10 μm Bic, the EPSPs were enhanced and bursting spike responses were induced both in sSC and dSC neurons (Fig. 5B). The duration of depolarizing responses in the SGS and SO neurons roughly corresponded to that of field potential responses recorded at adjacent electrodes. However, the duration of depolarizing responses in SGI neurons varied considerably from cell to cell. Some SGI neurons showed transient bursts and 300 ms depolarizing responses (Fig. 5B, 3), whereas other SGI neurons exhibited long-lasting depolarizations (longer than 1 s) that outlasted the field response (Fig. 5B, 4). It should be pointed out that the latencies of the EPSPs in the SGI neurons were distributed from 2 to 17 ms (n = 16). Thus, excitation of the SGI neurons had already started, while the field potential adjacent to the patch-clamped cell was still in the positive phase. As shown in Figure 5B, panel 4, onset of the EPSPs appeared to correspond to the highest depolarizing point of the field potential. Thus, in subsequent analyses of SGI neurons, we measured the duration of the negative field responses from the start of the decline of the depolarizing phase. In Figure 6, we compared the duration of depolarizing responses of the intracellular potential with that of the negative field responses. The duration of both potentials were similar for responses in the SGS (n = 2) and SO (n = 11), whereas they varied considerably for those in the SGI (n = 16). These various durations of the responses from the SGI neurons might correspond to variations in morphological cell types. Actually, the morphology of SGI neurons was more heterogeneous than that of SGS/SO neurons; however, no clear relationship could be detected between the cell morphology and variations in responses. The results indicated that the SGI neurons consisted of a heterogeneous population and the field responses represent the average of synaptic potentials in the population.
Figure 5.
Representative response pairs showing the comparisons of durations in whole-cell and field recording. The duration of EPSPs (Intra) recorded by patch-clamp were compared with the field potentials (Field) recorded from the electrode nearest the recorded cells in the control (A) and 10 μm Bic conditions (B). The stimulating electrodes were located in the SGS in all slices. These four sample pairs were selected from various locations: 1, SGS; 2, SO; and 3, 4, SGI. The numbers in parentheses indicate the locations of each neuron as shown in Figure 6A.
Figure 6.
Comparisons of response durations in whole-cell and field recordings. A, A schematic illustration showing the location of recorded cells on the slice (29 cells). B, Comparison of response durations of the EPSPs (opened circle) and the negative phase of the field responses (closed circle).
Spread of activity in the parasagittal plane
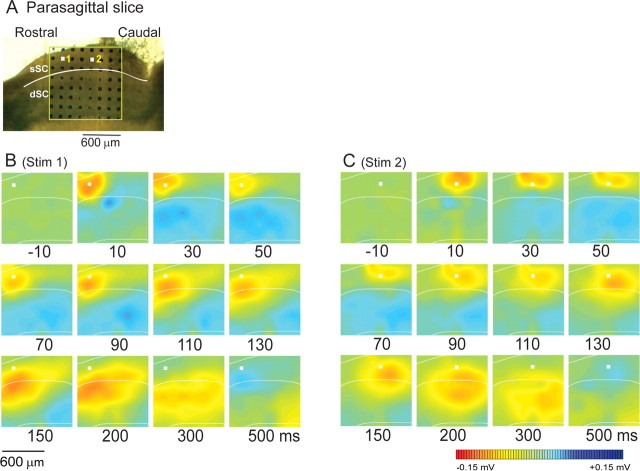
The above results were obtained in coronal slices. Next, we examined the spread of excitation in parasagittal slices of the SC and compared the effects of stimulating rostral and caudal sites in the sSC in the presence of 10 μm Bic (Fig. 7A). When the rostral part of SGS was stimulated (Fig. 7B), the activation spread not only ventrally, but also caudally to the stimulation site, eventually covering the entire rostral–caudal range of the multielectrode array. When the stimulation was applied to a more caudal portion of the SGS (Fig. 7C), the excitation spread ventrally and caudally, activating the extent of the SC circuit caudal to the stimulation. However, the activity did not appear to spread as far in the rostral direction. The parasagittal slices were obtained from both medial and lateral SC, but no differences were observed. Thus, when the SGS was stimulated in parasagittal slices, the activity spread asymmetrically.
Figure 7.
The spread of activity in parasagittal sections. A, The position of multielectrodes on a slice. The boundary between layers (the sSC and the dSC) is indicated by a white line. The white squares 1 and 2 show the stimulating electrodes in B and C, respectively. B, C, Computed color images of field potentials evoked from a biphasic pulse to the Stim 1 and Stim 2 electrodes and recorded from the remaining 63 electrodes in the presence of Bic. Representative images from n = 16 slices are shown.
Oblique slices
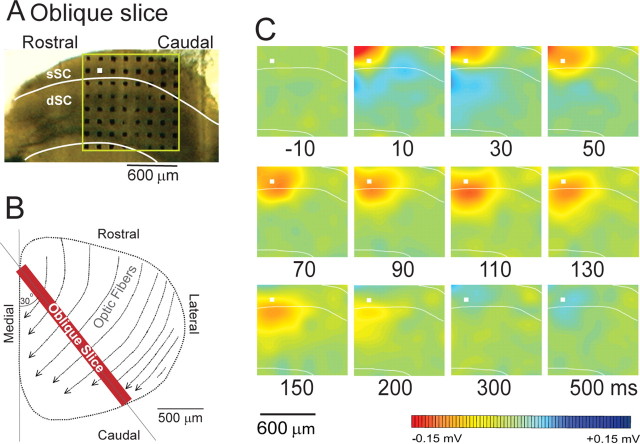
We interpreted the asymmetric spread of activity in the rostral-to-caudal direction in the parasagittal slice to be caused by stimulation of the optic tract, which passed through the optic layer from the rostrolateral to the caudomedial direction (Fig. 8B). To examine this further and to establish a preparation that avoids activating passing axons of the optic tract, we tested oblique slice preparations of SC cut in the rostromedial to caudolateral plane, perpendicular to the direction of the optic fiber axons. When a stimulation pulse was applied to the optic layer in the rostral portion of the slice (Fig. 8A), no rostrocaudal spread of the activation was observed in the presence of Bic in all 12 slices tested, as exemplified in Figure 8C. The area of activation spread only from a dorsal to ventral direction. This observation supported the assumption that in the parasagittal slices, stimulation of the optic layer at the rostral portion of the SC induced activity that spread in a rostral to caudal direction, following the trajectory of the optic fibers.
Figure 8.
The spread of activity in oblique sections (perpendicular to the optic tract). The slice was cut in the oblique direction to avoid an effect of optic fiber stimulation. A, Position of electrode on the slice. B, A schematic illustration of the cutting direction. C, The computed color images of field potentials evoked from a biphasic pulse to the electrodes marked with a white square. Representative images from n = 12 slices are shown.
Discussion
Field potential recordings in SC slices
A previous study of anesthetized rats from our laboratory (Katsuta and Isa, 2003) showed that electrical stimulation of the optic fibers at 2 mA, which activated both Y and W fibers, induced negative field responses in the most dorsal part of the sSC, whereas a reversed positive potential was observed in the ventral part of the sSC and in the dSC. Such a current sink and source relationship might be derived from neurons with cell bodies in the ventral part of the sSC or in the dSC and dendritic arborizations in the dorsal part of the sSC that receive input from the optic tract. These neurons include narrow-field and wide-field vertical cells (Langer and Lund, 1974; Isa and Saito, 2001). In normal controls, no clear negative responses were observed in the dSC. However, when Bic was injected into the dSC, a large, long-lasting negative response was evoked in the dSC that followed a positive potential. A similar pattern of activation was observed in anesthetized macaque monkeys (Nikitin and Isa, 2004). In the present study, field responses with similar profiles were detected by multichannel field potential recordings in slice preparations of the SC. This methodology enabled us to better understand how the effects of a single stimulus pulse in the sSC spreads within the dSC. We demonstrated, for example, that the activation zone of such stimulation spreads >1 mm in the horizontal direction and its center gradually shifts from the dorsal to the ventral portion of the dSC. Thus, spatiotemporal patterns of activity spread could be analyzed in a two-dimensional plane, which is difficult in whole-cell recordings from one or two cells. To understand the actual site of synaptic activation, we performed a two-dimensional CSD analysis; however, although the CSD analysis could narrow the focus of activation, it did not appear to correctly reflect the distribution of activity when the activity spread so widely and homogeneously throughout the network. Therefore, we decided to rely on analyses of field potential profiles. The limitation is that the field potential shows the relative amount of excitation among various locations of the circuits along a particular direction determined by the dendritic geometry, and not the absolute intracellular membrane potentials of neurons at individual locations. For instance, in the present study, after application of Bic, SGS stimulation induced large negative responses in the sSC, which corresponded to the EPSPs generated by the SGS neurons; however, it simultaneously induced large positive responses in the dSC. The positive potential did not indicate that the dSC neurons were concurrently hyperpolarized, but simply that the dSC became the current source of activities in the sSC. In support of this argument, the simultaneous whole-cell recordings indicated that some dSC neurons had already received excitatory synaptic inputs and were depolarized when the field potential adjacent to the patch-clamped cell was still in the positive phase. Thus, the field potential analysis did not always clearly illustrate the onset of excitation in dSC neurons, which seems to be the most important limitation of this approach. However, as shown in Figure 5B, the peaks of the positive potentials, that is, the start of the decline of the positive phase, closely corresponded to the onsets of EPSPs in the dSC neurons. This information might be useful for further improvement of this technique. Except for this limitation, the multichannel field potential recording system is a powerful tool for studying spatiotemporal profiles of the spread of activity in the local circuitry of the SC. Because such a current sink/source relationship occurred in the dorsoventral direction (dorsal negative vs ventral positive) but did not appear to occur in the horizontal direction both in the sSC and dSC or in the adjacent region of the dSC, the distribution of field potential is asymmetric. Moreover, a large negative field response in the dSC never produced a positive field response in the sSC, which might reflect the dendritic geometry of dSC neurons such as the wide field vertical cells as described above.
Complication of electrical stimulation
It was surprising that when the sSC (actually, SO) was stimulated in parasagittal slices, the activity spread extensively in the ventral and caudal directions, but not in the rostral direction (Fig. 7). This asymmetry was not evident in coronal slices. We interpreted this rostrocaudal asymmetry as being attributable to the activation of optic fibers. The optic fibers enter the SC at its rostrolateral part and travel through the SO a rostrolateral to caudomedial trajectory. Therefore, in sagittal slices, electrical stimulation of the sSC activated the optic tract, and the signal spread from rostral to caudal. Moreover, the present result suggested that optic fibers stimulated at the caudal SC do not issue collaterals at the rostral SC. This was further demonstrated in the experiments shown in Figure 8; in the slices cut perpendicularly to the course of the optic tract, the sSC stimulation induced a dorsal-to-ventral spread of activity in a narrow range in the horizontal direction. This interpretation should be confirmed in future studies using other methods of stimulation, for example, by laser uncaging of a caged glutamate compound that selectively activates the cell bodies and dendrites at the sites of stimulation and avoids activation of passing fibers (Helms et al., 2004; Lee et al., 2007). Similar spread of activation in the rostrocaudal direction may also occur in vivo during visually guided saccades. In previous studies, when the rostral portion of the SC, which encodes small amplitude saccades, was stimulated, the evoked saccades tended to be larger than the eccentricity of the response field of the cells at the stimulation sites (Van Opstal et al., 1990). This observation may be explained by the rostral to caudal spread of activation along the optic tract, which results in a more caudal location of the center of activation than the site of stimulation.
Functional implications
The results of the present study have clearly shown that the effect of single-pulse stimulation of the sSC does not excite the neurons in the dSC unless GABAA receptor-mediated inhibition was reduced. Under the latter condition, the same stimulus induces a large and long-lasting excitation of a large population of dSC neurons. Such direct signal transmission from the sSC to the dSC is proposed to occur in the case of the extremely short-latency orienting responses called express saccades (Isa, 2002). One might suppose that the time course of signal transmission from the sSC to dSC shown in the present results might be too slow for generation of express saccades. However, the onset of the negativity in the dSC does not precisely indicate the onset of excitation in dSC. It has been shown that saccade-related burst neurons in the dSC are tonically inhibited by the substantia nigra pars reticulata during fixation (Hikosaka and Wurtz, 1983). In addition, fixation neurons in the rostral pole of the SC also tonically inhibit saccade-related burst neurons via local GABAergic interneurons (Munoz and Wurtz, 1993a,b; Meredith and Ramoa, 1998). It has been reported that fixation neurons decrease firing before saccade onset (Dorris et al., 1997). Moreover, their decrease in firing is more profound in the case of express saccades than in the case of saccades with regular latencies. Thus, the reduction of tonic GABAergic inhibition may be an essential condition for the gerneration of express saccades. Moreover, our recent study on recordings from SGI GABAergic neurons using GAD67 green fluorescent protein knock-in mice showed that many of these inhibitory interneurons exhibit tonic firing in slices (T. Sooksawate, K. Isa, Y. Yanagawa, T. Isa, unpublished observation). Therefore, our current experimental manipulation in slices may mimic the condition for generating express saccades in vivo.
An important finding of the present study is that neurons extending in a large area of the dSC can be synchronously activated. The area of the negative field potential spanned as long as 1 mm in the horizontal direction, that is, more than half of the rostrocaudal or mediolateral dimension of area of the SC. This supports models that propose the population coding of saccade vectors in the dSC (Lee et al. 1988; Sparks et al. 1976). In addition, the center of gravity of the excitation moved in the dorsal-to-ventral direction in coronal slices, where contamination of passing fiber stimulation is negligible. It has been proposed that the activated neuronal population might shift from the caudal to rostral direction during saccades (Munoz et al., 1991; Munoz and Wurtz, 1995). However, no evidence for such “moving hills” was observed in this study. Thus, we could not obtain evidence which positively suggests that a “moving hill” mechanism is implemented in the local circuit mechanism of the SC.
Our recent report showed that NMDA receptors in the sSC play a critical role in burst generation in the dSC (Kaneda et al. 2008). The present study did not directly examine this issue. However, the results clearly showed that the area of negative field potential is considerably expanded at the border between the sSC and dSC. Additional studies are necessary to elucidate the neural mechanism critical for triggering the burst generation in the SC local circuit.
Footnotes
This work was supported by Ministry of Education, Culture, Sports, Science, and Technology of Japan Grant 13854029, 17021041, and 18200027, and grants from the Human Frontier Science Program. We thank Kaoru Isa for technical assistance.
References
- Cynader M, Berman N. Receptive-field organization of monkey superior colliculus. J Neurophysiol. 1972;35:187–201. doi: 10.1152/jn.1972.35.2.187. [DOI] [PubMed] [Google Scholar]
- Dean P, Redgrave P, Westby GW. Event or emergency? Two response systems in the mammalian superior colliculus. Trends Neurosci. 1989;12:137–147. doi: 10.1016/0166-2236(89)90052-0. [DOI] [PubMed] [Google Scholar]
- Dorris MC, Paré M, Munoz DP. Neuronal activity in monkey superior colliculus related to the initiation of saccadic eye movements. J Neurosci. 1997;17:8566–8579. doi: 10.1523/JNEUROSCI.17-21-08566.1997. [DOI] [PMC free article] [PubMed] [Google Scholar]
- Fecteau JH, Munoz DP. Salience, relevance, and firing: a priority map for target selection. Trends Cogn Sci. 2006;10:382–390. doi: 10.1016/j.tics.2006.06.011. [DOI] [PubMed] [Google Scholar]
- Grantyn R, Ludwig R, Eberhardt W. Neurons of the superficial tectal gray. An intracellular HRP-study on the kitten superior colliculus in vitro. Exp Brain Res. 1984;55:172–176. doi: 10.1007/BF00240512. [DOI] [PubMed] [Google Scholar]
- Helms MC, Özen G, Hall WC. Organization of the intermediate gray layer of the superior colliculus. I. Intrinsic vertical connections. J Neurophysiol. 2004;91:1706–1715. doi: 10.1152/jn.00705.2003. [DOI] [PubMed] [Google Scholar]
- Hikosaka O, Wurtz RH. Visual and oculomotor functions of monkey substantia nigra pars reticulata. IV. Relation of substantia nigra to superior colliculus. J Neurophysiol. 1983;49:1285–1301. doi: 10.1152/jn.1983.49.5.1285. [DOI] [PubMed] [Google Scholar]
- Huerta MF, Harting JK. Tectal control of spinal cord activity: neuroanatomical demonstration of pathways connecting the superior colliculus with the cervical spinal cord grey. Prog Brain Res. 1982;57:293–328. doi: 10.1016/s0079-6123(08)64135-7. [DOI] [PubMed] [Google Scholar]
- Isa T. Intrinsic processing in the mammalian superior colliculus. Curr Opin Neurobiol. 2002;12:668–677. doi: 10.1016/s0959-4388(02)00387-2. [DOI] [PubMed] [Google Scholar]
- Isa T, Saito Y. The direct visuo-motor pathway in mammalian superior colliculus; novel perspective on the interlaminar connection. Neurosci Res. 2001;41:107–113. doi: 10.1016/s0168-0102(01)00278-4. [DOI] [PubMed] [Google Scholar]
- Isa T, Sparks D. The interface between neurons and global brain function. Cambridge, MA: MIT; 2006. Microcircuit of the superior colliculus: a neuronal machine that determines timing and endpoint of saccadic eye movements; pp. 1–34. [Google Scholar]
- Isa T, Endo T, Saito Y. The visuo-motor pathway in the local circuit of the rat superior colliculus. J Neurosci. 1998;18:8496–8504. doi: 10.1523/JNEUROSCI.18-20-08496.1998. [DOI] [PMC free article] [PubMed] [Google Scholar]
- Kaneda K, Phongphanphanee P, Katoh T, Isa K, Yanagawa Y, Obata K, Isa T. Regulation of burst activity through presynaptic and postsynaptic GABA(B) receptors in mouse superior colliculus. J Neurosci. 2008;28:816–827. doi: 10.1523/JNEUROSCI.4666-07.2008. [DOI] [PMC free article] [PubMed] [Google Scholar]
- Katsuta H, Isa T. Release from GABA(A) receptor-mediated inhibition unmasks interlaminar connection within superior colliculus in anesthetized adult rats. Neurosci Res. 2003;46:73–83. doi: 10.1016/s0168-0102(03)00029-4. [DOI] [PubMed] [Google Scholar]
- Langer TP, Lund RD. The upper layers of the superior colliculus of the rat: a Golgi study. J Comp Neurol. 1974;158:418–435. doi: 10.1002/cne.901580404. [DOI] [PubMed] [Google Scholar]
- Lee C, Rohrer WH, Sparks DL. Population coding of saccadic eye movements by neurons in the superior colliculus. Nature. 1988;332:357–360. doi: 10.1038/332357a0. [DOI] [PubMed] [Google Scholar]
- Lee PH, Helms MC, Augustine GJ, Hall WC. Role of intrinsic synaptic circuitry in collicular sensorimotor integration. Proc Natl Acad Sci U S A. 1997;94:13299–13304. doi: 10.1073/pnas.94.24.13299. [DOI] [PMC free article] [PubMed] [Google Scholar]
- Lee PH, Schmidt M, Hall WC. Excitatory and inhibitory circuitry in the superficial gray layer of the superior colliculus. J Neurosci. 2001;21:8145–8153. doi: 10.1523/JNEUROSCI.21-20-08145.2001. [DOI] [PMC free article] [PubMed] [Google Scholar]
- Lee PH, Sooksawate T, Yanagawa Y, Isa K, Isa T, Hall WC. Identity of a pathway for saccadic suppression. Proc Natl Acad Sci U S A. 2007;104:6824–6827. doi: 10.1073/pnas.0701934104. [DOI] [PMC free article] [PubMed] [Google Scholar]
- Lo FS, Mize RR. Synaptic regulation of L-type Ca2+ channel activity and long-term depression during refinement of the retinocollicular pathway in developing rodent superior colliculus. J Neurosci. 2000;20:RC58. doi: 10.1523/JNEUROSCI.20-03-j0003.2000. [DOI] [PMC free article] [PubMed] [Google Scholar]
- May PJ. The mammalian superior colliculus: laminar structure and connections. Prog Brain Res. 2005;151:321–378. doi: 10.1016/S0079-6123(05)51011-2. [DOI] [PubMed] [Google Scholar]
- McIlwain JT. Visual receptive fields and their images in superior colliculus of the cat. J Neurophysiol. 1975;38:219–230. doi: 10.1152/jn.1975.38.2.219. [DOI] [PubMed] [Google Scholar]
- McIlwain JT. Lateral spread of neural excitation during microstimulation in intermediate gray layer of cat's superior colliculus. J Neurophysiol. 1982;47:167–178. doi: 10.1152/jn.1982.47.2.167. [DOI] [PubMed] [Google Scholar]
- Meredith MA, Ramoa AS. Intrinsic circuitry of the superior colliculus: pharmacophysiological identification of horizontally oriented inhibitory interneurons. J Neurophysiol. 1998;79:1597–1602. doi: 10.1152/jn.1998.79.3.1597. [DOI] [PubMed] [Google Scholar]
- Mitzdorf U, Singer W. Prominent excitatory pathways in the cat visual cortex (A 17 and A 18): a current source density analysis of electrically evoked potentials. Exp Brain Res. 1978;33:371–394. doi: 10.1007/BF00235560. [DOI] [PubMed] [Google Scholar]
- Munoz DP, Wurtz RH. Fixation cells in monkey superior colliculus. I. Characteristics of cell discharge. J Neurophysiol. 1993a;70:559–575. doi: 10.1152/jn.1993.70.2.559. [DOI] [PubMed] [Google Scholar]
- Munoz DP, Wurtz RH. Fixation cells in monkey superior colliculus. II. Reversible activation and deactivation. J Neurophysiol. 1993b;70:576–589. doi: 10.1152/jn.1993.70.2.576. [DOI] [PubMed] [Google Scholar]
- Munoz DP, Wurtz RH. Saccade-related activity in monkey superior colliculus. II. Spread of activity during saccades. J Neurophysiol. 1995;73:2334–2348. doi: 10.1152/jn.1995.73.6.2334. [DOI] [PubMed] [Google Scholar]
- Munoz DP, Pélisson D, Guitton D. Movement of neural activity on the superior colliculus motor map during gaze shifts. Science. 1991;251:1358–1360. doi: 10.1126/science.2003221. [DOI] [PubMed] [Google Scholar]
- Neale SA, Salt TE. Modulation of GABAergic inhibition in the rat superior colliculus by a presynaptic group II metabotropic glutamate receptor. J Physiol. 2006;577:659–669. doi: 10.1113/jphysiol.2006.119073. [DOI] [PMC free article] [PubMed] [Google Scholar]
- Nikitin NI, Isa T. Release from GABAergic inhibition unmasks visual inputs to deeper layer neurons in the superior colliculus in macaque monkeys. Jpn J Physiol. 2004;54(Suppl):457. [Google Scholar]
- Oka H, Shimono K, Ogawa R, Sugihara H, Taketani M. A new planar multielectrode array for extracellular recording: application to hippocampal acute slice. J Neurosci Methods. 1999;93:61–67. doi: 10.1016/s0165-0270(99)00113-2. [DOI] [PubMed] [Google Scholar]
- Robinson DA. Eye movements evoked by collicular stimulation in the alert monkey. Vision Res. 1972;12:1795–1808. doi: 10.1016/0042-6989(72)90070-3. [DOI] [PubMed] [Google Scholar]
- Saito Y, Isa T. Local excitatory network and NMDA receptor activation generate a synchronous and bursting command from the superior colliculus. J Neurosci. 2003;23:5854–5864. doi: 10.1523/JNEUROSCI.23-13-05854.2003. [DOI] [PMC free article] [PubMed] [Google Scholar]
- Saito Y, Isa T. Laminar specific distribution of lateral excitatory connections in the rat superior colliculus. J Neurophysiol. 2004;92:3500–3510. doi: 10.1152/jn.00033.2004. [DOI] [PubMed] [Google Scholar]
- Saito Y, Isa T. Organization of interlaminar interactions in the rat superior colliculus. J Neurophysiol. 2005;93:2898–2907. doi: 10.1152/jn.01051.2004. [DOI] [PubMed] [Google Scholar]
- Schiller PH, Stryker M. Single-unit recording and stimulation in superior colliculus of the alert rhesus monkey. J Neurophysiol. 1972;35:915–924. doi: 10.1152/jn.1972.35.6.915. [DOI] [PubMed] [Google Scholar]
- Schmidt M, Boller M, Ozen G, Hall WC. Disinhibition in rat superior colliculus mediated by GABAc receptors. J Neurosci. 2001;21:691–699. doi: 10.1523/JNEUROSCI.21-02-00691.2001. [DOI] [PMC free article] [PubMed] [Google Scholar]
- Shimono K, Kubota D, Brucher F, Taketani M, Lynch G. Asymmetrical distribution of the Schaffer projections within the apical dendrites of hippocampal field CA1. Brain Res. 2002;950:279–287. doi: 10.1016/s0006-8993(02)03052-4. [DOI] [PubMed] [Google Scholar]
- Sparks DL. Translation of sensory signals into commands for control of saccadic eye movements: role of primate superior colliculus. Physiol Rev. 1986;66:118–171. doi: 10.1152/physrev.1986.66.1.118. [DOI] [PubMed] [Google Scholar]
- Sparks DL, Holland R, Guthrie BL. Size and distribution of movement fields in the monkey superior colliculus. Brain Res. 1976;113:21–34. doi: 10.1016/0006-8993(76)90003-2. [DOI] [PubMed] [Google Scholar]
- Van Opstal AJ, Van Gisbergen JA, Smit AC. Comparison of saccades evoked by visual stimulation and collicular electrical stimulation in the alert monkey. Exp Brain Res. 1990;79:299–312. doi: 10.1007/BF00608239. [DOI] [PubMed] [Google Scholar]
- Wurtz RH, Albano JE. Visual-motor function of the primate superior colliculus. Annu Rev Neurosci. 1980;3:189–226. doi: 10.1146/annurev.ne.03.030180.001201. [DOI] [PubMed] [Google Scholar]
- Wurtz RH, Goldberg ME. Activity of superior colliculus in behaving monkey. 3. Cells discharging before eye movements. J Neurophysiol. 1972;35:575–586. doi: 10.1152/jn.1972.35.4.575. [DOI] [PubMed] [Google Scholar]


