Abstract
If exposed to bulk water flow, fish lateral line afferents respond only to flow fluctuations (AC) and not to the steady (DC) component of the flow. Consequently, a single lateral line afferent can encode neither bulk flow direction nor velocity. It is possible, however, for a fish to obtain bulk flow information using multiple afferents that respond only to flow fluctuations. We show by means of particle image velocimetry that, if a flow contains fluctuations, these fluctuations propagate with the flow. A cross-correlation of water motion measured at an upstream point with that at a downstream point can then provide information about flow velocity and flow direction. In this study, we recorded from pairs of primary lateral line afferents while a fish was exposed to either bulk water flow, or to the water motion caused by a moving object. We confirm that lateral line afferents responded to the flow fluctuations and not to the DC component of the flow, and that responses of many fiber pairs were highly correlated, if they were time-shifted to correct for gross flow velocity and gross flow direction. To prove that a cross-correlation mechanism can be used to retrieve the information about gross flow velocity and direction, we measured the flow-induced bending motions of two flexible micropillars separated in a downstream direction. A cross-correlation of the bending motions of these micropillars did indeed produce an accurate estimate of the velocity vector along the direction of the micropillars.
Keywords: mechanoreception, motion detection, lateral line, teleost fish, particle image velocimetry, Carassius auratus
Introduction
Fishes and aquatic amphibians detect minute water motions with their lateral line (for review, see Bleckmann, 1994). The fish lateral line plays a dominant role in many behaviors including rheotaxis (Montgomery et al., 1997), schooling (Partridge and Pitcher, 1980), object recognition (Campenhausen et al., 1981), communication (Satou et al., 1994), prey detection (New et al., 2001; Kanter and Coombs, 2003), and predator avoidance (Blaxter and Fuiman, 1990). The smallest functional unit of the lateral line is the neuromast (Northcutt, 1989). Neuromasts are located on the skin (superficial neuromasts) and/or in subdermal canals (canal neuromasts) (Coombs and Fay, 1989; Puzdrowski, 1989). The sensory epithelium of a lateral line neuromast contains up to several thousand hair cells (Coombs et al., 1988). Lateral line hair cells are sensitive to the stimulus direction. With respect to their most sensitive axis, they are antagonistically oriented in the sensory epithelium of a neuromast. The ciliary bundle of each lateral line hair cell in a neuromast projects into a gelatinous cupula (Flock, 1971). Any displacement of the cupula causes a shearing of the cilia bundles, in turn leading to a change in the membrane potential of the hair cells in that neuromast.
Lateral line neuromasts may be distributed all over the fish's body (Puzdrowski, 1989). Trunk and tail fin neuromasts are innervated by fibers of the posterior lateral line nerve (PLLN), neuromasts of the head are innervated by fibers of the anterior lateral line nerve (ALLN) (Puzdrowski, 1989). Individual lateral line afferents innervate either a single canal neuromast or one to several superficial neuromast, usually situated on the same body scale (Münz, 1985). A lateral line afferent may innervate several hair cells, provided they have the same orientation (Münz, 1979).
In their natural environment, fishes are exposed to flow conditions ranging from near still water in ponds to fast running rivers or the ocean surf. Behavioral experiments have shown that fishes can detect gross flow direction with their lateral line (Montgomery et al., 1997). If a fish is exposed to unidirectional gross water flow, nearly all lateral line afferents (provided they are flow sensitive) increase their discharge rates (Voigt et al., 2000; Carton and Montgomery, 2002; Engelmann et al., 2002; Chagnaud et al., 2008). This increase is, however, not caused by the DC component of the flow, but by the flow fluctuations that are superimposed on gross water flow (Chagnaud et al., 2008). Consequently, lateral line afferents respond with an increase in discharge rate to unidirectional water flow, regardless of gross flow direction (Chagnaud et al., 2008).
Any flow disturbance will be convected with the mean flow. Therefore, fish could determine gross flow direction and flow velocity by monitoring the direction and velocity of individual flow disturbances while they move across its body surface. Here, we show that spike trains, recorded simultaneously from pairs of flow-sensitive lateral line afferents, are often correlated and that the correlation depends on flow velocity and flow direction. This suggests that fish might use a cross-correlation mechanism (coincidence detector) to determine gross flow velocity and gross flow direction. To verify that such a mechanism is plausible when hydrodynamic sensors must operate in a boundary layer (i.e., very close to the skin surface) flexible micropillars were used as near-wall flow sensors (cf. Brücker et al., 2005, 2007). A cross-correlation of the bending motions of these pillars did indeed produce an accurate estimate of the velocity vector along the direction of the neuromasts (micropillars). The micropillar data also show that this principle can even be used in turbulent boundary layer flows because the typical near-wall structures are convected in the near-wall region with a velocity of 0.6 Umean.
Materials and Methods
Experimental animals.
Data were collected from 14 goldfish, ranging in length from 8 to 13 cm. Fish were acquired from commercial dealers and were maintained in 250 L aquaria at an ambient room temperature on a daily 10–14 h light/dark cycle. Before surgery, fish were anesthetized with MS-222 (0.001%) and immobilized with 1–2 μl of pancuronium bromide (Organon Teknika, Durham, NC). During surgery, animals were ventilated with fresh water. To prevent drying of the skin, fish were continuously rinsed with fresh water. A small piece of skin was removed, and the PLLN was exposed at its entry to the medulla by drilling a hole into the skull. After surgery, fish were positioned in a stainless-steel holder that consisted of a mouthpiece for artificial ventilation with fresh water and two screws, which kept the head in a fixed position. A cord, attached to the tail of the fish, prevented lateral movements of the fish's trunk and tail. Fish were positioned such that the water could not enter the brain cavity. To avoid inactivation of the lateral line receptors by MS-222 (Späth and Schweickert, 1977; Palmer and Mensinger, 2004), recordings were not begun until 1 h after preparation. Depending on the stimuli applied, fish and holder were either transferred to a flow tank or to an experimental aquarium (see below).
The experiments reported on in this study comply with the current animal protection law of the Federal Republic of Germany (Tierschutzgesetz).
Generation of unidirectional water flow.
The experiments involving unidirectional water flow were conducted in a flow tank (canal width, 15 cm; water depth, 16 cm) that rested on a vibration-isolated table (TMC, Peabody, MA). Water flow was generated with a propeller (diameter, 8 cm; Aeronaut) coupled to a DC motor (Conrad Electronic, Berlin, Germany) that was driven by a power supply (Voltcraft Digi35; Conrad Electronic). The propeller was suspended from a holder on the side of the tank that was opposite to the recording section. The tank contained one upstream and one downstream flow collimator. Fish were oriented with their heads toward the flow and were exposed to different flow velocities ranging from 0 to 15 cm s−1. In some experiments, flow direction was reversed. Flow velocity was calibrated with a flow meter (Ott; Z 200) placed at the position of the fish. Flow measurements lasted for 60 s and were not begun before the water flow reached its desired velocity.
Moving object stimulus.
A rectangular Plexiglas object (1.2 × 1.2 × 8 cm) oriented with its long axis vertically was moved on a circular orbit (radius, 13.5 cm) along the side of the fish. The object was mounted onto the edge of a disc, which was positioned on the bottom of the experimental tank. Thus, the object protruded upright from below the animal across most of its dorsoventral extent but did not penetrate the water surface. The disc was turned under water by driving its center axis (30 mm diameter Plexiglas cylinder at a distance of 14.5 cm from the fish) with a DC motor from above the water surface. Standard object velocity was 17 cm s−1. The fish was positioned just outside the orbit, tangential to its perimeter [cf. Müller et al. (1996), their Fig. 1]. The position of the fish relative to the orbit of the moving object was such that a minimum lateral distance between object and fish (=3 cm) was reached 1 cm behind the operculum. Because of the circular orbit of the moving object, the lateral distance between object and fish was not constant along the entire length of the fish. To reduce water surface waves, a 100-mm-wide Plexiglas plate was placed on the water surface between fish and disc axis. The DC voltage that determined motor speed and thus object speed was controlled by a custom-built device (P. Maier, Electronic Shop, University of Bielefeld, Bielefeld, Germany) and monitored on an oscilloscope (DL 1300 A; Yokogawa, Tokyo, Japan). Onset of object motion was triggered with a 5 V pulse delivered from a pulse generator (model 146; Wavetek, San Diego, CA) to the motor control. During an experiment, the object was moved along the side of the fish and around the perimeter of the circular orbit. One such movement was defined as one stimulus presentation. Object motion was stopped by turning off the voltage to the motor.
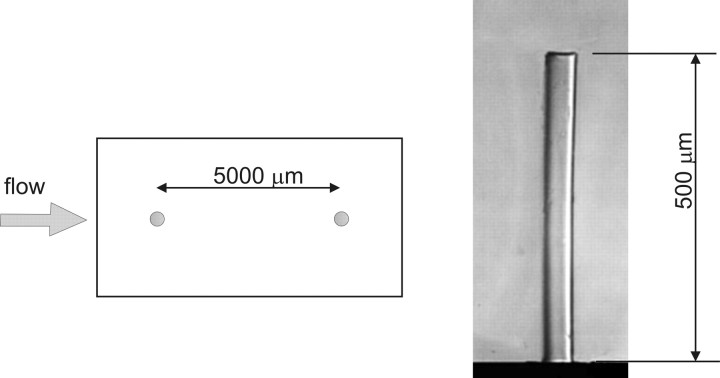
Figure 1.
Top view of a sensor with the pair of flexible micropillars spaced 5 mm apart in mean flow direction. Pillars had a length of ∼500 μm.
Data acquisition.
Neural activity of PLLN fibers was recorded with glass micropipettes filled with 3 m KCl (impedance, 50–90 MΩ). Electrodes were placed on the nerve and advanced with motorized microdrives (Nanostepper MPC; Science Products Trading). Action potentials were amplified (VF 180; Bio-Logic, Claix, France), low-pass filtered (cutoff frequency, 1 or 10 kHz), displayed on an oscilloscope (Yokogawa DL-1800 A), and stored on-line (Superscope II). Neural activity was monitored with a loudspeaker (audio monitor).
Experimental protocol.
All fibers were tested for their responses to water movements created by moving a handheld pipette through the tank (aquarium), or to small water jets that were generated by the pipette and directed to the skin of the fish. Fibers that did not respond to these water motions were assumed to be efferent fibers or to innervate damaged neuromasts and were therefore excluded from additional investigations. Ongoing activity of afferent fibers was recorded for 60 s. We did not attempt to determine the positions of the neuromasts from which we recorded because of the limited recording time. Because many units were lost before the entire experimental protocol could be completed, the sample size for different stimulus conditions may vary.
Data analysis.
We determined the instantaneous frequency of each afferent fiber by calculating the reciprocals of inter spike time intervals. Because afferent lateral line nerve fibers differed in their spontaneous activity, we calculated the relative instantaneous firing frequency (IF) by always subtracting the mean firing frequency of each fiber over the entire recording time. Instantaneous frequency values were smoothed (Gaussian smooth function, factor 2; see IGOR reference manual) and the responses (IFs) of two simultaneously recorded fibers were cross- correlated using IGOR 4.0 (Wavemetrics, Lake Oswego, OR). The resulting correlation function was normalized to values between 1 and −1. For each of the two simultaneously recorded spike trains, we also shuffled the sequence of intervals such that the sequence of all intervals was randomized, thus destroying any temporal relationships between intervals. We then correlated the instantaneous frequencies of the shuffled spike trains as described above. The correlation of the shuffled data were used as baseline correlation. We calculated the z score of the correlation. We used a z score of 5.61 to determine whether the correlation exceeds a significance value of p < 0.001.
Under flow conditions, the spike train pairs recorded simultaneously for 60 s were cross- correlated. If the lateral line was stimulated with a moving object under still-water condition, the response sequences used for the cross-correlation had durations of 1 s. We correlated the neuronal activity recorded before object motion (control), while the object passed the fish (while the two fibers showed marked responses to the water motions caused by the moving object), and 1 s after the object had passed the fish. The stimulus was presented three to four times.
The values reported herein are, if not otherwise stated, mean ± SD. N is the number of animals, and n is the number of fibers.
Particle image velocimetry.
A high-speed particle image velocimetry (PIV) system (Highspeedstar 4; LaVision, Goettingen, Germany) was used to visualize and quantify water motions. Neutrally buoyant particles (Sphericel 110P8; LaVision), suspended in the water, were illuminated with a light plane (<1 mm) that was generated with a laser. The light plane was oriented parallel to the rostrocaudal axis of the fish at a distance of ∼1.5 mm from the fish's surface. Measurements were performed with a fish placed in the flow tank. Individual pictures were taken at a frame rate of 250 Hz (i.e., the temporal resolution of the PIV was 4 ms). Reconstruction of the vector plots was performed with Davis 7 (LaVision) software. Successive frames were analyzed by time series sequential cross-correlation with an interrogation window size of 256 × 256 pixel (16 × 16 vectors). To improve the spatial resolution, an overlap of 50% between neighboring interrogation windows was applied which resulted in a final map of 32 × 32 vectors. Application of a multipass filter further reduced the error of the calculated vectors. This filter executed iterative (n = 2) evaluations of the same pair of images. In the first pass, a vector was computed and used as a reference for the following pass. In the second pass, the interrogation window of the first frame was shifted by one-half the amount of the reference vector and in the opposite direction, whereas the interrogation window of the second frame was shifted in the direction of the reference vector by one-half of the amount of the reference vector. Thus, the correlation in the second pass anticipates the main motion direction of the particles and adjusts the interrogation area such that the maximum number of particles is included. This enhances the precision of the PIV. Finally, a median filter was used to compute the median vector for eight neighboring interrogation windows. If the center vector (surrounded by the eight neighbors) differed from the median vector by more than three times the root mean square, the center vector was replaced by the mean vector. After the vector computation, the vector plots were postprocessed using the same median filter and smoothing as during the computation of the vector plots.
Flexible micropillars.
To verify the conclusions drawn from our electrophysiological experiments, we monitored the tip movements of two micropillars in tandem arrangement (spaced 5 mm apart) that were exposed to turbulent fluid flow. The flexible micropillars bend in the flow because of the viscous drag forces (cf. Brücker et al., 2005, 2007). The micropillars had a uniform circular cross-section with a planar base and tip (Fig. 1). Micropillars were fabricated according the method described by Schmitz et al. (2005). In all experiments, pillars with a diameter of 50 μm and lengths of 500 μm were used. The PDMS (poly-dimethyl-siloxane) had a density of ρ = 1050 kg m−3 and a Young's modulus of E = 2.2 × 10⁶ Nm2 after being cured. The natural frequency, ωn, of the micropillars in vacuum was 1020 Hz. The measurements were performed in a flat plate turbulent boundary layer flow at Re = 3.5–5.0 × 10⁵. The viscous sublayer thickness was in the range of 400–500 μm. A pair of pillars was placed in tandem at the wall within the viscous sublayer in streamwise direction, and pillar movements were recorded with a high-speed camera (3000 frames per second; APX-RS; Photron, San Diego, CA) equipped with a lens of magnification M = 3. Standard image processing routines were used to detect the pillar tip with high resolution.
Results
Spatial analysis of water flow
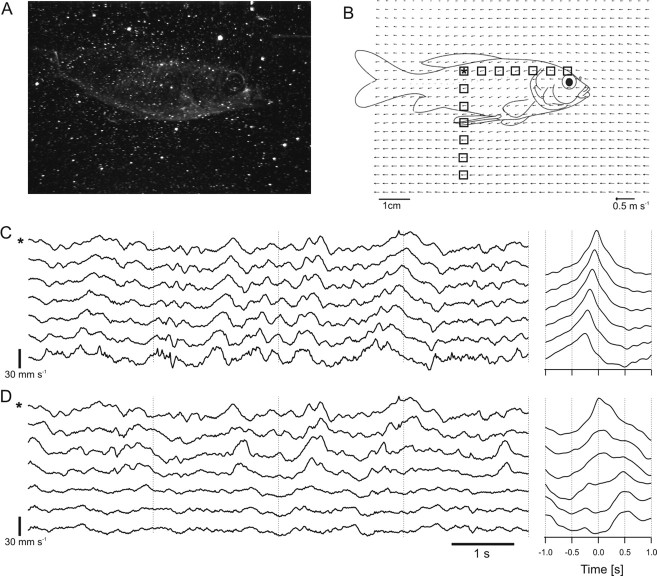
In a previous study, we found that flow fluctuations were the main cause for the increase in discharge rate and the irregular temporal discharge patterns of primary lateral line afferents exposed to running water (Chagnaud et al., 2008). Although we quantified the flow with high-speed PIV, the spatiotemporal characteristics of the flow remained elusive. The spatial structures of the flow fluctuations were investigated by comparing the individual flow profiles in an array of 32 × 32 interrogation windows (IWs) in the PIV plane. For each IW (size, ∼3 × 3 mm), flow velocity was calculated for a period of 8 s [Chagnaud et al. (2008), their Fig. 9]. Because we were only interested in the flow fluctuations, the mean flow velocity was subtracted from each vector. Figure 2 shows the flow velocity profiles obtained from seven IWs spaced 6 mm apart in a horizontal (Fig. 2C) and in a vertical row (Fig. 2D). We cross-correlated the velocity profile of the IW marked by an asterisk in Figure 2B with each velocity profile of six IWs spaced either horizontally or vertically. At larger distances, flow fluctuations were uncorrelated vertically, but still correlated horizontally (i.e., in flow direction) with a time shift that was proportional to the distance between the IWs compared (Fig. 2C,D, right). Thus, flow fluctuations propagated with the flow (i.e., they were highly correlated in the direction of the flow).
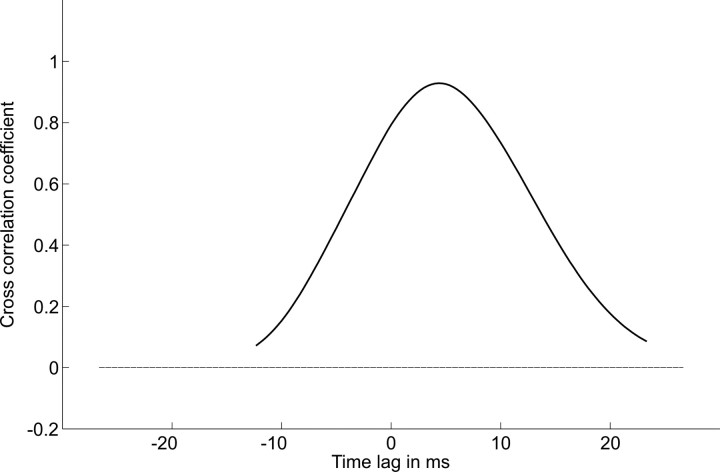
Figure 9.
Cross-correlation function of the data shown in Figure 8.
Figure 2.
Signal from the camera (A) and corresponding water velocity vector field (B). Note that the vector field consists of 32 × 32 IW. The scale bars (for A and B) and reference vector (B) are indicated. The flow velocity profiles shown in C and D were retrieved from the IWs indicated by squares in B. From the IW marked by an asterisk in B, the top flow velocity profiles in C and D were retrieved. Gross flow velocity was 13.5 cm s−1. C, D, Left, Flow velocity fluctuations retrieved from the horizontally (C) and vertically (D) arranged interrogation windows shown in B. Note that flow fluctuations propagated horizontally with the gross flow (C). C, D, Right, Correlation of the respective top flow velocity profile (marked by an asterisk) with the respective flow velocity profiles obtained from the IWs arranged in the horizontal (C) and vertical (D) row.
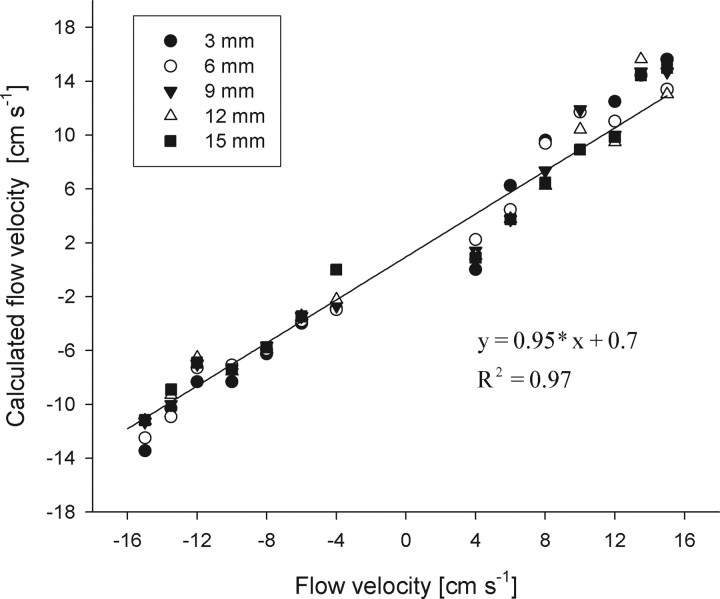
The time shift of the correlation not only should depend on the distance between the IWs but also on flow velocity. To verify this, we determined whether the time shifts of the highest correlation values for pairs of IWs separated by 3, 6, 9, 12, and 15 mm systematically shifted with flow velocity. We than calculated the gross flow velocity by using the correlation peak time shift and the distance between the IWs investigated. The calculated velocity was then plotted against the velocity obtained from the PIV data (Fig. 3). A linear regression analysis revealed a high correlation (y = 0.95 × x + 0.7; R2 = 0.97). Absolute flow velocities and flow direction could be retrieved only if both the distance between the IWs and the time shift necessary to get the maximal correlation value was known.
Figure 3.
Flow velocity (y-axis) calculated from the time shift of the cross-correlation of flow velocity profiles retrieved from PIV measurements at different water flow velocities as function of bulk flow velocity (x-axis). Line, Linear regression analysis.
Physiology
Single-unit recordings were made from 116 fibers of the right (ipsilateral) PLLN of goldfish (N = 10). Most fibers (104 of the 116) responded to hydrodynamic stimuli (see Materials and Methods), judged by listening to the audio monitor and/or by viewing discharge patterns. The remaining 12 fibers did not respond to hydrodynamic stimuli and thus were not further investigated. In still water, the average ongoing activity of the responsive fibers was 19.1 ± 15.3 spikes s−1 (median, 15.3 spikes s−1; n = 104). Ongoing activities were unimodal but not normally distributed (Shapiro–Wilk's test, p < 0.001).
Cross-correlation of simultaneously recorded pairs of spike trains
We recorded the activity of 67 pairs of afferent lateral line fibers, while stimulating the animals with unidirectional water flow (0–15 cm s−1). Most fibers (n = 91) responded with an increase in discharge rate (Wilcoxon's test, p < 0.05) if exposed to unidirectional gross water flow. In all but 13 fibers (Wilcoxon's test, p > 0.05), neural responses increased with increasing flow velocity.
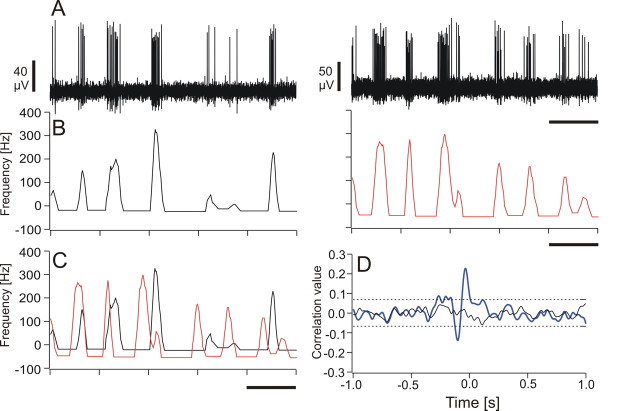
To find out whether the gross flow velocity could be retrieved from the neuronal data, the relative IFs (see Materials and Methods) of pairs of spike trains that were recorded simultaneously were cross-correlated (Fig. 4). Under still-water conditions (n = 61 pairs), three pairs of fibers exceeded the significance value calculated by the z value (Table 1). Under flow conditions (10 cm s−1; n = 67), most spike train pairs (n = 44 of 67) showed a maximum correlation value less than the mean z value. Twenty-three spike train pairs showed a correlation peak that was significant (i.e., maximum correlation value greater than mean z value). Eight pairs showed a positive and three pairs showed a negative correlation peak that exceeded a correlation value of 0.2 and −0.2, respectively. A correlation peak >0.2 indicates a strong correlation, and a peak less than −0.2 indicates a strong anticorrelation.
Figure 4.
A–D, Cross-correlation of neuronal data. A, Original traces of simultaneously recorded spike trains. B, Relative instantaneous frequency (IF, mean subtracted) of the spike trains shown in A. C, Superimposed IF of both spike trains shown in B. D, Cross-correlation function (blue) of the two IFs and of the shuffled data (black) shown in C. The dashed lines indicate the positive and the negative z value of the shuffled data. The black bars in A–C represent a timescale of 0.2 s.
Table 1.
Significant correlation peaks and Z values for the pairs of afferent fibers recorded under still- and running-water conditions
| Condition | Mean maximum peak |
Mean Z value |
Significant |
|||
|---|---|---|---|---|---|---|
| Positive | Negative | Positive | Negative | Positive | Negative | |
| Still water (n = 61) (range) | 0.102 (0.007–0.184) | −0.081 (−0.101 to −0.052) | −0.136 (0.037–0.157) | −0.137 (−0.146 to −0.039) | 3 of 61 | 0 of 61 |
| Running water (n = 67) (10 cm s−1) (range) | 0.141 (0.057–0.808) | −0.104 (−0.456 to −0.049) | 0.120 (0.010–0.0802) | −0.121 (−0.149 to −0.089) | 23 of 67 | 10 of 67 |
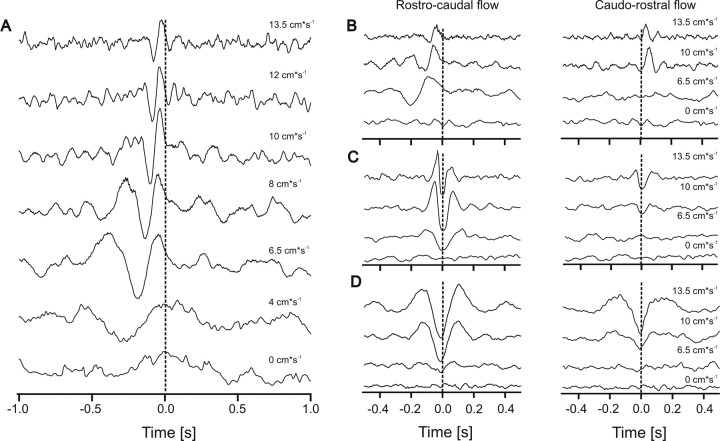
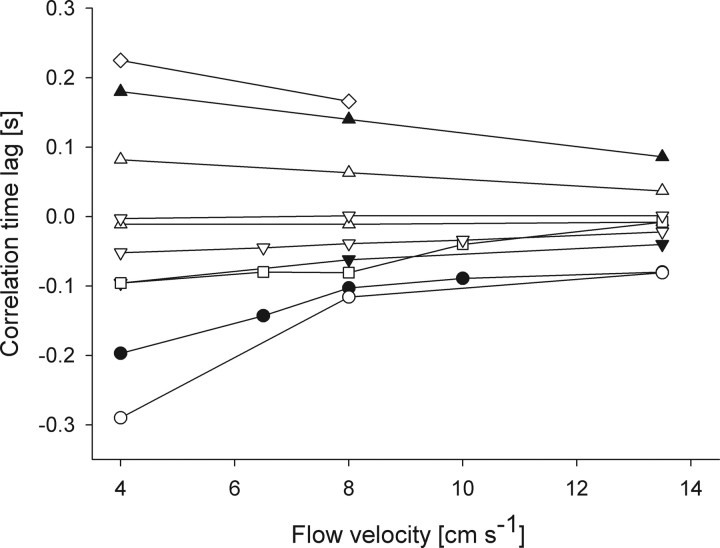
The significant cross-correlation functions often revealed one positive and one negative peak, thus a positive correlation peak was followed by an anticorrelation peak or vice versa (Fig. 5). As expected, the position of a correlation peak systematically shifted with gross flow velocity (Fig. 5). In all fiber pairs that showed a significant correlation in their spike trains, a reversal of flow direction reversed the sign of the correlation peak (Fig. 5B). Two pairs of afferent fibers showed an almost perfect anticorrelation (i.e., spikes in one fiber never coincided with the spikes in the other fiber) (Fig. 5C,D). We calculated the time lag of the correlation peak for 10 fibers at different flow velocities (Fig. 6). As expected, the time lag diminished with increasing flow velocity.
Figure 5.
A–D, Cross-correlation functions of the firing frequencies of pairs of afferents recorded simultaneously. A, From bottom to top, gross flow velocities were 0, 4, 6.5, 8, 10, 12, and 13.5 cm s−1. Gross flow direction was from rostral to caudal. B–D, Cross-correlation functions of three simultaneously recorded spike train pairs. Gross flow was from rostral to caudal (left) and from caudal to rostral (right). Note that the data show both correlation (B) and anticorrelation (C, D). Flow velocities were 0, 6.5, 10, and 13.5 cm s−1. Note that there is no correlation in still water and that higher flow velocities systematically shift the time of maximal correlation (indicated by the vertical lines in B–D).
Figure 6.
Time lag of the correlation peak of 10 representative fibers (each symbol refers to a single fiber) at different flow velocities. Note that, with increasing flow velocity, the time lag diminishes.
Cross-correlation of spike trains caused by a moving object
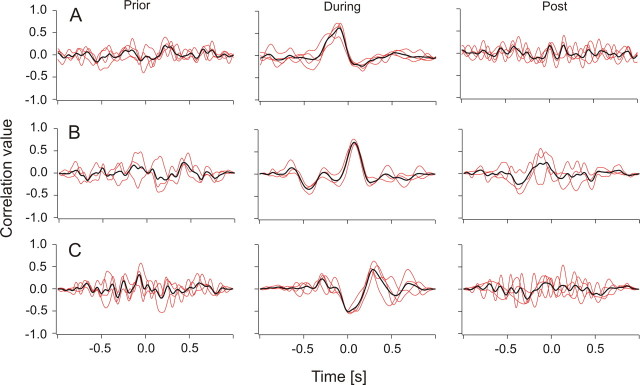
An object that passes a fish laterally causes water motions that systematically move across the surface of the fish. We recorded the activity of 17 pairs of afferent fibers to a moving object. In agreement with a previous study (Mogdans and Bleckmann, 1998), we found biphasic (n = 8) and triphasic (n = 26) responses. We correlated extracts of 1 s duration of both neuronal signals at three different time spans: prior (2 s) to object motion (equal to still-water conditions), during the object passed the fish, and beginning 1 s after the object had passed the fish. In 11 of 17 cases, we found a correlation peak >0.3 while the object passed the fish (Fig. 7A). Correlation peaks were highly reproducible with different stimulus presentations, but were broader than in the experiments with the water flow. As expected, the position of the correlation peak in the cross-correlation function depended on the direction of object motion (Fig. 7B).
Figure 7.
Cross-correlation functions (red, single traces; black, average of single traces) of spike trains simultaneously recorded from PLLN fibers. Each red trace is the correlation of a pair of spike recordings. The fish was exposed to an object that passed its trunk with a velocity of 17 cm s−1. Left, Two seconds before the object passed the fish; middle, while the object passed the fish; right, after the object had passed the fish. A, A fiber pair whose responses were highly correlated if the object motion was from anterior to posterior. B, Same fiber pair as in A, but object motion direction was from posterior to anterior. C, A fiber pair that showed anticorrelation (motion direction was from anterior to posterior).
Motion of flexible micropillars in turbulent boundary layer flow
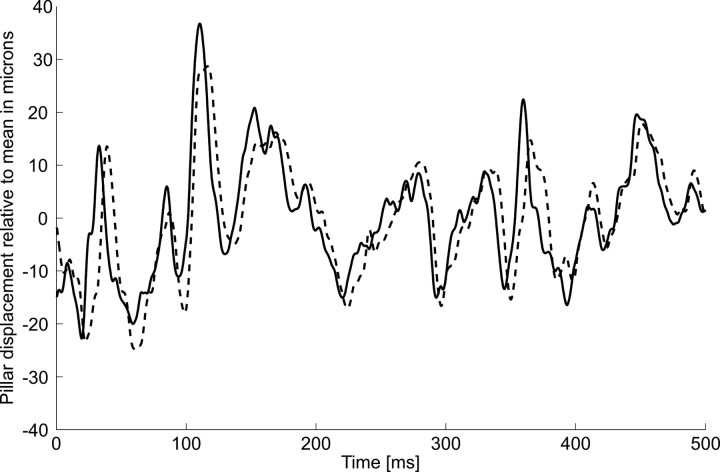
To verify that the streamwise velocity of gross water motions unequivocally can be retrieved with only two sensors placed in tandem even if they are situated in the boundary layer, we measured (see Materials and Methods) the bending motions of two flexible micropillars (diameter, 50 μm; lengths, 700 μm) attached to the wall of a flat plate exposed to fluid velocities of 2, 2.5, and 3 m s−1. The micropillars were moved by the disturbances that turbulent structures left in the viscous sublayer when they passed the near-wall region. Figure 8 shows the streamwise motions of the pillars relative to the mean. An example of the correlation profile is shown in Figure 9. It demonstrates a well defined maximum at a time lag of 3.5 ms. With a pillar spacing of 5 mm and a bulk flow velocity of U = 2 m s−1, the convective velocity UC was 1.25 m s−1, which is equal to 0.61 U∞. For the bulk flow velocities 2.5 and 3 m s−1, the convective velocities were 1.52 and 1.83 m s−1, respectively. This leads to 0.62 U (in all cases, 10 measurements were made).
Figure 8.
Temporal profiles of pillar tip displacements in a turbulent boundary layer of a flat plate. Measurements were done with two micropillars in a tandem arrangement with a spacing of 5 mm (continuous line, upstream pillar; dashed line, downstream pillar). Note that the downstream pillar shows the same movement as the upstream pillar, but with a time delay.
Discussion
Flow measurement with PIV and flexible micropillars
Although our goal was to produce completely laminar flow, the collimators in our flow were not perfect and some flow fluctuations were always present (Fig. 2C,D). By cross-correlating the flow fluctuations measured at different downstream interrogation windows, the net flow velocities could be calculated from the cross-correlation function. In contrast, water motions measured at interrogation windows oriented vertically (i.e., perpendicular to gross flow direction) showed only a weak (if the interrogation windows were spaced close together) or no correlation.
Lateral line
Fish use the lateral line to orient in running water, a behavior called rheotaxis (Montgomery et al., 1997; Baker and Montgomery, 1999). To do so, a fish must be able to detect gross flow direction. Because of its intrinsic directional sensitivity (Flock and Wersäll, 1962), a single neuromast (primary lateral line afferent) in principle could code gross flow direction, provided that lateral line hair cells do not adapt to DC stimuli (i.e., to a flow that is perfectly laminar). As with auditory hair cells (Hudspeth et al., 2000), however, lateral line hair cells rapidly adapt to a constant deflection of their ciliary bundles (S. van Netten, personal communication). In natural waters, perfectly laminar flow is highly unlikely (Vogel, 1996). The flow in our tank also showed some fluctuations at all the flow velocities used, but these were smaller than the flow fluctuations measured in a small creek (RMSf, 70 mm s−1; water velocity, 11–25 cm s−1) (Hanke, 2001). Under nonlaminar conditions, lateral line nerve fibers do respond to unidirectional water flow, but mainly respond to the flow fluctuations and not to the DC component of the flow (Chagnaud et al., 2008). Therefore, a single lateral line afferent cannot encode gross flow direction under nonlaminar flow conditions. All else being equal, an increase in flow velocity results in an increase in flow fluctuations (Chagnaud et al., 2008). Because flow-sensitive lateral line nerve fibers are highly sensitive to flow fluctuations, these fluctuations may provide an indirect measure of flow velocity. However, this is not a reliable measure because the magnitude of the flow fluctuations depends on the presence, size, and shape of upstream objects (Vogel, 1996).
Correlation of spike trains
We recorded from pairs of afferent nerve fibers and investigated whether their neural activity could be cross-correlated to determine bulk flow velocity. Although we recorded from 67 pairs, only the responses of 23 pairs showed a significant correlation. This was not unexpected because a significant correlation of spike trains will only occur if the neuromasts recorded from are aligned in flow direction (i.e., if they are stimulated by similar water motions). Nevertheless, the responses of 8 of the 23 fiber pairs were highly correlated. As expected, the time shift of the correlation peak decreased with increasing flow velocity and a reversal of flow direction reversed the sign of the optimal time shift (Fig. 5). Correlation peaks in general were higher if the flow was from rostral to caudal (Fig. 5B–D). This may be attributable to the curvature of the fish that probably influenced the water flow. In addition, the fish surface may have altered the flow because fish scales are oriented in a rostrocaudal direction. Two pair of fibers showed a high anticorrelation (i.e., spikes in one fiber never coincided with spikes in the other fiber). Because a time shift of 0 at all flow velocities applied yielded the highest anticorrelation, the two fibers of each pair most likely innervated the same neuromast, but hair cells that were aligned in opposite directions (Fig. 5C,D).
We did not attempt to locate the positions of the neuromasts from which we recorded. Because, however, the time shift that yielded the highest correlation peak was proportional to flow velocity, and reversed if flow direction was reversed, the only explanation is that we recorded from two neuromasts that were spaced apart in flow direction. Our results in addition confirmed that the fibers responded to the flow fluctuations and that these fluctuations traveled with the bulk flow. Our PIV measurements show that a phase shift between the water fluctuations measured at two points occurs only if the two points are arranged in downstream order. Furthermore, the phase shift increased with decreasing flow velocity and the sign of the phase shift reverses when flow direction is reversed. We conclude that the information about flow velocity and flow direction cannot unequivocally be retrieved from the spike trains of an individual lateral line afferent. Instead, this information indirectly can be retrieved by cross- correlating the responses of at least two afferents that innervate different neuromasts. Assuming that the time lag of the correlation peak represents the flow velocity, we calculated the interneuromast distance of a fiber pair by multiplying the time lag of the correlation peak with the respective flow velocity. As expected, for a given fiber pair, the resulting interneuromast distance was constant (i.e., independent of flow velocity) (data not shown). We normalized the interneuromast distance of the 10 fiber pairs shown in Figure 6. Across flow velocities, the SE in interneuromast distance was <0.13 cm.
The proposed mechanism probably is used by the superficial neuromast system but potentially also applies to the canal neuromast system, provided the bulk flow contains some high-frequency fluctuations, because canal neuromast are known to respond to high-frequency fluctuations (Chagnaud et al., 2008). Additional experiments are needed to solve this issue.
Correlation coefficient
For a perfect correlation (i.e., a correlation value of 1), one needs identical signals that can be time shifted. To account for the fibers different ongoing activities we subtracted, before the correlation, the mean ongoing activity from the respective IFs. This does not result, however, in identical firing amplitudes if the neuromasts are exposed to the same flow fluctuations. This is attributable to several reasons: (1) The neuromasts may have different sensitivities, (2) the neuromasts' most sensitive axes might be oriented in different directions, (3) a fiber pair might consist of a superficial and a canal neuromast, and (4) the neuromasts are not positioned in a straight horizontal alignment. Thus, even if the signal is identical, we cannot always expect high correlation values. We were able to show, however, that the phase shift of the correlation peaks depends on flow velocity and flow direction; thus, the correlation peaks are not artificial.
Moving object
Pairs of spike trains of lateral line fibers stimulated by a moving object showed a broad correlation peak during the time when the object passed the fish. This most probably was attributable to the different water motions caused by the moving object during the time of correlation. A moving object causes water motions ranging from 0 up to 30 cm s−1 [Mogdans and Bleckmann (1998), their Fig. 14]. Although the object has a certain velocity, the water that is dragged behind the object shows a broad continuum of velocities, and thus one cannot expect a distinct phase shift in the neural responses. However, it became apparent that at least object direction can be coded because the broad correlation peak flipped from positive to negative and vice versa if object direction was altered. Interestingly, neurons in the torus semicircularis of the goldfish show only a directional sensitivity and no velocity sensitivity to a moving object (Müller et al., 1996). This is in accordance with our data and with the fact that the flow velocity changes rapidly if a moving object passes a fish.
Coincidence detector
The mechanism proposed for the determination of flow speed and flow direction has (to our knowledge) never been suggested before for the mechanosensory lateral line. However, the proposed mechanism has been shown previously in the visual system of flies. In flies, a visual motion detector uses a combination of a temporal delay and a multiplication of the detector input channels to measure the degree of coincidence of the signals at its input stages, or, in other words, the visual system of flies performs a spatiotemporal cross-correlation (Borst and Haag, 2002). Many neurons in the medial octavolateralis nucleus of fish have large receptive fields (i.e., these neurons integrate the input of two or more neuromasts widely spaced apart) (Mogdans and Kröther, 2001). This is one of the prerequisites for a mechanism based on coincidence detection. A second prerequisite is that the spikes generated in a neuromast situated more caudally should propagate faster than the spikes generated in a neuromast situated more rostrally (i.e., that the conduction velocity of primary lateral line afferents compensates for fiber length). This indeed has been found in the lateral line system (Schellart and Kroese, 2002).
Neuronal delay lines are commonly found in the brain when time comparisons must be made. For example, in the auditory system of barn owls, delay lines are used to determine interaural time differences (Carr and Konishi, 1990) and bats also use delay lines to determine the distance to a target (Covey and Casseday, 1999). Whether delay lines are implemented in the fish central lateral line pathway is not known; thus, we cannot say whether the lateral line system of fish extracts the velocity and directional information in the way proposed here. It is unlikely that the central lateral line performs a time-intensive cross-correlation analysis as we did (correlation of time signals of 60 s and/or 1 s duration, and only using pairs of afferents), but a more rapid analysis could be performed by the fish if it simultaneously summed signals from many afferents. In this case, the lateral line should be able to use much shorter time sequences for a cross-correlation analysis. In addition, comparison across receptors with different spacing would allow the lateral system to resolve different flow velocities (i.e., the time difference of the responses from closely spaced neuromasts permits resolution of low flow velocities, whereas comparison of more distantly spaced neuromasts is better suited to determine high flow velocities).
The proposed cross-correlation mechanism may also be applied to artificial hydrodynamic sensory systems that are recently developed to equip underwater vehicles with a new sensory modality (Gray, 2006). With a two-dimensional array of receptors, flow velocity and flow direction could be extracted with receptors that do not have to be calibrated or to respond linearly to the flow velocity. The use of flow fluctuations as a measurement of flow direction and flow velocity is not limited to the aquatic medium and thus should also be applicable in different mechanosensory systems used to detect flow velocity and flow direction.
Footnotes
This work was supported by a Defense Advanced Research Planning Agency BioSenSE Air Force Office of Scientific Research Grant (H.B.) and the Deutsche Forschungsgemeinschaft (Bl 242-10/4 and BR 1494/10-1). We gratefully acknowledge the discussions with M. Bauer. We thank J. Mogdans and R. Zelick for critically reading and commenting on this manuscript.
References
- Baker CF, Montgomery JC. The sensory basis of rheotaxis in the blind Mexican cave fish, Astyanax fasciatus. J Comp Physiol A Neuroethol Sens Neural Behav Physiol V. 1999;184:519–527. [Google Scholar]
- Blaxter JHS, Fuiman LA. The role of the sensory systems of herring larvae in evading predatory fishes. J Mar Biol Ass UK. 1990;70:413–427. [Google Scholar]
- Bleckmann H. Stuttgart: Gustav Fischer; 1994. Reception of hydrodynamic stimuli in aquatic and semiaquatic animals. [Google Scholar]
- Borst A, Haag J. Neural networks in the cockpit of the fly. J Comp Physiol A Neuroethol Sens Neural Behav Physiol. 2002;188:419–437. doi: 10.1007/s00359-002-0316-8. [DOI] [PubMed] [Google Scholar]
- Brücker C, Spatz J, Schröder W. Feasability study of wall shear stress imaging using microstructured surfaces with flexible micropillars. Exp Fluids. 2005;39:464–474. [Google Scholar]
- Brücker C, Bauer D, Chaves H. Dynamic response of micro-pillar sensors measuring fluctuating wall-shear-stress. Exp Fluids. 2007;42:737–749. [Google Scholar]
- Campenhausen C, Riess I, Weissert R. Detection of stationary objects by the blind cave fish Anoptichthys jordani (Characidae) J Comp Physiol A Neuroethol Sens Neural Behav Physiol. 1981;143:369–374. [Google Scholar]
- Carr C, Konishi M. A circuit for detection of interaural time differences in the brain stem of the barn owl. J Neurosci. 1990;10:3227–3246. doi: 10.1523/JNEUROSCI.10-10-03227.1990. [DOI] [PMC free article] [PubMed] [Google Scholar]
- Carton AG, Montgomery JC. Responses of lateral line receptors to water flow in the Antarctic notothenioid, Trematomus bernacchii. Polar Biol. 2002;25:789–793. [Google Scholar]
- Chagnaud BP, Bleckmann H, Hofmann MH. Lateral line nerve fibers do not code bulk water flow direction in turbulent flow. Zoology. 2008;111:204–217. doi: 10.1016/j.zool.2007.07.009. [DOI] [PubMed] [Google Scholar]
- Coombs S, Fay RR. The temporal evolution of masking and frequency selectivity in the goldfish (Carassius auratus) J Acoust Soc Am. 1989;86:925–933. doi: 10.1121/1.398727. [DOI] [PubMed] [Google Scholar]
- Coombs S, Janssen J, Webb JF. Diversity of lateral line systems: evolutionary and functional considerations. In: Atema J, Fay RR, Popper AN, Tavolga WN, editors. Sensory biology of aquatic animals. New York: Springer; 1988. pp. 553–593. [Google Scholar]
- Covey E, Casseday JH. Timing in the auditory system of the bat. Annu Rev Physiol. 1999;61:457–476. doi: 10.1146/annurev.physiol.61.1.457. [DOI] [PubMed] [Google Scholar]
- Engelmann J, Hanke W, Bleckmann H. Lateral line reception in still- and running water. J Comp Physiol A Neuroethol Sens Neural Behav Physiol. 2002;188:513–526. doi: 10.1007/s00359-002-0326-6. [DOI] [PubMed] [Google Scholar]
- Flock A. The lateral line organ mechanoreceptors. In: Hoar W, Randall D, editors. Fish physiology. New York: Academic; 1971. pp. 241–263. [Google Scholar]
- Flock A, Wersäll J. A study of the orientation of the sensory hairs of the receptor cells in the lateral line organ of fish, with special reference to the function of the receptors. J Cell Biol. 1962;15:19–27. doi: 10.1083/jcb.15.1.19. [DOI] [PMC free article] [PubMed] [Google Scholar]
- Gray B. Bioengineering. Artificial arrays could help submarines make like a fish. Science. 2006;313:1382–1383. doi: 10.1126/science.313.5792.1382. [DOI] [PubMed] [Google Scholar]
- Hanke W. Department of Zoology, University of Bonn; 2001. Hydrodynamische Spuren schwimmender Fische und ihre mögliche Bedeutung für das Jagdverhalten fischfressender Tiere. PhD thesis. [Google Scholar]
- Hudspeth AJ, Choe Y, Mehta AD, Martin P. Putting ion channels to work: mechanoelectrical transduction, adaptation, and amplification by hair cells. Proc Natl Acad Sci USA. 2000;97:11765–11772. doi: 10.1073/pnas.97.22.11765. [DOI] [PMC free article] [PubMed] [Google Scholar]
- Kanter MJ, Coombs S. Rheotaxis and prey detection in uniform currents by Lake Michigan mottled sculpin (Cottus bairdi) J Exp Biol. 2003;206:59–70. doi: 10.1242/jeb.00056. [DOI] [PubMed] [Google Scholar]
- Mogdans J, Bleckmann H. Responses of the goldfish trunk lateral line to moving objects. J Comp Physiol A Neuroethol Sens Neural Behav Physiol. 1998;182:659–676. doi: 10.1007/s00359-008-0394-3. [DOI] [PubMed] [Google Scholar]
- Mogdans J, Kröther S. Brainstem lateral line responses to sinusoidal wave stimuli in the goldfish, Carassius auratus. Zoology. 2001;104:153–166. doi: 10.1078/0944-2006-00019. [DOI] [PubMed] [Google Scholar]
- Montgomery J, Baker CF, Carton AG. The lateral line can mediate rheotaxis in fish. Nature. 1997;389:960–963. [Google Scholar]
- Müller HM, Fleck A, Bleckmann H. The responses of central octavolateralis cells to moving sources. J Comp Physiol A Neuroethol Sens Neural Behav Physiol. 1996;179:455–471. [Google Scholar]
- Münz H. Morphology and innervation of the lateral line system of Sarotherodon niloticus L. (Cichlidae, Teleostei) Zoomorphology. 1979;93:73–86. [Google Scholar]
- Münz H. Single unit activity in the peripheral lateral line system of the cichlid fish, Sarotherodon niloticus L. J Comp Physiol A Neuroethol Sens Neural Behav Physiol. 1985;157:555–568. [Google Scholar]
- New JG, Alborg Fewkes L, Khan AN. Strike feeding behavior in the muskellunge, Esox masquinongy: contributions of the lateral line and visual sensory systems. J Exp Biol. 2001;204:1207–1221. doi: 10.1242/jeb.204.6.1207. [DOI] [PubMed] [Google Scholar]
- Northcutt G. The phylogenetic distribution and innervation of craniate mechanoreceptive lateral lines. In: Coombs S, Görner P, Münz H, editors. The mechanosensory lateral line: neurobiology and evolution. New York: Springer; 1989. pp. 17–78. [Google Scholar]
- Palmer LM, Mensinger AF. Effect of the anesthetic tricaine (MS-222) on nerve activity in the anterior lateral line of the oyster toadfish, Opsanus tau. J Neurophysiol. 2004;92:1034–1041. doi: 10.1152/jn.01151.2003. [DOI] [PubMed] [Google Scholar]
- Partridge BL, Pitcher TJ. The sensory basis of fish schools: relative roles of lateral line and vision. J Comp Physiol A Neuroethol Sens Neural Behav Physiol. 1980;135:315–325. [Google Scholar]
- Puzdrowski RL. Peripheral distribution and central projections of the lateral-line nerves in goldfish, Carassius auratus. Brain Behav Evol. 1989;34:110–131. doi: 10.1159/000116496. [DOI] [PubMed] [Google Scholar]
- Satou M, Takeuchi H-A, Nishii J, Tanabe M, Kitamura S, Okumoto N, Iwata M. Behavioral and electrophysiological evidences that the lateral line is involved in the inter-sexual vibrational communication of the himé salmon (landlocked red salmon, Oncorhynchus nerka) J Comp Physiol A Neuroethol Sens Neural Behav Physiol. 1994;174:539–549. [Google Scholar]
- Schellart NA, Kroese AB. Conduction velocity compensation for afferent fiber length in the trunk lateral line of the trout. J Comp Physiol A Neuroethol Sens Neural Behav Physiol. 2002;188:561–576. doi: 10.1007/s00359-002-0331-9. [DOI] [PubMed] [Google Scholar]
- Schmitz GJ, Brücker C, Jacobs P. Manufacture of high-aspect-ratio micro-hair sensor arrays. J Micromech Microeng. 2005;15:1904–1910. [Google Scholar]
- Späth M, Schweickert W. The effect of metacaine (MS-222) on the activity of the efferent and afferent nerves in the teleost lateral-line system. Naunyn Schmiedebergs Arch Pharmacol. 1977;297:9–16. doi: 10.1007/BF00508804. [DOI] [PubMed] [Google Scholar]
- Vogel S. Princeton, NJ: Princeton UP; 1996. Life in moving fluids. [Google Scholar]
- Voigt R, Carton AG, Montgomery JC. Responses of anterior lateral line afferent neurones to water flow. J Exp Biol. 2000;203:2495–2502. doi: 10.1242/jeb.203.16.2495. [DOI] [PubMed] [Google Scholar]


