

Abstract
Expectation of upcoming events is an essential cognitive function on which anticipatory actions are based. The neuronal basis of this prospective representation is poorly understood. We trained rhesus monkeys in a smooth-pursuit task in which the direction of upcoming target motion was indicated using a color cue. Under these conditions, directional expectation frequently evoked anticipatory smooth movements. We found that the activity of a population of neurons in the supplementary eye fields encoded the expected future direction of the target. Neuronal activity increased after presentation of the cue, indicating future target motion in the preferred direction. Neuronal activity either remained unaltered or was reduced if the antipreferred direction was cued. In addition, ∼30% of these neurons were more active during trials with anticipatory pursuit in the preferred direction than during trials when monkeys did not anticipate target motion onset. This subset of recorded neurons encoded the direction of the subsequent anticipatory pursuit. We hypothesize that the neural representation of directional expectation could be conceptualized as a competitive interaction between pools of neurons representing likely future events, with the winner of this competition determining the direction of the subsequent anticipatory movement. Similar mechanisms could drive prediction before movement initiation in other motor domains.
Keywords: eye movement, anticipatory smooth pursuit, cortex, rhesus monkey, supplementary eye fields, single neuron recordings
Introduction
Animals and humans continuously form expectations about upcoming events. An expectation is an internal representation of an event that is considered to be likely to occur in the future. The representation of recent events has been investigated extensively (for review, see Baddeley, 2003), but the neural representation of future events is far less understood, although it plays an important role in the guidance of behavior. Indeed, expectation of a particular event often leads to an anticipatory motor response, resulting in a behavioral compensation of the neural processing delays present in sensory and motor systems.
The influence of expectation on the planning of anticipatory motor responses is often studied using anticipatory pursuit. Anticipatory smooth pursuit is a slow movement of the eyes occurring before the appearance of an expected moving target. It has been shown repeatedly that primates can generate anticipatory smooth pursuit in the absence of visual stimulation provided there is a strong expectation about the characteristics of upcoming target motion (Kowler and Steinman, 1979a,b, 1981; Kowler et al., 1984; Kowler, 1989; Barnes and Asselman, 1991; Barnes et al., 2002; Heinen et al., 2005; Badler and Heinen, 2006; de Hemptinne et al., 2007). The influence of expectation in the spatial domain is often studied by providing information using color cues that allow subjects to orient attention to the upcoming spatial position of a target (Posner, 1980). The term “cognitive expectation” is used to stress this intentional use of the prior information provided by a cue to guide an anticipatory response (Kowler, 1989).
Although the behavioral consequences of expectation are well described, its neural representation is still primarily unknown. We hypothesize that the supplementary eye fields (SEFs) of the dorsomedial frontal cortex (DMFC) are good candidates to play a significant role in the neural representation of expectation before ocular smooth pursuit, besides their role in the control of saccades (Schlag and Schlag-Rey, 1987; Stuphorn et al., 2000; Schall et al., 2002; Carpenter, 2004; Stuphorn and Schall, 2006). Indeed, in the rhesus monkey, it has been shown that some SEF neurons are active during smooth pursuit (Schall, 1991; Fukushima et al., 2004, 2006) and that their activity increases particularly before predictable changes in target motion (Heinen 1995; Heinen and Liu 1997). Moreover, electrical microstimulation in the SEF facilitates anticipatory and visually initiated smooth pursuit (Missal and Heinen, 2001, 2004). In humans, activation of the SEF during smooth pursuit has been confirmed using functional imaging techniques (Berman et al., 1999; Petit and Haxby, 1999; O'Driscoll et al., 2000; Burke and Barnes, 2008). Altogether, these observations suggest that an early neuronal signal related to the subjects' expectation of future target motion could exist in the SEF region of the DMFC.
Materials and Methods
Subjects.
One male and one female rhesus monkey (Macaca mulatta; referred to as P and T) were used in this study. All procedures were approved by the Institutional Animal Care and Use Committee and were in compliance with the guidelines set forth in the United States Public Health Service Guide for the Care and Use of Laboratory Animals.
Surgeries.
A celux recording chamber (Crist Instruments, Hagerstown, MD) was positioned at 24 mm anterior in Horsley-Clark stereotaxic coordinates and centered on the midline of the brain in monkey T and at 26 mm anterior and centered 5 mm right of the midline in monkey P. Eye movements were recorded using the scleral search coil method (Judge et al., 1980). At the completion of the surgeries, animals were returned to their home cages. Antibiotics (cefazolin) and analgesics (Buprenex) were administered as needed during the recovery period under the direction of a veterinarian.
Animal training.
The monkeys were seated in a primate chair with their head restrained for the duration of the testing sessions. They were trained to execute behavioral tasks for liquid reward and were allowed to work to satiation. Records of each animal's weight and health status were kept, and supplemental water was given as necessary. The monkeys had their heads immobilized and were trained to pursue spots of light projected on a tangent screen in front of them.
Experimental set-up.
The targets were presented via the computer-controlled analog oscilloscope, which backprojected light spots on a 90 × 90° translucent screen placed 54 cm in front of the monkey. The computer controlled the illumination of the targets and their position on the oscilloscope screen via an analog output card at a frequency of 1 kHz. The targets were 1° in diameter and 2 cd/m2 in intensity against a diffusely illuminated dim homogeneous background (0.05 cd/m2). The eye movement signals were obtained by placing the head-restrained animal with an implanted scleral coil in a pair of orthogonally aligned magnetic fields maintained electronically in temporal quadrature (Primelec, Regensdorf, Switzerland). Horizontal and vertical eye-position measurements were sampled by a 12-bit data acquisition board at 1 kHz and stored on a computer disk. Behavioral paradigms, visual displays, and data storage were under the control of a real-time program (TEMPO; Reflective Computing, St. Louis, MO) running on a laboratory personal computer with the DOS operating system.
Experimental paradigms.
Each trial was initiated by the appearance of a fixation point on the screen (see Fig. 1). Subjects had to look at that position for 500 ms and had to maintain gaze within an electronic window of 4 × 4°. In the condition without prior information about upcoming target motion direction (referred to as “neutral cue condition”), the fixation point was green (see Fig. 1A,B). In the condition with cueing about upcoming target motion direction (referred to as “directional cue condition”) (see Fig. 1C,D), the fixation point was either yellow (before leftward target motion) or red (before rightward target motion). Monkeys were trained to associate the color of a fixation cue with the direction of upcoming target motion. The fixation point was generated via the oscilloscope in the neutral cue condition and via colored light-emitting diodes in the directional cue condition. At the end of the cue-fixation period, a delay without stimulus on the screen occurred with a probability of 0.5 (see Fig. 1B,D). This delay between the extinction of the fixation target and the appearance of the pursuit target was used to encourage an anticipatory response, as has been shown previously (Boman and Hotson, 1988). When a delay period occurred, the electronic window was expanded to 8° horizontal and 4° vertical to allow the monkey to make an anticipatory movement to the left or to the right. At the end of the delay period, leftward-moving targets appeared at a position 2–4° to the right of center before moving at a constant velocity of 65°/s to the left [and vice versa for rightward-moving targets; Rashbass paradigm (Rashbass, 1961)]. During target motion, the electronic window was also 8 × 4°. Target motion direction, always either to the left or to the right, was chosen randomly with the same probability.
Figure 1.
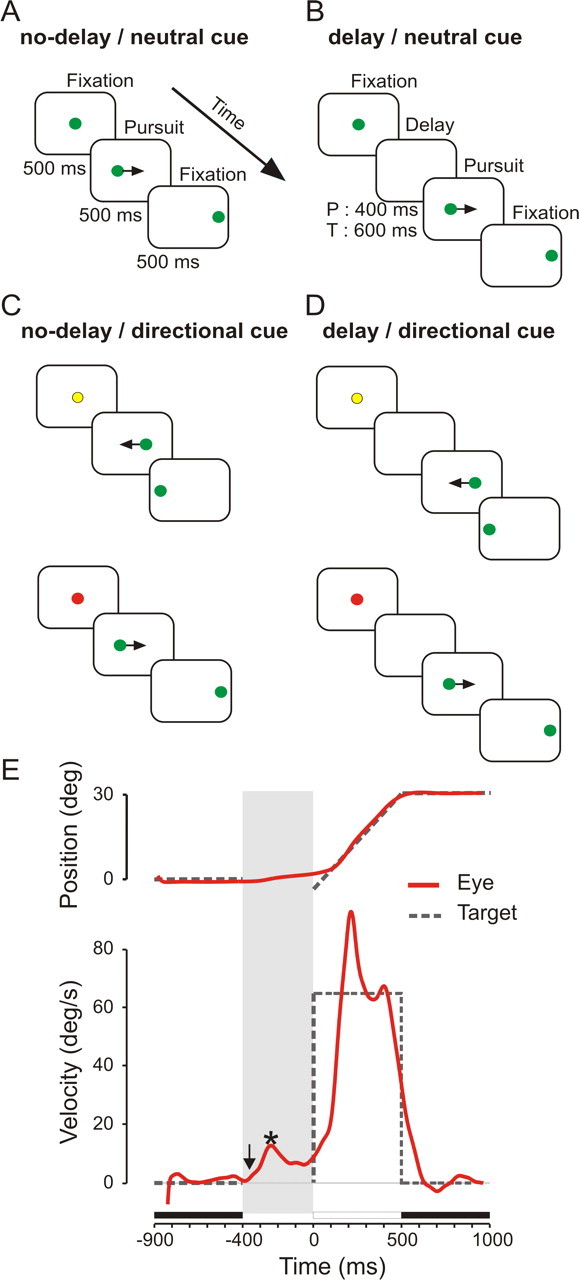
Experimental paradigm. Each trial was initiated by a cue-fixation period of 500 ms. Afterward, either the pursuit target immediately appeared at an eccentric position and started to move at 65°/s for 500 ms (A, C), or a delay period was introduced before target motion onset (400 ms in monkey P, 600 ms in monkey T; B, D). At the end of the pursuit period, subjects had to maintain fixation of the target in its final eccentric position for 500 ms. Target motion direction, to the left or to the right, was randomized. A, B, In neutral cue trials, the fixation point was always green before leftward or rightward target motion. C, D, In directional cue trials, the color of the fixation point informed subjects about upcoming target motion direction: red before rightward and yellow before leftward target motion, respectively. E, Example of a smooth-pursuit trial with anticipatory pursuit during the delay period (shaded area). Eye position and velocity signals are represented in red. The vertical arrow indicates anticipatory pursuit onset. The asterisk shows the time of maximum velocity. Dashed lines, Position (top) or velocity (bottom) of the target; filled horizontal bars, fixation periods; open horizontal bar, the period of target motion.
At the end of each trial, subjects had to maintain fixation of the target in its final eccentric position for 500 ms. The four possible combinations of delay and cue conditions were presented either during the same block or in different randomly interleaved blocks of trials, depending on the neuronal recording conditions.
Single-neuron recordings.
To record neuronal activity, a single tungsten microelectrode (FHC, Bowdoinham, ME) of ∼6 MΩ impedance at 1 kHz was lowered into the cortex through the dura using a microdrive (NaN Instruments, Nazareth, Israel). The position of the electrode was determined using a grid system (Crist et al., 1988). Action potentials of single units were isolated using an on-line spike-sorting system that uses a template-matching algorithm (Alpha Omega, Nazareth, Israel). A pulse was generated each time an action potential was detected and stored with a 1 ms resolution.
Analysis of neuronal activity.
To analyze the time course of neuronal activity, spike trains were convolved with a Gaussian probability density in steps of 1 ms to generate the spike-density function (Richmond et al., 1987). The SD of the Gaussian function was set to 20 ms. The average spike density in each experimental condition was computed from all trials in which subjects pursued the target until the end of its trajectory.
The significance of the modulation of neuronal activity by upcoming target motion direction and cue type (neutral vs directional) were tested with a two-way ANOVA. The dependent variable was the average spike density during three predefined periods. The first period covered the last 200 ms of the cue-fixation period (see Fig. 2, fix); the second period started at the end of the cue period and lasted for 200 ms into the delay period (referred to as “d1”); the last period started at the end of the previous one and extended for 200 ms further into the delay period (referred to as “d2”). This analysis with three different periods was necessary to take into account the variability of the timing of observed effects in different neurons. A further quantification of the timing effect is described in the next section.
Figure 2.
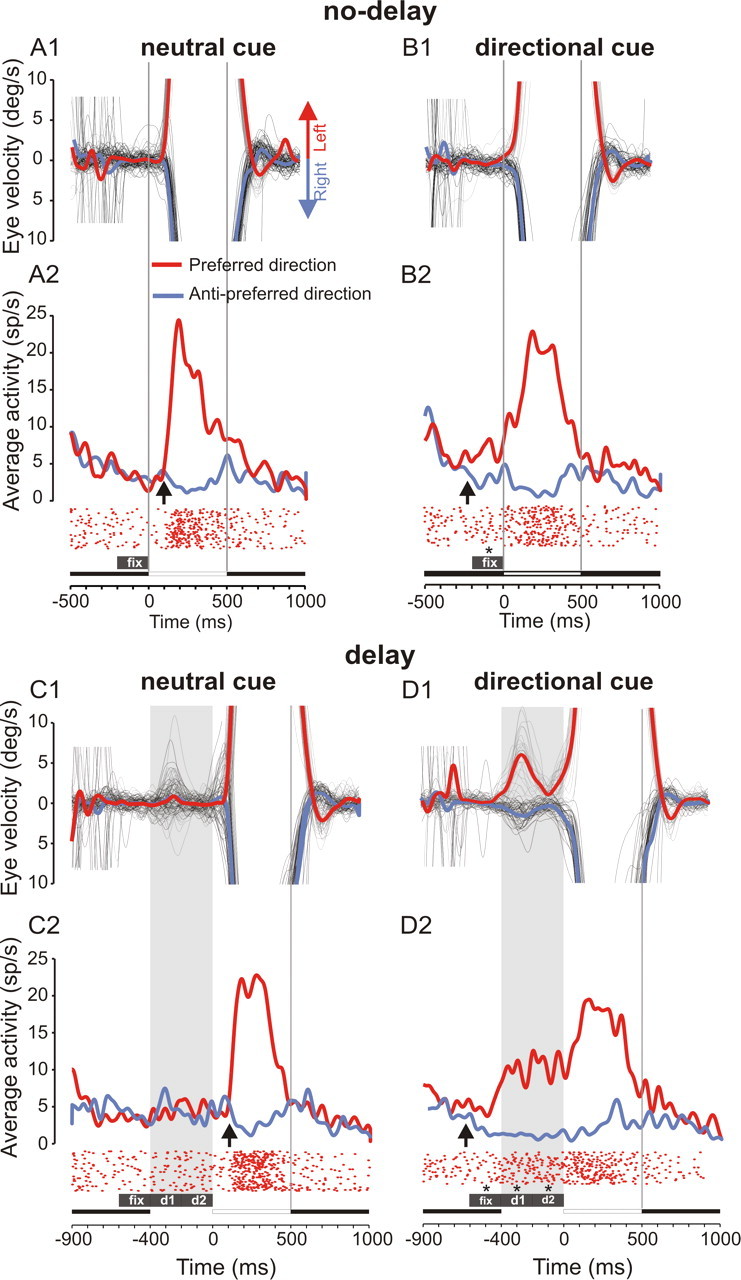
Influence of experimental conditions on anticipatory pursuit movements and neuronal activity. An example of activity of a single SEF neuron is shown. The four experimental conditions tested were randomly interleaved in a block of 200 trials. Each panel shows individual eye velocity traces (thin gray traces, leftward movements; thin black traces, rightward movements), average eye velocity (thick traces), spike densities (red, preferred direction; blue, antipreferred direction), and raster displays (preferred direction only) for the four experimental conditions tested. Upward arrows show when spike densities become statistically significantly different (Wilcoxon rank sum test, p < 0.05 for 100 ms). Boxes labeled fix, d1, and d2 indicate 200 ms periods of neuronal activity during which the influence of cue type and direction was measured and tested for statistical significance of observed effects. For this neuron, there was a significant effect of cued direction during the three periods fix, d1, and d2 (indicated with asterisks; ANOVA, p < 0.01). A1, A2, Neutral cue/no-delay condition. B1, B2, Directional cue/no delay. C1, C2, Neutral cue/delay. D1, D2, Directional cue/delay.
Latency of directional selectivity.
To determine the time at which directional selectivity emerged in each neuron, a nonparametric algorithm test was used (Kim et al. 2005). The algorithm used a rank sum test (Wilcoxon–Mann–Whitney) to compare the spike density during trials with target motion in the preferred and antipreferred directions, performed at every millisecond. The latency of directional selectivity was defined as the first sample at which the difference between spike densities for preferred and antipreferred directions became significantly different and remained significantly different for at least 100 ms (p < 0.05). The duration criterion was added to avoid the attribution of directional selectivity onset to a transient crossing of the statistical threshold.
Latency of anticipatory pursuit.
Anticipatory pursuit was defined as an eye velocity signal >1.5°/s observed between the onset of the fixation period and the onset of target motion (de Hemptinne et al., 2006). A duration criterion of 100 ms was used to eliminate trials with an accidental threshold crossing attributable to noise on the velocity signal. In this study, latencies were always measured with respect to the beginning of target motion onset (time 0).
Results
Expectation was altered experimentally by providing prior directional information in an ocular smooth-pursuit task. Figure 1 shows the experimental paradigm (see Materials and Methods for details). The direction of target motion was always either to the left or to the right randomly with the same probability. In the neutral cue condition, a green fixation cue was used that did not provide any prior directional information (Fig. 1A,B). In the directional cue condition, a yellow fixation cue preceded leftward target motion, and a red fixation cue preceded rightward target motion (Fig. 1C,D). Monkeys were trained to associate the color of the fixation cue with the direction of upcoming target motion. Moreover, to favor the occurrence of anticipatory pursuit, a delay period without stimulus on the screen was randomly interleaved between the end of the fixation period and target motion onset.
Behavior
Figure 1E shows a typical example of a smooth-pursuit trial that was preceded by an anticipatory movement [delay/directional cue condition (Fig. 1D)]. After the extinction of the initial fixation target (first black bar above the x-axis), the delay period began (Fig. 1E, shaded area) at the end of which the moving target appeared (open bar and dashed line). During the delay period, eye velocity increased in the direction of expected target motion. In this example, movement initiation occurred 362 ms before target motion onset (latency of the response, downward arrow), and eye velocity reached a maximum of 14.4°/s during the delay (Fig. 1E, asterisk).
The probability of anticipation occurrence, its latency, and eye velocity were all profoundly influenced by the type of instruction cue. An example of the influence of directional cueing on average eye velocity in the four experimental conditions tested ([directional cue vs neutral cue] × [delay vs no delay]) is shown in Figure 2. In the neutral cue/no-delay condition (Fig. 2A1), the target motion direction was unpredictable, and the fixation period was immediately followed by target motion either to the left or to the right. In this condition, the proportion of trials with anticipatory pursuit movements was rather small, and their velocity was weak (Tables 1 and 2 summarize the behavioral results obtained in the two subjects of this study). In the directional cue/no-delay condition (Fig. 2B1), target motion direction could be predicted because subjects learned the association between the color of the instruction cue and upcoming target motion direction. The proportion of anticipatory pursuit movements in a block of trials increased compared with the neutral cue condition. Introducing a delay between the disappearance of the fixation cue and target motion onset significantly facilitated anticipatory pursuit responses. In the neutral cue/delay condition (Fig. 2C1), anticipatory movements occurred frequently during the delay (Fig. 2C1, shaded area), their velocity reached a higher level than in the no-delay condition, and movement onset occurred early. In this condition, subjects often initiated anticipatory movements that could be either in the same or in the opposite direction of actual target motion. Finally, in the directional cue/delay condition (Fig. 2D1), anticipatory movements occurred in most trials, they were oriented in the direction of future target motion, their velocity was higher, and they were initiated earlier than in all the other conditions.
Table 1.
Summary of results for monkey P
| P (n = 23.651) | No-delay neutral cue | No-delay directional cue | Delay neutral cue | Delay directional cue |
|---|---|---|---|---|
| % Anticipation | 3% | 16% | 40% | 76% |
| % Error | 44% | 0% | 47% | 0% |
| Anticipatory latency (ms) | −27 | −24 | −294.5 | −348 |
| Anticipatory velocity (°/s) | 2.9 | 3.5 | 4.5 | 4.4 |
| Visually guided pursuit latency (ms) | 105 | 99 | 96 | 88 |
| Directional selectivity onset (ms) (n = 122) | 121 | −58 | 128 | −415 |
Median values of measured variables. Negative latency values indicate that movement initiation or directional selectivity occurred before target motion onset.
Table 2.
Summary of results for monkey T
| T (n = 5772) | No-delay neutral cue | No-delay directional cue | Delay neutral cue | Delay directional cue |
|---|---|---|---|---|
| % Anticipation | 10% | 38% | 65% | 77% |
| % Error | 35% | 0.64% | 52% | 0.7% |
| Anticipatory latency (ms) | −34 | −38 | −532 | −593 |
| Anticipatory velocity (°/s) | 3.8 | 7 | 4.3 | 5.7 |
| Visually guided pursuit latency (ms) | 97 | 93 | 95 | 82 |
| Directional selectivity onset (ms; n = 45) | 200 | −119 | 196 | −736 |
Median values of measured variables. Negative latency values indicate that movement initiation or directional selectivity occurred before target motion onset.
These behavioral results confirm that both monkeys used the information provided by the directional cue to initiate voluntarily anticipatory pursuit movements in the direction of expected target motion (de Hemptinne et al., 2006).
Neuronal activity in the SEF before anticipatory pursuit initiation
We recorded a total of 413 neurons from both monkeys. In this population, 75 neurons discharged differentially only after target motion onset, during pursuit either to the left or to the right. Additionally, 164 neurons were not modulated by presentation of the directional cue. Neurons from these two groups were not analyzed further. However, in 174 units (both monkeys; 174 of 413; 42%), neuronal activity was modulated by the presentation of the directional cue. These neurons were selected for additional testing.
Modulation of neuronal activity by prior directional information
Figure 2 shows the activity of a typical neuron, the activity of which was modulated depending on the availability of prior directional information. In the neutral cue/no-delay condition (Fig. 2A2), in the absence of prior directional information, the neuron discharged at a modest rate during the initial fixation period; its activity increased at the time of target motion onset and reached a maximum during visual pursuit. It returned to the prepursuit level during the final fixation period. This activity pattern suggests that this neuron could be classified as an SEF pursuit neuron, as described previously in the literature (Heinen and Liu, 1997; Fukushima et al., 2004). In the directional cue/no-delay condition (Fig. 2B2), neuronal activity started to increase during the cue fixation period. The cue that evokes an increase in neuronal activity during the fixation period will be referred to as the “preferred cue.” The other cue will be referred to as the “antipreferred cue.” Activity during the preferred cue presentation was significantly higher than during the same period in the neutral cue/no-delay condition (t test, p < 0.01; number of trials: n1 = 29, n2 = 91). In the neutral cue/delay condition (Fig. 2C2), the activity of the neuron remained at a low level during the delay period. However, in the directional cue/delay condition (Fig. 2D2), the activity built up during the cue period if the preferred cue had been presented and reached a higher level than in the neutral cue/delay condition (t test, p < 0.01; n1 = 28, n2 = 88). During the delay condition, it can be observed that activity after presentation of the antipreferred cue was lower than the activity evoked by the neutral cue (t test, p < 0.01).
Directional selectivity is a property of a neuron that discharges differentially for stimuli that move in different directions. Usually, directional selectivity is measured after stimulus onset. However, we found that directional cueing induced the emergence of directional selectivity before stimulus onset. When there was no delay, directional selectivity emerged 95 ms after target motion onset in the neutral cue condition (Wilcoxon rank sum test) (Fig. 2A2, upward arrow) and 218 ms before target motion onset in the directional cue condition (Fig. 2B2, upward arrow). A similar observation was made in the delay conditions. In neutral cue trials, directional selectivity emerged 96 ms after target motion onset. In directional cue trials, directional selectivity emerged 627 ms before target motion onset (Fig. 2C2,D2, upward arrows). Directional selectivity always emerged earlier in the cued conditions, because information about the direction of future target motion was made available during the cue fixation period.
The modulation of neuronal activity with cue type (neutral vs directional) and target direction (left vs right) was analyzed for each neuron in the delay condition with a two-way factorial ANOVA (α = 0.01). The dependent variables were the average spike densities during the three predefined 200 ms epochs preceding target motion onset (fix, d1, and d2) (Fig. 2, dark bars under the spike densities). The independent variables were cue type and target motion direction. Modulation of neuronal activity was considered significant if any of the three epochs showed a significant effect of an independent variable. Figure 3 shows graphically the three most frequently observed outcomes of this analysis (126 of 174 neurons; 72%; both subjects). First, a main effect of only cue type indicates that neuronal activity was significantly different in the directional cue condition independently of the direction being cued (example neuron in Fig. 3A). In this case, a general increase in neuronal activity in the directional cue condition above the level observed in the neutral cue condition was observed. This type of neuronal modulation could reflect a nonspecific arousal effect attributable to directional cueing. However, we found that only a small fraction of neurons recorded showed a significant main effect of cue type alone (28 of 174 neurons; 16%). Second, a significant main effect of only target motion direction indicates that neuronal activity increased or decreased for one of the two directions cued during the fixation period (example neuron in Fig. 3B, activity increase in the preferred direction). A large proportion of neurons belongs to this category (59 of 174 neurons; 34%). Third, a significant main effect of cue and direction with a significant interaction between those independent factors was often observed (example neuron in Figs. 2 and 3C) (39 of 174; 22%). The interaction effect in the ANOVA could be interpreted as the result of a significant increase in neuronal activity in the preferred direction associated with a significant decrease in activity in the antipreferred direction.
Figure 3.
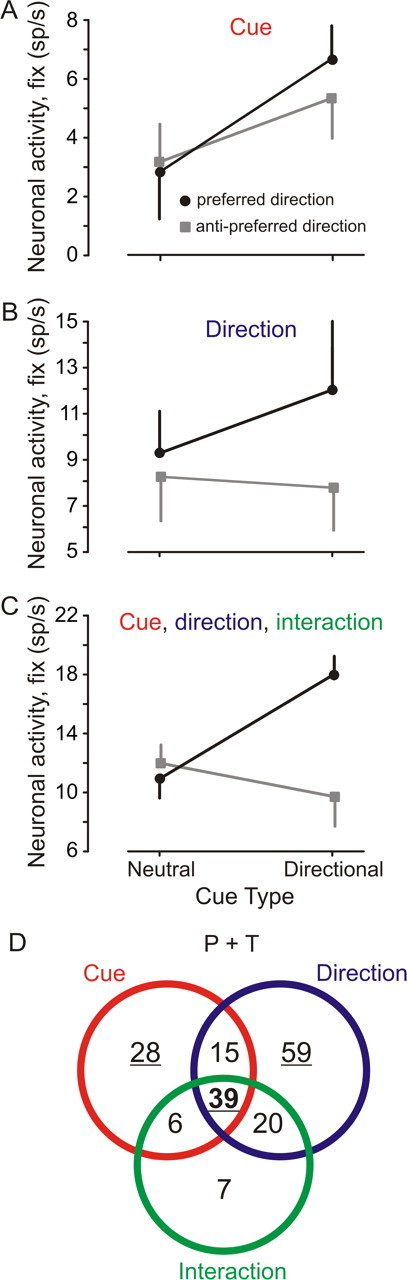
Examples of the outcome of the ANOVA applied to the data collected from each neuron. Factors were cue type and direction; dependent variables were the three predefined epochs fix, d1, and d2. Black symbols, Preferred direction; gray symbols, antipreferred direction. A, Neuron with a significant main effect of cue type only. B, Neuron with a significant main effect of cued direction only. C, Neuron with a significant main effect of cue type and cued direction and a significant interaction between factors. D, Venn diagram showing the number of neurons with the different statistical effects observed. Underlined figures show categories where examples presented in A–C were drawn. Data of the two subjects were pooled together.
The independent factor “direction” alone or in combination induced a significant modulation of neuronal activity in 76% of neurons (133 of 174; all neurons contained within the direction set) (Fig. 3D, blue circle). The most significant effects of the independent variables or of their interaction were observed during the fix period (108 of 174; 62%), followed by the d1 period (91 of 174; 52%) and the d2 period (74 of 174; 43%). A majority of neurons showed a significant effect during more than one period (112 of 174; 64%). Figure 3D takes into account significant ANOVA effects during the three different epochs: fix, d1, and d2. Neurons were classified as a function of observed ANOVA effects independently of the period when the effect was observed. Neurons were counted only once and belong to one category only. All neurons represented in the intersections of the Venn diagram have at least two different significant ANOVA effects (80 neurons). Sixty-four of theses neurons had ANOVA effects during more than one period (64 of 80 neurons; 80%). Among these 64 neurons, 43 neurons showed these effects during the same period (43 of 64; 67%), and 21 neurons showed these effects during different periods (21 of 64; 33%). For example, a neuron with a significant effect of cue during the fix period and a significant effect of direction during the d1 period would be represented in the intersection of the “cue” and direction sets in the Venn diagram.
Because the information about target motion direction was provided during the cue fixation period, these results show that the population of recorded neurons could be involved in the representation of expected target motion direction.
Population-averaged responses
In the majority of analyzed neurons (89%), neuronal activity was the most intense in the directional cue/delay condition. To estimate the modulation of neuronal activity at the population level, the population-averaged spike density was computed in the different experimental conditions for all neurons in monkey P (Fig. 4A,B) and monkey T (Fig. 4C,D). First, the average spike density was computed for each neuron in each condition and normalized using the maximum activity during the fixation period for the same condition. Thereafter, the population-averaged normalized spike density was computed by summing the normalized spike densities in the different conditions for all neurons and dividing the result by the number of neurons. Only neurons recorded in all four experimental conditions were used to compute the population responses shown in Figure 4 (122 of 174 neurons; 70%). In both monkeys, in the directional cue conditions, population-averaged normalized neuronal activities were the highest in the preferred direction (Fig. 4A–D, red curves) and the weakest in the antipreferred direction (Fig. 4A–D, blue curves). Neuronal activity in the neutral cue condition was intermediate between the preferred and antipreferred levels (Fig. 4A–D, gray and black curves). Therefore, presentation of the preferred cue caused an increase in spiking activity above the neutral cue level, whereas presentation of the antipreferred cue caused a reduction in spiking activity below the neutral cue level. Directional selectivity emerged earlier in the directional cue conditions (Fig. 4, upward red arrows) than in the neutral cue conditions (Fig. 4, upward gray arrows).
Figure 4.
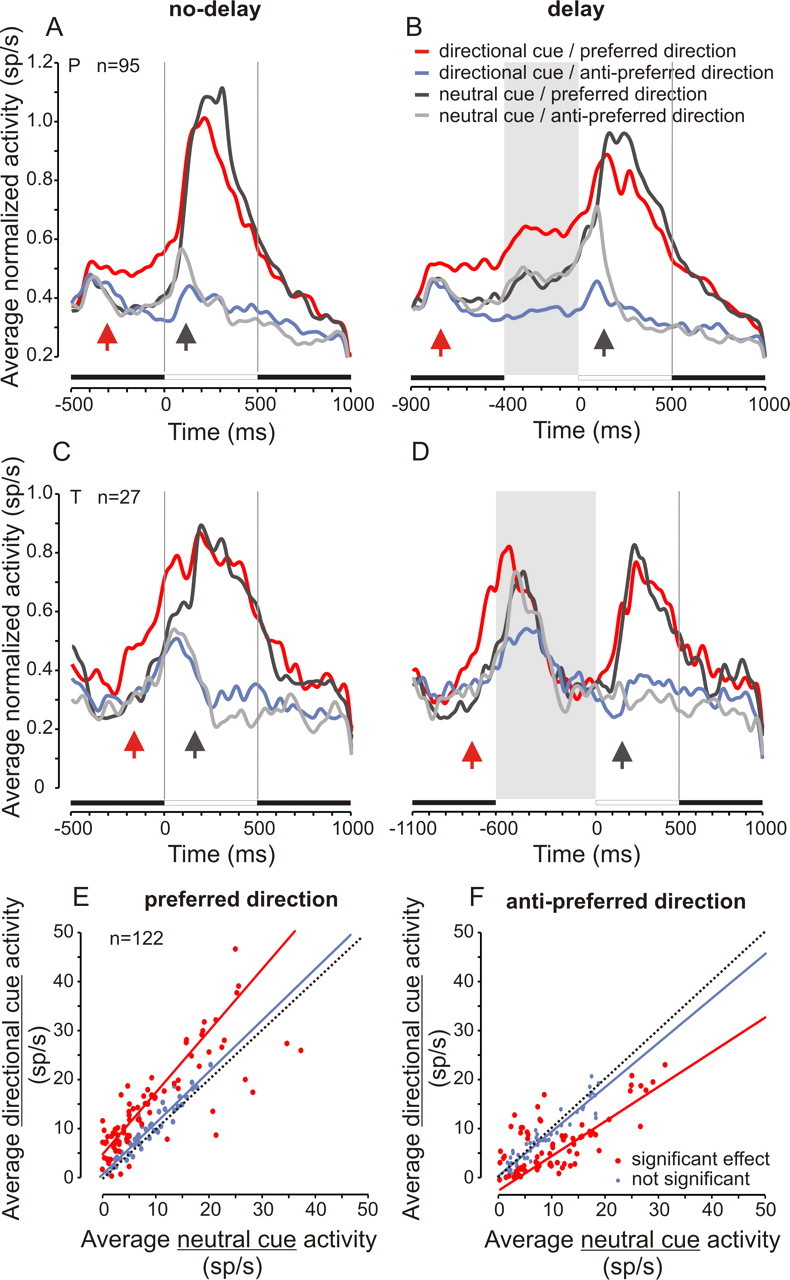
Population-averaged neuronal responses. A–D, Population-averaged normalized spike densities in the different experimental conditions. We included only neurons that were tested in all conditions and that showed a significant effect in the ANOVA with cue type and cued direction as independent variables and fix, d1, and d2 periods activity as dependent variables. See inset for color code. A, B, Monkey P. C, D, Monkey T. Left column, No delay; right column, delay condition. Upward arrows indicate when directional selectivity emerged, on average, in the directional (red arrow) and neutral (gray arrow) cue conditions using the Wilcoxon rank sum test. E, F, Relationship between activity in the neutral and directional cue conditions in the preferred (E) and in the antipreferred (F) directions. Red symbols represent neurons with a significant difference between directional and neutral cue activity (p < 0.05). In the preferred direction, most data points clustered above the diagonal line (thin dashed line), showing an increase in activity in the cued preferred direction (red line; y = 1.3 × x + 4.6; r = 0.94; n = 82). In the antipreferred direction, most points clustered below the diagonal line, showing a reduction in activity in the antipreferred cued direction (red line; y = 0.7 × x − 2.5; r = 0.92; n = 72). Blue symbols represent neurons without a significant difference between directional and neutral cue activity (p > 0.05; blue lines; preferred direction: y = 1.1 × x + 0.5; r = 0.95; n = 40; antipreferred direction: y = 0.9 × x + 0.4; r = 0.94; n = 50). Data from the two subjects are pooled together (total of 122 neurons).
The relationship between neutral cue and directional cue activity is shown in Figure 4, E and F, for the preferred and antipreferred directions, respectively. Each symbol represents a neuron. For each neuron, an ANOVA was used to determine the significance of activity modulation in the preferred and the antipreferred direction with cue type. The average spike density over fix, d1, and d2 periods was used as the dependent factor, and cue type was used as the independent factor. Neurons with a significant main effect of cue type are highlighted in red in Figure 4, E and F. For the preferred cue (Fig. 4E), most data points were clustered above the diagonal line, showing an increase in activity above the neutral cue level (67% of neurons with a significant effect). For the antipreferred cue (Fig. 4F), most data points were clustered below the diagonal line, showing a reduction in activity compared with the neutral cue level (59% of neurons with a significant effect).
Increased activity in the preferred direction associated with a decreased activity in the antipreferred direction explains the emergence of anticipatory directional selectivity in many neurons (52 of 122 neurons; 43%). In other neurons, anticipatory directional selectivity resulted from an increased activity in the preferred direction only (31 of 122; 25%) or decreased activity in the antipreferred direction only (23 of 122; 19%). Anticipatory directional selectivity can only be based on the learned association between the color of the directional cue and upcoming target motion direction.
To capture when directional selectivity emerged during the task, the fraction of neurons becoming directionally selective in anticipation of target motion was represented as a function of time elapsed. This analysis was restricted to the delay conditions. Figure 5 shows that in trials with a directional cue, the number of neurons becoming directionally selective rapidly increased during the cue-fixation period (Fig. 5A1, monkey P, B1, monkey T). More than 50% of neurons became directionally selective before the end of the cue-fixation period and before the time of anticipatory pursuit initiation, as can be observed by comparing the temporal evolution of the fraction of neurons becoming selective with the cumulative latency distributions (Fig. 5A2,B2) and average velocity profiles of the eye (Fig. 5A3,B3). Tables 1 and 2 provide median values of the latency of directional selectivity and anticipatory pursuit in both subjects. Directional selectivity emerged before anticipatory pursuit onset in the cue conditions but after movement onset in the no-cue conditions in most neurons. Figure 5 shows that 40 and 60% of neurons were directionally selective before anticipatory pursuit onset in monkey P and monkey T, respectively.
Figure 5.
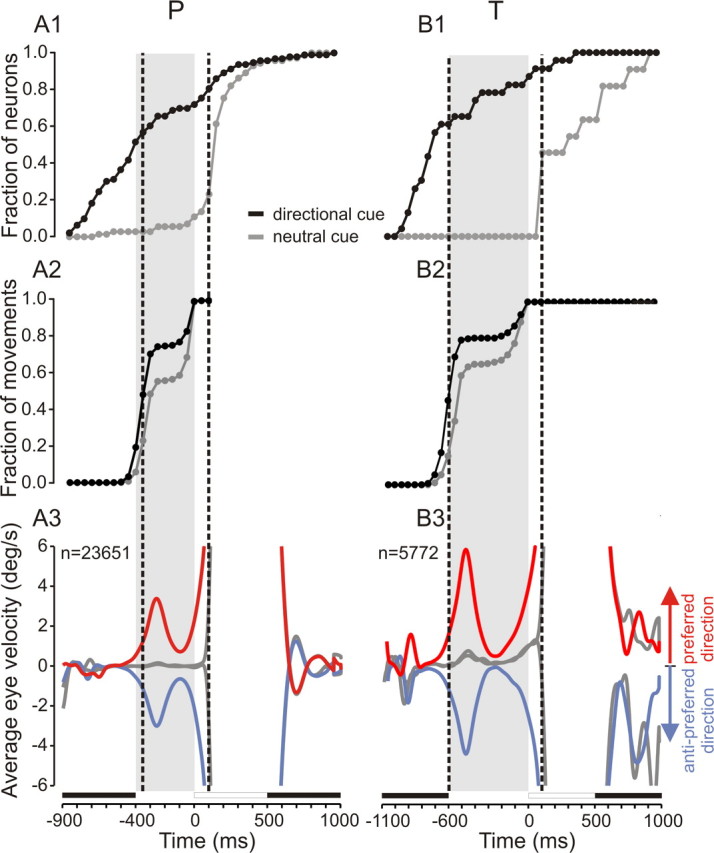
Emergence of directional selectivity for the population of recorded neurons. A1, B1, Fraction of neurons becoming directionally selective as a function of elapsed time. The x-axis represents time, and the y-axis represents the cumulative fraction of neurons that became directionally selective at corresponding times. Filled circles, Fraction of neurons in bins of 50 ms; black curve and symbols, directional cue condition; gray curve and symbols, neutral cue condition. The first vertical line shows the median latency of anticipatory pursuit onset. The second vertical line shows the latency of visual pursuit. A2, B2, Cumulative latency distribution of anticipatory pursuit movements. A3, B3, Velocity of the eye as a function of time during electrophysiological recordings of neurons represented in A1 and B1. Red curves, Directional cue/delay condition, preferred direction; blue curves, directional cue/delay condition, antipreferred direction; gray curves, neutral cue/delay condition. Left column, Monkey P; right column, monkey T.
Anticipatory directional selectivity and actual directional selectivity in the presence of the moving stimulus almost always coincided (>90% of neurons). This result suggests that the early emergence of directional selectivity could represent expected target motion direction. This directional expectation signal could consequently lead to anticipatory pursuit behavior.
Modulation of neuronal activity related to anticipatory pursuit
The involvement of SEF neurons in determining the characteristics of anticipatory pursuit was tested by computing correlations between neuronal activity and latency or maximum velocity of the movement. Strong correlations in a large proportion of neurons would suggest that their activity could play a role in encoding the characteristics of the upcoming anticipatory movement. Neuronal activity at the end of the cue period (fix) or during the first 200 ms of delay (d1) was used as the independent variable, and anticipatory pursuit latency or velocity was used as the dependent variable. We found that only a small fraction of neurons showed significant correlation coefficients (with anticipatory pursuit latency: 12 of 174 neurons, 7%; with anticipatory pursuit velocity: 8 of 174 neurons, 4%; data of the two subjects pooled together). Therefore, although a fraction of recorded neurons could take part to the determination of anticipatory movement latency and/or velocity, it is not likely that this is the primary role of recorded units.
To determine the possible role of recorded neurons in anticipatory pursuit behavior independently of their role in encoding expected target motion direction, trials in the delay/neutral cue condition were considered. Figure 6A shows an example of a single neuron that was recorded in the neutral cue condition, in which anticipatory pursuit movements occurred either in the preferred direction (Fig. 6A1, red eye velocity trace), in the antipreferred direction (Fig. 6A1, blue eye velocity trace), or not at all (Fig. 6A1, black eye velocity trace). Average spike densities (Fig. 6A2) show that neuronal activity was larger during anticipatory pursuit trials in the preferred direction (red curve) than during trials in the antipreferred direction (blue curve) or during trials when the monkey did not anticipate target motion onset (black curve). This result suggests that some recorded neurons could be involved in the initiation of an anticipatory pursuit movement. Therefore, for each neuron, activity during trials when subjects initiated an anticipatory pursuit movement in the preferred direction was compared with activity during control trials, without anticipatory pursuit in the preferred direction. A total of 122 neurons yielded a sufficient number of anticipatory and control trials (>10 trials). Figure 6B shows the relationship between activities during control trials (x-axis) and when anticipatory pursuit in the preferred direction was observed (y-axis). A majority of data points were clustered above the diagonal line (Fig. 6B, black dotted line). Average spike density before target motion onset during anticipatory pursuit trials in the preferred direction (11 ± 8 spikes/s) was significantly larger than in controls (9 ± 7 spikes/s; Wilcoxon test, p < 0.001). However, this increase in neuronal activity during anticipatory pursuit trials was attributable to an increased activity in a subset of recorded neurons, as revealed by neuron-by-neuron ANOVA. This ANOVA was done with average neuronal activity during the three predefined time periods as dependent variables (fix, d1, and d2) and presence or absence of anticipatory pursuit in the preferred direction as the classification factor. Thirty-seven neurons were significantly more active during anticipatory pursuit trials (p < 0.01; 37 of 122; 30%). Most of these neurons were grouped above the diagonal (Fig. 6B, large red symbols). Average spike density before target motion onset was 6 ± 6 spikes/s in controls and 12 ± 8 spikes/s in anticipatory pursuit trials (Fig. 6B, large red squares). Neurons with activity that was not significantly modulated before anticipatory pursuit were clustered around the diagonal line (Fig. 6B, blue symbols), as expected. Average spike density before target motion onset was 10 ± 7 spikes/s in controls and 10 ± 7 spikes/s in anticipatory pursuit trials (Fig. 6B, large blue squares).
Figure 6.
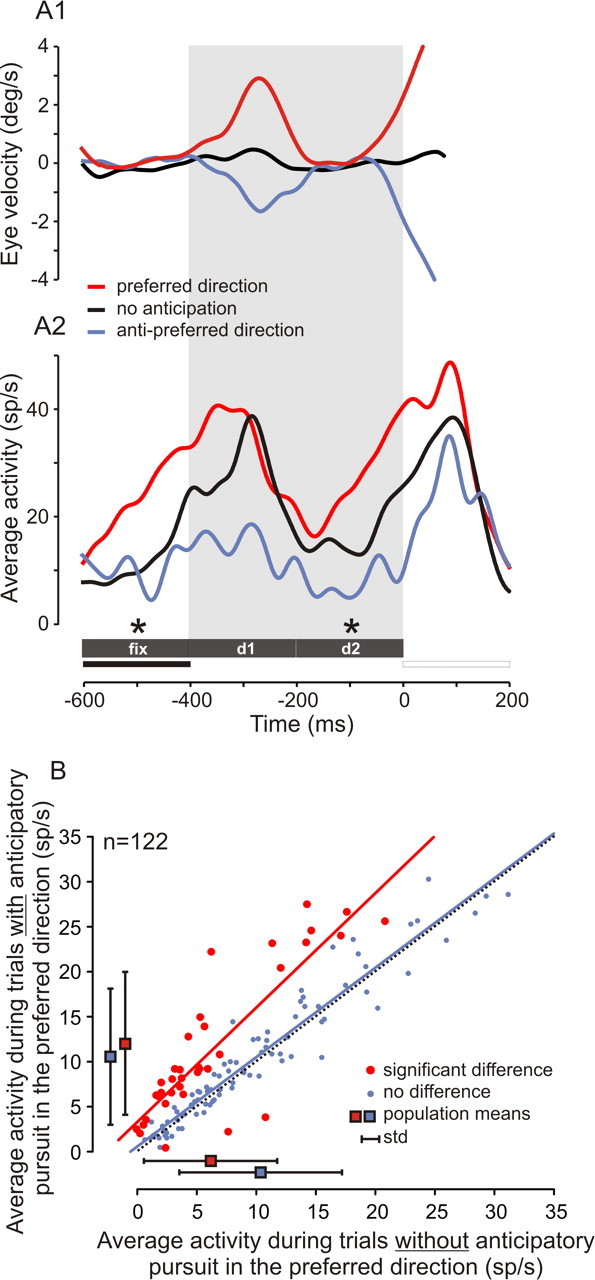
Behavioral relevance, I. Shown is an example of a single neuron with activity that was significantly modulated during anticipatory pursuit trials. A1, Average eye velocity as a function of time for trials with anticipatory pursuit in the preferred (red curve) or in the antipreferred (blue curve) direction and for trials without anticipatory pursuit (black curve). A2, Neuronal activity recorded during the same pursuit trials as above. Asterisks indicate the period during which a significant difference in spike density was observed between trials without or with anticipatory pursuit in the preferred direction (ANOVA, p < 0.05). B, Relationship between neuronal activity during trials without (x-axis) or with (y-axis) anticipatory pursuit in the preferred direction. Red dots represent neurons with a significant difference in average spike density before target motion onset between these two types of trials (ANOVA, p < 0.05). Most neurons with a significant effect were clustered above the diagonal, showing an increase in activity during anticipatory pursuit trials. The red line is the regression line through data points representing neurons with a significant increase in neuronal activity (y = 3.3 + 1.2 × x; r = 0.92; n = 37). The blue line is the regression line through data points representing neurons without a significant difference (y = 0.8 + 1.0 × x; r = 0.91; n = 85). Data for the two subjects are pooled together. Blue squares represent the average activity during the two types of trials for neurons not significantly modulated by anticipatory pursuit occurrence (±SD), and red squares represent the average activity for neurons that were significantly modulated.
Figure 7A shows the average activity of 29 neurons tested with a 400 ms delay duration and with activity that significantly increased during anticipatory pursuit trials in the preferred direction (neutral cue condition; same color code as in Fig. 6A). Neuronal activity started to increase at the end of the fixation period and peaked during the first half of the delay period. Afterward, activity transiently decreased and increased again before target motion onset. This variation of average spike density is comparable to the variation in average eye velocity during anticipatory pursuit trials. Figure 7B shows a comparison of average eye velocity (dashed curve) with average spike density (red curve) during the fixation and delay period for the same group of 29 neurons. Average spike density increased before anticipatory pursuit velocity increased. The two signals had a similar time course, and a cross-correlation analysis of eye velocity and spike density yielded a maximum correlation of 0.6 if signals were shifted in time by 41 ms [see methods of Missal et al. (2000)]. This result suggests that, on average, neuronal activity in the SEF increased 41 ms before anticipatory pursuit eye velocity.
Figure 7.
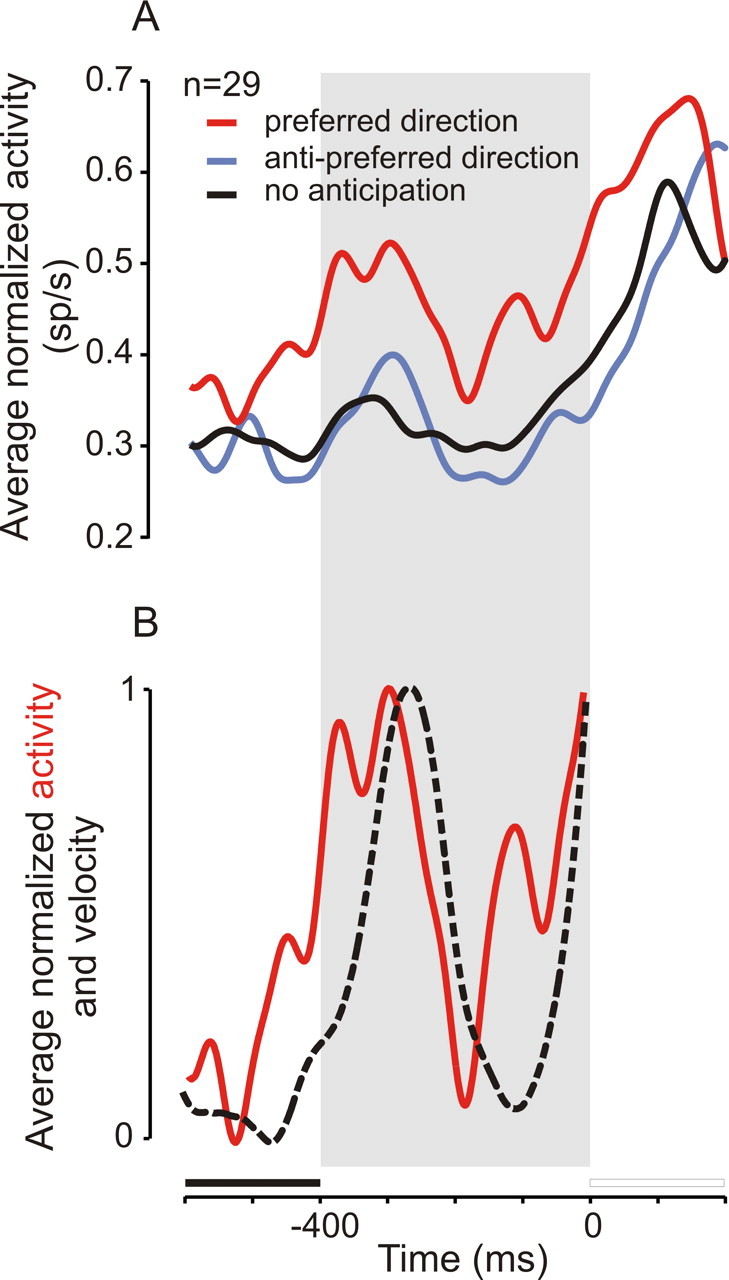
Behavioral relevance, II. A, Average spike density for 29 neurons tested with a 400 ms delay during anticipatory pursuit trials in the preferred direction (red curve), in the antipreferred direction (blue curve), and in the absence of anticipation (black curve). B, Comparison between normalized spike density in the preferred direction (red curve; same data as red curve in A) and normalized eye velocity of anticipatory pursuit movements during the same trials (black dashed curve). Note the early increase in the spike density at the end of the fixation period, before movement initiation.
Results presented above suggest that some of the recorded neurons could be involved in the process of anticipatory pursuit initiation. To further support this hypothesis, neuronal activity during error trials was analyzed. During error trials, subjects initiated an anticipatory pursuit movement in a direction that was not the actual target motion direction. Indeed, in the neutral cue condition, anticipatory pursuit movements were often wrongly oriented, because subjects tried to guess the direction of the upcoming target in the absence of directional cue. During such anticipatory pursuit trials in the preferred direction (Fig. 8A, yellow and orange curves), neuronal activity related to movement initiation should increase before target motion onset and continue to increase during visual pursuit initiation if it occurs also in the preferred direction (“good guesses,” referred to as compatible ++ trials because anticipatory and visual pursuit were both in the preferred direction) (Fig. 8A, yellow curve) and should decrease during visual pursuit if it occurs in the antipreferred direction (“wrong guesses,” referred to as incompatible +− trials because anticipatory and visual pursuit were in opposite directions) (Fig. 8A, orange curve). During anticipatory pursuit trials in the antipreferred direction (Fig. 8A, blue and green curves), neuronal activity should be at a low level before target motion onset and remain at a low level during visual pursuit initiation if it occurs also in the antipreferred direction (good guesses, referred to as compatible − trials) (Fig. 8A, blue curve) and should increase during visual pursuit if it occurs in the preferred direction (wrong guesses, referred to as incompatible −+ trials) (Fig. 8A, green curve). Figure 8B shows the average spike densities for anticipatory pursuit movements in the preferred and antipreferred directions for the same set of 29 neurons shown in Figure 7. As predicted, in the preferred direction, the spike density increased before and during target motion in compatible trials (++ trials) (Fig. 8B, yellow curve) and abruptly decreased after motion onset in incompatible trials (+− trials) (Fig. 8B, orange curve). In the antipreferred direction, the spike density was at a low level before and during target motion in compatible trials (Fig. 8B, blue curve, −− trials) and increased after motion onset in incompatible trials (Fig. 8B, green curve, −+ trials). In conclusion, neuronal activity during error trials in the neutral cue condition is compatible with the hypothesis that some SEF neurons could play an early premotor role in the guidance of anticipatory pursuit.
Figure 8.
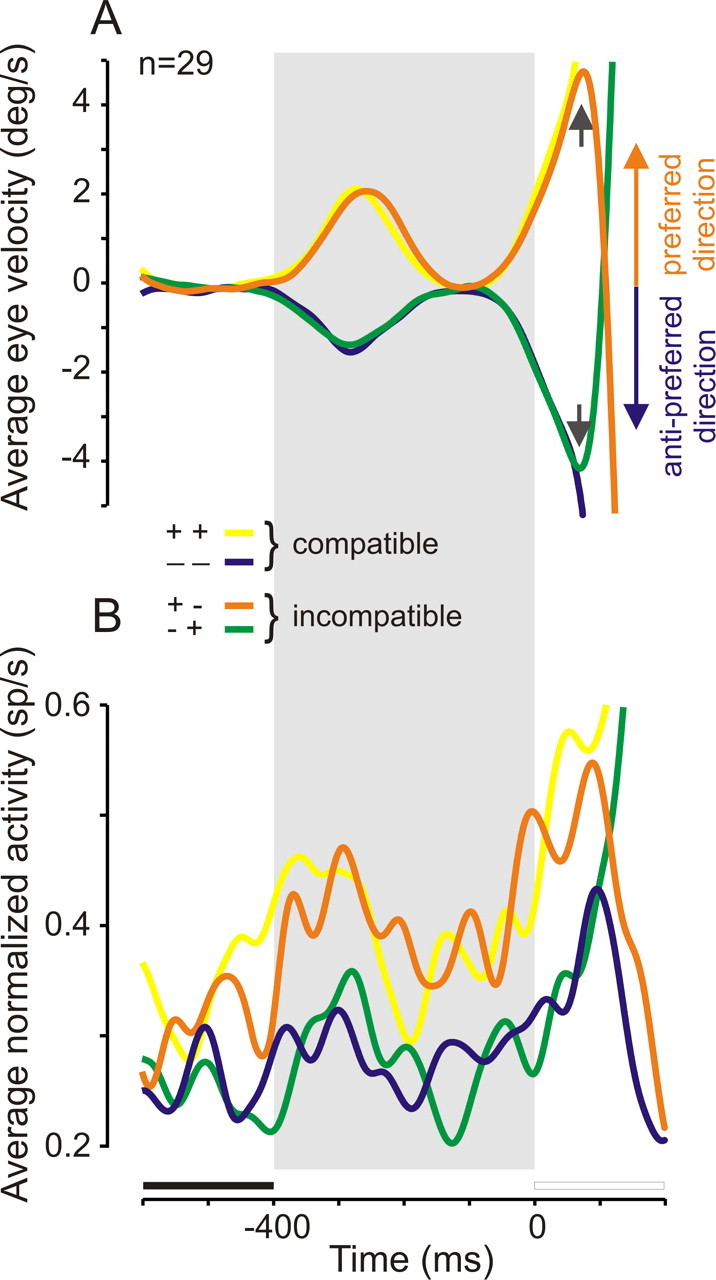
Neuronal correlate of anticipatory pursuit initiation. A, Eye velocity during compatible and incompatible anticipatory pursuit trials in the preferred (yellow and orange curves) and antipreferred (green and blue curves) directions. Small arrows indicate when eye velocity abruptly changed because target motion direction did not coincide with the anticipatory pursuit “guess.” B, Average spike density during the same compatible and incompatible trials for 29 neurons. See Results for details.
The cross-correlation between average spike density and eye velocity suggests that neuronal activity in the preferred direction increased ∼40 ms before anticipatory pursuit initiation. This result was obtained in the neutral cue condition, when anticipatory pursuit responses were initiated in the absence of prior directional information but the subject nevertheless made a choice about upcoming target motion direction. We have shown that in the neutral cue condition, the large majority of recorded neurons became directionally selective only after target motion onset (Fig. 5). However, if only neurons significantly more active during anticipatory pursuit trials were selected (n = 29; same neurons as in Fig. 7), directional selectivity most often emerged before anticipatory pursuit onset in the same condition. Figure 9 shows that the cumulative fraction of directionally selective neurons (filled symbols) increased during the neutral cue fixation period, before movement initiation (open symbols; latency distribution). Because there was no prior directional information in this condition and the same neutral cue was presented, the early emergence of directional selectivity could be associated with the determination of the direction of the next anticipatory pursuit movement. In the paradigm used in the present study, randomization of delay occurrence evoked early and late anticipatory movements. Therefore, the latency distribution of anticipatory pursuits is bimodal (Fig. 5A2,B2) (see also de Hemptinne et al., 2006, 2007). Figure 9 shows that the cumulative latency distribution of anticipatory pursuit movements shows two abrupt increases (onset indicated by vertical dashed lines; see also a′ and b′). We found that these two abrupt increases in the distribution of movement latencies were preceded two abrupt increases in the fraction of directionally selective neurons by 150 ms (Fig. 9, see periods labeled a and b and double-headed arrows). Therefore, the bimodality of the directional selectivity distribution of SEF neurons could be related to the bimodality of the latency distribution of anticipatory pursuits. An early increase in the fraction of directionally selective neurons preceded early anticipatory movements, and a late increase preceded late anticipatory responses.
Figure 9.

Temporal relationships. Cumulative distribution of directional selectivity onset (filled symbols) and cumulative anticipatory pursuit latency distribution (open symbols) as a function of time during the fixation and delay periods. Double-headed arrows show the temporal delay between rapid increases in the two distributions. See Results for details.
Location of recording sites
Figure 10 shows the location of recording sites projected onto a dorsal view of the brain redrawn from magnetic resonance imaging scans. Sites where neurons were recorded overlap with the oculomotor region of the DMFC, more precisely with the caudal edge of the SEF as defined from electrical microstimulation studies (Tehovnik, 1995). This region corresponds to the area where neurons active during smooth pursuit were found (Fukushima et al., 2004). There was no consistent relationship between the hemisphere the neurons were recorded from and preferred smooth-pursuit direction. In monkey P, all neurons were recorded from the left hemisphere: 59 of 129 neurons (46%) had a rightward and 70 of 129 neurons (54%) had a leftward preferred direction. In monkey T, 25 neurons were recorded from the right hemisphere: 13 of 25 neurons (52%) had a rightward and 12 of 25 neurons (48%) had a leftward preferred direction. Twenty neurons were recorded from the left hemisphere, and 8 of 20 neurons (40%) had a rightward and 12 of 20 neurons (60%) had a leftward preferred direction.
Figure 10.

Location of recording sites. Location of recording sites projected onto a dorsal view of the macaque brain. Large circles represent recording chambers. Grids within recording chambers represent the coordinate system of Crist et al. (1988). as, Arcuate sulcus; cs, central sulcus; genu, genu of the arcuate sulcus. Black dots indicate where neurons were recorded. The size of the dots is proportional to the number of significantly modulated neurons that were recorded at a particular site.
Discussion
We found that a population of neurons recorded in the DMFC, in the region of the SEF, increased its activity when a cue was used to inform subjects about upcoming target motion in a preferred direction. This activity persisted during a delay period in the absence of any visible stimulus on the screen. The activity level in the antipreferred direction was reduced and, on average, lower than when a neutral cue was given. In the directional cue conditions, directional selectivity emerged before anticipatory pursuit and target motion onsets. In a large proportion of neurons, neuronal activity was significantly higher during anticipatory pursuit trials.
Behavioral relevance of neuronal modulation
In the task used in the present study, a color cue was used to elicit an expectation about the direction of motion of an upcoming target. This expectation often led to a subsequent anticipatory pursuit movement. Expectation of target motion in the cued direction precedes the preparation of the motor response itself. We suggest that anticipatory directional selectivity constitutes a neural correlate of the expectation of target motion direction. Indeed, anticipatory directional selectivity and actual directional selectivity in the presence of the moving stimulus almost always coincided (>90% of neurons). Moreover, 50% of recorded neurons became directionally selective before anticipatory pursuit onset, at the time when information provided by the cue is progressively translated into an oculomotor command. Therefore, anticipatory directional selectivity in recorded SEF neurons in the directional cue conditions could represent a top-down expectation signal that precedes the initiation of an anticipatory response.
We also wanted to differentiate the aforementioned expectation signal from a premotor signal involved in initiating the anticipatory movements. Therefore, we examined trials in the neutral cue condition, in which subjects “guessed” the direction of the upcoming target and initiated an anticipatory pursuit response. In this condition, neuronal activity cannot be attributed to the presentation of the directional cue and could reflect movement preparation per se. We found that the activity level in a subset of recorded neurons (30%) was higher before anticipatory pursuit movements in the preferred direction than in the same condition when no anticipatory pursuit movements were observed. Therefore, these neurons could be directly involved in anticipatory pursuit initiation. The short delay between increasing neuronal activity in the preferred direction and increasing eye velocity (40 ms) is compatible with this premotor hypothesis. However, directional selectivity in the neutral cue condition emerged earlier with respect to movement initiation. Indeed, increases in the bimodal distribution of directional selectivity onset preceded similar increases in the latency distribution of movement onset by 150 ms (Fig. 9). We suggest that early directional selectivity onset in the neutral cue condition reflects the decision about the direction of the next anticipatory movement. Moreover, the bimodality of the selectivity distribution parallels the bimodality of the anticipatory pursuit latency distribution, suggesting that the timing of movement initiation is also represented in the temporal evolution of neuronal activity in the SEF.
On average, the build up of neuronal activity started at the end of the fixation period. The latter result is compatible with a previous microstimulation study of the SEF during anticipatory pursuit preparation. Indeed, in a similar experimental paradigm, it has been shown that electrical microstimulation in the SEF region during the end of the fixation period facilitates anticipatory pursuit occurrence (Missal and Heinen, 2004). Together, these results support the hypothesis that the SEF plays a role in the early phase of anticipatory pursuit preparation, toward the end of the cue-fixation period.
Position of the SEF in the anticipatory pursuit pathway
The SEF is not the only frontal area involved in anticipatory pursuit preparation. Parts of the frontal eye field (FEF) in the fundus and in the posterior bank of the arcuate sulcus are also involved in the control of smooth-pursuit eye movements (Lynch, 1987; Keating, 1991, 1993; MacAvoy et al., 1991; Gottlieb et al., 1993, 1994; Tian and Lynch, 1996a,b; Tanaka and Fukushima, 1998; Fukushima et al., 2000; Tanaka and Lisberger, 2001; Carpenter, 2005). Surgical ablation or chemical inactivation of the FEF impairs visually initiated smooth pursuit, suggesting an essential role of this structure in the premotor pathway for pursuit (Lynch, 1987; Keating, 1991; MacAvoy et al., 1991; Shi et al., 1998). One report suggests that the FEF lesion impairs anticipatory and predictive pursuit as well (MacAvoy et al., 1991). In agreement with this observation, Fukushima et al. (2002) have shown that the majority of periarcuate pursuit neurons could encode the direction and speed of a pursuit target that is briefly extinguished during part of its trajectory. Therefore, both the FEF and SEF are involved in pursuit based on extra-retinal information. These two areas are heavily interconnected (Huerta and Kaas, 1990). However, we suggest that the SEF might be particularly involved in using the learned association between a visual feature such as color or shape and upcoming target motion (Chen and Wise, 1995a,b, 1996; Kim et al., 2005), and the FEF might be more involved in prediction based on recently experienced target motion (Fukushima et al., 2002; Xiao et al., 2007). Prediction requires a mapping between an object of interest and its likely future motion direction. The SEF might be involved in establishing and activating this mapping as a function of behavioral demand. Moreover, in the present study, anticipatory directional selectivity was maintained during the delay period, suggesting that the SEF might be involved in maintaining the activated association in working memory before target motion onset.
Anticipatory activity in different oculomotor domains
Anticipatory neuronal activity has also been found in the SEF before saccadic eye movements (Coe et al., 2002). Indeed, in a saccade free-choice task in which monkeys could choose between two eccentric visual targets, anticipatory activity increased before the appearance of the visual stimuli and predicted the subjects' choice. Moreover, Coe et al. (2002) have compared this anticipatory activity in three different cortical oculomotor structures: the SEF, the FEF, and the lateral intraparietal cortex (see also Eskandar and Assad, 1999). Anticipatory activity was largest in the SEF, compared with the other two cortical areas. Therefore, we conclude that the activity of some SEF neurons could represent the expectation of the subject about the upcoming stimulus position (in a saccadic task) or movement direction (in a pursuit task). This would place the SEF outside both the smooth-pursuit and saccadic system and would suggest a “supramodal” role of this area in conditions when expectation about the upcoming stimulus could build up (Heinen and Keller, 2003; Missal and Heinen, 2004). The results of the present study reinforce the hypothesis that the SEF might be particularly involved in actions that are self-generated rather than guided by an external sensory stimulus (Carpenter, 2004).
Competition between the representations of future events
We suggest that the neural representation of cognitive expectation could be conceptualized as resulting from a competitive interaction between pools of neurons representing the two different likely directions of future target motion. Indeed, in neurons recorded in the present study, an increased activity in the preferred direction was often associated with a reduction in activity in the antipreferred direction, below the level associated with the neutral cue conditions. Therefore, neurons with opposite preferred directions could inhibit each other (via an inhibitory interneuron). This hypothetical inhibitory interaction would result in an increased signal-to-noise ratio of the population activity encoding expected direction and could be interpreted as a suppression of the representation of the “distractor” direction, or filtering out the unlikely future direction, resulting in an increased selectivity of neurons representing the “target” direction (Bushnell et al., 1981). The proposed interpretation is similar to what has been hypothesized to happen in visual areas V2 and V4 when at least two stimuli are in the receptive field (Desimone and Duncan, 1995; Luck et al., 1997; Reynolds et al., 1999) (for discussion, see Verghese, 2001). When two or more stimuli are in the receptive field of a visual neuron, orientation of attention to one stimulus filters out the response to the unattended stimulus by a competitive selection mechanism (Desimone and Duncan, 1995). In the neutral cue condition, neuronal activity was partway between the activity evoked by the preferred and antipreferred cue, as is expected to happen in a competitive selection mechanism. Although we did not map the extent of the receptive fields in the present study, it is very likely that the cue at the fixation position was within their limits, because SEF receptive fields are known to be very broad (Russo and Bruce, 1996).
Conclusion
This study shows that SEF neurons are involved both in coding upcoming target motion direction and in the preparation of the next anticipatory pursuit movement. Similar mechanisms could drive prediction before movement initiation in other motor domains.
Footnotes
This work was supported by the Belgian Fonds National de la Recherche Scientifique, the Fondation pour la Recherche Scientifique Médicale, the Belgian Program on Interuniversity Attraction Poles initiated by the Belgian Federal Science Policy Office, and internal research grants from the Université catholique de Louvain (Fonds Spéciaux de Recherche, Action de Recherche Concertée). The scientific responsibility rests with the authors. We are indebted to Etienne Olivier and Jeremy Badler for comments on previous versions of this manuscript.
References
- Baddeley A. Working memory: looking back and looking forward. Nat Rev Neurosci. 2003;4:829–839. doi: 10.1038/nrn1201. [DOI] [PubMed] [Google Scholar]
- Badler JB, Heinen SJ. Anticipatory movement timing using prediction and external cues. J Neurosci. 2006;26:4519–4525. doi: 10.1523/JNEUROSCI.3739-05.2006. [DOI] [PMC free article] [PubMed] [Google Scholar]
- Barnes GR, Asselman PT. The mechanism of prediction in human smooth pursuit eye movements. J Physiol (Lond) 1991;439:439–461. doi: 10.1113/jphysiol.1991.sp018675. [DOI] [PMC free article] [PubMed] [Google Scholar]
- Barnes GR, Schmid AM, Jarrett CB. The role of expectancy and volition in smooth pursuit eye movements. Prog Brain Res. 2002;140:239–254. doi: 10.1016/S0079-6123(02)40054-4. [DOI] [PubMed] [Google Scholar]
- Berman RA, Colby CL, Genovese CR, Voyvodic JT, Luna B, Thulborn KR, Sweeney JA. Cortical networks subserving pursuit and saccadic eye movements in humans: an FMRI study. Hum Brain Mapp. 1999;8:209–225. doi: 10.1002/(SICI)1097-0193(1999)8:4<209::AID-HBM5>3.0.CO;2-0. [DOI] [PMC free article] [PubMed] [Google Scholar]
- Boman DK, Hotson JR. Stimulus conditions that enhance anticipatory slow eye movements. Vision Res. 1988;28:1157–1165. doi: 10.1016/0042-6989(88)90142-3. [DOI] [PubMed] [Google Scholar]
- Burke M, Barnes G. Brain and behavior: a task-dependent eye movement study. Cereb Cortex. 2008;18:126–135. doi: 10.1093/cercor/bhm038. [DOI] [PubMed] [Google Scholar]
- Bushnell MC, Goldberg ME, Robinson DL. Behavioral enhancement of visual responses in monkey cerebral cortex. I. Modulation in posterior parietal cortex related to selective visual attention. J Neurophysiol. 1981;46:755–772. doi: 10.1152/jn.1981.46.4.755. [DOI] [PubMed] [Google Scholar]
- Carpenter RH. Supplementary eye field: keeping an eye on eye movement. Curr Biol. 2004;14:R416–R418. doi: 10.1016/j.cub.2004.05.032. [DOI] [PubMed] [Google Scholar]
- Carpenter RH. Visual pursuit: an instructive area of cortex. Curr Biol. 2005;15:R638–R640. doi: 10.1016/j.cub.2005.08.004. [DOI] [PubMed] [Google Scholar]
- Chen LL, Wise SP. Neuronal activity in the supplementary eye field during acquisition of conditional oculomotor associations. J Neurophysiol. 1995a;73:1101–1121. doi: 10.1152/jn.1995.73.3.1101. [DOI] [PubMed] [Google Scholar]
- Chen LL, Wise SP. Supplementary eye field contrasted with the frontal eye field during acquisition of conditional oculomotor associations. J Neurophysiol. 1995b;73:1122–1134. doi: 10.1152/jn.1995.73.3.1122. [DOI] [PubMed] [Google Scholar]
- Chen LL, Wise SP. Evolution of directional preferences in the supplementary eye field during acquisition of conditional oculomotor associations. J Neurosci. 1996;16:3067–3081. doi: 10.1523/JNEUROSCI.16-09-03067.1996. [DOI] [PMC free article] [PubMed] [Google Scholar]
- Coe B, Tomihara K, Matsuzawa M, Hikosaka O. Visual and anticipatory bias in three cortical eye fields of the monkey during an adaptive decision-making task. J Neurosci. 2002;22:5081–5090. doi: 10.1523/JNEUROSCI.22-12-05081.2002. [DOI] [PMC free article] [PubMed] [Google Scholar]
- Crist CF, Yamasaki DS, Komatsu H, Wurtz RH. A grid system and a microsyringe for single cell recording. J Neurosci Methods. 1988;26:117–122. doi: 10.1016/0165-0270(88)90160-4. [DOI] [PubMed] [Google Scholar]
- de Hemptinne C, Lefèvre P, Missal M. Influence of cognitive expectation on the initiation of anticipatory and visual pursuit eye movements in the rhesus monkey. J Neurophysiol. 2006;95:3770–3782. doi: 10.1152/jn.00007.2006. [DOI] [PubMed] [Google Scholar]
- de Hemptinne C, Nozaradan S, Duvivier Q, Lefèvre P, Missal M. How do primates anticipate uncertain future events? J Neurosci. 2007;27:4334–4341. doi: 10.1523/JNEUROSCI.0388-07.2007. [DOI] [PMC free article] [PubMed] [Google Scholar]
- Desimone R, Duncan J. Neural mechanisms of selective visual attention. Annu Rev Neurosci. 1995;18:193–222. doi: 10.1146/annurev.ne.18.030195.001205. [DOI] [PubMed] [Google Scholar]
- Eskandar EN, Assad JA. Dissociation of visual, motor and predictive signals in parietal cortex during visual guidance. Nat Neurosci. 1999;2:88–93. doi: 10.1038/4594. [DOI] [PubMed] [Google Scholar]
- Fukushima J, Akao T, Takeichi N, Kurkin S, Kaneko CR, Fukushima K. Pursuit-related neurons in the supplementary eye fields: discharge during pursuit and passive whole body rotation. J Neurophysiol. 2004;91:2809–2825. doi: 10.1152/jn.01128.2003. [DOI] [PubMed] [Google Scholar]
- Fukushima J, Akao T, Kurkin S, Kaneko CR, Fukushima K. The vestibular-related frontal cortex and its role in smooth-pursuit eye movements and vestibular-pursuit interactions. J Vestib Res. 2006;16:1–22. [PMC free article] [PubMed] [Google Scholar]
- Fukushima K, Sato T, Fukushima J, Shinmei Y, Kaneko CR. Activity of smooth pursuit-related neurons in the monkey periarcuate cortex during pursuit and passive whole-body rotation. J Neurophysiol. 2000;83:563–587. doi: 10.1152/jn.2000.83.1.563. [DOI] [PubMed] [Google Scholar]
- Fukushima K, Yamanobe T, Shinmei Y, Fukushima J. Predictive responses of periarcuate pursuit neurons to visual target motion. Exp Brain Res. 2002;145:104–120. doi: 10.1007/s00221-002-1088-7. [DOI] [PubMed] [Google Scholar]
- Gottlieb JP, Bruce CJ, MacAvoy MG. Smooth eye movements elicited by microstimulation in the primate frontal eye field. J Neurophysiol. 1993;69:786–799. doi: 10.1152/jn.1993.69.3.786. [DOI] [PubMed] [Google Scholar]
- Gottlieb JP, MacAvoy MG, Bruce CJ. Neural responses related to smooth-pursuit eye movements and their correspondence with electrically elicited smooth eye movements in the primate frontal eye field. J Neurophysiol. 1994;72:1634–1653. doi: 10.1152/jn.1994.72.4.1634. [DOI] [PubMed] [Google Scholar]
- Heinen SJ. Single-neuron activity in dorsomedial frontal cortex during smooth pursuit eye movements. Exp Brain Res. 1995;104:357–361. doi: 10.1007/BF00242022. [DOI] [PubMed] [Google Scholar]
- Heinen SJ, Keller EL. Smooth pursuit eye movements: recent advances. In: Chalupa LM, Werner JS, editors. The visual neurosciences. Cambridge, MA: MIT; 2003. pp. 333–334. [Google Scholar]
- Heinen SJ, Liu M. Single-neuron activity in the dorsomedial frontal cortex during smooth pursuit eye movements to predictable target motion. Vis Neurosci. 1997;14:853–865. doi: 10.1017/s0952523800011597. [DOI] [PubMed] [Google Scholar]
- Heinen SJ, Badler JB, Ting W. Timing and velocity randomization similarly affect anticipatory pursuit. J Vision. 2005;5:493–503. doi: 10.1167/5.6.1. [DOI] [PubMed] [Google Scholar]
- Huerta M, Kaas J. Supplementary eye field as defined by intracortical microstimulation: connections in macaques. J Comp Neurol. 1990;293:299–330. doi: 10.1002/cne.902930211. [DOI] [PubMed] [Google Scholar]
- Judge SJ, Richmond BJ, Chu FC. Implantation of magnetic search coils for measurement of eye position: an improved method. Vision Res. 1980;20:535–538. doi: 10.1016/0042-6989(80)90128-5. [DOI] [PubMed] [Google Scholar]
- Keating EG. Frontal eye field lesions impair predictive and visually-guided pursuit eye movements. Exp Brain Res. 1991;86:311–323. doi: 10.1007/BF00228954. [DOI] [PubMed] [Google Scholar]
- Keating EG. Lesions of the frontal eye field impair pursuit eye movements, but preserve the predictions driving them. Behav Brain Res. 1993;53:91–104. doi: 10.1016/s0166-4328(05)80268-2. [DOI] [PubMed] [Google Scholar]
- Kim YG, Badler JB, Heinen SJ. Trajectory interpretation by supplementary eye field neurons during ocular baseball. J Neurophysiol. 2005;94:1385–1391. doi: 10.1152/jn.00109.2005. [DOI] [PubMed] [Google Scholar]
- Kowler E. Cognitive expectations, not habits, control anticipatory smooth oculomotor pursuit. Vision Res. 1989;29:1049–1057. doi: 10.1016/0042-6989(89)90052-7. [DOI] [PubMed] [Google Scholar]
- Kowler E, Steinman RM. The effect of expectations on slow oculomotor control. I. Periodic target steps. Vision Res. 1979a;19:619–632. doi: 10.1016/0042-6989(79)90238-4. [DOI] [PubMed] [Google Scholar]
- Kowler E, Steinman RM. The effect of expectations on slow oculomotor control. II. Single target displacements. Vision Res. 1979b;19:633–646. doi: 10.1016/0042-6989(79)90239-6. [DOI] [PubMed] [Google Scholar]
- Kowler E, Steinman RM. The effect of expectations on slow oculomotor control—III. Guessing unpredictable target displacements. Vision Res. 1981;21:191–203. doi: 10.1016/0042-6989(81)90113-9. [DOI] [PubMed] [Google Scholar]
- Kowler E, Martins AJ, Pavel M. The effect of expectations on slow oculomotor control—IV. Anticipatory smooth eye movements depend on prior target motions. Vision Res. 1984;24:197–210. doi: 10.1016/0042-6989(84)90122-6. [DOI] [PubMed] [Google Scholar]
- Luck SJ, Chelazzi L, Hillyard SA, Desimone R. Neural mechanisms of spatial selective attention in areas V1, V2, and V4 of macaque visual cortex. J Neurophysiol. 1997;77:24–42. doi: 10.1152/jn.1997.77.1.24. [DOI] [PubMed] [Google Scholar]
- Lynch JC. Frontal eye field lesions in monkeys disrupt visual pursuit. Exp Brain Res. 1987;68:437–441. doi: 10.1007/BF00248811. [DOI] [PubMed] [Google Scholar]
- MacAvoy MG, Gottlieb JP, Bruce CJ. Smooth-pursuit eye movement representation in the primate frontal eye field. Cereb Cortex. 1991;1:95–102. doi: 10.1093/cercor/1.1.95. [DOI] [PubMed] [Google Scholar]
- Missal M, Heinen SJ. Facilitation of smooth pursuit initiation by electrical stimulation in the supplementary eye fields. J Neurophysiol. 2001;86:2413–2425. doi: 10.1152/jn.2001.86.5.2413. [DOI] [PubMed] [Google Scholar]
- Missal M, Heinen SJ. Supplementary eye fields stimulation facilitates anticipatory pursuit. J Neurophysiol. 2004;92:1257–1262. doi: 10.1152/jn.01255.2003. [DOI] [PubMed] [Google Scholar]
- Missal M, de Brouwer S, Lefèvre P, Olivier E. Activity of mesencephalic vertical burst neurons during saccades and smooth pursuit. J Neurophysiol. 2000;83:2080–2092. doi: 10.1152/jn.2000.83.4.2080. [DOI] [PubMed] [Google Scholar]
- O'Driscoll GA, Wolff AL, Benkelfat C, Florencio PS, Lal S, Evans AC. Functional neuroanatomy of smooth pursuit and predictive saccades. NeuroReport. 2000;11:1335–1340. doi: 10.1097/00001756-200004270-00037. [DOI] [PubMed] [Google Scholar]
- Petit L, Haxby JV. Functional anatomy of pursuit eye movements in humans as revealed by fMRI. J Neurophysiol. 1999;82:463–471. doi: 10.1152/jn.1999.82.1.463. [DOI] [PubMed] [Google Scholar]
- Posner MI. Orienting of attention. Q J Exp Psychol. 1980;32:3–25. doi: 10.1080/00335558008248231. [DOI] [PubMed] [Google Scholar]
- Rashbass C. The relationship between saccadic and smooth tracking eye movements. J Physiol (Lond) 1961;159:326–338. doi: 10.1113/jphysiol.1961.sp006811. [DOI] [PMC free article] [PubMed] [Google Scholar]
- Reynolds JH, Chelazzi L, Desimone R. Competitive mechanisms subserve attention in macaque areas V2 and V4. J Neurosci. 1999;19:1736–1753. doi: 10.1523/JNEUROSCI.19-05-01736.1999. [DOI] [PMC free article] [PubMed] [Google Scholar]
- Richmond BJ, Optican LM, Podell M, Spitzer H. Temporal encoding of two-dimensional patterns by single units in primate inferior temporal cortex. I. Response characteristics. J Neurophysiol. 1987;57:131–146. doi: 10.1152/jn.1987.57.1.132. [DOI] [PubMed] [Google Scholar]
- Russo GS, Bruce CJ. Neurons in the supplementary eye field of rhesus monkeys code visual targets and saccadic eye movements in an oculocentric coordinate system. J Neurophysiol. 1996;76:825–848. doi: 10.1152/jn.1996.76.2.825. [DOI] [PubMed] [Google Scholar]
- Schall JD. Neuronal activity related to visually guided saccadic eye movements in the supplementary motor area of rhesus monkeys. J Neurophysiol. 1991;66:530–558. doi: 10.1152/jn.1991.66.2.530. [DOI] [PubMed] [Google Scholar]
- Schall JD, Stuphorn V, Brown JW. Monitoring and control of action by the frontal lobes. Neuron. 2002;36:309–322. doi: 10.1016/s0896-6273(02)00964-9. [DOI] [PubMed] [Google Scholar]
- Schlag J, Schlag-Rey M. Evidence for a supplementary eye field. J Neurophysiol. 1987;57:179–200. doi: 10.1152/jn.1987.57.1.179. [DOI] [PubMed] [Google Scholar]
- Shi D, Friedman HR, Bruce CJ. Deficits in smooth-pursuit eye movements after muscimol inactivation within the primate's frontal eye field. J Neurophysiol. 1998;80:458–464. doi: 10.1152/jn.1998.80.1.458. [DOI] [PubMed] [Google Scholar]
- Stuphorn V, Schall JD. Executive control of countermanding saccades by the supplementary eye field. Nat Neurosci. 2006;9:925–931. doi: 10.1038/nn1714. [DOI] [PubMed] [Google Scholar]
- Stuphorn V, Taylor TL, Schall JD. Performance monitoring by the supplementary eye field. Nature. 2000;408:857–860. doi: 10.1038/35048576. [DOI] [PubMed] [Google Scholar]
- Tanaka M, Fukushima K. Neuronal responses related to smooth pursuit eye movements in the periarcuate cortical area of monkeys. J Neurophysiol. 1998;80:28–47. doi: 10.1152/jn.1998.80.1.28. [DOI] [PubMed] [Google Scholar]
- Tanaka M, Lisberger SG. Regulation of the gain of visually guided smooth-pursuit eye movements by frontal cortex. Nature. 2001;409:191–194. doi: 10.1038/35051582. [DOI] [PubMed] [Google Scholar]
- Tehovnik EJ. The dorsomedial frontal cortex: eye and forelimb fields. Behav Brain Res. 1995;67:147–163. doi: 10.1016/0166-4328(94)00151-5. [DOI] [PubMed] [Google Scholar]
- Tian JR, Lynch JC. Functionally defined smooth and saccadic eye movement subregions in the frontal eye field of Cebus monkeys. J Neurophysiol. 1996a;76:2740–2753. doi: 10.1152/jn.1996.76.4.2740. [DOI] [PubMed] [Google Scholar]
- Verghese P. Visual search and attention: a signal detection theory approach. Neuron. 2001;31:523–535. doi: 10.1016/s0896-6273(01)00392-0. [DOI] [PubMed] [Google Scholar]
- Xiao Q, Barborica A, Ferrera VP. Modulation of visual responses in macaque frontal eye field during covert tracking of invisible targets. Cereb Cortex. 2007;17:918–928. doi: 10.1093/cercor/bhl002. [DOI] [PubMed] [Google Scholar]