

Abstract
The posterior parietal cortex (PPC) plays a role in spatial updating of goals for eye and arm movements across saccades, but less is known about its role in updating perceptual memory. We reported previously that transsaccadic memory has a capacity for storing the orientations of three to four Gabor patches either within a single fixation (fixation task) or between separate fixations (saccade task). Here, we tested the role of the PPC in transsaccadic memory in eight subjects by simultaneously applying single-pulse transcranial magnetic stimulation (TMS) over the right and left PPC, over several control sites, and comparing these to behavioral controls with no TMS. In TMS trials, we randomly delivered pulses at one of three different time intervals around the time of the saccade, or at an equivalent time in the fixation task. Controls confirmed that subjects could normally retain at least three visual features. TMS over the left PPC and a control site had no significant effect on this performance. However, TMS over the right PPC disrupted memory performance in both tasks. This TMS-induced effect was most disruptive in the saccade task, in particular when stimulation coincided more closely with saccade timing. Here, the capacity to compare presaccadic and postsaccadic features was reduced to one object, as expected if the spatial aspect of memory was disrupted. This finding suggests that right PPC plays a role in the spatial processing involved in transsaccadic memory of visual features. We propose that this process uses saccade-related feedback signals similar to those observed in spatial updating.
Keywords: transsaccadic memory, posterior parietal cortex, transcranial magnetic stimulation, visual working memory, saccades, spatial cognition
Introduction
Humans make three to five saccades per second (Rayner, 1998), so perception of a unified visual world must be constructed from information integrated across multiple fixations, referred to as transsaccadic integration (Irwin, 1996). For the transsaccadic integration of visual information to give rise to a stable representation of the visual world the visual system must retain visual information across saccades. This process of retaining visual information across saccades is transsaccadic memory. Various studies have shown that transsaccadic memory has a capacity of three to four items (Irwin and Andrews, 1996; Irwin and Gordon, 1998; Prime et al., 2007b); similar to visual working memory (Luck and Vogel, 1997; Vogel et al., 2001). However, transsaccadic memory involves additional computational demands the visual system must solve, which distinguishes itself from visual working memory, such as the egocentric measures of saccade metrics so that the spatial information of objects retained in transsaccadic memory is updated in accordance to the saccade (Hayhoe et al., 1991; Prime et al., 2006). Relatively little is known about the neural mechanisms that integrate these saccade-related signals into the algorithms for object and scene recognition.
It seems likely that transsaccadic perception and memory would involve both the ventral stream of vision, which terminates in temporal cortex and is thought to mediate recognition, and the dorsal stream, which terminates in posterior parietal cortex (PPC) and is thought to mediate spatial perception and visuomotor control (Ungerleider and Mishkin, 1982; Goodale and Milner, 1992). The question of transsaccadic integration thus becomes equivalent to the general question of how information from these two streams is integrated. One possibility is that they communicate through lateral connections (Webster et al., 1994; Zhong and Rockland, 2003). Another possibility is that information from both streams converges in the frontal cortex (Courtney at al, 1996; Miller at al, 1996; Constantinidis and Procyk, 2004). We have hypothesized that information from the dorsal and ventral streams is fed backwards through re-entrant pathways, to be integrated in earlier visual areas (Prime et al., 2006).
The PPC has been shown previously to be part of a cortical network for spatial working memory (Jonides et al., 1993; Smith et al., 1995), but its involvement in transsaccadic memory of visual features has not been demonstrated. Many studies have shown that lateral intraparietal cortex (LIP; equivalent to the parietal eye fields in the human) is involved in the control of saccadic eye movements (for review, see Pierrot-Deseilligny and Müri, 1997) and in the integration of retinal and extraretinal signals (Andersen et al., 1985; Bremmer et al., 1997; Genovesio et al., 2007). Moreover, LIP is involved in the spatial updating of object positions and saccade goals during eye movements; a process called remapping (Duhamel et al., 1992; Colby and Goldberg, 1999; Medendorp et al., 2003; Merriam et al., 2003). Here, we hypothesized that the same spatial updating mechanism is “borrowed” by the perception system to integrate visual features across saccades.
We tested this framework by delivering single-pulse transcranial magnetic stimulation (TMS) to the human PPC. TMS over the human PPC disrupts perisaccadic visual stability (Chang and Ro, 2007), reduces sensitivity to visual change (Beck et al., 2006), and disrupts simple spatial updating (Morris et al., 2007). However, to our knowledge, no study has explicitly used TMS in a task involving transsaccadic memory of visual features. Here, we combine TMS with our previous psychophysical test of memory capacity (Prime et al., 2007b) to show that PPC is indeed causally involved in such transsaccadic memory.
Materials and Methods
Subjects.
Eight subjects (five females and three males; ages ranged between 20 and 32 except for one subject who was age 62; median age was 25.5) participated in this study after providing written informed consent. All participants were in good health and had normal or corrected-to-normal visual acuity and, according to a self-report, without any known contraindications to TMS. All experimental procedures received ethical approval by York Human Participants Review Subcommittee.
Apparatus.
Subjects sat in a dark room with their head immobilized by a personalized dental impression bar. A customized computer network system of three microprocessor personal computers was used for both stimulus presentation and data recording. The experimental device was the same for all conditions and consisted of a video projector that back-projected visual stimuli onto a 1.9 × 1.4 m display screen, spanning 124.5° visual angle horizontally by 108.9° visual angle vertically. Subjects sat 50 cm in front of the screen. The screen was unlit (black) with a luminance level of 0.015 cd/m2. Eye position was monitored using a head-mounted eye-tracking system (Applied Science Laboratories). The two-dimensional coordinates of eye movements were recorded at a sampling rate of 360 Hz and stored on hard disk for off-line analysis. Saccades continuously were detected using a velocity criterion of 36° per second and eye position criterion of 1.5° visual angle around the fixation cross [similar to that used by Merriam et al. (2003) and Niemeier et al. (2003)]. In both the saccade and fixation tasks, eye position was monitored in real time by custom-written software that only accepted trials for a predetermined “tolerance” window of performance for both eye fixations and movements. In particular, for a trial to be successful, subjects were required to maintain eye fixations within a 1.5° window around the fixation cross and, in the case of the saccade task, begin the saccade within 1 s after the onset of the second fixation cross and then end the saccade at the correct, specified fixation location. If any of these criteria were not met, the trial was aborted, automatically removed from the data, and randomly repeated in the presentation sequence. Auditory tones provided feedback for whether the trial was successful or aborted.
Localization of brain sites and TMS protocol.
Single-pulse TMS was delivered using a MagStim 200 magnetic stimulator and a 70 mm figure-of-eight coil to the parietal cortex and right motor cortex. The locus of TMS stimulation has a spatial resolution of ∼0.5–1 cm (Brasil-Neto et al., 1992; Wilson et al., 1993) with an estimated penetration depth of ∼2 cm (Epstein et al., 1990; Rudiak and Marg, 1994), reflecting stimulation of the underlying cortex near the gray-white junction (Epstein et al., 1990). To localize left and right parietal areas, we placed the TMS coil over P3 and P4, respectively, according to the 10–20 electroencephalogram (EEG) coordinate system (Herwig et al., 2003; Okamoto et al., 2004), using commercially available 10–20 EEG stretch caps for 20 channels (Electro-Cap International). We then confirmed test sites a posteriori with structural magnetic resonance imaging (MRI) by way of Brain Voyager 4.6 software (Brain Innovation) using vitamin E capsules as fiduciary markers of stimulated skull positions (Fig. 1). Specifically, test sites (P3 and P4) overlay left and right dorsal PPC, respectively, and included the intraparietal sulcus, Brodmann's area 19, and the adjacent cortex in the superior and inferior parietal lobule, and are consonant with cortical regions underlying these electrode positions reported previously (Herwig et al., 2003; Okamoto et al., 2004; Vesia et al., 2006). Accordingly, these parietal stimulation sites could correspond to the putative human parietal eye fields (cf. Ryan et al., 2006), a region (or regions) thought to be homologous to macaque LIP, identified in previous human brain imaging studies (for review, see Culham and Valyear, 2006). Two additional control conditions were conducted to yield estimates of nonspecific effects of TMS. First, we assessed performance after stimulation of the right motor cortex (right M1). We localized the motor cortex by placing the coil over the right-hand area and searched for the specific region that produced a visible contraction of the first dorsal interosseous in five of the 10 trials at the minimally required stimulator intensity (resting motor threshold). Second, we conducted sham trials in which the coil was held close to the subject's skull, but angled away so that no current was induced in the brain for both left (P3) and right (P4) PPC. Stimulation conditions were performed on separate days to minimize fatigue and TMS exposure for each session. Site of stimulation (left PPC, right PPC, right motor cortex) and sham condition (left parietal sham, right parietal sham) order was counterbalanced across subjects over two experimental sessions. Last, we included a “No TMS” baseline condition in which subjects received no stimulation as they performed the task.
Figure 1.

Location of individual parietal TMS sites for one representative subject. The stimulation site for the right posterior parietal cortex is shown with the position of high-intensity signal markers placed on the subject's skull (P4). Red bars indicate the position of the TMS coil. The coil was placed tangential to the skull with the handle pointing backward parallel to the midline. This produces a current flowing in a posterior–anterior direction in the underlying brain areas. Stimulation sites were verified a posteriori using the MRI of the individual subject. The anatomical site of stimulation for the right PPC (shown here) is indicated by the line intersection in the transverse (TRA), coronal (COR), and sagittal (SAG) sections of T1-weighted MRI.
Custom software triggered the magnetic stimulator at 100, 200, or 300 ms after the onset of the saccade go signal for the stimulation conditions only (see below, Experimental procedure). As a result of the normal latency distribution of saccades, in the saccade task this placed the timing of the TMS pulse either ∼100 ms before, at approximately the same time as, or at ∼100 ms after the initiation of the saccade. These three discrete stimulation times were chosen based on a preliminary experiment (data not shown) investigating the timing of the contribution of the cortical areas of interest for our experimental transsaccadic memory task (“causal chronometry”). In this preliminary experiment, methods similar to those described here were used with four subjects with the TMS pulse at 100, 200, and 300 ms before the stimulus onset and 100, 200, and 300 ms after the stimulus onset. We observed that the largest TMS-induced effects occurred at the times used in the current study.
It has been suggested previously that motor threshold is not an appropriate measure of individual magnetic stimulus intensity in nonmotor areas of the brain because of the lack of correlation between motor and phosphene thresholds in healthy normal subjects (Stewart et al., 2001; Boroojerdi et al., 2002). Accordingly, the intensity of magnetic stimulation was fixed to 60% of the stimulator output (Beckers and Zeki, 1995; Corthout et al., 1999; Lewald et al., 2002; Dambeck et al., 2006; Vesia et al., 2006). All stimulation parameters were in accordance with the safety guidelines for magnetic stimulation (Wassermann, 1998). Earplugs were provided to dampen the noise associated with the discharge from the TMS coil. None of the subjects reported any undesirable side effects as a result of the stimulation.
Experimental procedure.
The experimental procedure is similar to one previously described in detail previously (Prime et al., 2007b), but used TMS to investigate the putative neural mechanisms underlying transsaccadic memory. Briefly, as illustrated in Figure 2, the transaccadic memory task required subjects to compare the orientation of a postsaccadic probe relative to the orientation of a presaccadic target at the same location, usually among similar-looking presaccadic distracters. When distracters were included in the target display, subjects did not know which presaccadic item was the target and which items were distracters and, thus, were required to remember the details of as many of the presaccadic items of the target display as possible.
Figure 2.

General experimental paradigm for our study. The rectangles of each panel show the temporal order during a typical trial for presentation of fixation crosses and the visual stimuli. A, The saccade task. Subjects fixated on the fixation cross while the target display was briefly presented (100 ms) containing either a lone target or a target accompanied by a random number of distracters (i.e., total set size of target + distracters was 1–6 or 8). After the mask (150 ms), subjects moved their eyes to the new location of fixation cross. In TMS trials, TMS pulses were time locked to the onset of the second fixation cross. Pulses were delivered either 100, 200, or 300 ms after the second fixation cross was presented. After the saccade, a probe was presented (100 ms) at the same location as the target. Subjects were required to indicate how the probe's orientation differed relative to the target's orientation. B, The fixation task is the same as the saccade task except that subjects were required to maintain eye fixation through target display and probe presentations. The fixation cross remained fixed in the same position throughout the trial. Again, TMS pulses were delivered at one of the three time intervals relative to the onset of the second fixation cross in TMS trials.
During saccade task trials (Fig. 2A), subjects fixated a cross (subtended 1.5°) randomly presented at one of 29 possible spatial locations within a display area spanning 18° × 18°. On fixation, subjects were briefly presented (100 ms) with a target display. The target display consisted of either a solitary target or a target accompanied by a random number of distracters, ranging from one to five, or seven. In other words, the total set size of the target display ranged from one to six, or eight items (target + distracters). Spatial locations for all items in the target display (i.e., target and distracters) were generated randomly within the display area. None of the target display items spatially overlapped with the fixation cross.
All targets and distracters were Gabor-like patches (2° in diameter) of alternating black and white bars. The gratings' mean luminance was 17 cd/m2 and the spatial frequency was 2 cycles per degree of visual angle. The orientation of the target and each distracter in the target display was selected randomly from six possible orientations: 35°, 45°, or 55° clockwise or counterclockwise from vertical.
A mask, a white uniform field (i.e., 33.61 cd/m2) covering the entire screen, flashed briefly for 150 ms to reduce the possibility of visual persistence immediately after the target display. In previous control experiments, we showed that this mask has no effect on spatial performance in normal transsaccadic memory (Prime et al., 2006). We included the mask to ensure that subjects were not relying on any afterimage of the target display to aid performance. After the mask, the fixation cross reappeared in a new randomly determined spatial location within the display area. Subjects then made a saccadic eye movement to this new location of the fixation cross. The delivery of the TMS pulse was time locked to the onset of the saccade-go signal (i.e., the reappearance of the fixation cross). The TMS pulse was delivered after the onset of the saccade go signal at one of three possible time intervals (100, 200, or 300 ms). These time intervals, including the no-stimulation condition, were randomly interleaved within each block of trials for each site of stimulation (left parietal TMS, right parietal TMS, right motor cortex) and sham conditions (left parietal sham, right parietal sham).
After subjects refixated on the fixation cross and a brief delay (200 ms), a probe was flashed for 100 ms in the same location as the presaccadic target followed by a second mask. The rationale behind the brief delay before presenting the probe was to avoid the common visual distortions that occur around the time of a saccade such as saccadic compression (Lappe et al., 2000). The probe resembled the target except that the probe's line orientation differed by a predetermined amount, either 9.9° clockwise or counterclockwise from the position of the originally displayed target. This probe/target difference corresponded to the average discrimination threshold for 80% of correct responses across subjects when comparing the orientation of only two targets separated by a saccade, as shown in our previous study (Prime et al., 2007a).
Subjects then judged whether the lines of the probe were clockwise or counterclockwise to the target's lines by a two alternative forced-choice task. Subjects' used their dominant right hand to report the orientation of the target by pressing the left mouse button with the index finger for counterclockwise target orientations and the right mouse button with the middle finger for clockwise target orientations. Subjects were instructed to make their best estimate if uncertain about the orientation of the target.
We also included a fixation task (Fig. 2B) that was identical to the saccade task aside from the fixation cross not changing location after presentation of the target display. In this way, subjects maintained eye fixation throughout the trial. As a result, targets and probes are presented within a single fixation. TMS pulses were delivered at the same intervals of time as in the saccade task. To ensure the stimulus onset asynchrony (SOA) of the target display and the probe were the same between the two tasks, saccade time and latencies for saccade trials only were recorded in real time and used to deliver the subsequent SOA for fixation trials. For this reason, the blocks were designed so saccade trials always preceded an equal number of fixation trials. A total of 4200 trials were performed over multiple weekly sessions (two blocks of 420 trials for each TMS stimulation site including sham conditions).
Results
Baseline performance: No TMS
Figure 3 shows the mean percentage correct responses of the No TMS trials across all subjects for both the saccade and fixation tasks as a function of set size. These data replicated our earlier results (Prime et al., 2007b). Specifically, subjects' accuracy in the saccade task was the same as in the fixation task, as revealed by a Kolmogorov–Smirnov (KS) goodness-of-fit test (KS = 0.54; p = 0.94). A statistical estimate of the numerical capacity of this memory system is provided below; here, this No TMS data will be used as a baseline in which to compare the TMS conditions in the subsequent analyses. We also conducted a series of regression analyses to determine whether either saccade or fixation task performance was related to the target's spatial position or retinal eccentricity. The multiple regression between percentage correct and the target's vertical and horizontal spatial coordinates were not significant in either the fixation task (R2 = 0.09; F(2,26) = 1.35; p = 0.28) or the saccade task (R2 = 0.13; F(2,26) = 0.23; p = 0.79). Likewise, regression analyses on percentage correct and target eccentricity yielded no significant results in either the fixation task (r2 = −0.07; F(1,40) = 0.23; p = 0.64) or the saccade task (r2 = −0.02; F(1,40) = 0.17; p = 0.68).
Figure 3.

Results of the baseline No TMS trials. This figure shows the mean percentage correct responses across all subjects (n = 8) in both the saccade and fixation tasks for different set sizes. Saccade task performance is represented by the solid curve with the closed squares. Fixation task performance is represented by the dashed curve with the open squares. Performance in these tasks was statistically the same according to a goodness-of-fit analysis. These data replicated our previous findings (Prime et al., 2007b). Error bars represent 1 SE.
Left and right parietal TMS
Figure 4 shows our main results of mean percentage correct responses across all subjects when we stimulated either the left or right parietal cortices in both saccade and fixation tasks for the three different TMS time intervals. Results of left parietal TMS are shown in Figure 4A and of right parietal TMS in Figure 4B. The top panels show performance from the fixation task and bottom panels show performance from the saccade task. The mean latency (±SD) for saccades in the left and right PPC TMS conditions were 238.35 ms (±49.1 ms) and 220.35 ms (±55.4 ms) respectively, confirming that the 200 ms TMS pulse coincided most closely with saccade onset whereas the 100 and 300 ms pulses occurred just before and immediately after saccade onset. Each colored data curve in Figure 4 represents a different TMS time interval. The baseline data from the No TMS condition shown in Figure 3 were replotted here as the black curves for comparison.
Figure 4.

A, B, Main results of left PPC TMS (A) and right PPC TMS (B) conditions for both the fixation task (top) and saccade task (bottom). These data are shown as mean percentage correct responses across all subjects (n = 8) against different set sizes. Each colored data curve represents the different TMS time intervals in the TMS trials. The green curve represents the TMS data when TMS was delivered at the 100 ms time interval. Similarly, the red curve represents the 200 ms time interval, and the blue curve represents the 300 ms time interval. As a comparison, we replotted the baseline No TMS data curves from Fig. 3 for each task (black curves). Separate goodness-of-fit tests comparing each TMS data curve to their respective baseline No TMS data show that TMS only had an effect in the right PPC condition: fixation task performance was only disrupted when stimulation occurred at the 200 ms time interval. Saccade task performance was disrupted for all three TMS time intervals (100, 200, and 300 ms). Error bars represent 1 SE.
Right parietal TMS yielded quite different results compared with baseline (Fig. 4B). Looking at the fixation task data first (Fig. 4B, top), right parietal TMS elicited more errors at the 200 ms time interval (KS = 1.7; p < 0.01) compared with baseline performance. Although some points of the 100 ms curve were lower than the baseline curve, we found no statistical differences (KS = 1.04; p = 0.23). Likewise, right parietal TMS at 300 ms during the fixation task did not yield any differences compared with baseline (KS = 0.85; p = 0.47).
The largest TMS-induced effects were found when stimulating the right parietal in the saccade task. As shown by the bottom panel of Figure 4B, mean percentage correct in the saccade task was generally lower for all three TMS intervals compared with baseline. These findings were confirmed by separate goodness-of-fit analyses comparing each TMS time interval to baseline: 100 ms (KS = 1.42; p = 0.04), 200 ms (KS = 2.55; p < 0.01), and 300 ms (KS = 2.27; p < 0.01). As done with the baseline No TMS condition, we conducted a series of regression analyses to determine whether performance in either task during 200 ms right parietal TMS, where there is the largest TMS-induced effect, was related to spatial position or retinal eccentricity of the target. As in the baseline No TMS condition, we found no significant relationships for target spatial position in either the fixation task (R2 = 0.19; F(2,26) = 0.5; p = 0.61) or the saccade task (R2 = 0.07; F(2,26) = 0.98; p = 0.39). Similarly, we did not find a significant relationship for target eccentricity in either the fixation task (r2 = −0.12; F(1,40) = 0.27; p = 0.6) or the saccade task (r2 = 0.03; F(1,40) = 0.04; p = 0.85). Thus, the right parietal TMS effect did not appear to be specific with respect to target location in space or eye-centered coordinates.
We also sought to determine whether the differences we found between the data curves in right parietal TMS condition relative to baseline were partially caused by a shift in their intercepts. Because one cannot assume that these curves are linear (Prime et al., 2007), we took instead the percentage correct at a set size of one item. Separately for each task, we compared percentage correct responses among the different TMS conditions and baseline No TMS condition when the set size was one item in both tasks. In the fixation task, we found no significant differences among the No TMS (mean, 82%; SD, ±9%) and the TMS conditions, 100 ms TMS (mean, 92%; SD, ±14%), 200 ms TMS (mean, 72%; SD, ±21%), and 300 ms TMS (mean, 83%; SD, ±19%), when there was a set size of one item (F(3,28) = 1.85; p = 0.16). Conversely, performance among the No TMS (mean, 83%; SD, ±10%) and the TMS conditions, 100 ms TMS (mean, 76%; SD, ±12%), 200 ms TMS (mean, 74%; SD, ±13%), and 300 ms TMS (mean, 78%; SD, ±16%), at one set size was significant in the saccade task (F(3,28) = 2.88; p = 0.04). Planned comparisons between the saccade task's baseline condition and each TMS time interval yielded a significant difference between baseline and 200 ms TMS (t(14) = 3.95; p = 0.05) but not for baseline and 100 ms TMS (t(14) = 1.81; p = 0.09) and baseline and 300 ms TMS (t(14) = 1.74; p = 0.11). These findings suggest that at least part of the results of the 200 ms TMS right parietal condition in the saccade task can be attributed to a significant downward shift of the intercept compared with baseline. However, there was also a complex effect on the rate at which performance dropped off for higher object numbers. These separate points will be addressed in more detail below, when we fit models to the data (Fig. 6).
Figure 6.

Estimating memory capacity during right PPC stimulation. A, A simple predictive model where each curve predicts the probability of correct response as a function of set size for different theoretical capacities of transsaccadic memory, indicated by the numbers above each curve. To determine which predictive curve provided the best fit, we computed the MSR errors between each of these curves and both the No TMS data and the 200 ms right parietal TMS data (where we saw the largest effect) from Figure 4B. The arrows shown in the predictive model indicate that the intercept of the predictive curves was adjusted to take into account the different intercepts (i.e., percentage correct obtained at one item set size) of each data curve. B, C, MSR errors for both fixation and saccade tasks, respectively, in the No TMS condition (top panels) and 200 ms right PPC TMS condition (bottom panels). The bar graphs represent the average MSR errors across all subjects after calculating the MSR errors for each subject individually. The least average MSR error indicates the best fit to a theoretical memory capacity according to our predictive model. First, during the No TMS condition, we found the average MSR errors of both the fixation (B, top) and saccade (C, top) tasks show the best fit to our predictive model estimating a memory capacity of three items, replicating our previous findings (Prime et al., 2007b). During 200 ms right PPC stimulation, where we saw the largest TMS effect, memory capacity in the fixation task (B, bottom) was reduced to two items and reduced to one item in the saccade task (C, bottom).
In general, left parietal TMS curves show similar trends as No TMS performance in both tasks (Fig. 4A). This was confirmed by separate goodness-of-fit analyses comparing the baseline No TMS condition to each curve representing the different TMS time intervals in the fixation task (100 ms, KS = 0.95, p = 0.33; 200 ms, KS = 1.32, p = 0.06; 300 ms, KS = 1.23, p = 0.10) and the saccade task (100 ms, KS = 0.66, p = 0.77; 200 ms, KS = 1.04, p = 0.23; 300 ms, KS = 1.13, p = 0.15). Together, our results so far show that our subjects' accuracy was disrupted when TMS was delivered to the right - but not left - parietal cortex, particularly in the saccade task where subjects are required to rely on transsaccadic memory.
Control site right M1 and sham conditions
To rule out any nonspecific TMS-induced effect, we included a right motor cortex (right M1) TMS condition and two sham conditions, one left parietal sham and the other right parietal sham. For these conditions, we conducted the same goodness-of-fit tests as we did previously with the right and left parietal TMS conditions. None of TMS intervals in the right M1 TMS condition yielded any significant differences relative to baseline. Specifically, in the fixation task mean percentage correct was the same as baseline for TMS intervals at 100 ms (KS = 0.11; p = 0.88), 200 ms (KS = 0.13; p = 0.75), and 300 ms (KS = 0.17; p = 0.3). Similarly, the right M1 TMS mean percentage correct in the saccade task was the same as baseline for TMS intervals at 100 ms (KS = 0.04; p = 0.95), 200 ms (KS = 0.19; p = 0.21), and 300 ms (KS = 0.14; p = 0.58).
For each sham condition, we pooled the data from the different TMS time intervals together, because no magnetic stimulation was actually delivered and comparisons between the TMS time intervals within each sham condition in both tasks confirmed that there were no statistical differences (different TMS time intervals in left sham condition and fixation task, F(2,21) = 0.88, p = 0.43; in left sham condition and saccade task, F(2,21) = 0.49, p = 0.62; in right sham condition and fixation task, F(2,21) = 0.16, p = 0.84; and in right sham condition and saccade task, F(2,21) = 1.03, p = 0.38). Other than simplifying the data analysis, the benefit of collapsing across TMS intervals would be to increase statistical power when comparing the sham conditions to baseline. Even so, left sham condition was found the same as baseline in both the fixation task (KS = 0.54; p = 0.94) and the saccade task (KS = 0.8; p = 0.54). Likewise, right sham data were the same as baseline in the fixation task (KS = 0.95; p = 0.33) and the saccade task (KS = 0.76; p = 0.62). In sum, no differences were found between the baseline condition (i.e., No TMS) and the control conditions. These results suggest that the effect of TMS on task performance by increasing subjects' errors was specific to the right parietal cortex.
Magnitude of the TMS effect
The magnitude of the TMS-induced effect on our subjects' accuracy is shown in Figure 5. The bar graphs in Figure 5 depict the mean change-correct, the differences of the mean percentages of correct responses between the No TMS condition and right parietal TMS (Fig. 5A), right M1 TMS (B), and right sham (C). For brevity, Figure 5 shows only data for the hemisphere that showed significant effects (Fig. 4), but no differences were found between the right and left hemisphere sham conditions in either the fixation task (F(5,36) = 0.98; p = 0.44) or the saccade task (F(5,36) = 0.43; p = 0.82). To simplify the analyses, we collapsed set size and plotted the data according to TMS time intervals. These bar graphs are informative in that they show the change in percentage correct for each TMS condition relative to baseline condition and relative to the different TMS time intervals. Here, we compare the mean change-correct among the different TMS intervals within each condition.
Figure 5.

Magnitude of TMS effect. To determine the magnitude of the TMS effect we subtracted the TMS data curves of Fig. 4 from their respective baseline No TMS data from Fig. 3. A–C, The change in mean percentage correct is shown for the right PPC (A), right M1 TMS (B), and right sham TMS (C). The top panels represent the change in the fixation task and the bottom panels represent the change in the saccade task. Positive numbers reflect a greater percentage correct and negative numbers reflect a lesser percentage correct compared with baseline. The line at zero represents no change from baseline. Consistent with Fig. 4, right PPC TMS in the fixation task only increased errors when TMS was delivered at the 200 ms time interval. Also, saccade task performance during right PPC TMS was less accurate for all three TMS time intervals. As shown in the other TMS conditions, no disruption was found for the right M1 (B), right sham (C), and left sham (data not shown).
The largest mean change-correct was associated with the right parietal TMS (Fig. 5A). We compared the mean change-correct of the TMS time intervals in each task. In the fixation task, we found the mean change-correct showed a significant differences among the TMS time intervals (F(2,21) = 4.31; p = 0.02). Post hoc tests show a decline in accuracy for 100 ms (t(14) = 2.12; p = 0.05) and 200 ms (t(14) = 2.73; p = 0.01) intervals compared with 300 ms, but no difference between 100 and 200 ms intervals (t(14) = −1.16; p = 0.26). The mean change-correct among the different TMS time intervals in the saccade task were also found significant (F(2,21) = 3.57; p = 0.04). Post hoc tests show a significant difference only between 100 and 200 ms (t(14) = −2.48; p = 0.02). No differences were found between 200 and 300 ms (t(14) = 1.28; p = 0.22) or between 100 and 300 ms (t(14) = −1.48; p = 0.16). To see which task was most affected by TMS, we compared mean change-correct between the fixation and saccade tasks at each TMS time interval. No difference of mean change-correct between the two tasks was found at the 100 ms TMS time interval (t(14) = 1.53; p = 0.15). However, the mean change-correct was larger in the saccade task during 200 and 300 ms TMS time intervals (t(14) = 2.33, p = 0.03 and t(14) = 3.54, p < 0.01, respectively). That is, the TMS-induced effect, the deficit in accuracy compared with baseline No TMS, was significantly largest in the saccade task compared with the fixation task when stimulation was delivered at the 200 and 300 ms TMS time intervals. These results are consistent with the data curves in Figure 4B.
Figure 5, B and C, shows the mean change-correct for two control conditions, right M1 TMS and right sham, respectively. No differences were found among the TMS intervals in the right M1 TMS condition for both the fixation task (F(2,21) = 1.05; p = 0.37) and the saccade task (F(2,21) = 0.85; p = 0.44). The same was true for the right sham condition (fixation task, F(2,21) = 0.24, p = 0.79; saccade task, F(2,21) = 1.65, p = 0.22). In summary, these mean change-correct results confirm our goodness-of-fit analyses. That is, TMS was only disruptive when delivered to the right parietal cortex, and this TMS-induced effect was largest in the saccade task. Subjects were less accurate in the fixation task during right parietal TMS, particularly at the 200 ms TMS interval.
Estimating the memory capacity of baseline and right parietal performance
The previous analysis shows that TMS over the right parietal eye field had a significant effect in some conditions (particularly at the 200 ms time interval), but does not reveal the underlying mechanism. To understand the possibilities, it is necessary to think about the task. To solve our fixation task, subjects had to remember the location of one to eight objects and their orientation. To solve the saccade task, they also had to account for an eye movement during the memory interval to calculate the spatial location of the original targets relative to the new retinal image. However, when only one initial object was presented, spatial information and the saccade should not matter because the subject only had to remember object orientation to solve the task. Therefore, we used our model to fit two parameters to the 200 ms interval TMS data: (1) a baseline reduction for one target (which should be similar in both tasks), and (2) the numerical memory capacity, which should be more sensitive in the saccade task if the parietal eye fields are important for transsaccadic memory.
We have already considered the effect of TMS on one remembered target above. Performance reduction was not reduced in the 100 and 300 ms TMS intervals, and was not significantly reduced at the 200 ms interval of the fixation task (in contrast to the uniform reductions seen in the saccade task). However, if we compare between the 200 ms TMS data, the mean performance reduction (TMS minus control) for one object was nearly identical for the fixation task (−10%) and the saccade task (−9%), and was not significantly different across subjects (p = 0.18). This could signify a general or feature-based effect that was independent of location and number.
To estimate memory capacity for a higher number of objects, we used a statistical model that was slightly modified from that used in our previous study (Prime et al., 2007b). This model assumed that the items retained across the saccade are a random subset of the target display and that there are no nonlinear interactions between the items. The parameters were the expected proportion of correct responses (z), the obtained proportion of correct responses when the set size of target display is one item (a), capacity of transsaccadic memory (y), and number of items presented in the target display (x). This is expressed as
 |
As shown in Figure 6A, where a has been set to 0.8, our model predicts different theoretical curves for each potential memory capacity (y), plotted in the same way as Figure 4. These curves are characterized by a plateau in performance at a up until the memory capacity is reached, followed by a nonlinear drop-off in performance. To quantitatively compare these curves to the data in our current study, we used the actual a values obtained from each subject (i.e., the % correct for one object × 0.01). We then calculated the mean squared residual (MSR) errors for each subject between their actual data and the curves of the predictive model at every specific set size.
The bar graphs in Figure 6, B and C, show the average MSR errors for the fixation task and saccade task, respectively. MSR errors for the No TMS condition are shown in the top panels, and MSR errors for the 200 ms right parietal TMS condition are shown in the bottom panels. Lower bars signify a better fit. The No TMS condition in the fixation task (Fig. 6B, top) best fits the model predicting a capacity of three items. Similarly, the No TMS condition in the saccade task appeared to have a capacity of three items (Fig. 6C, top). A Mann–Whitney test comparing the MSR errors distributions between these two tasks yielded no statistical difference (p = 0.85). In general, these results replicate our previous findings and are consistent with several studies showing that transsaccadic memory and visual working memory have the same capacity of at least three objects (Irwin, 1992; Irwin and Andrews, 1996; Luck and Vogel, 1997; Irwin and Gordon, 1998; Vogel et al., 2001; Prime et al., 2007b).
In the 200 ms right parietal TMS condition (Fig. 6, bottom), object memory capacity appeared to be reduced. Specifically, the estimated memory capacity in the fixation task declined to two items (Fig. 6B, bottom). The Mann–Whitney test did not yield a significant difference when we compared these MSR errors of the 200 ms right parietal TMS condition to those of the baseline No TMS condition in the fixation task (p = 0.34). In the saccade task, MSR errors were generally higher, probably signifying noisier data. Moreover, the 200 ms right parietal TMS fit best to the predictive curve for a memory capacity of only one item. A Mann–Whitney comparison between MSR errors of the 200 ms TMS condition and baseline No TMS in the saccade task was found significant (p < 0.01). In summary, both tasks showed similar reductions in performance for one object at the 200 ms TMS interval, and both showed a reduction in the numerical capacity of object memory, but our statistical model suggests that the saccade task showed a more complete reduction down to only one object.
Effects of TMS on saccade metrics and latency
To ensure that the saccade task results were not simply caused by TMS disrupting saccade metrics, we compared the accuracy and latency of saccades of the left and right parietal TMS conditions with those of the baseline No TMS condition. Some studies have shown evidence that TMS stimulation of the parietal cortex can affect saccade amplitude and latency (Müri et al., 1996; van Donkelaar and Müri, 2002), although these findings remain controversial (Wessel and Kömpf, 1991; Ryan et al., 2006; Chang and Ro, 2007). Here, we show that the changes in saccade task performance cannot be attributed to changes in saccade metrics.
Figure 7A shows an example of saccades from one typical subject for baseline No TMS and TMS conditions. The subject's presaccadic eye position is shown as the red dots and designated as F1. Green dots represent the scatter of saccade end points (depicted as F2) after executing a 6° saccade to the right from several No TMS trials. Saccade end points for TMS trials of the right parietal cortex are indicated by the blue dots. Saccade end points represent the initial, primary saccade made to the fixation cross. By fitting an ellipse to the saccade scatter, as shown by the green and blue ellipses for each respective condition, we have a measure of the spread of the scatter. Figure 7B shows the ellipses fitted for every saccade direction in both the left and right parietal stimulation conditions against baseline No TMS trials for one typical subject (top panels) and the average across all subjects (bottom panels). For the sake of thoroughness, we show the saccade data from left parietal TMS although TMS had no effect on task accuracy when stimulating the left parietal site. These data clearly show a great deal of overlap between the parietal TMS and baseline No TMS conditions. To show this statistically, we compared the baseline No TMS condition to each parietal TMS condition with respect to mean saccade error, mean ellipse area, and saccade latency.
Figure 7.
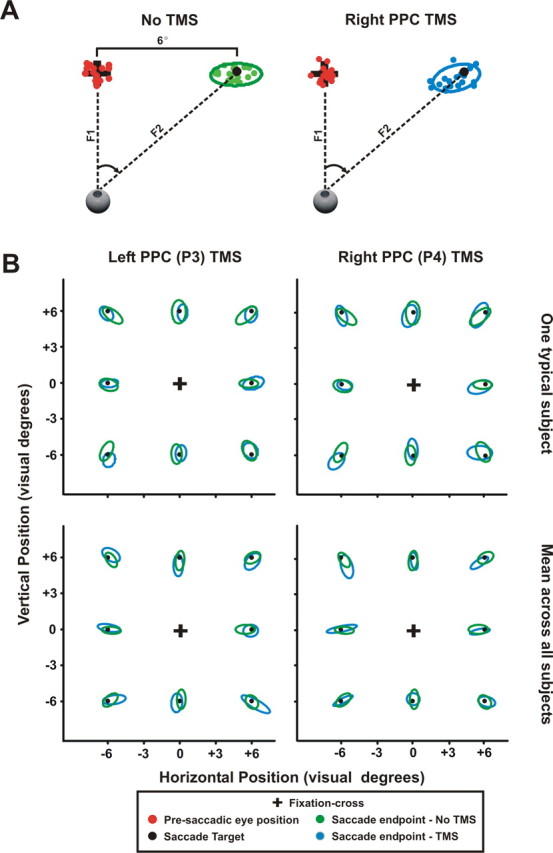
Saccade accuracy during No TMS, left PPC TMS, and right PPC TMS. A, Saccade accuracy of one typical subject during trials involving 6° saccades in the baseline No TMS and right PPC TMS conditions. Red dots represent the presaccadic eye position shown at the black fixation cross. The green dots represent the saccade end points for saccades in the No TMS condition and the blue dots represent the saccade end points for saccades in the right PPC TMS condition. Both saccade end points are shown at the saccade target (i.e., second fixation cross) indicated by the black dot. The mean saccade error was determined by the average distance between the saccade end point and the saccade target. Saccade accuracy was calculated by fitting an ellipse around the saccade end points in both the baseline No TMS and right PPC TMS conditions, shown by the green and blue ellipses. B, Saccade accuracy for all saccade directions across different set sizes both for one typical subject (top panels) and across all subjects (bottom panels). We also included saccade accuracy data in the left PPC TMS condition (left column) along with saccade accuracy in the right PPC TMS condition (right column), shown by the blue ellipses. Saccade accuracy from the No TMS condition is represented by the green ellipses. Presaccadic eye position was normalized for the sake of simplifying the figure. As shown in B, no differences in saccade accuracy were found between the baseline No TMS and TMS conditions. We also found that saccade latency (data not shown) did not significantly differ between baseline No TMS and TMS conditions. We conclude that TMS effects found in our data cannot be attributed to disruptions to subjects' saccadic eye movements.
Mean saccade error was calculated as the average distance between the saccade-target (i.e., second fixation cross) and the postsaccadic eye position after the primary saccade (i.e., saccade end-point). No statistical differences of mean saccade error were found between the baseline No TMS condition and both parietal TMS conditions (No TMS vs left parietal TMS, t(14) = −0.26, p = 0.79; No TMS vs right parietal TMS, t(14) = 0.55, p = 0.60) Similarly, the mean ellipse area of the saccade end-points in the baseline No TMS condition was the same as left and right parietal TMS conditions (t(14) = 0.37, p = 0.71 and t(14) = −0.78, p = 0.45, respectively). Finally, we found no differences of average saccade latency among the different conditions (No TMS vs left parietal, t(14) = 1.0, p = 0.33; No TMS vs right parietal, t(14) = −0.51, p = 0.62). Together, these results show that the TMS-induced effect we found in the right parietal TMS condition cannot be attributed to TMS-induced changes to our subjects' saccades, consistent with other TMS studies (Chang and Ro, 2007; Morris et al., 2007). We concluded that the results that follow were not caused by disruptions of the saccadic eye movements, but instead were caused by disruptions of the putative cognitive processes mediated by stimulating the brain region of interest, i.e., the right parietal cortex.
Discussion
We used single-pulse TMS to determine whether the PPC plays a role in transsaccadic memory of multiple object features. Our main finding was that TMS disrupted performance in both the saccade and fixation tasks, but when only right PPC was stimulated. Performance in the saccade task was more sensitive to right PPC TMS than in the fixation task, but not because it changed our subjects' saccade metrics. The effect was time dependent, being largest when the pulse was delivered 200 ms after the onset of the second fixation cross. Normally, subjects were able to retain approximately three items in both the saccade and fixation tasks, replicating our recent study (Prime et al., 2007b); but a single TMS pulse over the right PPC generally reduced this capacity. Together, our results suggest that the right PPC plays a functional role in maintaining visual details in transsaccadic memory.
Only the right PPC stimulation yields TMS effect
It is possible our results were asymmetric because the functional anatomy of parietal cortex is asymmetric, and we simply missed the left “parietal eye field.” This seems unlikely to be a complete explanation, given the symmetry of results obtained in the functional MRI studies that we used to aim our pulses (Astafiev et al., 2003; Matsuda et al., 2004) and range of area that TMS is thought to affect (Pascual-Leone et al., 1999). Moreover, this finding is consistent with the view that the right PPC has a privileged role in a variety of visuospatial tasks (Honda et al., 1998; Karnath et al., 2004; Weidner and Fink, 2007) including spatial memory (van Asselen et al., 2006; Smith et al., 1995) (cf. Ruchkin et al., 1997). Previous TMS studies have shown that stimulation applied solely to the right PPC can disrupt spatial remapping (Chang and Ro, 2007; Morris et al., 2007), visual awareness (Beck et al., 2006; Muggleton et al., 2006), and spatial working memory (Kessels et al., 2000; Tanaka, 2005) (cf. Oliveri et al., 2001). However, none of these studies used a transsaccadic memory task. Our finding that TMS over the “dorsal visual stream” disrupts transsaccadic memory of multiple visual features is thus novel, and perhaps surprising because normally it is the “ventral stream” that is associated with visual feature analysis (cf. Valyear et al., 2006).
Greater effect for saccade task than fixation task
TMS to the right parietal eye field produced a reduction in visual working memory capacity in our fixation task, but only at the 200 ms interval. Moreover, whenever it had a significant effect, right parietal TMS produced a general deficit (perhaps in feature retention) that affected memory of one object. These results are consistent with previous findings that the posterior parietal cortex is involved in visual working memory (van Asselen et al., 2006; Smith et al., 1995; Todd and Marios, 2004). However, here, we add to these findings by showing that the disruptive effect of TMS is stronger, over a broader range of timing intervals, when it coincides with a saccade. Our statistical model further suggests that right parietal TMS could reduce visual memory capacity from a normal value of three objects down to two objects in the fixation task, and only one object in the saccade task.
Why would transsaccadic memory be more sensitive to TMS over the human parietal eye fields? Transsaccadic memory is different from visual working memory in that the visual system must also account for the change in eye position. It has been shown previously that it can do this by using an egocentric measure of saccade metrics (Hayhoe et al., 1991; Prime et al., 2006). This signal could originate anywhere in the saccade network, but our TMS data specifically implicates the human parietal eye fields. TMS apparently injects noise into this neural signal, which could influence object vision directly or indirectly through other parts of the saccade network. This network is apparently more sensitive to eye position noise around the time of a saccade, with or without TMS (Niemeier et al., 2003; Prime et al., 2007a,b). However, our explanation might also account for the reduced memory capacity that we sometimes observed during fixation. Parietal TMS might also produce eye position noise during fixation, only to a lesser extent because of general inhibition from the fixation system (Munoz and Everling, 2004). Thus, our data suggest that the parietal eye fields play both a general role in visual working memory, and a more specific role in transsaccadic memory.
TMS effect at the 200 ms time interval
Transaccadic memory may follow a similar “mental chronometry” as working memory (Bledowski et al., 2006), where activity in different cortical areas reflects different cognitive stages. However, transsaccadic memory involves additional oculomotor signals. Here, the right PPC TMS had the largest effect at 200 ms after the onset of the second fixation cross, which was 350 ms after the offset of our multiple target display. The latter fits with previous findings that spatial memory was most susceptible to TMS disruption when stimulation was delivered 300 ms after the presentation of a memory array (Oliveri et al., 2001). Alternatively, in the saccade task, this timing could have arisen because saccade-related signals were most sensitive at the time of the saccade, which coincided most closely with this period. This begs the question of why the same stimulation timing had the greatest effect in the fixation task. Because these two tasks were randomly interleaved, it is possible that despite their fixation instruction, subjects engaged in some involuntary saccade planning at approximately the same time, perhaps making the saccade system more susceptible to TMS-induced noise.
TMS effect not attributed to changes in saccade metrics
Our results show that the right PPC TMS effect in the saccade task cannot be attributed to TMS affecting our subjects' saccadic eye movements. Some recent TMS studies of PPC have also induced changes to putative cognitive processes without affecting eye movement (Chang and Ro, 2007; Morris et al., 2007), but other studies have shown that TMS over the PPC can impair saccades with respect to saccade latency (Kapoula et al., 2001; Yang and Kapoula, 2004) and accuracy (van Donkelaar and Müri, 2002). The difference among these various studies could be the precise localization of stimulation. Recently, it was suggested that there is no specific parietal site where TMS has an effect on saccade metrics (Wessel and Kömpf, 1991; Ryan et al., 2006). Areas of the PPC related to visually guided saccades have been shown to vary greatly between subjects (Pierrot-Deseilligny, 1994; Pierrot-Deseilligny and Müri, 1997). The difference could also be task related. TMS appears to affect memory-guided saccades (Müri et al., 1996; van Donkelaar and Müri, 2002), whereas there was no memory delay in the saccade component of our task.
Putative mechanisms for transsaccadic memory
For subjects to perform our transsaccadic memory task with accuracy, information about object features and location must be retained and synthesized with saccade signals somewhere within the visual system. Our new results provide the first direct evidence that this process involves the PPC, at least the right PPC. Previously, the PPC has been implicated in spatial remapping during visuomotor tasks (Duhamel et al., 1992; Medendorp et al., 2003; Merriam et al., 2003), spatial working memory (Jonides et al., 1993; Todd and Marois, 2004), attention (Shomstein et al., 2006; Saalmann et al., 2007), and in numerical coding (Sawamura et al., 2002; Nieder and Miller, 2004; Hubbard et al., 2005). Any of these processes could play a role in transsaccadic memory in the task used here.
However, we think that the simplest and best explanation of our saccade-specific results, (i.e., the larger TMS effect in the saccade task) is that TMS over human PPC disrupts a saccade-related efference copy signal that is used for updating the spatial component of transsaccadic memory. Recall that to perform the saccade task accurately, our task for testing transsaccadic memory, information stored in working memory must be remapped according to the saccade's metrics (Hayhoe et al., 1991; Prime et al., 2006). In particular, we propose this process uses a similar mechanism to spatial remapping of saccade and reach targets in eye-centered coordinates (Duhamel et al., 1992; Medendorp et al., 2003; Merriam et al., 2003), perhaps even building on the same mechanism. However, in this case the remapping signals are not being used to update motor plans, but instead are being used to update an internal map of visual features.
Where would this perceptual updating occur? Figure 8 shows several different possibilities. One possibility, illustrated in Figure 8A, is that the PPC itself has a rudimentary feature map (Faillenot et al., 1999; Cornette et al., 2001; Fias et al., 2002) without any interaction between the ventral and dorsal streams of vision. However, this “noninteraction” possibility has been challenged by recent functional brain-imaging studies (Creem and Proffitt, 2001; Goodale and Haffenden, 2003; Helbig et al., 2006). Moreover, our results suggest that transsaccadic memory would require the binding of information from the dorsal and ventral visual streams. In which case, it is possible that this interaction occurs through feedforward pathways to areas of frontal cortex implicated in spatial memory (Fig. 8B). Indeed, these areas share many of the same brain areas related to spatial remapping (Funaheshi et al., 1989, 1993; Umeno and Goldberg, 1997, 2001; Chafee and Goldman-Rakic, 2000; Takeda and Funahashi, 2002; Fukushima et al., 2004). However, the dorsal and ventral streams may intercommunicate directly (Webster et al., 1994; Zhong and Rockland, 2003), as depicted in Figure 8C, but one disadvantage of this is that they do not appear to use a common spatial code. To counter this, Figure 8D shows our hypothesis that the dorsal and ventral streams may also interact with each other through re-entrant pathways to earlier visual areas (Prime et al., 2006), that would provide a common spatial code, indeed the simple eye-centered visual map required for the sort of perceptual remapping mechanism proposed above. The latter proposal is consistent with evidence of spatial remapping in early visual areas, such as V2 and V3 (Nakamura and Colby, 2002; Merriam et al., 2007) and V5 (Melcher and Morrone, 2003), and the existence of other re-entrant oculomotor pathways to V4 (Moore et al., 1998) possibly originating from the frontal eye fields (Hamker, 2003; Hamker and Zirnsak, 2006). However, because transsaccadic memory is intrinsic to essentially all natural visual tasks, likely involving both low-level, bottom-up aspects and higher-level, top-down aspects, it is premature to be more specific; all of the above mechanisms could be involved, depending on the details of the task.
Figure 8.

Different possible explanations of how visual streams may be involved in transsaccadic memory. A, The “no interaction” hypothesis suggests that transsaccadic memory does not rely on binding of visual information between the dorsal and ventral streams. B, Alternatively, integration of visual information for transsaccadic memory may occur by feedforward connections to frontal cortical regions. C, Another possibility is that visual information is integrated for transsaccadic memory by parallel connections between dorsal and ventral streams. D, Last, transsaccadic memory may result from interactions between the visual streams through re-entrant pathways to earlier visual areas.
Footnotes
This work was supported by grants from the Natural Sciences and Engineering Research Council of Canada and the Canadian Institutes of Health Research. J.D.C. holds a Canada Research Chair. We thank Saihong Sun and Dr. Lauren Sergio for technical assistance, and Judy Patla and Shael Katz for their assistance in data collection. Also, we thank Dr. Matthias Niemeier for his helpful feedback on this manuscript.
References
- Andersen RA, Essick GK, Siegel RM. Encoding of spatial location by posterior parietal neurons. Science. 1985;230:456–458. doi: 10.1126/science.4048942. [DOI] [PubMed] [Google Scholar]
- Astafiev SV, Shulman GL, Stanley CM, Snyder AZ, Van Essen DC, Corbetta M. Functional organization of human intraparietal and frontal cortex for attending, looking, and pointing. J Neurosci. 2003;23:4689–4699. doi: 10.1523/JNEUROSCI.23-11-04689.2003. [DOI] [PMC free article] [PubMed] [Google Scholar]
- Beck DM, Muggleton N, Walsh V, Lavie N. Right parietal cortex plays a critical role in change blindness. Cereb Cortex. 2006;16:712–717. doi: 10.1093/cercor/bhj017. [DOI] [PubMed] [Google Scholar]
- Beckers G, Zeki S. The consequences of inactivating areas V1 and V5 on visual motion perception. Brain. 1995;118:49–60. doi: 10.1093/brain/118.1.49. [DOI] [PubMed] [Google Scholar]
- Bledowski C, Cohen Kadosh K, Wibral M, Rahm B, Bittner RA, Hoechstetter K, Scherg M, Maurer K, Goebel R, Linden DE. Mental chronometry of working memory retrieval: a combined functional magnetic resonance imaging and event-related potentials approach. J Neurosci. 2006;26:821–829. doi: 10.1523/JNEUROSCI.3542-05.2006. [DOI] [PMC free article] [PubMed] [Google Scholar]
- Boroojerdi B, Meister IG, Foltys H, Sparing R, Cohen LG, Töpper R. Visual and motor cortex excitability: a transcranial magnetic stimulation study. Clin Neurophysiol. 2002;113:1501–1504. doi: 10.1016/s1388-2457(02)00198-0. [DOI] [PubMed] [Google Scholar]
- Brasil-Neto JP, McShane LM, Fuhr P, Hallett M, Cohen LG. Topographic mapping of the human motor cortex with magnetic stimulation: factors affecting accuracy and reproducibility. Electroencephalogr Clin Neurophysiol. 1992;85:9–16. doi: 10.1016/0168-5597(92)90095-s. [DOI] [PubMed] [Google Scholar]
- Bremmer F, Distler C, Hoffmann KP. Eye position effects in monkey cortex II: pursuit and fixation related activity in posterior parietal areas LIP and 7A. J Neurophysiol. 1997;77:962–977. doi: 10.1152/jn.1997.77.2.962. [DOI] [PubMed] [Google Scholar]
- Chafee MV, Goldman-Rakic PS. Inactivation of parietal and prefrontal cortex reveals interdependence of neural activity during memory-guided saccades. J Neurophysiol. 2000;83:1550–1566. doi: 10.1152/jn.2000.83.3.1550. [DOI] [PubMed] [Google Scholar]
- Chang E, Ro T. Maintenance of visual stability in the human posterior parietal cortex. J Cogn Neurosci. 2007;19:266–274. doi: 10.1162/jocn.2007.19.2.266. [DOI] [PubMed] [Google Scholar]
- Colby CL, Goldberg ME. Space and attention in partietal cortex. Annu Rev Neurosci. 1999;22:319–349. doi: 10.1146/annurev.neuro.22.1.319. [DOI] [PubMed] [Google Scholar]
- Constantinidis C, Procyk E. The primate working memory networks. Cogn Affect Behav Neurosci. 2004;4:444–465. doi: 10.3758/cabn.4.4.444. [DOI] [PMC free article] [PubMed] [Google Scholar]
- Cornette L, Dupont P, Bormans G, Mortlemans L, Orban GA. Separate neural correlates for the mnemonic components of successive discriminate and working memory task. Cereb Cortex. 2001;11:59–72. doi: 10.1093/cercor/11.1.59. [DOI] [PubMed] [Google Scholar]
- Corthout E, Uttl B, Walsh V, Hallett M, Cowey A. Timing of activity in early visual cortex as revealed by transcranial magnetic stimulation. Neuroreport. 1999;10:2631–2634. doi: 10.1097/00001756-199908200-00035. [DOI] [PubMed] [Google Scholar]
- Creem SH, Proffitt DR. Grasping objects by their handles: a necessary interaction between cognition and action. J Exp Psychol Hum Percept Perform. 2001;27:218–228. doi: 10.1037//0096-1523.27.1.218. [DOI] [PubMed] [Google Scholar]
- Culham JC, Valyear KF. Human parietal cortex in action. Curr Opin Neurobiol. 2006;16:205–212. doi: 10.1016/j.conb.2006.03.005. [DOI] [PubMed] [Google Scholar]
- Dambeck N, Sparing R, Meister IG, Wienemann M, Weidemann J, Topper R, Boroojerdi B. Interhemispheric imbalance during visuospatial attention investigated by unilateral and bilateral TMS over human parietal cortices. Brain Res. 2006;1072:194–199. doi: 10.1016/j.brainres.2005.05.075. [DOI] [PubMed] [Google Scholar]
- Duhamel JR, Colby CL, Goldberg ME. The updating of the representation of visual space in parietal cortex by intended eye movements. Science. 1992;225:90–92. doi: 10.1126/science.1553535. [DOI] [PubMed] [Google Scholar]
- Epstein CM, Schwartzberg DG, Davey KR, Sudderth DB. Localizing the site of magnetic brain stimulation in humans. Neurology. 1990;40:666–670. doi: 10.1212/wnl.40.4.666. [DOI] [PubMed] [Google Scholar]
- Faillenot I, Decety J, Jeannerod M. Human brain activity related to the perception of spatial features of objects. Neuroimage. 1999;10:114–124. doi: 10.1006/nimg.1999.0449. [DOI] [PubMed] [Google Scholar]
- Fias W, Dupont P, Reynvoet B, Orban GA. The quantitative nature of a visual task differentiates between ventral and dorsal stream. J Cogn Neurosci. 2002;14:646–658. doi: 10.1162/08989290260045873. [DOI] [PubMed] [Google Scholar]
- Fukushima T, Hasegawa I, Miyashita Y. Prefrontal neuronal activity encodes spatial target representations sequentially updated after nonspatial target-shift cues. J Neurophysiol. 2004;91:1367–1380. doi: 10.1152/jn.00306.2003. [DOI] [PubMed] [Google Scholar]
- Funahashi S, Bruce CJ, Goldman-Rakic PS. Mnemonic coding of visual space in the monkey's dorsolateral prefrontal cortex. J Neurophysiol. 1989;61:331–349. doi: 10.1152/jn.1989.61.2.331. [DOI] [PubMed] [Google Scholar]
- Funahashi S, Chafee MV, Goldman-Rakic PS. Prefrontal neuronal activity in rhesus monkeys performing a delayed anti-saccade task. Nature. 1993;365:753–756. doi: 10.1038/365753a0. [DOI] [PubMed] [Google Scholar]
- Genovesio A, Brunamonti E, Giusti MA, Ferraina S. Postsaccadic activities in the posterior parietal cortex of primates are influenced by both eye movement vectors and eye position. J Neurosci. 2007;27:3268–3273. doi: 10.1523/JNEUROSCI.5415-06.2007. [DOI] [PMC free article] [PubMed] [Google Scholar]
- Goodale MA, Haffenden AM. Interactions between the dorsal and ventral streams of visual processing. Adv Neurol. 2003;93:249–267. [PubMed] [Google Scholar]
- Goodale MA, Milner AD. Separate visual pathways for perception and action. Trends Neurosci. 1992;15:20–25. doi: 10.1016/0166-2236(92)90344-8. [DOI] [PubMed] [Google Scholar]
- Hamker FH. The reentry hypothesis: linking eye movements to visual perception. J Vision. 2003;3:808–816. doi: 10.1167/3.11.14. [DOI] [PubMed] [Google Scholar]
- Hamker FH, Zirnsak M. V4 receptive field dynamics as predicted by a systems-level model of visual attention using feedback from the frontal eye field. Neural Netw. 2006;19:1371–1382. doi: 10.1016/j.neunet.2006.08.006. [DOI] [PubMed] [Google Scholar]
- Hayhoe M, Lachter J, Feldman J. Integration of form across saccadic eye movements. Perception. 1991;20:393–402. doi: 10.1068/p200393. [DOI] [PubMed] [Google Scholar]
- Helbig HB, Graf M, Kiefer M. The role of action representations in visual object recognition. Exp Brain Res. 2006;174:221–228. doi: 10.1007/s00221-006-0443-5. [DOI] [PubMed] [Google Scholar]
- Herwig U, Satrapi P, Schönfeldt-Lecuona C. Using the international 10–20 EEG system for positioning of transcranial magnetic stimulation. Brain Topogr. 2003;16:95–99. doi: 10.1023/b:brat.0000006333.93597.9d. [DOI] [PubMed] [Google Scholar]
- Honda M, Wise SP, Weeks RA, Deiber MP, Hallett M. Cortical areas with enhanced activation during object-centered spatial information processing: a PET study. Brain. 1998;121:2145–2158. doi: 10.1093/brain/121.11.2145. [DOI] [PubMed] [Google Scholar]
- Hubbard EM, Piazza M, Pinel P, Dehaene S. Interactions between number and space in parietal cortex. Nat Rev Neurosci. 2005;6:435–448. doi: 10.1038/nrn1684. [DOI] [PubMed] [Google Scholar]
- Irwin DE. Memory for position and identity across eye movements. J Exp Psychol Learn Mem Cogn. 1992;18:307–317. [Google Scholar]
- Irwin DE. Integrating information across saccadic eye movements. Current Opin Psychol Sci. 1996;5:94–100. [Google Scholar]
- Irwin DE, Andrews R. Integration and accumulation of information across saccadic eye movements. In: Inui T, McClelland JL, editors. Attention and performance XVI: information integration in perception and communication. Cambridge, MA: MIT; 1996. pp. 125–155. [Google Scholar]
- Irwin DE, Gordon RD. Eye movements, attention, and trans-saccadic memory. Vis Cogn. 1998;5:127–155. [Google Scholar]
- Jonides J, Smith EE, Koeppe RA, Awh E, Minoshima S, Mintun MA. Spatial working memory in humans as revealed by PET. Nature. 1993;363:623–625. doi: 10.1038/363623a0. [DOI] [PubMed] [Google Scholar]
- Kapoula Z, Isotalo E, Müri RM, Bucci MP, Rivaud-Pechoux S. Effects of transcranial magnetic stimulation of the posterior parietal cortex on saccades and vergence. Neuroreport. 2001;12:4041–4046. doi: 10.1097/00001756-200112210-00037. [DOI] [PubMed] [Google Scholar]
- Karnath HO, Berger MF, Küker W, Rorden C. The anatomy of spatial neglect based on voxelwise statistical analysis: a study of 140 patients. Cereb Cortex. 2004;14:1164–1172. doi: 10.1093/cercor/bhh076. [DOI] [PubMed] [Google Scholar]
- Kessels RPC, d'Alfonso AA, Postma A, de Haan EH. Spatial working memory performance after high-frequency repetitive transcranial magnetic stimulation of the left and right posterior parietal cortex in humans. Neurosci Lett. 2000;287:68–70. doi: 10.1016/s0304-3940(00)01146-0. [DOI] [PubMed] [Google Scholar]
- Lappe M, Awater H, Krekelberg B. Postsaccadic visual references generate presaccadic compression of space. Nature. 2000;403:892–895. doi: 10.1038/35002588. [DOI] [PubMed] [Google Scholar]
- Lewald J, Foltys H, Töpper R. Role of the posterior parietal cortex in spatial hearing. J Neurosci. 2002;22(RC207):1–5. doi: 10.1523/JNEUROSCI.22-03-j0005.2002. [DOI] [PMC free article] [PubMed] [Google Scholar]
- Luck SJ, Vogel EK. The capacity of visual working memory for features and conjunctions. Nature. 1997;390:279–281. doi: 10.1038/36846. [DOI] [PubMed] [Google Scholar]
- Matsuda T, Matsuura M, Ohkubo T, Ohkubo H, Matsushima E, Inoue K, Taira M, Kojima T. Functional MRI mapping of brain activation during visually guided saccades and anti-saccades: cortical and subcortical networks. Psychiatry Res. 2004;131:147–155. doi: 10.1016/j.pscychresns.2003.12.007. [DOI] [PubMed] [Google Scholar]
- Medendorp WP, Goltz H, Vilis T, Crawford JD. Gaze-centered updating of visual space in human parietal cortex. J Neurosci. 2003;23:6209–6214. doi: 10.1523/JNEUROSCI.23-15-06209.2003. [DOI] [PMC free article] [PubMed] [Google Scholar]
- Melcher D, Morrone MC. Spatiotopic temporal integration of visual motion across saccadic eye movements. Nat Neurosci. 2003;6:877–881. doi: 10.1038/nn1098. [DOI] [PubMed] [Google Scholar]
- Merriam EP, Genovese CR, Colby CL. Spatial updating in human parietal cortex. Neuron. 2003;39:361–373. doi: 10.1016/s0896-6273(03)00393-3. [DOI] [PubMed] [Google Scholar]
- Merriam EP, Genovese CR, Colby CL. Remapping in human visual cortex. J Neurophysiol. 2007;97:1738–1755. doi: 10.1152/jn.00189.2006. [DOI] [PMC free article] [PubMed] [Google Scholar]
- Moore T, Tolias AS, Schiller PH. Visual representations during saccadic eye movements. Proc Natl Acad Sci U S A. 1998;95:8981–8984. doi: 10.1073/pnas.95.15.8981. [DOI] [PMC free article] [PubMed] [Google Scholar]
- Morris AP, Chambers CD, Mattingley JB. Parietal stimulation destabilizes spatial updating across saccadic eye movements. Proc Natl Acad Sci U S A. 2007;104:9069–9074. doi: 10.1073/pnas.0610508104. [DOI] [PMC free article] [PubMed] [Google Scholar]
- Muggleton NG, Postma P, Moutsopoulou K, Nimmo-Smith I, Marcel A, Walsh V. TMS over right posterior parietal cortex induces neglect in a scene-based frame of reference. Neuropsychologia. 2006;44:1222–1229. doi: 10.1016/j.neuropsychologia.2005.10.004. [DOI] [PubMed] [Google Scholar]
- Munoz DP, Everling S. Look away: the anti-saccade task and the voluntary control of eye movements. Nat Rev Neurosci. 2004;5:218–228. doi: 10.1038/nrn1345. [DOI] [PubMed] [Google Scholar]
- Müri RM, Vermersch AI, Rivaud S, Gaymard B, Pierrot-Deseilligny CP. Effects of single-pulse transcranial magnetic stimulation over the prefrontal and posterior parietal cortices during memory-guided saccades in humans. J Neurophysiol. 1996;76:2102–2106. doi: 10.1152/jn.1996.76.3.2102. [DOI] [PubMed] [Google Scholar]
- Nakamura K, Colby CL. Updating of the visual representation in monkey striate and extrastriate cortex during saccades. Proc Natl Acad Sci U S A. 2002;99:4026–4031. doi: 10.1073/pnas.052379899. [DOI] [PMC free article] [PubMed] [Google Scholar]
- Nieder A, Miller EK. A parieto-frontal network for visual numerical information in the monkey. Proc Natl Acad Sci U S A. 2004;101:7457–7462. doi: 10.1073/pnas.0402239101. [DOI] [PMC free article] [PubMed] [Google Scholar]
- Niemeier M, Crawford JD, Tweed DB. Optimal transsaccadic integration explains distorted spatial perception. Nature. 2003;422:76–80. doi: 10.1038/nature01439. [DOI] [PubMed] [Google Scholar]
- Okamoto M, Dan H, Sakamoto K, Takeo K, Shimizu K, Kohno S, Oda I, Isobe S, Suzuki T, Kohyama K, Dan I. Three-dimensional probabilistic anatomical cranio-cerebral correlation via the international 10–20 system oriented for transcranial functional brain mapping. Neuroimage. 2004;21:99–111. doi: 10.1016/j.neuroimage.2003.08.026. [DOI] [PubMed] [Google Scholar]
- Oliveri M, Turriziani P, Carlesimo GA, Koch G, Tomaiuolo F, Panella M, Caltagirone C. Parieto-frontal interactions in visual-object and visual-spatial working memory: evidence from transcranial magnetic stimulation. Cereb Cortex. 2001;11:606–618. doi: 10.1093/cercor/11.7.606. [DOI] [PubMed] [Google Scholar]
- Pascual-Leone A, Bartres-Faz D, Keenan JP. Transcranial magnetic stimulation: studying the brain-behaviour relationship by induction of “virtual lesions.”. Philos Trans R Soc London B Biol Sci. 1999;354:129–1238. doi: 10.1098/rstb.1999.0476. [DOI] [PMC free article] [PubMed] [Google Scholar]
- Pierrot-Deseilligny C. Saccade and smooth pursuit impairment after cerebral hemispheric lesions. Eur Neurol. 1994;34:121–134. doi: 10.1159/000117025. [DOI] [PubMed] [Google Scholar]
- Pierrot-Deseilligny C, Müri R. Posterior parietal cortex control of saccades in humans. In: Thier P, Karnath HO, editors. Parietal lobe contributions to orientation in 3D space. Heidelberg: Springer; 1997. pp. 135–148. [Google Scholar]
- Prime SL, Niemeier M, Crawford JD. Transsaccadic integration of visual features in a line intersection task. Exp Brain Res. 2006;169:532–548. doi: 10.1007/s00221-005-0164-1. [DOI] [PubMed] [Google Scholar]
- Prime SL, Niemeier M, Crawford JD. Transsaccadic memory of visual features. In: Harris LR, Jenkins M, editors. Computational vision in neural and machine systems. New York: Cambridge UP; 2007a. pp. 167–182. [Google Scholar]
- Prime SL, Tsotsos L, Keith GP, Crawford JD. Visual memory capacity in transsaccadic integration. Exp Brain Res. 2007b;180:609–628. doi: 10.1007/s00221-007-0885-4. [DOI] [PubMed] [Google Scholar]
- Rayner K. Eye movements in reading and information processing: 20 years of research. Psychol Bull. 1998;124:372–422. doi: 10.1037/0033-2909.124.3.372. [DOI] [PubMed] [Google Scholar]
- Ruchkin DS, Johnson R, Jr, Grafman J, Canoune H, Ritter W. Multiple visuospatial working memory buffers: evidence from spatiotemporal patterns of brain activity. Neuropsychologia. 1997;35:195–209. doi: 10.1016/s0028-3932(96)00068-1. [DOI] [PubMed] [Google Scholar]
- Rudiak D, Marg E. Finding the depth of magnetic brain stimulation: a re-evaluation. Electroencephalogr Clin Neurophysiol. 1994;93:358–371. doi: 10.1016/0168-5597(94)90124-4. [DOI] [PubMed] [Google Scholar]
- Ryan S, Bonilha L, Jackson SR. Individual variation in the location of the parietal eye fields: a TMS study. Exp Brain Res. 2006;173:389–394. doi: 10.1007/s00221-006-0379-9. [DOI] [PubMed] [Google Scholar]
- Saalmann YB, Pigarev IN, Vidyasagar TR. Neural mechanisms of visual attention: how top-down feedback highlights relevant locations. Science. 2007;316:1612–1615. doi: 10.1126/science.1139140. [DOI] [PubMed] [Google Scholar]
- Sawamura H, Shima K, Tanji J. Numerical representation for action in the parietal cortex of the monkey. Nature. 2002;415:918–922. doi: 10.1038/415918a. [DOI] [PubMed] [Google Scholar]
- Shomstein S, Behrmann M, McClelland JL. Cortical systems mediating visual attention to both objects and spatial locations. Proc Natl Acad Sci U S A. 2006;130:11387–11392. doi: 10.1073/pnas.0601813103. [DOI] [PMC free article] [PubMed] [Google Scholar]
- Smith EE, Jonides J, Koeppe RA, Awh E, Schumacher EH, Minoshima S. Spatial versus object working memory: PET investigations. J Cogn Neurosci. 1995;7:337–356. doi: 10.1162/jocn.1995.7.3.337. [DOI] [PubMed] [Google Scholar]
- Stewart LM, Walsh V, Rothwell JC. Motor and phosphene thresholds: a transcranial magnetic stimulation correlation study. Neuropsychologia. 2001;39:415–419. doi: 10.1016/s0028-3932(00)00130-5. [DOI] [PubMed] [Google Scholar]
- Takeda K, Funahashi S. Prefrontal task-related activity representing visual cue location or saccade direction in spatial working memory tasks. J Neurophysiol. 2002;87:567–588. doi: 10.1152/jn.00249.2001. [DOI] [PubMed] [Google Scholar]
- Tanaka S. Transcranial magnetic stimulation studies of human working memory. Jpn Psychol Rev. 2005;48:482–497. [Google Scholar]
- Todd JJ, Marois R. Capacity limit of visual short-term memory in human posterior parietal cortex. Nature. 2004;428:751–754. doi: 10.1038/nature02466. [DOI] [PubMed] [Google Scholar]
- Umeno MM, Goldberg ME. Spatial processing in the monkey frontal eye field: I Predictive visual responses. J Neurophysiol. 1997;78:1373–1383. doi: 10.1152/jn.1997.78.3.1373. [DOI] [PubMed] [Google Scholar]
- Umeno MM, Goldberg ME. Spatial processing in the monkey frontal eye field: II Memory responses. J Neurophysiol. 2001;86:2344–2352. doi: 10.1152/jn.2001.86.5.2344. [DOI] [PubMed] [Google Scholar]
- Ungerleider LG, Mishkin M. Two cortical visual systems. In: Ingle DJ, Goodale MA, Mansfield RJ, editors. Analysis of visual behavior. Cambridge, MA: MIT; 1982. pp. 549–586. [Google Scholar]
- Valyear KF, Culham JC, Sharif N, Westwood D, Goodale MA. A double dissociation between sensitivity changes in object identity and object orientation in the ventral and dorsal visual streams: a human fMRI study. Neuropsychologica. 2006;44:218–228. doi: 10.1016/j.neuropsychologia.2005.05.004. [DOI] [PubMed] [Google Scholar]
- van Asselen M, Kessels RP, Neggers SF, Kappelle LJ, Frijns CJ, Postma A. Brain areas involved in spatial working memory. Neuropsychologia. 2006;44:1185–1194. doi: 10.1016/j.neuropsychologia.2005.10.005. [DOI] [PubMed] [Google Scholar]
- van Donkelaar P, Müri R. Craniotopic updating of visual space across saccades in the human posterior parietal cortex. Proc Biol Sci. 2002;269:735–739. doi: 10.1098/rspb.2001.1935. [DOI] [PMC free article] [PubMed] [Google Scholar]
- Vesia M, Monteon JA, Sergio LE, Crawford JD. Hemispheric asymmetry in memory-guided pointing during single-pulse transcranial magnetic stimulation of human parietal cortex. J Neurophysiol. 2006;96:3016–3027. doi: 10.1152/jn.00411.2006. [DOI] [PubMed] [Google Scholar]
- Vogel EK, Woodman GF, Luck SJ. Storage of features, conjunctions, and objects in visual working memory. J Exp Psychol Hum Percept Perform. 2001;27:92–114. doi: 10.1037//0096-1523.27.1.92. [DOI] [PubMed] [Google Scholar]
- Wassermann EM. Risk and safety of repetitive transcranial magnetic stimulation: report and suggested guidelines from the International Workshop on the Safety of Repetitive Transcranial Magnetic Stimulation, June 5–7, 1996. Electroencephalogr Clin Neurophysiol. 1998;108:1–16. doi: 10.1016/s0168-5597(97)00096-8. [DOI] [PubMed] [Google Scholar]
- Webster MJ, Bachevalier J, Ungerleider LG. Connections of inferior temporal areas TEO and TE with parietal and frontal cortex in macaque monkeys. Cereb Cortex. 1994;4:470–483. doi: 10.1093/cercor/4.5.470. [DOI] [PubMed] [Google Scholar]
- Weidner R, Fink GR. The neural mechanisms underlying the Müller-Lyer illusion and its interaction with visuospatial judgments. Cereb Cortex. 2007;17:878–884. doi: 10.1093/cercor/bhk042. [DOI] [PubMed] [Google Scholar]
- Wessel K, Kömpf D. Transcranial magnetic brain stimulation: lack of oculomotor response. Exp Brain Res. 1991;86:216–218. doi: 10.1007/BF00231056. [DOI] [PubMed] [Google Scholar]
- Wilson SA, Thickbroom GW, Mastaglia FL. Transcranial magnetic stimulation mapping of the motor cortex in normal subjects. The representation of two intrinsic hand muscles. J Neurol Sci. 1993;118:134–144. doi: 10.1016/0022-510x(93)90102-5. [DOI] [PubMed] [Google Scholar]
- Yang Q, Kapoula Z. TMS over the left posterior parietal cortex prolongs latency of contralateral saccades and convergence. Invest Ophthalmol Vis Sci. 2004;45:2231–2239. doi: 10.1167/iovs.03-1291. [DOI] [PubMed] [Google Scholar]
- Zhong YM, Rockland KS. Inferior parietal lobule projections to anterior inferotemporal cortex (area TE) in macaque monkey. Cereb Cortex. 2003;13:527–540. doi: 10.1093/cercor/13.5.527. [DOI] [PubMed] [Google Scholar]