

Abstract
Vertebrate brain hosts a diverse collection of microRNAs, but little is known about their functions in vivo. Here we propose that mouse microRNA-9 (miR-9) targets Foxg1 mRNAs for proper generation of Cajal–Retzius cells in the medial pallium. miR-9 expression is mediolaterally graded, being most intense in the cortical hem; it contrasts with the Foxg1 expression in a reciprocal gradient. The 3′ untranslated regions of tetrapod, but not of teleost, Foxg1 mRNAs conserve miR-9 target sequences and are regulated by miR-9. Gain- and loss-of-function analyses of miR-9 showed that miR-9 negatively regulates endogenous Foxg1 protein level. Moreover, miR-9 overexpression in developing telencephalon at E11.5 by electroporation resulted in ectopic Reelin-positive cells over the cortex beyond the marginal zone. In addition, inhibition of endogenous miR-9 function by antisense oligonucleotides caused the regression of Wnt3a-positive cortical hem and reduction of reelin-, p73-, and NeuroD1-positive cells.
Keywords: microRNA-9, Foxg1, telencephalon, medial pallium, Reelin, Cajal–Retzius cells
Introduction
MicroRNAs (miRNAs) are endogenous small noncoding RNAs that have been identified in the diverse range of eukaryotic genomes (for review, see Krutzfeldt et al., 2006). Most animal miRNAs form an imperfect base pair with 3′ untranslated regions (UTRs) of their target mRNAs; the second through seventh nucleotides (the seed region) are most critical for target recognition and suppression (Doench and Sharp, 2004; Lewis et al., 2005). The base pairing results in either the degradation of the target mRNAs or translational repression; miRNAs are thought to function in fine tuning of gene expression that may be essential in many biological processes (for review, see Kloosterman and Plasterk, 2006). The brain hosts a diverse collection of miRNAs, many being expressed in specific brain regions or neurons, suggesting their roles in brain development (Kapsimali et al., 2007). However, little is known of miRNA functions in brain development (Giraldez et al., 2005; Choi et al., 2008), although several studies in vitro have indicated miRNA's roles in neurogenesis (Vo et al., 2005; Conaco et al., 2006; Schratt et al., 2006). microRNA-9 (miR-9) is one such microRNA present in both Drosophila and vertebrates (Krichevsky et al., 2003; Li et al., 2006). miR-9 is not expressed in midbrain–hindbrain boundary (MHB) region, and the reason was recently postulated as being because miR-9 inhibits several components of the Fgf signaling pathway, thereby delimiting the MHB organizer activity (Leucht et al., 2008). The miR-9 expression is most apparent in cortex, and in this report we propose that miR-9 targets Foxg1 for proper Cajal–Retzius cell differentiation in the medial pallium of developing telencephalon.
Materials and Methods
Plasmid construction.
Approximately 200 bp genomic fragments encoding miR-9-1, miR-9-2, and miR-9-3 were amplified by PCR and inserted into either the pEF-1α vector (Invitrogen) to generate miR-9-1WT, miR-9-2WT, and miR-9-3WT, respectively, for transfection into P19 cells, or the pCMS-EGFP vector (SV40-EGFP; Clontech) to generate CMV-miR-9-2WT-SV40-EGFP for electroporation into telencephalon. Primer sets used to amplify the fragments are described in supplemental material (available at www.jneurosci.org). Site-directed mutagenesis in the mature nucleotide miR-9 sequences was performed as described previously (Mochizuki et al., 2000). Four-base substitution was introduced into the seed sequence (CTTTGGT to CAAACGT) of either miR-9-1 or miR-9-2 to generate miR-9-1MT and miR-9-2MT, respectively. Luciferase reporters conjugated with each 3′UTR were constructed as described previously (Zhao et al., 2005); concatemerized oligonucleotides for each 3′UTR are given in the supplemental data.
Luciferase assay.
Luciferase assay was performed with P19 cells as described previously (Zhao et al., 2005); for the details, see supplemental material (available at www.jneurosci.org).
In situ hybridization, immunohistochemistry, and immunoblot.
Whole-mount and section in situ hybridization were performed as described previously (Wilkinson and Nieto, 1993). Antisense digoxigenin (DIG)- or fluorescein isothiocyanate-labeled RNA probes were synthesized using DIG or Fluorescein RNA Labeling Mix (Roche). DIG-labeled LNA-oligonucleotides were purchased from Exiqon. Immunohistochemistry, immunocytochemistry, and immunoblot were performed as described previously (Hevner et al., 2003; Boutz et al., 2007); brains were sectioned at 14 μm. Immunoblot experiments were repeated at least two times. Quantification of band intensity was carried out by ImageJ (Abramoff et al., 2004). The sources of probes and antibodies used are described in the supplemental material (available at www.jneurosci.org).
Reverse transcription-PCR.
cDNAs were synthesized and reverse transcription (RT)-PCR was performed as described previously (Uno and Ueda, 2007). Primers used are described in the supplemental material (available at www.jneurosci.org). The quantification was normalized by the amount of TATA binding protein amplification. For all primer sets tested, correlation (R2) was >0.98, and the slope was −3.1 to −3.6 in each standard curve.
Electroporation.
One microgram of plasmid or 100 μm antisense oligonucleotide solution was electroporated as described previously (Borrell et al., 2005). Antisense oligonucleotide for miR-9 (miR-9AS; CAUACAGCUAGAUAACCAAAGA) was purchased from Dharmacon; control is scrambled oligonucleotide (CAGAUGACAGAUCAAUAAACCA). Embryonic day 13.5 (E13.5) neocortex cells were dissociated and cultured as described previously (Meberg and Miller, 2003). Electroporation of miR-9-2WT into these cells was conducted using MicroPorator (Digital Bio).
Results
miR-9 expression is intense in developing medial pallium
In mouse, miR-9 is transcribed as three primary miRNAs (pri-miRNAs), miR-9-1, miR-9-2, and miR-9-3 (Griffiths-Jones, 2006). Their mature forms have 23 identical nucleotides (see Fig. 3C), which are perfectly conserved not only in vertebrates but also in Drosophila. Quantitative RT-PCR demonstrated that the expressions of all three pri-miR-9 members were not apparent at E8.5, and miR-9-2 was most and miR-9-1 least abundant in E10.5 brain (supplemental Fig. 1, available at www.jneurosci.org as supplemental material). By whole-mount in situ hybridization, miR-9 was first detected in the telencephalic primordium at E9.0, when the primordium is to be formed (Fig. 1Aa). At E9.5, the expression took place in the preoptic area and infundibular area (Fig. 1Ab,Ac,Ac′, arrows) and in the hindbrain (Fig. 1Ab,Ac, arrowheads). At E10.5, the transcripts were also found in the otic vesicles and spinal cord (Fig. 1Ac). The in situ hybridization in sections at E10.5 demonstrated that the expression is dorsolaterally graded in the cortex, being dorsomedially most intense (Fig. 1Ba,Bb, arrowheads), although it was not apparent in the choroidal roof. The subcortex scarcely expressed miR-9, but it was found in the caudal pallidum (Fig. 1Bb, arrow). At E11.5, in the medial pallium the miR-9-positive area abutted the transthyletin (TTR)-positive choroid plexus region (Fig. 1Bc,Bc′). The miR-9 expression was low in the lateral cortex, but was apparent in the ventricular zone of ganglionic eminences at this stage. In E12.5 cortex, miR-9-positive domain was restricted to the most medial pallium (Fig. 1Bd,Bd′), but the expression was retained in the marginal zone over the entire cortex, including the ventral pallium. miR-9 was not expressed in the Wnt3a/TTR-double-negative junctional epithelia (Fig. 1Bd′,Be′, arrowheads) (Grove et al., 1998). The medial end of miR-9 expression coincided with Wnt3a-positive cortical hem (Fig. 1Bd–Be′). At E12.5, miR-9 expression was also apparent in the septum, cortex/subcortex boundary, and differentiated cell zone of the subcortex.
Figure 3.

Effects of miR-9 on Foxg1 protein expression in the cortex cells. A, B, The effect of miR-9-2 overexpression. A, miR-9-2WT or control vector together with SV40-EGFP was electroporated into the neocortices at E12.5, and the EGFP-positive regions were dissected out from six cerebral hemispheres at E13.5. Foxg1 expression level was examined by immunoblotting; EGFP and GAPDH3 served as loading control. Experiments were conducted two times; quantification of the bands indicated 69% and 42% reduction of Foxg1 protein by miR-9-2 WT in each experiment. B, E13.5 neocortex cells were dissociated, transfected with CMV-miR-9-2WT-SV40-EGFP or SV40-EGFP by electroporation, and cultured for 24 h. Foxg1 expression was examined by immunostaining. Scale bar, 10μm. C, The effect of miR-9-2 knockdown. miR-9AS or control oligonucleotide was electroporated with SV40-EGFP into the neocortices. Foxg1 expression level in the neocortices was examined by immunoblotting. Experiments were conducted two times; quantification of the bands indicated 2.3- and 1.8-fold increase of Foxg1 protein expression by miR-9AS in each experiment.
Figure 1.

miR-9 expression in developing telencephalon. A, Whole-mount in situ hybridization at E9.0 (Aa), E9.5 (Ab), and E10.5 (Ac, Ac′). Arrows indicate the expression in preoptic area, and arrowheads indicate the expression in hindbrain. Aa–Ac, Lateral views; Ac′, a frontal view. B, Section in situ hybridization with probes at days indicated. All are frontal views. Ba, Anterior view; Bb, posterior view. Bc′–Be′, Magnified views of medial regions in Bc–Be. Arrowheads in Ba and Bb indicate the expression in medial pallium, and arrows indicate the expression in pallidum. Bc, Bc′, miR-9 expression (blue) abuts the TTR-positive (orange) choroid plexus. Bd–Be′, It is found in Wnt3a-positive cortical hem but not in the junctional epithelium (arrowheads) between the choroid plexus and cortical hem. Scale bars: A, 250 μm; Ba–Be, 200 μm; Bc′–Be′, 100 μm.
miR-9 regulates Foxg1 expression in vitro
Several computational algorithms have been developed to predict miRNA targets; target candidates of miR-9 were first sought using PicTar (Krek et al., 2005), Target scan (Lewis et al., 2003), and miRanda (John et al., 2004) algorithms. The candidates were further selected by two criteria: (1) conservation of the recognition sequences in the 3′UTRs of the candidate genes among human, mouse, and chick orthologs; and (2) expression and/or functional data reported in brain development. The criteria selected four genes: Lhx5, Id4, Nr2e1, and Foxg1 (supplemental Fig. 2A, available at www.jneurosci.org as supplemental material). It was then determined by a Luciferase assay with P19 cells whether miR-9 regulates the expression of these genes at the protein level. Wild-type (WT) miR-9-1, miR-9-2, and miR-9-3 all suppressed the expression of Luciferase from a luciferase reporter conjugated with Foxg1 3′UTR (luc-Mm-Foxg1WT), whereas mutant (MT) miR-9-1 or miR-9-2, in which the seed sequence was transversely mutated, did not (Fig. 2A). Furthermore, the luciferase reporter conjugated with mutant Foxg1 3′UTR (luc-Mm-Foxg1MT), in which the target sequence was transversely mutated, was not effectively suppressed by miR-9-1WT, miR-9-2WT, or miR-9-3WT (Fig. 2A). On the other hand, miR-9-2WT had no effect on the Luciferase expression from luciferase reporters conjugated with Lhx5, Id4, Nr2e1, or Foxg1 3′UTR (supplemental Fig. 2B, available at www.jneurosci.org as supplemental material). In these assays, the luciferase expression was nearly the same at the mRNA level (data not shown).
Figure 2.
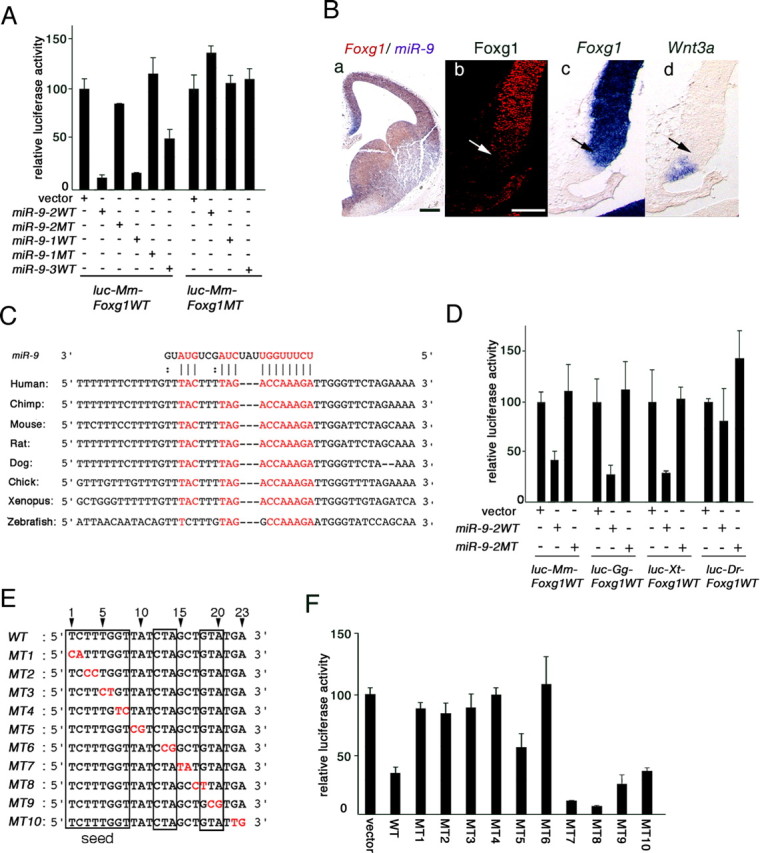
miR-9 targets Foxg1 3′UTR. A, Essential roles of seed sequence and target sequence in suppression of Foxg1 3′UTR by miR-9. Effects of WT or MT miR-9-1, miR-9-2, or miR-9-3 on Luciferase expression from luciferase reporters conjugated with WT or MT Foxg1 3′UTR are shown (for the details, see supplemental material, available at www.jneurosci.org). In all the assays, the luciferase expression was nearly the same at the mRNA level. B, Foxg1 spatial expression pattern in the medial pallium. Ba, miR-9 (purple) and Foxg1 (brown) mRNA expression in E12.0 telencephalon; Bb–Bd, Foxg1 protein, Foxg1 mRNA, and Wnt3a mRNA expression boundaries. Arrows in Bb–Bd indicate the limits of cortical hem marked by Wnt3a (Bd). Scale bars: Ba, 200 μm; Bb–Bd, 100 μm. C, Conservation of miR-9 target sequences in vertebrate Foxg1 3′UTRs. D, Luciferase assay of miR-9 suppression of mouse (Mm), chick (Gg), Xenopus (Xt), and zebrafish (Dr) Foxg1 3′UTRs. E, Two-base mutations in miR-9 as indicated in red (MT1–10). Sequences assumed to make base pairing in the wild-type miR-9 with Foxg1 target sequence are boxed. F, Luciferase assay of the Foxg1-suppressing activities of miR-9-2 mutated as shown in E.
At E12, Foxg1 is expressed in the entire telencephalon, but it is graded in the medial pallium and absent in the most medial pallium, including cortical hem, where miR-9 is intensively expressed (Fig. 2Ba). In addition, the medial boundary of Foxg1 protein expression would be more lateral than that of the Foxg1 mRNA expression (Fig. 2Bb–Bd).
The miR-9 target sequence in Foxg1 3′UTR is highly conserved among vertebrates (Fig. 2C). Indeed, Luciferase expression from luciferase reporters conjugated with chick or Xenopus tropicalis Foxg1 3′UTR (luc-Gg-Foxg1WT and luc-Xt-Foxg1WT, respectively) were effectively suppressed by mouse miR-9-2WT, and not by miR-9-2MT (Fig. 2D). In contrast, miR-9-2WT had no effect on the Luciferase expression from a luciferase reporter conjugated with zebrafish Foxg1 3′UTR (luc-Dr-Foxg1WT). miR-9 target sequences are somewhat and their 5′ and 3′ flanking sequences are greatly distorted in the zebrafish Foxg1 3′UTR (Fig. 2C).
Core sequences in miR-9 function
To determine the sequences essential to the Foxg1-suppressing activity in mature miR-9, mutations were introduced at each of the two nucleotides above the 23 nt (MT1–10) (Fig. 2E); their activities were examined by cotransfecting either of the mutated forms with the luc-Mm-Foxg1 reporter into the P19 cells (Fig. 2F). The luciferase assay demonstrated that mutations not only in the seed sequence (8 nt from the 5′ end: MT1–4) but also at the 13th and 14th nucleotides (MT6) extinguished the repressive activity; mutations at the 15th through 23rd nucleotides (MT7–10) had no significant effect. Thus, for the miR-9 activity, not only the seed sequence but also the 13th through 15th CTA are essential, whereas 18th through 20th GTA are not; both are predicted to make base pairing with Foxg1 3′UTR target sequence.
miR-9 suppresses Foxg1 protein expression
We found that P19 cells efficiently differentiate into cells of dorsal telencephalic character when treated with 1 nm retinoic acid, expressing Foxg1 and miR-9-2 (supplemental Fig. 3A,B, available at www.jneurosci.org as supplemental material). In these cells, the miR-9-2WT, but not miR-9-2MT, inhibited the Foxg1, but not Nr2E1, protein expression (supplemental Fig. 3C, available at www.jneurosci.org as supplemental material). Expression of Foxg1 mRNA was not significantly affected (supplemental Fig. 3D, available at www.jneurosci.org as supplemental material). Furthermore, miR-9 knockdown with LNA antisense oligonucleotide (Ørom et al., 2006) (LNA-miR-9AS) enhanced the Foxg1 protein expression (supplemental Fig. 3E, available at www.jneurosci.org as supplemental material). The miR-9 effects on Foxg1 protein expression were also examined in neocortex cells. The miR-9-2WT overexpression in E12.5 cortex by electroporation repressed the Foxg1 protein expression (Fig. 3A); the repression was also demonstrated in the cells dissociated in culture (Fig. 3B). In addition, conversely, miR-9-2 knockdown by the electroporation of 100 μm miR-9 antisense oligonucleotides caused the upregulation of Foxg1 protein expression (Fig. 3C).
miR-9 regulates the differentiation of Cajal–Retzius cells
Foxg1 has been indicated to function in early corticogenesis by promoting the proliferation of cortical progenitor cells and inhibiting their premature differentiation into Cajal–Retzius cells, restricting their differentiation in the Foxg1-negative cortical hem region (Hanashima et al., 2007). Therefore, miR-9 function in Cajal–Retzius cell differentiation was examined by electroporating a miR-9-2/EGFP expression vector into the E11.5 cerebral cortex. E11.5 is the stage when the initial neurogenesis occurs with the emergence of preplate harboring Cajal–Retzius cells (Takiguchi-Hayashi et al., 2004; Campbell, 2005); p73, p21, and Reelin are the markers of these cells. At 24 or 48 h after electroporation, p73-, p21-, and Reelin-positive cells were abundantly found over the entire cortex beyond the marginal zone (Fig. 4Aa,Ab,Ad,Ad′; supplemental Fig. 4A, available at www.jneurosci.org as supplemental material); they were the cells that expressed EGFP strongly (Fig. 4Ad′). Loss of Foxg1 in mouse cortex also causes premature neural differentiation in the ventricular zone as identified by the emergence of an early neural marker, Tuj1-positive cells (Muzio and Mallamaci, 2005); normally, Tuj1-positive cells are scarcely found in the ventricular zone. The miR-9-2 electroporation enhanced Tuj1-positive cells in the ventricular zone as well (Fig. 4Ac,Ac′). In addition, migrating neurons in the cortex appeared disorganized by miR-9-2 overexpression, but its details remain for future studies. Of note is that when neocortex was electroporated with miR-9 at E14.5 and examined at E15.5, Reelin-positive cells were not induced ectopically (supplemental Fig. 4B, available at www.jneurosci.org as supplemental material), suggesting that only young neocortical cells are sensitive to either miR-9 or Foxg1.
Figure 4.
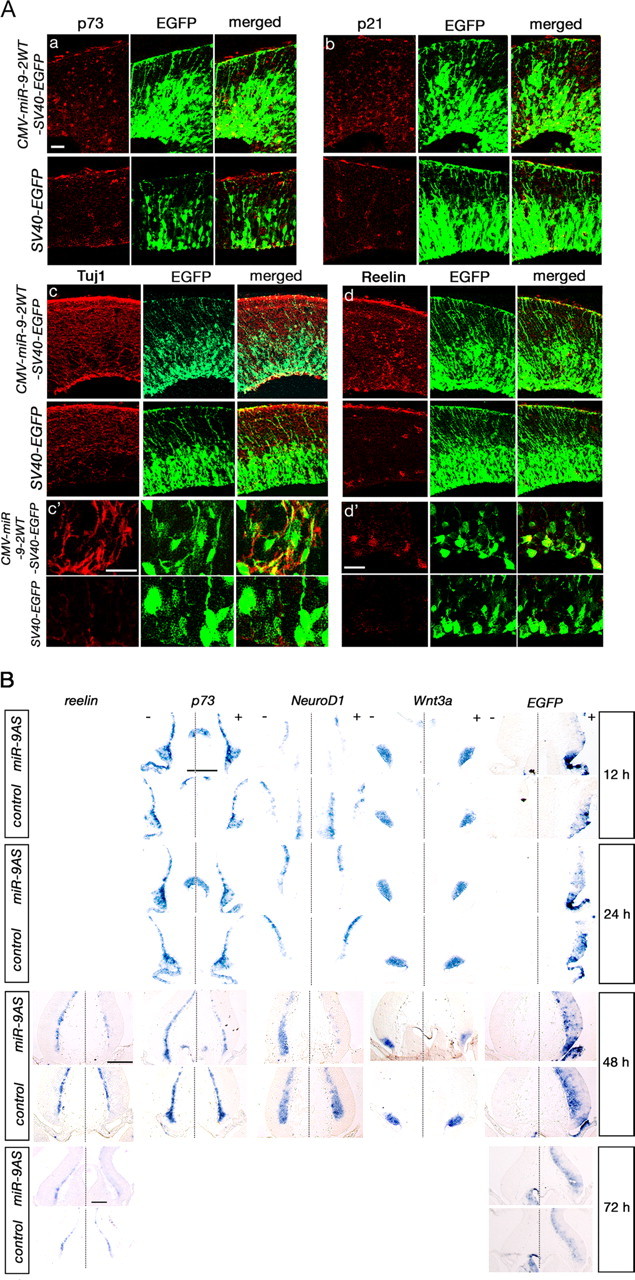
Effects of miR-9 on Cajal–Retzius cell differentiation in vivo. A, The effect of miR-9-2 overexpression. CMV-miR-9-2WT-SV40-EGFP or SV40-EGFP was electroporated at E11.5, and the neocortices were immunostained for p73 (Aa), p21 (Ab), Tuj1 (Ac, Ac′), Reelin (Ad, Ad′), and EGFP at E13.5. Ac′, Ad′, Magnified views of the ventricular regions. B, The effect of miR-9 knockdown. miR-9AS or control oligonucleotide was electroporated with SV40-EGFP into the medial pallium, and expressions of markers indicated were examined at indicated hours after the electroporation by in situ hybridization. In each panel, the left (−) indicates the control unelectroporated side, and the right (+) indicates the electroporated side. Scale bars: A, 20 μm; B, 200 μm (scale bars in B, from top to bottom, indicate 12 and 24 h, 48 h, and 72 h, respectively).
The role of miR-9 in Cajal–Retzius cell differentiation in the medial pallium was further examined by electroporating miR-9 antisense oligonucleotide (miR-9AS); miR-9 expression is intensively found in the medial pallium at E11.5 (Fig. 1Bc). At 12 h after electroporation, no obvious change was observed in the expression of reelin, p73, NeuroD1, or Wnt3a; NeuroD1 is a marker for early differentiating neurons, and Wnt3a a cortical hem marker. At 24 h after electroporation, however, some decrease was observed in the expression of these markers, and at 48 h significant decrease was observed. Regression of the Wnt3a-positive cortical hem was distinct, and the reduction of reelin- and p73-positive Cajal–Retzius cells was apparent (Fig. 4B); reelin-positive cells remained reduced at 72 h. miR-9AS also reduced the NeuroD1-positive cells, whereas the expression of Ngn2, a cortical progenitor cell marker, was largely unaffected (data not shown).
Discussion
In mammals, miR-9 is most abundantly expressed in cortex during the development (Fig. 1). However, miR-9 targets have not yet been identified, and their functions in telencephalon development remain to be clarified. During the course of this study, a comparative analysis of the 3′UTR among amniote Foxg1 orthologs anticipated that miR-9 and miR-33 may regulate Foxg1 posttranscriptionally (Bredenkamp et al., 2007). Here we propose that miR-9 indeed targets Foxg1 mRNAs and regulates in the most medial pallium for proper generation of Cajal–Retzius cells that play essential roles in mammalian corticogenesis (for review, see Rice and Curran, 2001).
miR-9 represses Foxg1 expression
We demonstrated that miR-9 represses endogenous Foxg1 protein expression not only in P19 cells (supplemental Fig. 3, available at www.jneurosci.org as supplemental material) but also in cortex cells (Fig. 3). The base pairing between the seed sequence of miRNAs and the target sequence in the 3′UTR of target mRNAs is essential for the target recognition and suppression (Doench and Sharp, 2004; Lewis et al., 2005). In the miR-9 suppression of Foxg1 3′UTR, the seed sequence is indeed essential (Fig. 2E,F), but the 12th through 14th CTA, which were predicted to make base pairing with Foxg1 3′UTR, were also critical for the miR-9 activity. Not only Foxg1 but also Lhx5, Id4, and Nr2e1 mRNAs have similar target sequences for miR-9 seed sequence in their 3′UTR, but only Foxg1 3′UTR is sensitive to miR-9 suppression. The 5′ and 3′ sequences flanking the target sequence are different among these mRNAs. Zhao et al. (2005) proposed the role of sequences flanking the target sequence; miRNA is less accessible to the target sites of which flanking sequences have complex secondary structures. ΔG values of the expected secondary structures of 5′ and 3′ 70 bp sequences flanking the miR-9 target sequence of Foxg1 3′UTR are −5.3 kcal/mol and −1.2 kcal/mol (Bredenkamp et al., 2007), respectively; the secondary structures of these sequences are particularly unstable. In contrast, ΔG values of the secondary structures of those sequences in Lhx5 3′UTR are −19.3 and −12.2 kcal/mol; in Id4 3′UTR, −5.1 and −7.9 kcal/mol; in Nr2E1 3′UTR, −19.3 and −8.6 kcal/mol, respectively. The secondary structures of these sequences are stable, and Zhao's model well explains why Foxg1 mRNA is, but Lhx5, Id4, and Nr2e1 are not, the miR-9 target.
miR-9 regulates Cajal–Retzius cell differentiation
We demonstrated by both overexpression and knockdown experiments that miR-9 regulates Reelin-, p73-, and p21-positive Cajal–Retzius cell differentiation in cortex (Fig. 4; supplemental Fig. 4, available at www.jneurosci.org as supplemental material). Studies with Foxg1 mutants have suggested that neural progenitor cells in the cortex by midgestation are prone to differentiate into Cajal–Retzius cells, and Foxg1 suppresses this differentiation, sustaining the undifferentiated state in the progenitor cells (Hanashima et al., 2004; Martynoga et al., 2005; Shen et al., 2006). The major source of Cajal–Retzius cells is the cortical hem with the peak of their generation at E10.5–E11.5 (Takiguchi-Hayashi et al., 2004; Yoshida et al., 2006). Foxg1 expression takes place at E8.5–E9.0 before the miR-9 expression (Tao and Lai, 1992); Foxg1 is graded in the medial pallium and absent in the most medial pallium or the cortical hem. miR-9 expression takes place at E9.5 and by E11.5 is graded in the most medial pallium reciprocally to the Foxg1 expression. Subsequently, miR-9 expression becomes more restricted; at E12.5, it is found in the cortical hem region and marginal zone, being reminiscent of the distribution of the Wnt3a-positive cell streak from cortical hem (Fig. 1Bd,Bd′) (Yoshida et al., 2006). The medial boundary of Foxg1 protein expression would terminate more laterally than that of the Foxg1 mRNA expression (Fig. 2B). We propose that miR-9 modulates Foxg1 protein expression in the medial pallium for the proper differentiation of Cajal–Retzius cells.
In Foxg1 heterozygous mutants, the Foxg1 protein level is reduced to approximately one-half, but the cortical hem is not expanded, and production of Cajal–Retzius cells is not elevated (Hanashima et al., 2004; Muzio and Mallamaci, 2005; Eagleson et al., 2007; Hanashima et al., 2007). This raises the question of whether miR-9 indeed modulates the Foxg1 protein level in medial pallium for Cajal–Retzius cell production. However, reduction of Foxg1 expression to approximately one-half with small interfering RNA increases the differentiation of cultured E12 cortical cells into Reelin-positive cells (Shen et al., 2006). Foxg1 would have a critical threshold around a haploid amount to suppress Cajal–Retzius cell differentiation. At the same time, we cannot exclude the possibility that miR-9 targets not only Foxg1 but also other genes for Cajal–Retzius cell differentiation; miRNAs are known to target multiple mRNAs (Lim et al., 2005).
Cortical Cajal–Retzius cells have several sources other than cortical hem at the borders of the developing pallium: the septum and pallial–subpallial boundary (PSB) (Bielle et al., 2005). Foxg1 is probably involved in the Cajal–Retzius cell production at these sites (Hanashima et al., 2007). miR-9 is also expressed in PSB and septum (Fig. 1B), where it might also counteract Foxg1 in the generation of Cajal–Retzius cells. miR-9 is also expressed in preoptic area and ganglionic eminences (Fig. 1A,B); Foxg1 is essential to subcortex development (Xuan et al., 1995; Martynoga et al., 2005). There are also several sites other than telencephalon at which Foxg1 and miR-9 are coexpressed. One such site is the otic vesicle (Fig. 1A), where Foxg1 is reported to be essential to inner ear development (Pauley et al., 2006).
Reelin-positive cells are present in the telencephalon of all vertebrates, including lamprey (Molnár et al., 2006). These cells in tetrapods are considered mammalian Cajal–Retzius-like, whereas in zebrafish the majority of the cells in dorsal telencephalon are Reelin-positive but unlikely to be homologous to Cajal–Retzius cells in mammals (Costagli et al., 2002). Tetrapod Foxg1 3′UTRs were regulated by miR-9, whereas the zebrafish one was not. In zebrafish embryo, miR-9 is evenly expressed in proliferative zones as well as in neurons of almost the entire dorsal telencephalon (Kapsimali et al., 2007). Moreover, Medaka Foxg1 3′UTR does not conserve the miR-9 target sequence, and Foxg1 gene has not yet been identified in the fugu genome.
Footnotes
This work was supported by a Grant-in-Aid for Creative Scientific Research from the Japan Society for the Promotion of Science. We thank Drs. T. Curran, K. Abe, and R. Nusse for providing us with reelin, TTR, and Wnt3a probes for RNA in situ hybridization analyses, Y. Sasai for the Foxg1 antibody, and H. Takanaga for technical support of in vivo electroporation. We also thank Dr. Y. Hayashizaki and the Genome Resource and Analysis unit in the Center for Developmental Biology (CDB) for providing us FANTOM3 clones for Foxg1, p73, and NeuroD1. We are also grateful to the Functional Genomics Unit in CDB for gene chip analysis.
References
- Abramoff MD, Magelhaes PJ, Ram SJ. Image processing with ImageJ. Biophotonics Int. 2004;11:36–42. [Google Scholar]
- Bielle F, Griveau A, Narboux-Nême N, Vigneau S, Sigrist M, Arber S, Wassef M, Pierani A. Multiple origins of Cajal-Retzius cells at the borders of the developing pallium. Nat Neurosci. 2005;8:1002–1012. doi: 10.1038/nn1511. [DOI] [PubMed] [Google Scholar]
- Borrell V, Yoshimura Y, Callaway EM. Targeted gene delivery to telencephalic inhibitory neurons by directional in utero electroporation. J Neurosci Methods. 2005;143:151–158. doi: 10.1016/j.jneumeth.2004.09.027. [DOI] [PubMed] [Google Scholar]
- Boutz PL, Chawla G, Stoilov P, Black DL. MicroRNAs regulate the expression of the alternative splicing factor nPTB during muscle development. Genes Dev. 2007;21:71–84. doi: 10.1101/gad.1500707. [DOI] [PMC free article] [PubMed] [Google Scholar]
- Bredenkamp N, Seoighe C, Illing N. Comparative evolutionary analysis of the FoxG1 transcription factor from diverse vertebrates identifies conserved recognition sites for microRNA regulation. Dev Genes Evol. 2007;217:227–233. doi: 10.1007/s00427-006-0128-x. [DOI] [PubMed] [Google Scholar]
- Campbell K. Cortical neuron specification: it has its time and place. Neuron. 2005;46:373–376. doi: 10.1016/j.neuron.2005.04.014. [DOI] [PubMed] [Google Scholar]
- Choi PS, Zakhary L, Choi WY, Caron S, Alvarez-Saavedra E, Miska EA, McManus M, Harfe B, Giraldez AJ, Horvitz RH, Schier AF, Dulac C. Members of the miRNA-200 family regulate olfactory neurogenesis. Neuron. 2008;57:41–55. doi: 10.1016/j.neuron.2007.11.018. [DOI] [PMC free article] [PubMed] [Google Scholar]
- Conaco C, Otto S, Han JJ, Mandel G. Reciprocal actions of REST and a microRNA promote neuronal identity. Proc Natl Acad Sci U S A. 2006;103:2422–2427. doi: 10.1073/pnas.0511041103. [DOI] [PMC free article] [PubMed] [Google Scholar]
- Costagli A, Kapsimali M, Wilson SW, Mione M. Conserved and divergent patterns of Reelin expression in the zebrafish central nervous system. J Comp Neurol. 2002;450:73–93. doi: 10.1002/cne.10292. [DOI] [PubMed] [Google Scholar]
- Doench JG, Sharp PA. Specificity of microRNA target selection in translational repression. Genes Dev. 2004;18:504–511. doi: 10.1101/gad.1184404. [DOI] [PMC free article] [PubMed] [Google Scholar]
- Eagleson KL, Schlueter McFadyen-Ketchum LJ, Ahrens ET, Mills PH, Does MD, Nickols J, Levitt P. Disruption of Foxg1 expression by knock-in of cre recombinase: effects on the development of the mouse telencephalon. Neuroscience. 2007;148:385–399. doi: 10.1016/j.neuroscience.2007.06.012. [DOI] [PMC free article] [PubMed] [Google Scholar]
- Giraldez AJ, Cinalli RM, Glasner ME, Enright AJ, Thomson JM, Baskerville S, Hammond SM, Bartel DP, Schier AF. MicroRNAs regulate brain morphogenesis in zebrafish. Science. 2005;308:833–838. doi: 10.1126/science.1109020. [DOI] [PubMed] [Google Scholar]
- Griffiths-Jones S. miRBase: the microRNA sequence database. Methods Mol Biol. 2006;342:129–138. doi: 10.1385/1-59745-123-1:129. [DOI] [PubMed] [Google Scholar]
- Grove EA, Tole S, Limon J, Yip L, Ragsdale CW. The hem of the embryonic cerebral cortex is defined by the expression of multiple Wnt genes and is compromised in Gli3-deficient mice. Development. 1998;125:2315–2325. doi: 10.1242/dev.125.12.2315. [DOI] [PubMed] [Google Scholar]
- Hanashima C, Li SC, Shen L, Lai E, Fishell G. Foxg1 suppresses early cortical cell fate. Science. 2004;303:56–59. doi: 10.1126/science.1090674. [DOI] [PubMed] [Google Scholar]
- Hanashima C, Fernandes M, Hebert JM, Fishell G. The role of Foxg1 and dorsal midline signaling in the generation of Cajal-Retzius subtypes. J Neurosci. 2007;27:11103–11111. doi: 10.1523/JNEUROSCI.1066-07.2007. [DOI] [PMC free article] [PubMed] [Google Scholar]
- Hevner RF, Neogi T, Englund C, Daza RA, Fink A. Cajal-Retzius cells in the mouse: transcription factors, neurotransmitters, and birthdays suggest a pallial origin. Brain Res Dev Brain Res. 2003;141:39–53. doi: 10.1016/s0165-3806(02)00641-7. [DOI] [PubMed] [Google Scholar]
- John B, Enright AJ, Aravin A, Tuschl T, Sander C, Marks DS. Human MicroRNA targets. PLoS Biol. 2004;2:e363. doi: 10.1371/journal.pbio.0020363. [DOI] [PMC free article] [PubMed] [Google Scholar]
- Kapsimali M, Kloosterman WP, de Bruijn E, Rosa F, Plasterk RH, Wilson SW. MicroRNAs show a wide diversity of expression profiles in the developing and mature central nervous system. Genome Biol. 2007;8:R173. doi: 10.1186/gb-2007-8-8-r173. [DOI] [PMC free article] [PubMed] [Google Scholar]
- Kloosterman WP, Plasterk RH. The diverse functions of microRNAs in animal development and disease. Dev Cell. 2006;11:441–450. doi: 10.1016/j.devcel.2006.09.009. [DOI] [PubMed] [Google Scholar]
- Krek A, Grün D, Poy MN, Wolf R, Rosenberg L, Epstein EJ, MacMenamin P, da Piedade I, Gunsalus KC, Stoffel M, Rajewsky N. Combinatorial microRNA target predictions. Nat Genet. 2005;37:495–500. doi: 10.1038/ng1536. [DOI] [PubMed] [Google Scholar]
- Krichevsky AM, King KS, Donahue CP, Khrapko K, Kosik KS. A microRNA array reveals extensive regulation of microRNAs during brain development. RNA. 2003;9:1274–1281. doi: 10.1261/rna.5980303. [DOI] [PMC free article] [PubMed] [Google Scholar]
- Krutzfeldt J, Poy MN, Stoffel M. Strategies to determine the biological function of microRNAs. Nat Genet. 2006;38(Suppl):S14–S19. doi: 10.1038/ng1799. [DOI] [PubMed] [Google Scholar]
- Leucht C, Stigloher C, Wizenmann A, Klafke R, Folchert A, Bally-Cuif L. MicroRNA-9 directs late organizer activity of the midbrain-hindbrain boundary. Nat Neurosci. 2008;11:641–648. doi: 10.1038/nn.2115. [DOI] [PubMed] [Google Scholar]
- Lewis BP, Shih IH, Jones-Rhoades MW, Bartel DP, Burge CB. Prediction of mammalian microRNA targets. Cell. 2003;115:787–798. doi: 10.1016/s0092-8674(03)01018-3. [DOI] [PubMed] [Google Scholar]
- Lewis BP, Burge CB, Bartel DP. Conserved seed pairing, often flanked by adenosines, indicates that thousands of human genes are microRNA targets. Cell. 2005;120:15–20. doi: 10.1016/j.cell.2004.12.035. [DOI] [PubMed] [Google Scholar]
- Li Y, Wang F, Lee JA, Gao FB. MicroRNA-9a ensures the precise specification of sensory organ precursors in Drosophila. Genes Dev. 2006;20:2793–2805. doi: 10.1101/gad.1466306. [DOI] [PMC free article] [PubMed] [Google Scholar]
- Lim LP, Lau NC, Garrett-Engele P, Grimson A, Schelter JM, Castle J, Bartel DP, Linsley PS, Johnson JM. Microarray analysis shows that some microRNAs downregulate large numbers of target mRNAs. Nature. 2005;433:769–773. doi: 10.1038/nature03315. [DOI] [PubMed] [Google Scholar]
- Martynoga B, Morrison H, Price DJ, Mason JO. Foxg1 is required for specification of ventral telencephalon and region-specific regulation of dorsal telencephalic precursor proliferation and apoptosis. Dev Biol. 2005;283:113–127. doi: 10.1016/j.ydbio.2005.04.005. [DOI] [PubMed] [Google Scholar]
- Meberg PJ, Miller MW. Culturing hippocampal and cortical neurons. Methods Cell Biol. 2003;71:111–127. doi: 10.1016/s0091-679x(03)01007-0. [DOI] [PubMed] [Google Scholar]
- Mochizuki T, Karavanov AA, Curtiss PE, Ault KT, Sugimoto N, Watabe T, Shiokawa K, Jamrich M, Cho KW, Dawid IB, Taira M. Xlim-1 and LIM domain binding protein 1 cooperate with various transcription factors in the regulation of the goosecoid promoter. Dev Biol. 2000;224:470–485. doi: 10.1006/dbio.2000.9778. [DOI] [PubMed] [Google Scholar]
- Molnár Z, Métin C, Stoykova A, Tarabykin V, Price DJ, Francis F, Meyer G, Dehay C, Kennedy H. Comparative aspects of cerebral cortical development. Eur J Neurosci. 2006;23:921–934. doi: 10.1111/j.1460-9568.2006.04611.x. [DOI] [PMC free article] [PubMed] [Google Scholar]
- Muzio L, Mallamaci A. Foxg1 confines Cajal-Retzius neuronogenesis and hippocampal morphogenesis to the dorsomedial pallium. J Neurosci. 2005;25:4435–4441. doi: 10.1523/JNEUROSCI.4804-04.2005. [DOI] [PMC free article] [PubMed] [Google Scholar]
- Ørom UA, Kauppinen S, Lund AH. LNA-modified oligonucleotides mediate specific inhibition of microRNA function. Gene. 2006;372:137–141. doi: 10.1016/j.gene.2005.12.031. [DOI] [PubMed] [Google Scholar]
- Pauley S, Lai E, Fritzsch B. Foxg1 is required for morphogenesis and histogenesis of the mammalian inner ear. Dev Dyn. 2006;235:2470–2482. doi: 10.1002/dvdy.20839. [DOI] [PMC free article] [PubMed] [Google Scholar]
- Rice DS, Curran T. Role of the reelin signaling pathway in central nervous system development. Annu Rev Neurosci. 2001;24:1005–1039. doi: 10.1146/annurev.neuro.24.1.1005. [DOI] [PubMed] [Google Scholar]
- Schratt GM, Tuebing F, Nigh EA, Kane CG, Sabatini ME, Kiebler M, Greenberg ME. A brain-specific microRNA regulates dendritic spine development. Nature. 2006;439:283–289. doi: 10.1038/nature04367. [DOI] [PubMed] [Google Scholar]
- Shen Q, Wang Y, Dimos JT, Fasano CA, Phoenix TN, Lemischka IR, Ivanova NB, Stifani S, Morrisey EE, Temple S. The timing of cortical neurogenesis is encoded within lineages of individual progenitor cells. Nat Neurosci. 2006;9:743–751. doi: 10.1038/nn1694. [DOI] [PubMed] [Google Scholar]
- Takiguchi-Hayashi K, Sekiguchi M, Ashigaki S, Takamatsu M, Hasegawa H, Suzuki-Migishima R, Yokoyama M, Nakanishi S, Tanabe Y. Generation of reelin-positive marginal zone cells from the caudomedial wall of telencephalic vesicles. J Neurosci. 2004;24:2286–2295. doi: 10.1523/JNEUROSCI.4671-03.2004. [DOI] [PMC free article] [PubMed] [Google Scholar]
- Tao W, Lai E. Telencephalon-restricted expression of BF-1, a new member of the HNF-3/fork head gene family, in the developing rat brain. Neuron. 1992;8:957–966. doi: 10.1016/0896-6273(92)90210-5. [DOI] [PubMed] [Google Scholar]
- Uno K, Ueda HR. Microarrays: quality control and hybridization protocol. Methods Mol Biol. 2007;362:225–243. [PubMed] [Google Scholar]
- Vo N, Klein ME, Varlamova O, Keller DM, Yamamoto T, Goodman RH, Impey S. A cAMP-response element binding protein-induced microRNA regulates neuronal morphogenesis. Proc Natl Acad Sci U S A. 2005;102:16426–16431. doi: 10.1073/pnas.0508448102. [DOI] [PMC free article] [PubMed] [Google Scholar]
- Wilkinson DG, Nieto MA. Detection of messenger RNA by in situ hybridization to tissue sections and whole mounts. Methods Enzymol. 1993;225:361–373. doi: 10.1016/0076-6879(93)25025-w. [DOI] [PubMed] [Google Scholar]
- Xuan S, Baptista CA, Balas G, Tao W, Soares VC, Lai E. Winged helix transcription factor BF-1 is essential for the development of the cerebral hemispheres. Neuron. 1995;14:1141–1152. doi: 10.1016/0896-6273(95)90262-7. [DOI] [PubMed] [Google Scholar]
- Yoshida M, Assimacopoulos S, Jones KR, Grove EA. Massive loss of Cajal-Retzius cells does not disrupt neocortical layer order. Development. 2006;133:537–545. doi: 10.1242/dev.02209. [DOI] [PubMed] [Google Scholar]
- Zhao Y, Samal E, Srivastava D. Serum response factor regulates a muscle-specific microRNA that targets Hand2 during cardiogenesis. Nature. 2005;436:214–220. doi: 10.1038/nature03817. [DOI] [PubMed] [Google Scholar]