

Abstract
Although it is well established that parietal cortex is important in processing sensorimotor transformations, less is known about the neuronal dynamics of this process in humans. Using magnetoencephalography, we investigated the dynamics of parietal oscillatory activity during saccade planning in terms of sensory and motor goal processing. In the experiments, a peripheral stimulus was flashed in either the left or right hemifield, followed by a 1.5 s delay period, after which the subject executed a saccade toward (prosaccade) or away from (antisaccade) the stimulus. In response to stimulus presentation, we observed an initial increase in gamma-band power (40–120 Hz) in a region in the posterior parietal cortex contralateral to the direction of the stimulus. This lateralized power enhancement, which was sustained in a more narrow frequency band (85–105 Hz) during the delay period of prosaccades, mapped to the hemisphere contralateral to the direction of the saccade goal during the delay period of antisaccades. These results suggest that neuronal gamma-band synchronization in parietal cortex represents the planned direction of the saccade, not the memorized stimulus location. In the lower-frequency bands, we observed sustained contralateral alpha (7–13 Hz) power suppression after stimulus presentation in parieto-occipital regions. The dynamics of the alpha band was strongly related to the processing of the stimulus and showed only modest selectivity for the goal of the saccade. We conclude that parietal gamma-band synchronization reflects a mechanism to encode the motor goals in the visuomotor processing for saccades.
Keywords: human, MEG, oscillations, parietal cortex, saccade, sensorimotor, spatial updating
Introduction
The parietal cortex has been implicated in coding spatial memories for saccades. Human functional magnetic resonance imaging (fMRI) (Sereno et al., 2001; Medendorp et al., 2003, 2006; Schluppeck et al., 2005; Jack et al., 2007) and monkey electrophysiological (Blatt et al., 1990; Ben Hamed et al., 2001) (but see Platt and Glimcher, 1997) studies have recently revealed that these memories are coded in topographic maps storing locations of targets in the contralateral hemifield.
From a mechanistic perspective, suggestions have been made that rhythmic activity provides the neural basis for the maintenance of spatial memory representations (Tallon-Boudry et al., 1998; Pesaran et al., 2002; Ward et al., 2003; Jensen et al., 2007). Rhythmic neuronal synchronization can be measured invasively as local field potentials (LFPs), but also as electric potentials or magnetic fields on the scalp (Varela et al., 2001). Based on these measurements, it has been conjectured that oscillations in the gamma band (>30 Hz) mediate the active maintenance of a working memory (Tallon-Baudry et al., 1998; Jensen et al., 2007), whereas activity in the alpha band (7–13 Hz) reflects a regulatory mechanism disengaging areas not relevant for a given process (Jensen et al., 2002; Sauseng et al., 2005; Jokisch and Jensen, 2007; Klimesch et al., 2007; Medendorp et al., 2007) (but see Palva and Palva, 2007).
Few studies have characterized oscillatory brain activity during the memory period in delayed-saccade tasks (Okada and Salenius, 1998; Pesaran et al., 2002; Lachaux et al., 2006; Medendorp et al., 2007). Recently, Medendorp et al. (2007) reported parieto-occipital power suppression of the alpha band in the hemisphere contralateral to the stimulus. They also observed contralateral power enhancements in the gamma band (60–100 Hz), analogous to the spatially tuned gamma-band power in LFP activity observed during working memory in monkey parietal cortex (Pesaran et al., 2002). It is unclear, however, whether these parietal oscillations relate mainly to the processing of spatial sensory information or to the coding of the motor goal of the saccade.
In this study, we used a memory-guided antisaccade task to address this question. The antisaccade task dissociates sensory from motor goal representations, because it requires participants to transform the location of a stimulus into an eye movement to the opposite visual field (Hallett, 1978; Munoz and Everling, 2004). A number of studies have reported that the parietal cortex is engaged in spatial remapping for antisaccades (Everling et al., 1998; Zhang and Barash, 2000, 2004; Medendorp et al., 2005; Moon et al., 2007), but the temporal structure of human parietal activity in relation to the neural dynamics of this process has not been revealed.
We applied magnetoencephalography (MEG) to record oscillatory brain activity from human subjects instructed to plan either prosaccades or antisaccades. By exploiting the hemispheric lateralization of the power in the various frequency bands, we analyzed the time-varying aspects of sensorimotor processing during saccade planning. Our results show a dissociation between alpha and gamma power in parietal areas. Whereas an alpha-power decrease was primarily stimulus-related, a gamma-power increase was only initially stimulus-related, and subsequently corresponded to the saccade goal.
Materials and Methods
Participants.
Nineteen healthy subjects (3 female, 16 male; mean age, 26 ± 3 years), free of any known sensory, perceptual, or motor disorders, volunteered to participate in the experiment. All subjects provided written informed consent according to institutional guidelines of the local ethics committee (CMO Committee on Research Involving Human Subjects, region Arnhem-Nijmegen, The Netherlands).
MEG recordings.
Subjects were seated upright in the MEG system, which was placed in a magnetically shielded room. They were instructed to sit comfortably without moving and to look at the stimulus screen, located ∼40 cm in front of them. Visual stimuli, generated with Presentation 9.10 software (Neurobehavioral Systems), were presented using a liquid crystal display video projector (Sanyo Pro xtraX Multiverse; 60 Hz refresh rate) and back-projected onto the screen using two front-silvered mirrors. MEG data were recorded continuously using a whole-head system with 151 axial gradiometers (Omega 2000; CTF Systems). Head position with respect to the sensor array was measured using localization coils fixed at anatomical landmarks (the nasion and the left and right ear canals). These measurements were made before and after the MEG recordings to assess head movements during the experiment. In addition, horizontal and vertical electrooculograms (EOGs) were recorded using electrodes placed below and above the left eye and at the bilateral outer canthi. Electrode impedance was kept <5 kΩ. During the experiment, these recordings were continuously inspected to ensure the subject was vigilant and performed the task correctly. MEG and EOG signals were low-pass filtered at 300 Hz, sampled at 1200 Hz, and then saved to disk. Before the actual measurements, the EOG signal was calibrated using a nine-point calibration grid.
For each subject, a full-brain anatomical MR image was acquired using a standard inversion prepared three-dimensional T1-weighted scan sequence (flip angle, 15°; voxel size, 1.0 mm in-plane, 256 × 256, 164 slices; repetition time, 0.76 s; echo time, 5.3 ms). The anatomical MRIs were recorded using a 1.5 T whole-body scanner (Siemens), with anatomical reference markers at the same locations as the head position coils during the MEG recordings (see above). The reference markers allow alignment of the MEG and MRI coordinate systems, such that the MEG data can be related to the anatomical structures within the brain.
Experimental paradigm.
Subjects made delayed prosaccades and antisaccades using a block design paradigm. Prosaccade and antisaccade blocks were alternated with 10 s blocks of rest in between, during which subjects could freely move their eyes (Fig. 1). The type of upcoming saccade block (prosaccade or antisaccade) was indicated by a letter (P or A, respectively) in the center of the screen at the end of each resting block.
Figure 1.

Experimental paradigm. A, Sequence of stimuli and subject instructions. Each trial started with a baseline period of 1.5 s, during which subject was instructed to fixate a central cross. Next, a peripheral stimulus (S) was flashed (for 0.1 s), followed by a 1.5 s delay interval. Subsequently, the fixation cross was turned off, signaling the subjects to look either toward the remembered location of the stimulus on prosaccade trials or toward its mirror location in the opposite hemifield on antisaccade trials and then back to center when the fixation cross reappeared. Corresponding eye position traces [horizontal component (hor)] of one typical subject are shown. Sac, Saccade. B, Outline of the entire experiment. Subjects performed blocks of 20 consecutive prosaccade or antisaccade trials, between which a brief rest (10 s) was provided. The type of saccade (prosaccade/antisaccade) to be made was instructed before the start of each block of trials.
Each trial within a prosaccade or antisaccade block started with a subject fixating centrally on a white cross (Fig. 1A). Then, after a baseline period of 1.5 s, a peripheral white stimulus dot was flashed for 0.1 s, at a random eccentricity between 9 and 18° and at a random angular elevation within a range of −36 and 36° in either the lower or upper visual field. This was followed by a 1.5 s memory delay during which the subject maintained fixation. Subsequently, the fixation cross was turned off, instructing the subject to saccade either toward the remembered location of the stimulus in prosaccade trials or toward its mirror location (relative to the fixation point) in the opposite hemifield during antisaccade trials. Then, 0.3 s later, the central fixation cross was turned on again, instructing the subject to fixate at the center of the screen until the end of the trial. We purposely used a short time interval between the task-related saccade and the return saccade to maximize the number of trials performed during the experiment, and hence to achieve maximal statistical power in the study.
The paradigm had four different conditions: a prosaccade to a right hemifield stimulus (PR), an antisaccade on a right hemifield stimulus (AR), a prosaccade to a left hemifield stimulus (PL), and an antisaccade on a left hemifield stimulus (AL). Each trial lasted 4 s. Each block consisted of 20 trials, with 10 left and 10 right hemifield stimulus locations pseudorandomly interleaved (Fig. 1B). In total, there were 15 blocks for each condition resulting in a final number of 600 trials, lasting ∼45 min.
Behavioral analysis.
Eye movements were recorded in all subjects. An example of the eye traces (horizontal component) of a typical subject during the pro-left condition and anti-left condition is shown in Figure 1A in relation to the temporal order of events. As shown, this subject maintained fixation during the baseline period, the presentation of the stimulus, and the memory interval, and made eye movements in the correct directions after the fixation spot was turned off. Eye movement recordings in all 19 subjects confirmed that, in most trials, they followed the instructions correctly. Trials in which subjects broke fixation, made saccades in the wrong direction, or blinked the eyes during the trial were excluded from further analysis. For the remaining trials, it was assumed that subjects had retained a veridical spatial representation during the memory interval, because their saccades landed close to (or on) the ideal spot. On average 472 ± 73 (SD) trials were incorporated in the analysis of each participant. Furthermore, reaction times for antisaccades (214 ± 74 ms, mean ± SD) and prosaccades (212 ± 72 ms) were not significantly different (t test, p = 0.52), which is consistent with previous results using a similar paradigm (Medendorp et al., 2005).
MEG data analysis.
Data were analyzed using Fieldtrip software (http://www.ru.nl/fcdonders/fieldtrip), an open-source Matlab toolbox for neurophysiological data analysis developed at the F. C. Donders Centre for Cognitive Neuroimaging. From the trials that survived the exclusion criteria described above, data segments that were contaminated with muscle activity or jump artifacts in the SQUIDs (superconducting quantum interference devices) were excluded using semiautomatic artifact rejection routines.
For the sensor level analysis, an estimate of the planar gradient was calculated for each sensor using the signals from the neighboring sensors (Bastiaansen and Knosche, 2000). The horizontal and vertical components of the planar gradients approximate the signal measured by MEG systems with planar gradiometers. The planar field gradient simplifies the interpretation of the sensor-level data, because the maximal signal is located above the source (Hämäläinen et al., 1993). Power spectra were computed separately for the horizontal and vertical planar gradients of the MEG field at each sensor location, and the sum of both was computed to obtain the power at each sensor location regardless of the orientation of the gradient.
Time–frequency representations (TFRs), estimating the time course in power, were computed using a Fourier approach, applying a sliding tapered window. Because the gamma band is typically much wider and more variable across subjects than the alpha band (Hoogenboom et al., 2006), we analyzed two frequency ranges separately: 3–30 and 30–120 Hz. For the lower-frequency band (3–30 Hz), we applied a fixed time window of 0.5 s and a Hanning taper. This resulted in a spectral smoothing of ∼3 Hz. For the higher-frequency band (30–120 Hz), we applied a multitaper approach (Percival and Walden, 1993) using a fixed window length of 0.4 s and 11 orthogonal Slepian tapers. This resulted in a spectral smoothing of ∼15 Hz.
We examined the task-related changes in power in various frequency bands relative to average power in the baseline periods (Fig. 1). The baseline power was computed over a time window (0.5 and 0.4 s for the lower- and higher-frequency bands, respectively) centered 0.3 s before the presentation of the stimulus. Using a jackknife procedure (Efron and Tibshirani, 1993), we determined the variance of the power in the selected frequency bands across trials. Using these estimates, we expressed the difference in power between the memory period and the baseline as a t-score for each subject and for each condition. The resulting t-scores were transformed into z-scores (Medendorp et al., 2007) to obtain a normalized power estimate. Using these values, the directional selectivity in the various frequency bands was examined by comparing the power in each sensor for stimuli in the contralateral and ipsilateral hemifield. The resulting z-scores, which are well normalized for intrasubject variance, were pooled across subjects (, with zi being the z-score of the ith subject). Groups of sensors of interest (see Figs. 2C, 3C, middle) were selected based on their response to visual stimuli [as in Medendorp et al. (2007)].
Figure 2.

The human posterior parietal cortex shows directional-selective gamma-band activity during the planning of prosaccades. A, B, Time–frequency-resolved power changes relative to baseline (left and right) of the PL and PR conditions for the sensors marked (by asterisks) in the central panels, which show the topographic distribution of power in the 40–120 Hz frequency range, averaged across subjects during the first 0.5 s after stimulus presentation. Warmer (red) colors, Power increase with respect to baseline; cooler (blue) colors, power decrease. Time t = 0 s, Onset of the visual stimulus; t = 1.6 s, go-cue for the saccade. C, Directional selectivity (DP) of time–frequency-resolved gamma-band power during prosaccades for the sensors marked in the central panel. Left hemisphere, PR − PL; right hemisphere, PL − PR. Warmer (red) colors, Preference for stimuli in the contralateral hemifield; cooler (blue) colors, bias toward ipsilateral stimuli. D, Directional selectivity in the higher-frequency bands pooled across hemispheres. Color format is as in C.
Figure 3.

The contralateral-selective gamma-band activity over human posterior parietal cortex encodes the direction of the saccade during delayed antisaccades. Data are in the same format as Figure 2. A, B, Time–frequency representations of power in the AL and AR conditions relative to baseline. Selected sensors are marked in the central panels, which show the stimulus-evoked topography during the antisaccade trials. C, Directional selectivity (DA) of time–frequency-resolved gamma-band power during antisaccades for the sensors marked in the central panel. Left hemisphere, AR − AL; right hemisphere, AL − AR. D, Time–frequency representation using a pooled comparison across hemispheres.
Statistical significance was tested at the sensor level, using a nonparametric permutation test across subjects. Z-scores representing the contrast between the conditions were computed for each subject within the predefined channel-frequency-time window of interest, resulting in a single number per subject. Subsequently, the significance at the group level was assessed by pooling the z-scores over all subjects. Testing the probability of this pooled z-score against the standard normal distribution would correspond to a fixed effect statistic. To be able to make statistical inference corresponding to a random effect statistic, we tested the significance of this group-level statistic by means of a randomization procedure. We randomly multiplied each individual z-score by 1 or by −1 and summed it over subjects. Multiplying the individual z-score with +1 or −1 corresponds to permuting the original conditions in that subject. This random procedure was repeated 1000 times to obtain the randomization distribution for the group-level statistic. The proportion of values in the randomization distribution exceeding the test statistic defined the Monte Carlo significance probability, which is also called a p value (Nichols and Holmes, 2002; Maris and Oostenveld, 2007).
We defined the time interval of the sensory response from 0.1 to 0.6 s after stimulus onset. The retention period was defined from 0.6 to 1.6 s after the presentation of the stimulus and excludes the initial sensory response. We chose our frequency ranges of interest to be 7–13 Hz for the alpha band and 70–120 Hz for the gamma band. These frequency ranges are compatible with previous reports on oscillatory activity in human saccade planning (Lachaux et al., 2006; Medendorp et al., 2007).
To localize the neural sources of the different spectral components, we applied an adaptive spatial filtering or beamforming technique [dynamic imaging of coherent sources (Gross et al., 2001; Liljeström et al., 2005)]. Each subject's brain volume was divided into a regular 1 cm three-dimensional grid. For each grid point, a spatial filter was constructed that passes activity from this location with unit gain, while attenuating activity from other locations (Van Veen et al., 1997). This filter was computed from forward models with respect to dipolar sources at each grid point (the leadfield matrix) and the cross-spectral density between all combinations of sensors at the frequency of interest (Nolte, 2003). We used a multispherical volume conductor model to compute the leadfield matrix by fitting a sphere to the head surface underlying each sensor (Huang and Mosher, 1997). The head shape was derived from each individual structural MRI. As for the sensor data, we computed the power changes at the selected frequency bands for each subject. Using these power estimates, we calculated the z-statistic to express the power effects across subjects at the source level.
Using SPM2 (http://www.fil.ion.ucl.ac.uk/spm), the individual anatomical MRIs and the corresponding statistical maps were spatially normalized to the International Consortium for Brain Mapping template (Montreal Neurological Institute, Montreal, Canada). The individual spatially normalized statistical maps were subsequently averaged to get an estimate of the location of the sources producing the effect in the various frequency bands.
Results
We investigated the time-varying directional selectivity of power in the various frequency bands during saccade planning. Subjects were tested in four different conditions: either a delayed prosaccade or a delayed antisaccade in response to a visual stimulus presented either in the left or right visual hemifield (see Materials and Methods). We exploited the hemifield-specific lateralization of power during the memory period to discriminate representations of visual sensory information (stimulus location) and representation of motor goal information (saccade direction).
Sustained parietal gamma activity contralateral to the stimulus during prosaccades
We first present the results of the higher frequencies for the two prosaccade conditions, PL and PR. Figure 2, A and B (middle), plots the scalp topography of the power changes in these conditions relative to baseline (Fig. 1), averaged across 40–120 Hz and time 0.1–0.6 s after stimulus offset. Regions with warmer (red) colors indicate an increase of power relative to baseline, whereas regions with cooler (blue) color reflect a decrease of gamma-band power. Both topographies show a clear increase of gamma-band power in the contralateral hemisphere, most prominently over the parietal areas. Based on the strongest induced gamma and previous reports (Medendorp et al., 2007), we selected two symmetric subsets of posterior sensors (marked by asterisks) for further spectral analysis. The left and right panels of Figure 2, A and B, show the time–frequency representations of the power changes in the higher-frequency band (30–120 Hz) for these posterior sensors in the left and right hemisphere, respectively. Time t = 0 s denotes the onset of the visual stimulus, and t = 1.6 s denotes the go-cue for the saccade. As shown, in both hemispheres, the selected sensors show strong enhancements in gamma-band power in response to contralateral stimuli, in the range of 40–120 Hz. These enhancements are followed by weak power changes relative to baseline during the delay periods.
Next, to determine the directional selectivity of the power in the gamma band, we compared the power for prosaccades to stimuli in the contralateral and ipsilateral visual field (referred to as DP), separately for each hemisphere. In other words, for sensors in the left hemisphere, we subtracted activity for a stimulus in the left visual field from the activity for a stimulus in the right visual field (DP = PR − PL), and vice versa for sensors overlying the right hemisphere (DP = PL − PR). Figure 2C (middle) shows the scalp topography of these power changes, averaged across 40–120 Hz and time 0.1–0.6 s after stimulus onset. Note that, in this color format, regions with warmer (red) colors indicate a preference for the stimuli in the contralateral hemifield; regions with cooler color (blue) show a bias toward ipsilateral stimuli. As shown, in both posterior hemispheres, there is a clear gamma-power increase with respect to stimuli presented in the contralateral hemifield. Figure 2C (left and right) shows the time–frequency representations of the power differences (for contralateral minus ipsilateral stimulus locations) in the higher-frequency band (30–120 Hz) for the selected posterior sensors in the left and right hemispheres, respectively. The TFRs revealed a broad-band power increase (40–120 Hz) after the stimulus. This was followed by a narrower band of sustained gamma activity (85–105 Hz) in the rest of the delay period, which was stronger over the left hemisphere.
Finally, based on the symmetry of these panels, the spectrograms were pooled across hemispheres, resulting in the combined hemisphere-specific changes in power for prosaccades with respect to contralateral versus ipsilateral stimuli (Fig. 2D). In response to the stimulus, the parietal sensors showed a significant increase in power for contralateral stimulus locations across the 40–120 Hz frequency range. This is consistent with the scalp topography in Figure 2C. This selectivity was maintained within a narrower frequency band (85–105 Hz) during the delay interval (0.6–1.6 s), where the gamma activity became more prevalent before the initiation of the saccade. A nonparametric randomization test (see Materials and Methods) over the time–frequency window from 0.6 to 1.6 s and 85 to 105 Hz (indicated in Fig. 2) revealed the significance of this effect (p < 0.05).
Sustained gamma-band activity reflects stimulus-to-goal mapping during antisaccades
The key question here is what aspect of sensorimotor processing is encoded in the gamma band of this bilateral source during the delay period. Does the observed lateralized power during the memory period reflect the maintenance of the visual stimulus or rather the representation of the goal for the pending saccade?
Obviously, the results of the prosaccade trials cannot answer this question, because they do not discriminate the location of the stimulus from the goal of the saccade. However, the antisaccade trials allow us to address this question: in these trials, the coordinates of the visual stimulus must be mirrored to specify the goal of the saccade. If the observed parietal gamma-band power reflects the outcome of this process, we would expect the selectivity to reverse from contralateral to ipsilateral tuning after presentation of the stimulus to represent the saccade goal (Zhang and Barash, 2004; Medendorp et al., 2005). However, if the gamma activity in parietal cortex encodes a visual memory representation, we would not expect a difference in the directional selectivity of power during the delays of prosaccade and antisaccade trials in response to the same visual stimulus.
Figure 3 presents the power in the gamma band for the antisaccade conditions, AL and AR, in the same format as Figure 2, using the same group of sensors. Figure 3, A and B, shows the power differences of these conditions relative to baseline; Figure 3C plots the power differences between the conditions in terms contralateral and ipsilateral stimulus locations (referred to as DA). Focusing on the latter (DA), the TFRs of both hemispheres (Fig. 3C, left and right) show a transient response after stimulus presentation, which is biased toward the contralateral hemifield, as for prosaccades. The topography of the stimulus-evoked gamma power (Fig. 3C, middle) is similar to that of the prosaccades (Fig. 2C). However, in contrast to the prosaccades, this contralateral selectivity vanishes quickly, and a significant bias in power (p < 0.05) toward the ipsilateral field emerges during the delay interval, at a frequency range of 85–105 Hz. This can be seen more clearly in the pooled spectrogram (Fig. 3D), showing that the ipsilateral bias arises at ∼500 ms after stimulus onset. Because ipsilateral visual cues define contraversive movements during antisaccades, this reversal should be interpreted as a remapping from stimulus-to-goal selectivity in the memory interval. In other words, the dynamic shift observed in the 85–105 Hz band represents a transition from a visual stimulus representation (or a default stimulus-defined response) to a motor goal representation during the course of an antisaccade trial. This suggests that directional selectivity of gamma-band power in parietal cortex represents target locations for upcoming movements, rather than remembered locations of visual stimuli.
To test whether the time of switching toward the motor goal changed during the course of the experiment, we split the antisaccade trials into first and second halves. We then compared the respective spectrograms of the first and second halves, which revealed no significant difference in the time of the reversal (p > 0.05). This suggests that the switch for the saccade goal did not develop over time in our testing conditions.
Sustained gamma activity encodes the goal of the saccade
Thus, in the simplest terms, the results indicate contributions from two main processes to hemispheric gamma-band selectivity during the planning of a saccade: an initial coding of visual sensory information (stimulus component) and a later representation of motor goal information (goal component). To separate the stimulus from the motor goal component, we decomposed the differential prosaccade and antisaccade activities (DP and DA) by assuming that they have the same stimulus (S) component (same sensory stimulation) and opposite goal (G) components (opposite saccade directions). Based on these assumptions, the prosaccade and antisaccade selectivities equal DP = S + G and DA = S − G. Hence, the stimulus and goal components can easily be derived following, respectively, S = (DP + DA)/2 and G = (DP − DA)/2.
Figure 4 presents the results of this decomposition analysis. The top panel depicts the reconstructed stimulus component (S), whereas the bottom panel shows the goal (G) component. As the figure suggests, there is a broad-band transient stimulus-induced component (Fig. 4A), lasting for <0.6 s. There was no evidence for sustained gamma activity reflecting a persisting stimulus representation (p > 0.3). The goal component (Fig. 4B), however, showed a significant (p < 0.05) sustained component (85–105 Hz) during the entire delay interval, increasing in strength toward the execution of the saccade. Thus, there seems to be a full dissociation: the sustained gamma-band selectivity encodes the goal of a saccade and not the memory representation of the previous visual stimulus.
Figure 4.

Decomposition of gamma-band activity in stimulus and saccade goal components. A, Stimulus component. B, Motor goal component. The color code represents the difference in power between contralateral and ipsilateral stimulus locations (in A)/saccade goals (in B).
Source underlying cue-to-goal mapping in the posterior parietal cortex
We used spatial filtering techniques to estimate the sources underlying the gamma-band dynamics identified at the parietal sensors. Figure 5 present these results, using the pooled activity across hemispheres (thresholded at |z| > 1), on a rendered representation of a standardized left hemisphere. The left panels represent the early (0.1–0.6 s) stimulus-induced broad-band (40–120 Hz) gamma activity, whereas the right panels show the activity during the late delay period (1.1–1.6 s) at the 85–105 Hz band. For the prosaccade and antisaccade conditions (Fig. 5A,B, left), the early stimulus-induced broad-band gamma-band activity originates from occipital and posterior parietal regions, with the peak in the occipital cortex. Figure 5C (left) further validates this as stimulus-driven activity by showing that virtually the same source gives rise to the stimulus component in the decomposition analysis.
Figure 5.
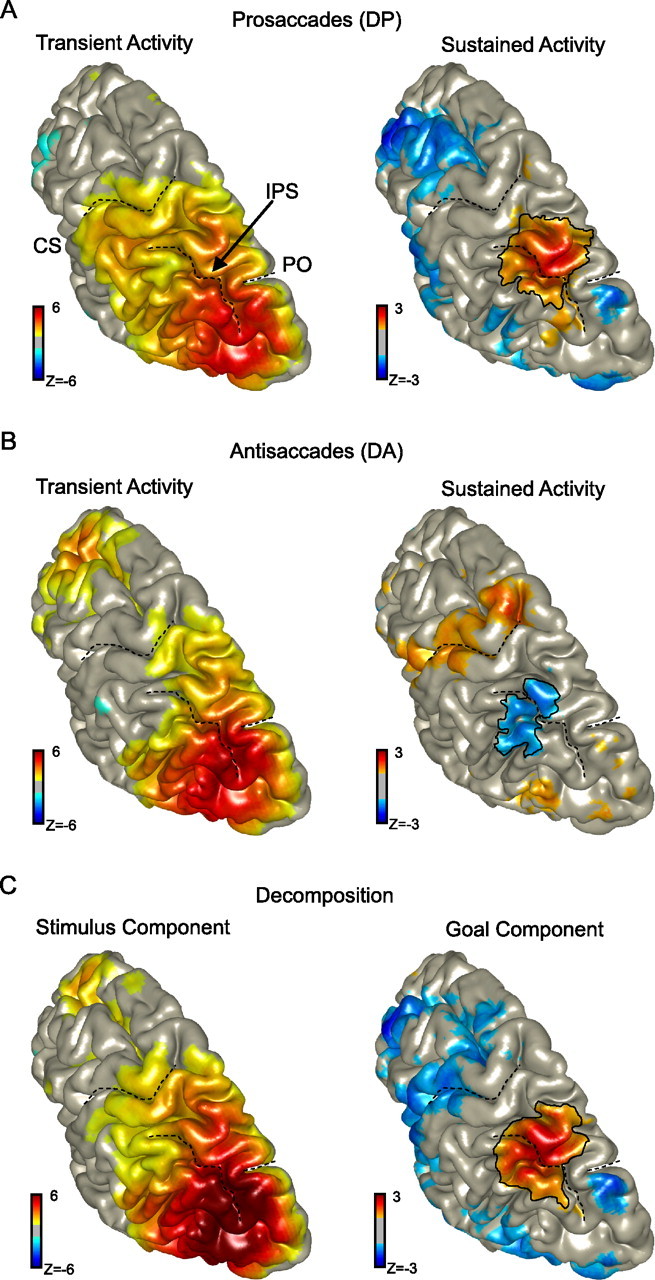
Source reconstructions of gamma-band activity. A, Source of directionally selective gamma-band power during prosaccades (DP). The broad-band (40–120 Hz; 0.1–0.6 s) stimulus-related source is located in occipitoparietal regions (left). The source of the narrow-band (85–105 Hz) gamma activity during the memory period (0.6–1.6 s) is in posterior parietal cortex (right). CS, Central sulcus; IPS, intraparietal sulcus; PO, parieto-occipital sulcus. B, Source of directionally selective gamma-band power during antisaccades (DA). Parieto-occipital regions respond to the stimulus at first (left) as for prosaccades. During the delay period, a region in the posterior parietal cortex shows selectivity in the 85–105 Hz frequency range for ipsilateral stimulus locations, which is consistent with the coding of contraversive saccades (right). C, Source reconstructions of the stimulus and goal components based on the decomposition analysis. In all plots, the source activity was pooled across hemispheres, thresholded at |z| > 1, and shown on a standard left hemisphere. Color format is as in the corresponding TFRs.
In contrast, the source of the sustained directionally selective gamma-band activation was found merely in a smaller region in the posterior parietal cortex, for both prosaccades and antisaccades (Fig. 5A,B, right). Importantly, the parietal source that underlies the sustained gamma response during antisaccades is almost identical to the neural locus coding the sustained response during prosaccades (represented by blue because contralateral minus ipsilateral gamma power is illustrated). This is confirmed by the locus of activity that represents the goal component (Fig. 5C, right), as reconstructed by the decomposition analysis. The peak of this activity was found in the superior parietal lobe, medially from the intraparietal sulcus. This is in line with previous fMRI studies showing regions with a topographic organization for saccades at similar locations in parietal cortex (Sereno et al., 2001; Medendorp et al., 2003; Schluppeck et al., 2005).
Contralateral alpha-band suppression during prosaccades and antisaccades
We also investigated the activation in the lower-frequency band (3–30 Hz) using the same group of parietal sensors as used in the high-frequency analysis (marked in Figs. 2, 3). The results, expressed as a z-score, are shown in Figure 6, in a pooled comparison across hemispheres. The color code represents the difference in power for contralateral versus ipsilateral stimuli. First, in the theta range, at ∼5 Hz, a significant contralateral transient enhancement of activity can be discerned in response to the stimulus in both saccade conditions (prosaccade/antisaccade, p < 0.05). Visual stimulation typically evokes responses that are time locked to visual onset and, in spectral analysis, primarily contain power components in the theta range. The parietal sensors further show clear contralateral reduction in the alpha (7–13 Hz) and the beta (13–25 Hz) bands. The beta-band reduction is only transient, in both conditions, which is also most likely a marker of sensory processing.
Figure 6.

Time–frequency-resolved power in the lower-frequency band in a pooled comparison across hemispheres. A, Prosaccades. B, Antisaccades. Data are from sensors marked in Figures 2A and 3A. Blue regions indicate a stronger suppression for remembered target locations in the contralateral hemifield and vice versa for red regions.
In contrast, in the alpha band, the transient responses are followed by a sustained suppression in the prosaccade condition (Fig. 6A). For antisaccades, the contralateral suppression effect in the alpha band seems to be less sustained, but does not reverse (Fig. 6B). In other words, in contrast to the gamma-band results, the alpha band seems not so much related to the processing of the saccade goal, but is more related to coping with the sensory information.
The sensory bias of the alpha-band power is further emphasized in Figure 7, by means of the decomposition analysis, like above. Undeniably, the alpha band is suppressed in relation to the stimulus location for the most part of the trial interval (Fig. 7A). The analysis does show a significant alpha suppression in relation to the direction of the saccade, but only emerging in a 0.5 s period before the go-cue of the saccade (p < 0.05). Thus the alpha band shows a general decrease during memory-guided prosaccades and antisaccades, reflecting an ongoing sustained stimulus representation and a late but modest build-up of the goal representation for the saccade (Fig. 7B). Using spatial filtering techniques, we located the sensory component in extrastriate brain regions, as a widespread pattern that extended from close to the intraparietal and parieto-occipital sulcus into anterior occipital cortex (Fig. 7C).
Figure 7.
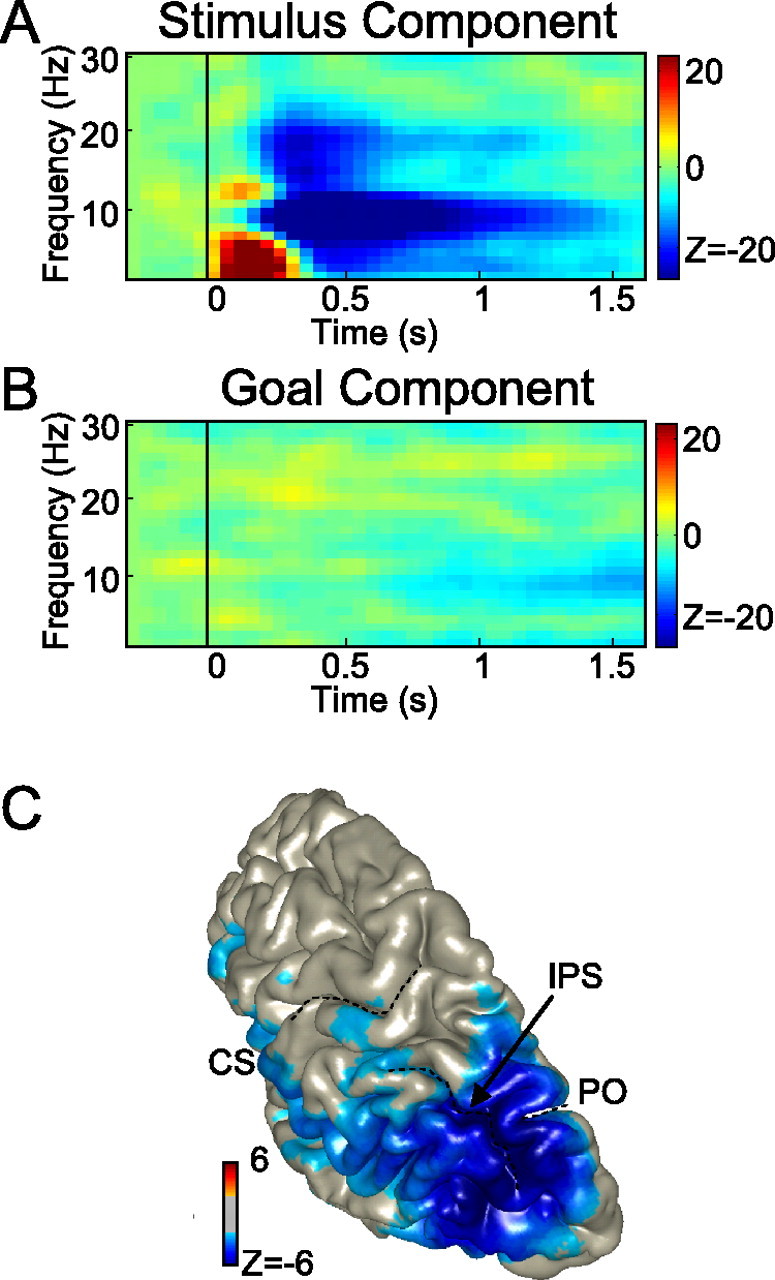
Decomposition of lower-frequency activity in stimulus and saccade goal components. A, Stimulus component. B, Motor goal component. C, Source of the stimulus component in the alpha band (7–13 Hz), reconstructed from the 0.5 s period after stimulus presentation, shown on a standard left hemisphere (thresholded at |z| > 2). The color code represents the difference in power between contralateral and ipsilateral stimulus locations (in A)/saccade goals (in B). CS, Central sulcus; IPS, intraparietal sulcus; PO, parieto-occipital sulcus.
Discussion
We studied the dynamics of oscillatory activity in parietal cortex during saccade planning. The starting point of our investigation was the hemisphere-specific contralateral selectivity of spectral power in various frequency bands during memory-guided prosaccades, consistent with previous reports (Pesaran et al., 2002; Medendorp et al., 2007). The novelty of the present study lies in the use of a memory-guided antisaccade task to distinguish this spectral activity in components related to sensory processing and those reflecting a motor goal representation. Our main finding is that gamma-band synchronization in posterior parietal cortex encodes the upcoming motor goal, whereas alpha-band desynchronization in parieto-occipital regions is linked predominantly to the processing of the stimulus that defines that goal.
Our findings suggest that the oscillations in the alpha and gamma frequency bands subserve different functions in visuomotor processing for saccades. As Figure 4 shows, stimulus processing in the gamma band is terminated at 0.5 s, and then there is a complete goal representation of the pending saccade during the rest of the delay period, increasing in strength closer to saccade execution. The delay-period activity in the alpha band is most consistent with a long-lived stimulus-driven component superimposed on a later representation of the goal of the saccade (Figs. 6, 7). Thus, compared with the gamma band, the changes in the alpha band demonstrated a much slower time course. This argues against a strong coupling between gamma-band and alpha-band mechanisms in terms of their functions (Jokisch and Jensen, 2007). The quasistatic desynchronization of the alpha band during antisaccades would be consistent with a general regulatory mechanism, allocating resources for processing sensory information without actually encoding this information (Worden et al., 2000; Kelly et al., 2006; Thut et al., 2006; Medendorp et al., 2007).
The full dissociation of the gamma-band selectivity in terms of representing the goal of the upcoming saccade and not the previous stimulus location is consistent with a recent neuroimaging study by Medendorp et al. (2005). Using event-related fMRI, they demonstrated a full interhemispheric shift of blood oxygenation level-dependent (BOLD) activity during target remapping in memory-delayed antisaccades. In this respect, our findings compare well with recent observations showing a close correlation between gamma-band activity and BOLD signals in simultaneous neural and hemodynamic recordings (Logothetis et al., 2001; Niessing et al., 2005).
Recently, Zhang and Barash (2000, 2004) recorded from neurons in the monkey lateral intraparietal (LIP) area during a memory-delayed saccade task. In their paradigm, they cued stimulus and saccade type (prosaccade/antisaccade) simultaneously, which is slightly different from the present study in which saccade type was instructed in advance of the visual stimulus. Nevertheless, the observed effects in the gamma-band are consistent with their findings that the stimulus direction is remapped in monkey LIP to code the goal of an antisaccade. Furthermore, of all the neurons that remapped, Zhang and Barash (2000, 2004) reported an average inversion time of ∼400 ms, although individual neurons could remap within 50 ms. In Figure 4 we suggest an inversion time of ∼500 ms, which is fairly close to their population average. Other human studies on the time course of event-related potentials or fields during nondelayed antisaccades reported much shorter reversal times, i.e., in the order of ∼100 ms (Everling et al., 1998; Moon et al., 2007). Evidently, the delayed antisaccade paradigm as such provides no incentive for subjects to invert the stimulus location directly after its onset. This could explain the relatively long average inversion time, although there was also clear, but weaker, goal-related activity preceding this time, as shown by Figure 4B. Conversely, studies that do not impose a delay between the visual stimulus and the antisaccade response may observe not only remapping effects but also effects of other processes involved in saccade generation (Moon et al., 2007).
Importantly, Zhang and Barash (2004) observed the remapping effect in only 60% of the neurons in the recorded population. They also found neurons that coded consistently the location of the stimulus as well as neurons that exclusively encoded the movement goal. In contrast, the present human study, and the decomposition analysis in particular (Fig. 4), clearly shows that the goal for a saccade is represented in the parietal gamma-band activity and not the memory of the visual stimulus. One potential reason for this difference is that Zhang and Barash (2004) made their claims based on neuronal firing rates. We may have probed a more distinct cognitive variable coded within this activity across a neural population by unraveling some of the temporal structure as sustained power in a narrow high-frequency band (the gamma band). In this respect, the oscillatory activity adds information complementary to the information present in the firing rates. Our data suggest that parietal neurons synchronize their activity at gamma-band frequencies to set up saccade plans, much like neurons in visual cortex synchronize to facilitate the encoding of stimulus features (Gray and Singer, 1989; Fries et al., 2001) (but see Thiele and Stoner, 2003).
The present results also speak to the long-standing debate in the literature whether the posterior parietal cortex is more important for spatial attention or motor intention (Colby and Goldberg, 1999; Andersen and Buneo, 2002; Konen et al., 2007). In our study, we did not explicitly control spatial attention, only the movements of the eyes. Clearly, during the planning of an antisaccade, subjects will first attend to the stimulus and then shift and maintain their attention to the opposite location (Rizolatti et al., 1987). Hence, one could argue that the dynamic update of gamma-band activation that we found could simply represent a shift of spatial attention in the processing of antisaccades. However, an explanation by attentional processes alone falls short in accounting for why gamma-band power would increase in strength closer toward the execution of the saccade (Fig. 4). This observation seems more consistent with a motor planning effect. Our recent study on gamma-band activity in parietal cortex during delayed double-step saccades provides also support for the motor intention explanation (Medendorp et al., 2007). In this study, we asked subjects to remember the locations of two sequentially flashed targets (each followed by a 2 s delay) and then make saccades to the two locations in sequence. Although both delay periods require sensory attention and memory, we found spatially tuned sustained gamma-band selectivity only in the second delay period, in relation to the intention to perform the saccades (Medendorp et al., 2007).
Furthermore, along with the posterior parietal cortex, it is also widely accepted that the intention to make a saccade heavily involves the frontal eye fields (FEFs) (for review, see Munoz and Everling, 2004). Indeed, using intracranial recordings in patients, Lachaux et al. (2006) have shown increased gamma-band power during prosaccades and antisaccades in the human FEF. In the present study, we did not observe a reliable gamma-band source in this region. This should, however, not be taken as evidence against the involvement of the FEF. It is known that null findings in MEG could result from several factors. For example, field cancellation caused by differently oriented sources could attenuate frontal gamma activity.
Thus, our results suggest that parietal gamma-band synchronization reflects a mechanism to encode and amplify the saccade goals in the visuomotor system. What would be the further purpose of such dynamic memory fields related to motor intention? A possible explanation is that neurons that synchronize their activity, especially at higher frequencies, have a stronger effect on downstream areas (Tiesinga et al., 2004; Jensen et al., 2007). More specifically, in the oculomotor network, synchrony may facilitate communication between parietal and frontal regions such as the frontal and supplementary eye fields. In light of our results, the gamma-band synchronization of neurons in the parietal fields may strengthen their projection to downstream regions, providing a putative mechanism to carry along unique spatial and motor information.
In future work, it would be interesting to characterize the functional interactions between the present parietal area and other areas within the oculomotor network, e.g., by means of a coherence analysis. Recent fMRI studies found that the type of representational codes that are being maintained in working memory bias frontal–parietal interactions (Curtis et al., 2005; Miller et al., 2005). Whether this effective connectivity in the oculomotor network is mediated mechanistically by gamma-band synchronization must await further studies.
Footnotes
This work was supported by The Netherlands Organization for Scientific Research Grants 864.03.007 (O.J.), 452-03-344 (P.F.), 400-04-186 (W.P.M.), and 452-03-307 (W.P.M.); a European Young Investigator Award by the European Science Foundation (P.F.); Volkswagen Foundation Grant I/79876 (P.F., O.J.); and the Human Frontier Science Program (W.P.M.).
References
- Andersen RA, Buneo CA. Intentional maps in posterior parietal cortex. Annu Rev Neurosci. 2002;25:189–220. doi: 10.1146/annurev.neuro.25.112701.142922. [DOI] [PubMed] [Google Scholar]
- Bastiaansen MC, Knösche TR. Tangential derivative mapping of axial MEG applied to event-related desynchronization research. Clin Neurophysiol. 2000;111:1300–1305. doi: 10.1016/s1388-2457(00)00272-8. [DOI] [PubMed] [Google Scholar]
- Ben Hamed S, Duhamel JR, Bremmer F, Graf W. Representation of the visual field in the lateral intraparietal area of macaque monkeys: a quantitative receptive field analysis. Exp Brain Res. 2001;140:127–144. doi: 10.1007/s002210100785. [DOI] [PubMed] [Google Scholar]
- Blatt GJ, Andersen RA, Stoner GR. Visual receptive field organization and cortico-cortical connections of the lateral intraparietal area (area LIP) in the macaque. J Comp Neurol. 1990;299:421–445. doi: 10.1002/cne.902990404. [DOI] [PubMed] [Google Scholar]
- Colby CL, Goldberg ME. Space and attention in parietal cortex. Annu Rev Neurosci. 1999;22:319–349. doi: 10.1146/annurev.neuro.22.1.319. [DOI] [PubMed] [Google Scholar]
- Curtis CE, Sun FT, Miller LM, D'Esposito M. Coherence between fMRI time-series distinguishes two spatial working memory networks. Neuroimage. 2005;26:177–183. doi: 10.1016/j.neuroimage.2005.01.040. [DOI] [PubMed] [Google Scholar]
- Efron B, Tibshirani RJ. Boca Raton, FL: Chapman and Hall/CRC; 1993. An introduction to the bootstrap. [Google Scholar]
- Everling S, Spantekow A, Krappmann P, Flohr H. Event-related potentials associated with correct and incorrect responses in a cued antisaccade task. Exp Brain Res. 1998;118:27–34. doi: 10.1007/s002210050252. [DOI] [PubMed] [Google Scholar]
- Fries P, Schröder JH, Roelfsema PR, Singer W, Engel AK. Oscillatory neuronal synchronization in primary visual cortex as a correlate of stimulus selection. J Neurosci. 2002;22:3739–3754. doi: 10.1523/JNEUROSCI.22-09-03739.2002. [DOI] [PMC free article] [PubMed] [Google Scholar]
- Gray CM, Singer W. Stimulus-specific neuronal oscillations in orientation columns of cat visual cortex. Proc Natl Acad Sci U S A. 1989;86:1698–1702. doi: 10.1073/pnas.86.5.1698. [DOI] [PMC free article] [PubMed] [Google Scholar]
- Gross J, Kujala J, Hämäläinen M, Timmermann L, Schnitzler A, Salmelin R. Dynamic imaging of coherent sources: Studying neural interactions in the human brain. Proc Natl Acad Sci U S A. 2001;98:694–699. doi: 10.1073/pnas.98.2.694. [DOI] [PMC free article] [PubMed] [Google Scholar]
- Hallett PE. Primary and secondary saccades to goals defined by instructions. Vision Res. 1978;18:1279–1296. doi: 10.1016/0042-6989(78)90218-3. [DOI] [PubMed] [Google Scholar]
- Hämäläinen M, Hari R, Ilmoniemi RJ, Knuutila J, Lounasmaa OV. Magnetoencephalography—theory, instrumentation, and applications to noninvasive studies of the working human brain. Rev Mod Phys. 1993;65:413–497. [Google Scholar]
- Hoogenboom N, Schoffelen JM, Oostenveld R, Parkes LM, Fries P. Localizing human visual gamma-band activity in frequency, time and space. Neuroimage. 2006;29:764–773. doi: 10.1016/j.neuroimage.2005.08.043. [DOI] [PubMed] [Google Scholar]
- Huang M, Mosher JC. A novel head model for the MEG forward problem: BEM accuracy with only spherical model complexity. Third International Conference on Functional Mapping of the Brain; May; Copenhagen, Denmark. 1997. Paper presented at. [Google Scholar]
- Jack AI, Patel GH, Astafiev SV, Snyder AZ, Akbudak E, Shulman GL, Corbetta M. Changing human visual field organization from early visual to extra-occipital cortex. PLoS ONE. 2007;2:e452. doi: 10.1371/journal.pone.0000452. [DOI] [PMC free article] [PubMed] [Google Scholar]
- Jensen O, Gelfand J, Kounios J, Lisman JE. Oscillations in the alpha band (9–12 Hz) increase with memory load during retention in a short-term memory task. Cereb Cortex. 2002;12:877–882. doi: 10.1093/cercor/12.8.877. [DOI] [PubMed] [Google Scholar]
- Jensen O, Kaiser J, Lachaux JP. Human gamma-frequency oscillations associated with attention and memory. Trends Neurosci. 2007;30:317–324. doi: 10.1016/j.tins.2007.05.001. [DOI] [PubMed] [Google Scholar]
- Jokisch D, Jensen O. Modulation of gamma and alpha activity during a working memory task engaging the dorsal or ventral stream. J Neurosci. 2007;27:3244–3251. doi: 10.1523/JNEUROSCI.5399-06.2007. [DOI] [PMC free article] [PubMed] [Google Scholar]
- Kelly SP, Lalor EC, Reilly RB, Foxe JJ. Increases in alpha oscillatory power reflect an active retinotopic mechanism for distracter suppression during sustained visuospatial attention. J Neurophysiol. 2006;95:3844–3851. doi: 10.1152/jn.01234.2005. [DOI] [PubMed] [Google Scholar]
- Klimesch W, Sauseng P, Hanslmayr S. EEG alpha oscillations: the inhibition-timing hypothesis. Brain Res Rev. 2007;53:63–88. doi: 10.1016/j.brainresrev.2006.06.003. [DOI] [PubMed] [Google Scholar]
- Konen CS, Kleiser R, Bremmer F, Seitz RJ. Different cortical activations during visuospatial attention and the intention to perform a saccade. Exp Brain Res. 2007;182:333–341. doi: 10.1007/s00221-007-0995-z. [DOI] [PubMed] [Google Scholar]
- Lachaux JP, Hoffmann D, Minotti L, Berthoz A, Kahane P. Intracerebral dynamics of saccade generation in the human frontal eye field and supplementary eye field. Neuroimage. 2006;30:1302–1312. doi: 10.1016/j.neuroimage.2005.11.023. [DOI] [PubMed] [Google Scholar]
- Liljeström M, Kujala J, Jensen O, Salmelin R. Neuromagnetic localization of rhythmic activity in the human brain: a comparison of three methods. Neuroimage. 2005;25:734–745. doi: 10.1016/j.neuroimage.2004.11.034. [DOI] [PubMed] [Google Scholar]
- Logothetis NK, Pauls J, Augath M, Trinath T, Oeltermann A. Neurophysiological investigation of the basis of the fMRI signal. Nature. 2001;412:150–157. doi: 10.1038/35084005. [DOI] [PubMed] [Google Scholar]
- Maris E, Oostenveld R. Nonparametric statistical testing of EEG- and MEG-data. J Neurosci Methods. 2007;164:177–190. doi: 10.1016/j.jneumeth.2007.03.024. [DOI] [PubMed] [Google Scholar]
- Medendorp WP, Goltz HC, Vilis T, Crawford JD. Gaze-centered updating of visual space in human parietal cortex. J Neurosci. 2003;23:6209–6214. doi: 10.1523/JNEUROSCI.23-15-06209.2003. [DOI] [PMC free article] [PubMed] [Google Scholar]
- Medendorp WP, Goltz HC, Vilis T. Remapping the remembered target location for anti-saccades in human posterior parietal cortex. J Neurophysiol. 2005;94:734–740. doi: 10.1152/jn.01331.2004. [DOI] [PubMed] [Google Scholar]
- Medendorp WP, Goltz HC, Vilis T. Directional selectivity of BOLD activity in human posterior parietal cortex for memory-guided double-step saccades. J Neurophysiol. 2006;95:1645–1655. doi: 10.1152/jn.00905.2005. [DOI] [PubMed] [Google Scholar]
- Medendorp WP, Kramer GFI, Jensen O, Oostenveld R, Schoffelen JM, Fries P. Oscillatory activity in human parietal and occipital cortex shows hemispheric lateralization and memory effects in a delayed double-step saccade task. Cereb Cortex. 2007;17:2364–2374. doi: 10.1093/cercor/bhl145. [DOI] [PubMed] [Google Scholar]
- Miller LM, Sun FT, Curtis CE, D'Esposito M. Functional interactions between oculomotor regions during prosaccades and antisaccades. Hum Brain Mapp. 2005;26:119–127. doi: 10.1002/hbm.20146. [DOI] [PMC free article] [PubMed] [Google Scholar]
- Moon SY, Barton JJ, Mikulski S, Polli FE, Cain MS, Vangel M, Hämäläinen MS, Manoach DS. Where left becomes right: a magnetoencephalographic study of sensorimotor transformation for antisaccades. Neuroimage. 2007;36:1313–1323. doi: 10.1016/j.neuroimage.2007.04.040. [DOI] [PMC free article] [PubMed] [Google Scholar]
- Munoz DP, Everling S. Look away: the anti-saccade task and the voluntary control of eye movement. Nat Rev Neurosci. 2004;5:218–228. doi: 10.1038/nrn1345. [DOI] [PubMed] [Google Scholar]
- Nichols TE, Holmes AP. Nonparametric permutation tests for functional neuroimaging: a primer with examples. Hum Brain Mapp. 2002;15:1–25. doi: 10.1002/hbm.1058. [DOI] [PMC free article] [PubMed] [Google Scholar]
- Niessing J, Ebisch B, Schmidt KE, Niessing M, Singer W, Galuske RA. Hemodynamic signals correlate tightly with synchronized gamma oscillations. Science. 2005;309:948–951. doi: 10.1126/science.1110948. [DOI] [PubMed] [Google Scholar]
- Nolte G. The magnetic lead field theorem in the quasi-static approximation and its use for magnetoencephalography forward calculation in realistic volume conductors. Phys Med Biol. 2003;48:3637–3652. doi: 10.1088/0031-9155/48/22/002. [DOI] [PubMed] [Google Scholar]
- Okada YC, Salenius S. Roles of attention, memory and motor preparation in modulating human brain activity in a spatial working memory task. Cereb Cortex. 1998;8:80–96. doi: 10.1093/cercor/8.1.80. [DOI] [PubMed] [Google Scholar]
- Palva S, Palva JM. New vistas for alpha-frequency band oscillations. Trends Neurosci. 2007;30:150–158. doi: 10.1016/j.tins.2007.02.001. [DOI] [PubMed] [Google Scholar]
- Percival DB, Walden AT. Cambridge, UK: Cambridge UP; 1993. Spectral analysis for physical applications: multitaper and conventional univariate techniques. [Google Scholar]
- Pesaran B, Pezaris JS, Sahani M, Mitra PP, Andersen RA. Temporal structure in neuronal activity during working memory in macaque parietal cortex. Nat Neurosci. 2002;5:805–811. doi: 10.1038/nn890. [DOI] [PubMed] [Google Scholar]
- Platt ML, Glimcher PW. Responses of intraparietal neurons to saccadic targets and visual distractors. J Neurophysiol. 1997;78:1574–1589. doi: 10.1152/jn.1997.78.3.1574. [DOI] [PubMed] [Google Scholar]
- Rizzolatti G, Riggio L, Dascola I, Umiltá C. Reorienting attention across the horizontal and vertical meridians: evidence in favor of a premotor theory of attention. Neuropsychologia. 1987;25:31–40. doi: 10.1016/0028-3932(87)90041-8. [DOI] [PubMed] [Google Scholar]
- Sauseng P, Klimesch W, Stadler W, Schabus M, Doppelmayr M, Hanslmayr S, Gruber WR, Birbaumer N. A shift of visual spatial attention is selectively associated with human EEG alpha activity. Eur J Neurosci. 2005;22:2917–2926. doi: 10.1111/j.1460-9568.2005.04482.x. [DOI] [PubMed] [Google Scholar]
- Schluppeck D, Glimcher P, Heeger DJ. Topographic organization for delayed saccades in human posterior parietal cortex. J Neurophysiol. 2005;94:1372–1384. doi: 10.1152/jn.01290.2004. [DOI] [PMC free article] [PubMed] [Google Scholar]
- Sereno MI, Pitzalis S, Martinez A. Mapping of contralateral space in retinotopic coordinates by a parietal cortical area in humans. Science. 2001;294:1350–1354. doi: 10.1126/science.1063695. [DOI] [PubMed] [Google Scholar]
- Tallon-Baudry C, Bertrand O, Peronnet F, Pernier J. Induced gamma-band activity during the delay of a visual short-term memory task in humans. J Neurosci. 1998;18:4244–4254. doi: 10.1523/JNEUROSCI.18-11-04244.1998. [DOI] [PMC free article] [PubMed] [Google Scholar]
- Thiele A, Stoner G. Neuronal synchrony does not correlate with motion coherence in cortical area MT. Nature. 2003;421:366–370. doi: 10.1038/nature01285. [DOI] [PubMed] [Google Scholar]
- Thut G, Nietzel A, Brandt SA, Pascual-Leone A. Alpha-band electroencephalographic activity over occipital cortex indexes visuospatial attention bias and predicts visual target detection. J Neurosci. 2006;26:9494–9502. doi: 10.1523/JNEUROSCI.0875-06.2006. [DOI] [PMC free article] [PubMed] [Google Scholar]
- Tiesinga PH, Fellous JM, Salinas E, José JV, Sejnowski TJ. Inhibitory synchrony as a mechanism for attentional gain modulation. J Physiol Paris. 2004;98:296–314. doi: 10.1016/j.jphysparis.2005.09.002. [DOI] [PMC free article] [PubMed] [Google Scholar]
- Van Veen BD, van Drongelen W, Yuchtman M, Suzuki A. Localization of brain electrical activity via linearly constrained minimum variance spatial filtering. IEEE Trans Biomed Eng. 1997;44:867–880. doi: 10.1109/10.623056. [DOI] [PubMed] [Google Scholar]
- Varela F, Lachaux JP, Rodriguez E, Martinerie J. The brainweb: phase synchronization and large-scale integration. Nat Rev Neurosci. 2001;2:229–239. doi: 10.1038/35067550. [DOI] [PubMed] [Google Scholar]
- Ward LM. Synchronous neural oscillations and cognitive processes. Trends Cogn Sci. 2003;7:553–559. doi: 10.1016/j.tics.2003.10.012. [DOI] [PubMed] [Google Scholar]
- Worden MS, Foxe JJ, Wang N, Simpson GV. Anticipatory biasing of visuospatial attention indexed by retinotopically specific alpha-band electroencephalography increases over occipital cortex. J Neurosci. 2000;20(RC63):1–6. doi: 10.1523/JNEUROSCI.20-06-j0002.2000. [DOI] [PMC free article] [PubMed] [Google Scholar]
- Zhang M, Barash S. Neuronal switching of sensorimotor transformations for antisaccades. Nature. 2000;408:971–975. doi: 10.1038/35050097. [DOI] [PubMed] [Google Scholar]
- Zhang M, Barash S. Persistent LIP activity in memory antisaccades: working memory for a sensorimotor transformation. J Neurophysiol. 2004;91:1424–1441. doi: 10.1152/jn.00504.2003. [DOI] [PubMed] [Google Scholar]